Article

Coordinated Development of Urban Agglomeration in Central Shanxi

College of Geographic Science, Shanxi Normal University, Taiyuan 030031, China
*
Author to whom correspondence should be addressed.
Sustainability 2022, 14(16), 9924; https://doi.org/10.3390/su14169924
Submission received: 28 June 2022 / Revised: 3 August 2022 / Accepted: 8 August 2022 / Published: 11 August 2022
(This article belongs to the Special Issue Urban Planning and Economic Development)

Abstract

:
Central Shanxi is one of the nine urban agglomerations proposed in China’s latest national planning, which has great development potential and represents a major opportunity for Shanxi Province to rise in central China. How to determine the existing problems and promote better-coordinated development is the goal of this article. Therefore, an improved gravity model, industrial structure similarity coefficient and population–economic growth elasticity method were used to analyze and study the coordinated development of urban agglomerations in central Shanxi from the perspectives of economy, industry and population–economy. The research conclusion is that there are three problems: a low level of coordinated economic development, strong dependence on coal resources, and uncoordinated population development and economic growth. Therefore, this paper discusses and puts forward the main strategies for the government to strengthen economic planning, improve the level of economic development, optimize and upgrade the industrial structure, end dependence on coal resources and strengthen regional ties, and improve the level of population and economy coordination so that the urban agglomeration in central Shanxi becomes the growth pole and important support point of regional economic and social development.

1. Introduction

An urban agglomeration is a relatively complete urban area with a considerable number of cities of different scales [1]. In China, urban agglomerations gradually formed as a result of social and economic development and improved urbanization, but not based on one city: This development was not based on one city but on the influence of multiple cities and larger regions. Urban agglomerations with big cities as the core have developed into new urban–regional development and spatial combination models ① (Reference Appendix A) [2]. The Chinese government has strongly supported it and together with the provinces has introduced preferential policies to promote the development of urban agglomerations. China’s latest national plan proposes to promote the integrated development of urban agglomerations, as well as optimise and enhance the level of those that are mature and developing; their distribution runs from the north to the south and, from the east through the middle to the west. The number and scale of China’s urban agglomerations are unique, and they have become the most dynamic growth point in the national development pattern [3], which comprises the national new urbanization main body area and the national development strategy core area [4].
As a new regional spatial model, urban agglomerations have a huge impact on the spatial planning of different countries and regions; the world’s largest are the Northeast United States, the Great Lakes region of North America, the Pacific Coast of Japan, Northwestern Europe and Greater London. Urban agglomerations are used to improve regional or national competitiveness [5] and are far superior to individual cities in scale, aggregate economy, population scale and industrial development [6]; they bring regional development and spatial combination patterns, attract and maintain more financial and human capital, and involve them in various competitive and interdependent activities. Innovation is proportionate to the size [7], and the rapid development of the regional space of urban agglomerations in Europe, whilst especially those centred on super cities will create considerable economic benefits and bring progress in science and technology to promote development [8].
The coordinated development of urban agglomeration will effectively promote a new model of regional development and promote integration and interaction [9]; it will also expand the scope of interaction among cities, and be conducive to resource sharing and mobility. Cross-regional unit cooperation of cities is becoming increasingly close and enhancing overall competitiveness [10,11,12]. The gravity model reflects the connection strength and spatial distribution characteristics among urban agglomerations, so it is widely used to study the coordinated development of urban agglomerations. The model is used to calculate the gravity between the core area and its surrounding grids and identify the potential maximum expansion of the urban agglomeration [13]. The gravity model is used to construct the spatial network of the urban system. Taking into account the relationship between potential and actual economic ties and the fact that there is no equivalence between the two cities, the gravity model is expressed by the GDP and population of the city [14]. Based on the social network analysis theory, the gravity model was established to analyze the characteristics of the logistics network of the Yangtze River Delta urban agglomeration [15]. Combining population density with the gravity model, improved the traditional spatial entropy model to establish the gravity spatial entropy model.
The influence of distance and spatial diffusion on urban population distribution is described [16]. Through the study of the gravity model, the geometric characteristics of the urban influence domain and the variation of the influence domain with the distance attenuation index are studied [17]. Through the gravity model, this paper quantitatively evaluates the transnational competition between major European and Asian cities from the perspective of air transport [18]. The improved gravity model was used to calculate the economic synergistic development potential of the eight cities in the Pearl River Delta urban agglomeration [19]. The gravity model was used to study the urban network, and the multi-dimensional evaluation results were used to replace the traditional single indicator of urban size such as GDP or population [20]; however, the model has some defects. The assumption of the gravity model is that the accessibility of the surrounding areas to the city is only related to distance [21], The obstacle effect of complex topography on the connection between cities is not considered. Therefore, the gravity model was improved, and the altitude difference caused by complex topography was added to the value of the friction coefficient to bring the distance parameter more in line with the actual situation and reflect the actual connection of urban agglomerations more accurately.
The reason for this study is that as a developing urban agglomeration in central Shanxi, there are few studies on it in China or the world. Shanxi Province has the most abundant coal resources, and each city has a wide range of coal distribution, which has gradually developed into coal resource-based cities, and the coal industry has become a pillar industry; however, with the depletion of coal, Shanxi’s urban development is restricted. Now with the national planning of urban agglomeration development goals, it is possible to find a way out of coal dependence, revitalize the cities and provide a case for the transformation and development of a resource-based urban agglomeration. Therefore, it has extensive academic research value, which also has great development potential and represents a major opportunity for Shanxi Province to rise in central China. How to determine the existing problems and promote its better-coordinated development is the goal of this study.
After the introduction, this paper is divided into five parts. The first is an overview of the study area, detailing the scope of the Shanxi urban agglomeration and its natural, economic and social conditions; the second is the research method, which mainly introduces the methods of economy, industry and population and economy. The third is the results, the main content of which is the use of appropriate research methods of an urban agglomeration economy, industry and population and economy; the fourth is the analysis and discussion, summarizing the existing problems and corresponding strategies; the fifth part is the conclusion.

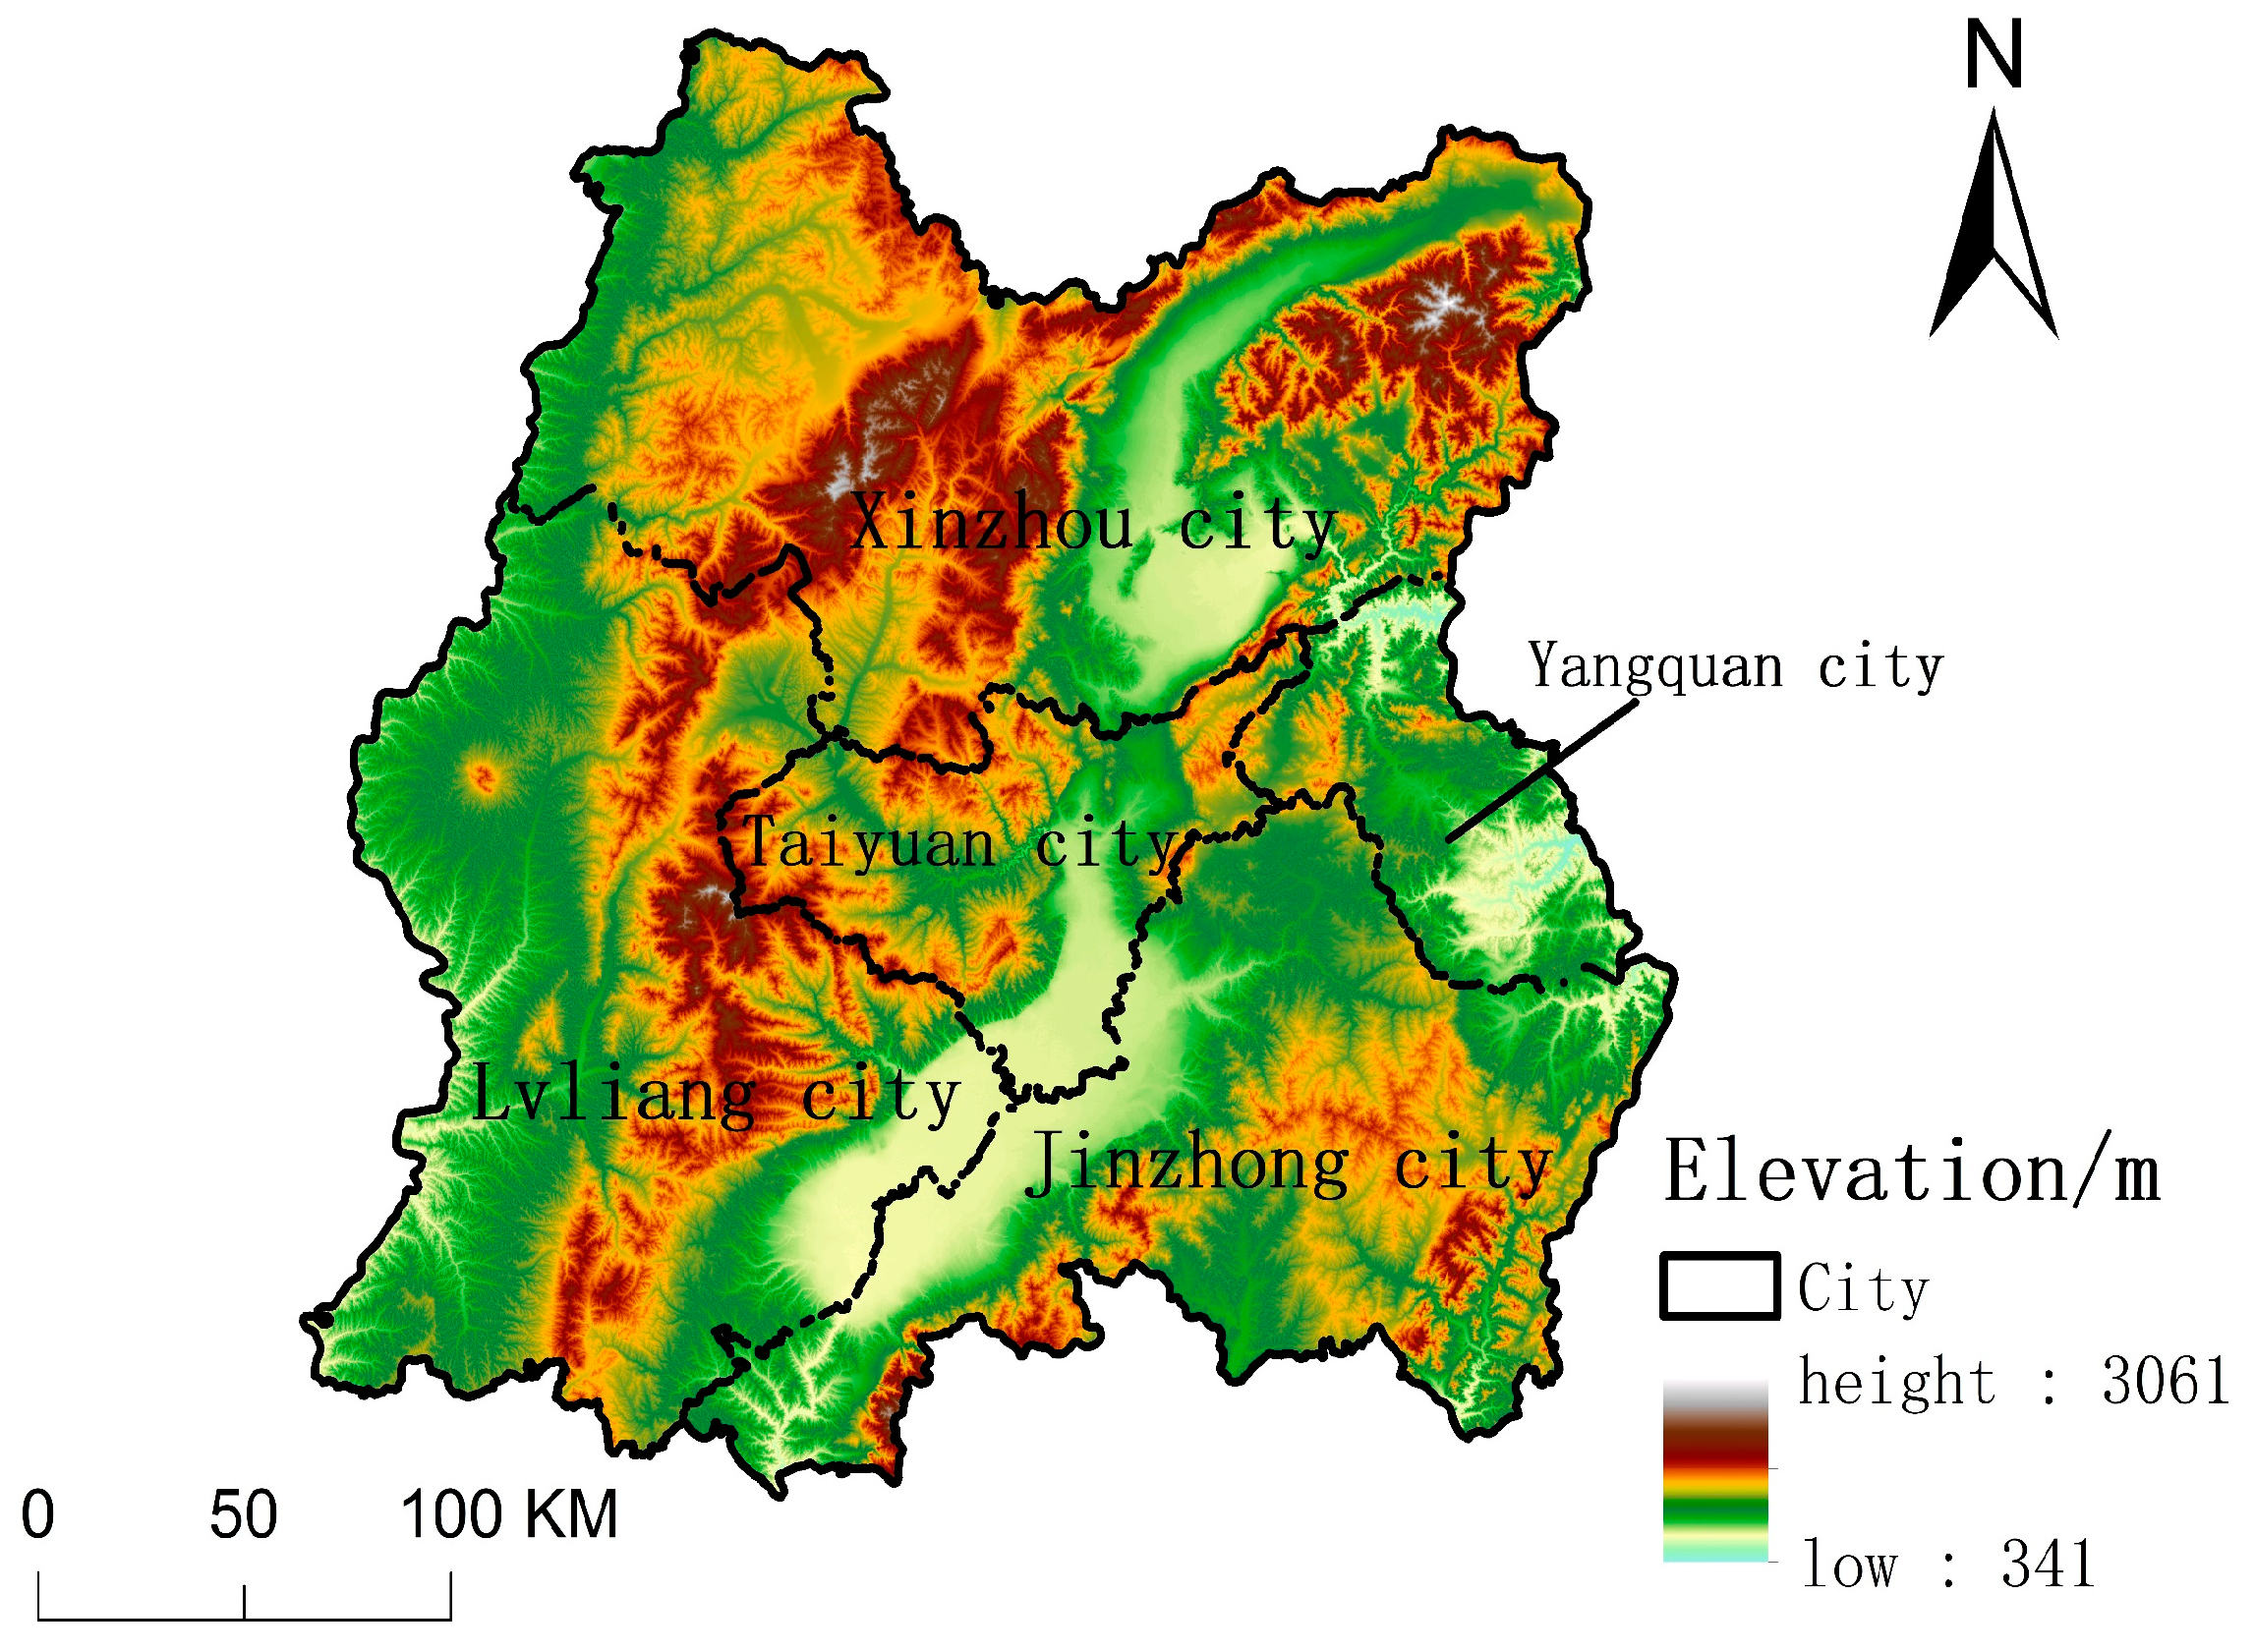
2. Overview of the Study Area

The central part of Shanxi Province is located in the Fenhe Valley and Taiyuan Basin. The Taihang and Lüliang Mountains lie to the east and west, and the climate is temperate continental monsoon with four distinct seasons and synchronous rain and heat. The urban aggolomerations are Taiyuan, Jinzhong, Xinzhou, Yangquan and Lüliang (Figure 1). There are 53 districts and counties under the jurisdiction of the five cities, accounting for 45.30% of the districts and counties in Shanxi Province; the area is 74,097 square kilometres, accounting for 47.29% of the total area; the population is 16.09 million, accounting for 46.11% of the province; the GDP is CNY 89.36 billion, accounting for 50.45% of Shanxi’s GDP. Overall strength is strong, with the basis and space for coordinated development; it is one of the nine urban agglomerations proposed in the 14th Five-Year Plan ② (Reference Appendix A); it is a major opportunity for Shanxi Province to rise in the central region ③ (Reference Appendix A) and highlight its position in the nation.

3. Research Method

Theoretical framework: This paper takes the urban agglomeration in central Shanxi as the research object. The improved gravity model, the similarity coefficient of industrial structure and the population–economic growth elasticity method were used to analyze and study the economy, industry and the relationship between the population and economy. After the three aspects of the research results were analyzed, the corresponding solution strategy to the existing problems was put forward; and es the research results were summarized based on the literature, the limitations of the study and the prospects of future work.
Data sources: Statistical Yearbook of Shanxi Province, Statistical Bulletin and Statistical Yearbook of cities in urban agglomeration from 2010 to 2020. The improved gravity model, industrial structure similarity coefficient and population–economic growth elasticity methods were used to study three aspects of economy, industry and population. The gravity model reflects the economic connection intensity of urban agglomerations; the similarity coefficient of the industrial structure reflects the industrial development of urban agglomerations, and the population–economic growth elasticity reflects the degree of coordination between the population and economic development in urban agglomerations.

3.1. Modified Gravity Model

The gravity model is widely used in researching the distance attenuation effect and spatial interaction to depict the intensity of an economic connection, which is an indicator that measures the degree of regional economic connection [22]; it not only reflects the radiation diffusion and polarization ability of economic centres to surrounding areas but also reflects the acceptance of surrounding areas to the radiation potential of economic centres. The revised formula is as follows:
F i j = K M i M j D i j r
where Fij is the intensity of economic ties between cities; K is the gravitational coefficient, representing the attraction between the two cities, and the formula is K i = M i ( M i + M j ) where Ki is the ratio of the comprehensive strength of city i to the sum of the comprehensive strength of city i and city j, representing the direction of economic connection between city i and city j; Mi and Mj are the economic quality of city i and city j, respectively, focusing on the interaction of internal space of urban agglomerations with economic development as the main driving force. Urban economic quality is an index to measure the spatial differentiation characteristics of urban agglomerations′ economic development level by using a model to measure the economic development differences of a country or city. Population, as a producer of economic factors, can create economic benefits, to some extent: the larger the population, the greater the benefits. The GDP is the most direct indicator of the level of regional economic development. The output value of the tertiary industry represents the overall level of urban economic development and is the main driving force for economic growth; the total import and export represents the economic ties between the city and the outside world; per capita disposable income represents the economic consumption level of urban residents. Therefore, the city population, GDP, output value of the tertiary industry, total import and export and per capita disposable income are selected as indicators to measure the quality of an urban economy to study the spatial differentiation characteristics of economic development of urban agglomerations. The economic quality of a city is calculated by the geometric average of the population, GDP, the output value of the tertiary industry, total import and export and per capita disposable income in a year; Dij is the traffic distance between city i and city j, and the sum of highway mileage between cities is used; r is friction coefficient, which in the past ignored the influence of complex topography. The more complex the terrain, the more numerous the obstacles, and the elevation difference has a negative effect on urban connections. Therefore, the gravity model was improved, and the altitude difference caused by complex topography was added to the friction coefficient.
Since the central Shanxi urban agglomeration is located in the Fenhe Valley and Taiyuan Basin, Taihang Mountains and Lüliang Mountains are on the east and west sides, on the second step ④ (Reference Appendix A) of elevation (1000–2000 m). The high altitude and the complex, mainly mountainous terrain, affects the traffic flow, making the connection between cities lower than the connection between cities in plain areas. The average altitude of each city is above 1000 m. Experts have proved that with the increase in altitude, the air pressure gradually decreases, and the air density gradually decreases, resulting in a decrease in engine inflation and a decrease in power performance. As altitude increases by 1000 m, atmospheric pressure decreases by about 11.5%, air density decreases by about 9% and power decreases by about 10%. Elevated altitudes and mountain obstacles increase vehicle energy consumption, affecting traffic links between cities. For every 1000 m of increased elevation, engine power decreased by 10.36% [23]. Therefore, the elevation difference within 100 m is set as the initial value 1. For every 100 m elevation increase, the r-value increases by 0.1 according to the engine power drop ratio.

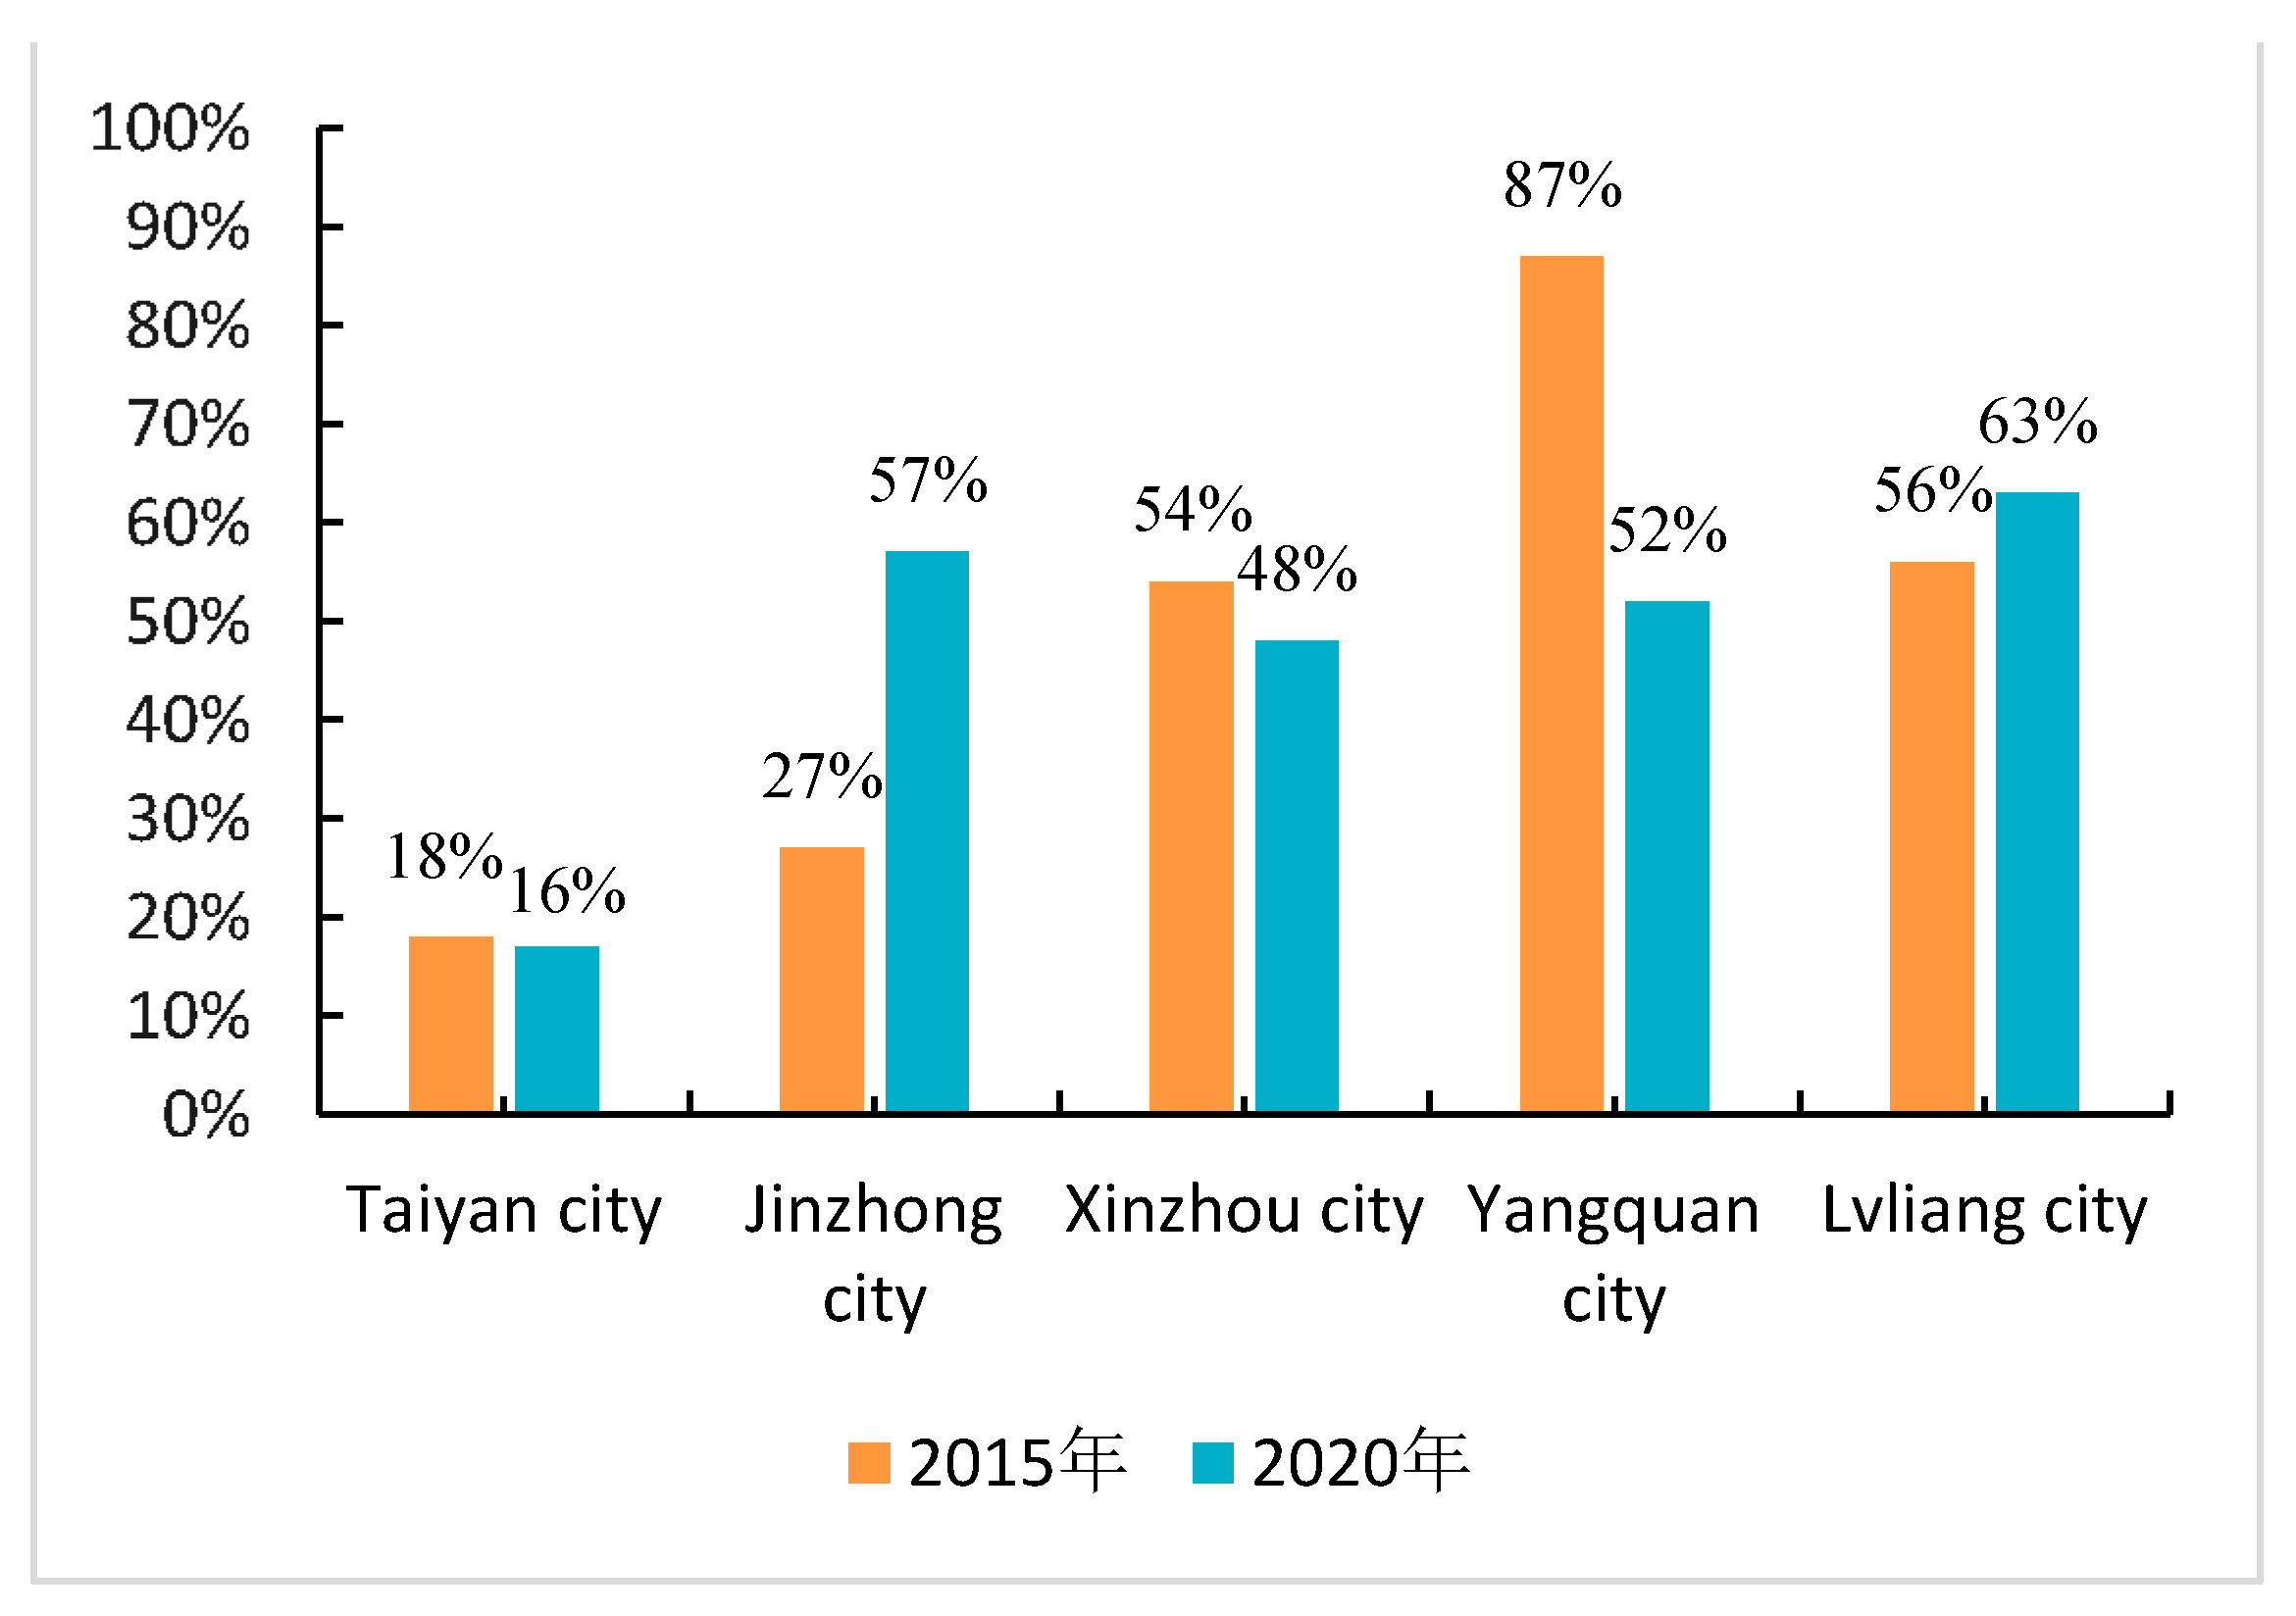
3.2. Industrial Structure Similarity Coefficient

An analysis of industrial structure convergence in different regions can directly reflect its relationship to the division of labour [24]. The similarity coefficient is used to represent the degree of industrial structure convergence and division of labour in cities of an urban agglomeration. The formula is as follows:
S i j = k = 1 n X i k X j k k = 1 n X i k 2 X j k 2
where Sij denotes the similarity coefficient of industrial structure in i and j regions; Xik and Xjk denote, respectively, the proportion of economic benefits of k industries in i and j regions in total industrial economic benefits, and the number of industries is n. The value range of the industrial structure similarity coefficient is (0, 1). When Sij = 1, the industrial structure between the two regions is identical; when Sij = 0, the industrial structure between the two regions is completely different; when Sij is closer to 1, the industrial structure difference between the two regions is smaller; the industrial structure similarity between regions is extremely high; regional complementarity is poor, and the division of labour and cooperation is poor. When Sij is closer to 0, the difference in industrial structure between the two regions is larger; the degree of isomorphism is lower, and the level of regional cooperation is higher [25].

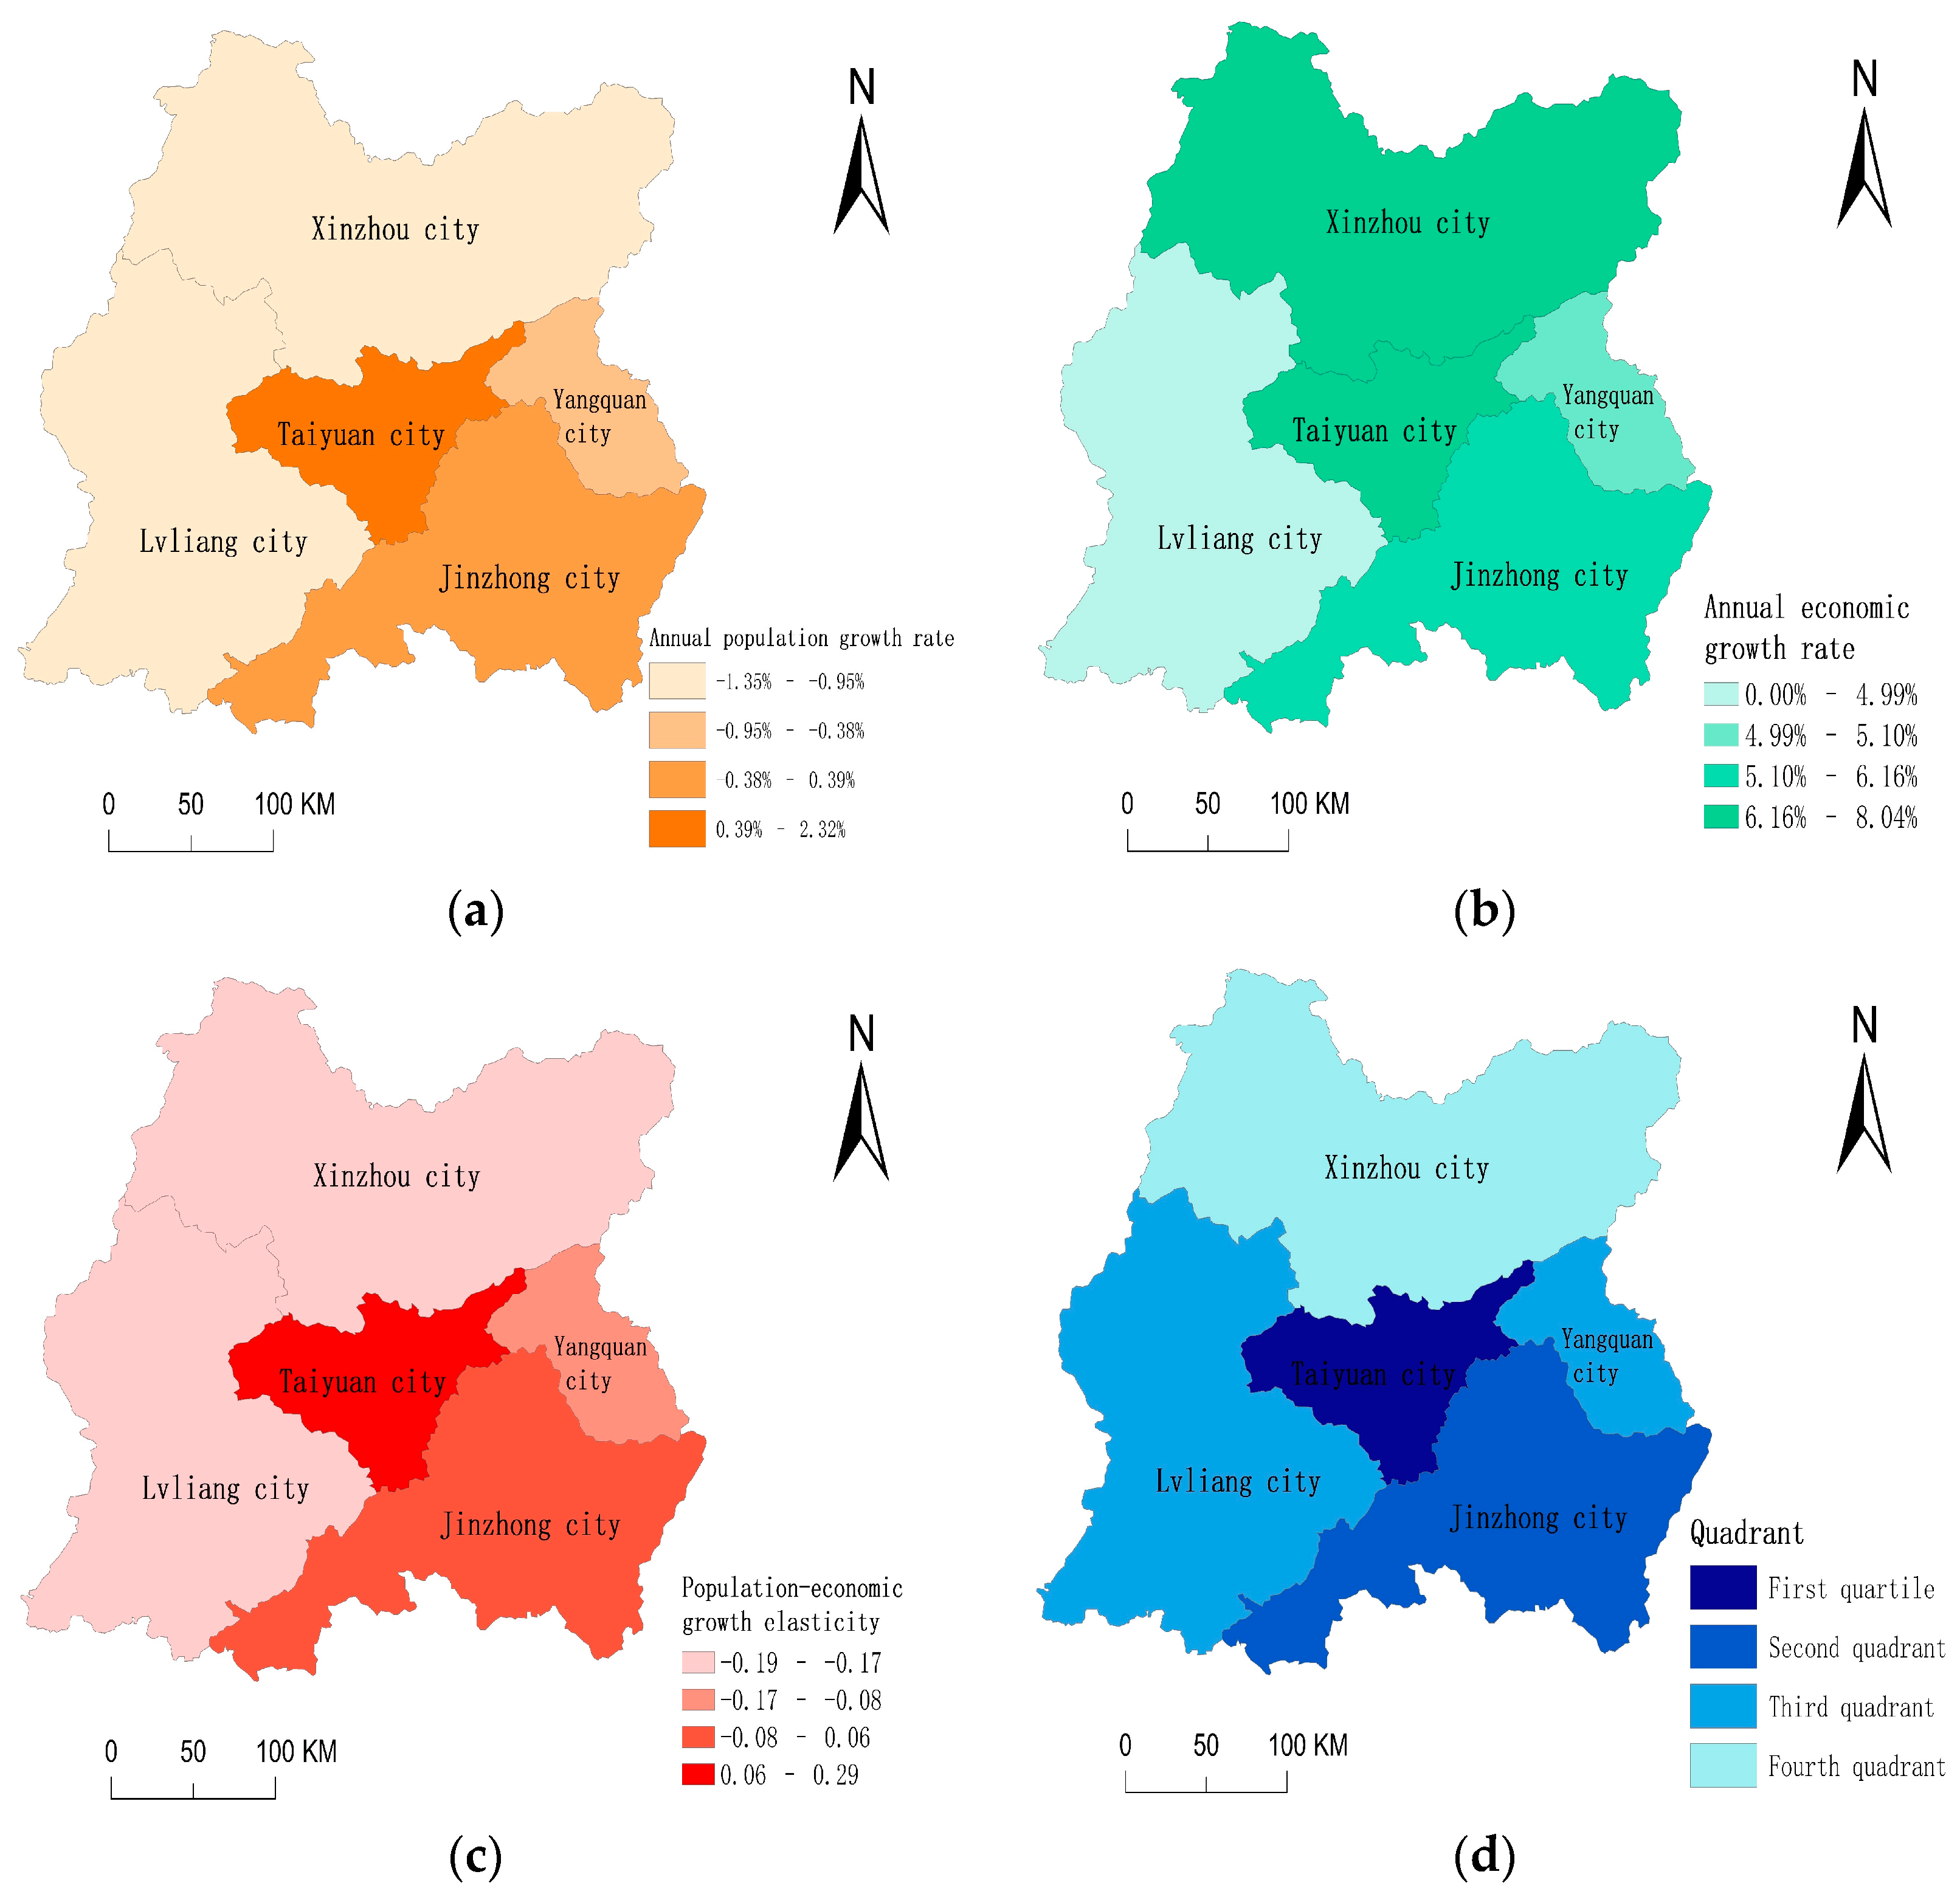
3.3. Population–Economic Growth Elasticity

This refers to the ratio of the population growth of a certain region in a certain period to the economic growth rate of the same period. A change in population per every 1 % of regional economic growth reflects the degree of influence of regional economic growth [26]. The formula is as follows:
E i = Δ p o p / p o p Δ G D P / G D P
where Ei is the population–economic growth elasticity of i region; Δpop is the population range of i region in a certain period; pop is the total population of the region; Δpop/pop is the population growth rate of i region; ΔGDP is the GDP change of i region in a certain period, GDP is the regional GDP; ΔGDP/GDP is the economic growth rate of i region. The larger the Ei value, the greater the pulling effect of economic growth on population growth [27].

4. Research Results

4.1. Level of Coordinated Economic Development

Internal and external analyses were conducted to analyze spatial differentiation characteristics. Internal analysis used data from 2010, 2015 and 2020 to analyze the development of urban economic quality and economic connection intensity within the urban agglomeration. External analysis used the most mature agglomeration in northern China for comparison––Beijing–Tianjin–Hebei urban agglomeration for comparison. On the one hand, the Beijing–Tianjin–Hebei, First, it has a high reference value for its development scale and level. Second, one of the development goals of the urban agglomeration in central Shanxi is coordinated development with Beijing–Tianjin–Hebei. Therefore, it was selected as the comparison object, and targeted measures were adopted to gradually narrow the developmental gap, and strengthen ties with the Beijing–Tianjin–Hebei region. Therefore, the data of 2020 were selected to analyze the gap between the central Shanxi and the Beijing–Tianjin–Hebei urban agglomerations in urban economic quality and economic connection intensity.

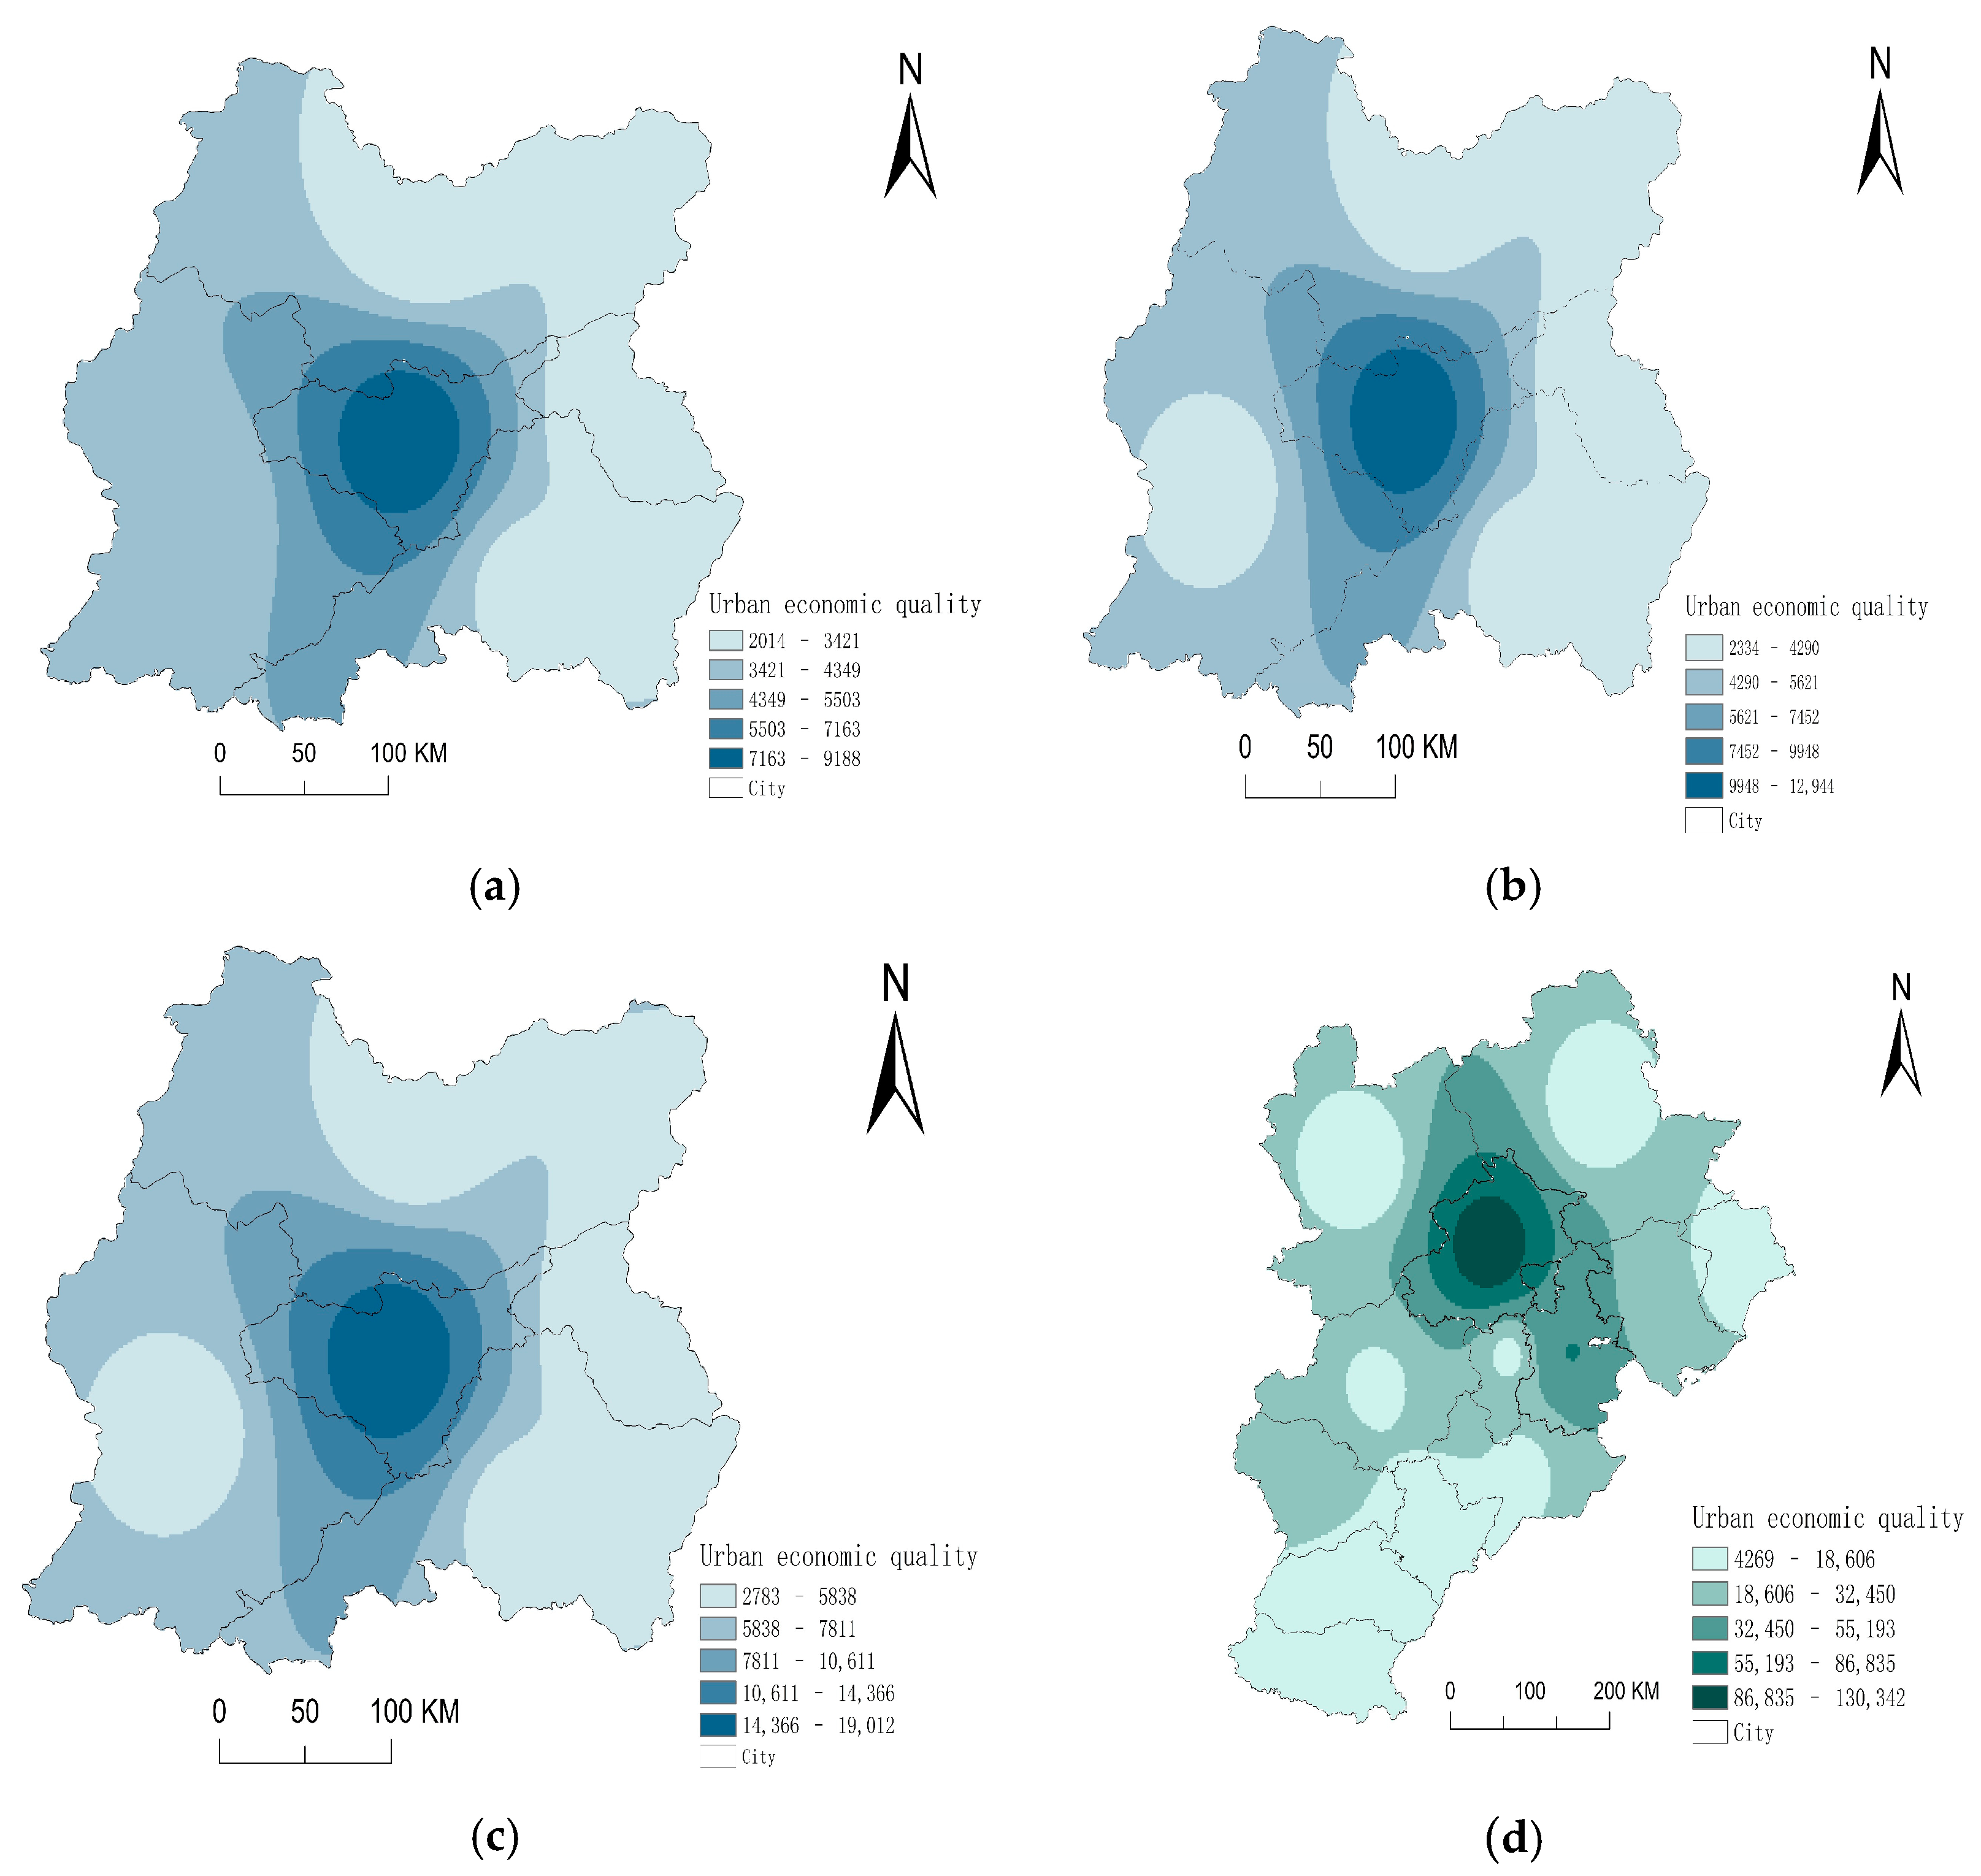
4.1.1. Urban Economic Quality

Urban economic quality is an index to measure the spatial differentiation characteristics of urban agglomerations’ economic development level by using a model to measure the economic development differences of a country or city. The geometric mean of the urban population, GDP, the output value of the tertiary industry, total import and export and per capita disposable income is selected to define the urban economic quality, which is used to study the spatial differentiation characteristics of urban agglomeration economic development.
The data is based on the calculation of the geometric average population, GDP, the output value of the tertiary industry, total import and export and per capita disposable income of an urban agglomeration in 2010, 2015 and 2020, and the interpolation analysis was carried out using the ArcGIS software to draw an urban economic quality effect map (Figure 2).
The internal analysis shows that the urban quality of the urban agglomerations in the central part of Shanxi is regionally unbalanced, and it is weak from the central region to the surrounding areas. The quality of the city is gradually improved, and the economic strength is gradually enhanced. Taiyuan, with its good geographical and political location, has become the core of the urban agglomeration, with the highest urban quality, strong urban economic strength, large urban influence range, and great radiation effect on Jinzhong City and Lüliang City. Jinzhong City, Lüliang City has also been rapid development, urban quality improved steadily, formed the economic radiation area and resource concentration, and become the secondary economic development centre of urban agglomeration; however, due to the influence of the Luliang Mountains, the economic development in the western region of Lüliang City has slowed down; Xinzhou is in the eastern part of the Loess Plateau, surrounded by mountains in the east and hills in the west, which has hindered the city’s development. The growth of urban quality is small and the economic strength is weak. Yangquan City has become the economic lowland of urban agglomeration due to its small geographical scope, urban economic aggregate and total population, which affects the competitiveness improvement and economic integration development of urban agglomeration.
The external analysis shows that the urban economic quality of the highest region of the central Shanxi urban agglomeration is only one of the lowest regions of the Beijing–Tianjin–Hebei urban agglomeration (Table 1); its overall strength is huge––CNY 865.21 billion––Which is 9.68 times larger than that of the central Shanxi urban agglomeration (CNY 89.37 billion). The population of the Beijing–Tianjin–Hebei urban agglomeration (1.137 million) is 6.86 times that of the central Shanxi urban agglomeration (1.69 million people). In addition, the tertiary industry output value, total import and export volume and per capita disposable income of Beijing-Tianjin-Hebei urban agglomeration are 12.22 times, 23.23 times and 3.23 times of those of central Shanxi urban agglomeration. There is a large gap in strength and scale. As cultivated and developed in the 14th Five-Year Plan, the central urban agglomeration in Shanxi Province aims at developing mature urban agglomerations, deal with the problems existing in its own development, increase the economic ties and cooperation within the urban agglomerations, reasonably expands the urban scale and effectively improves urban strength.

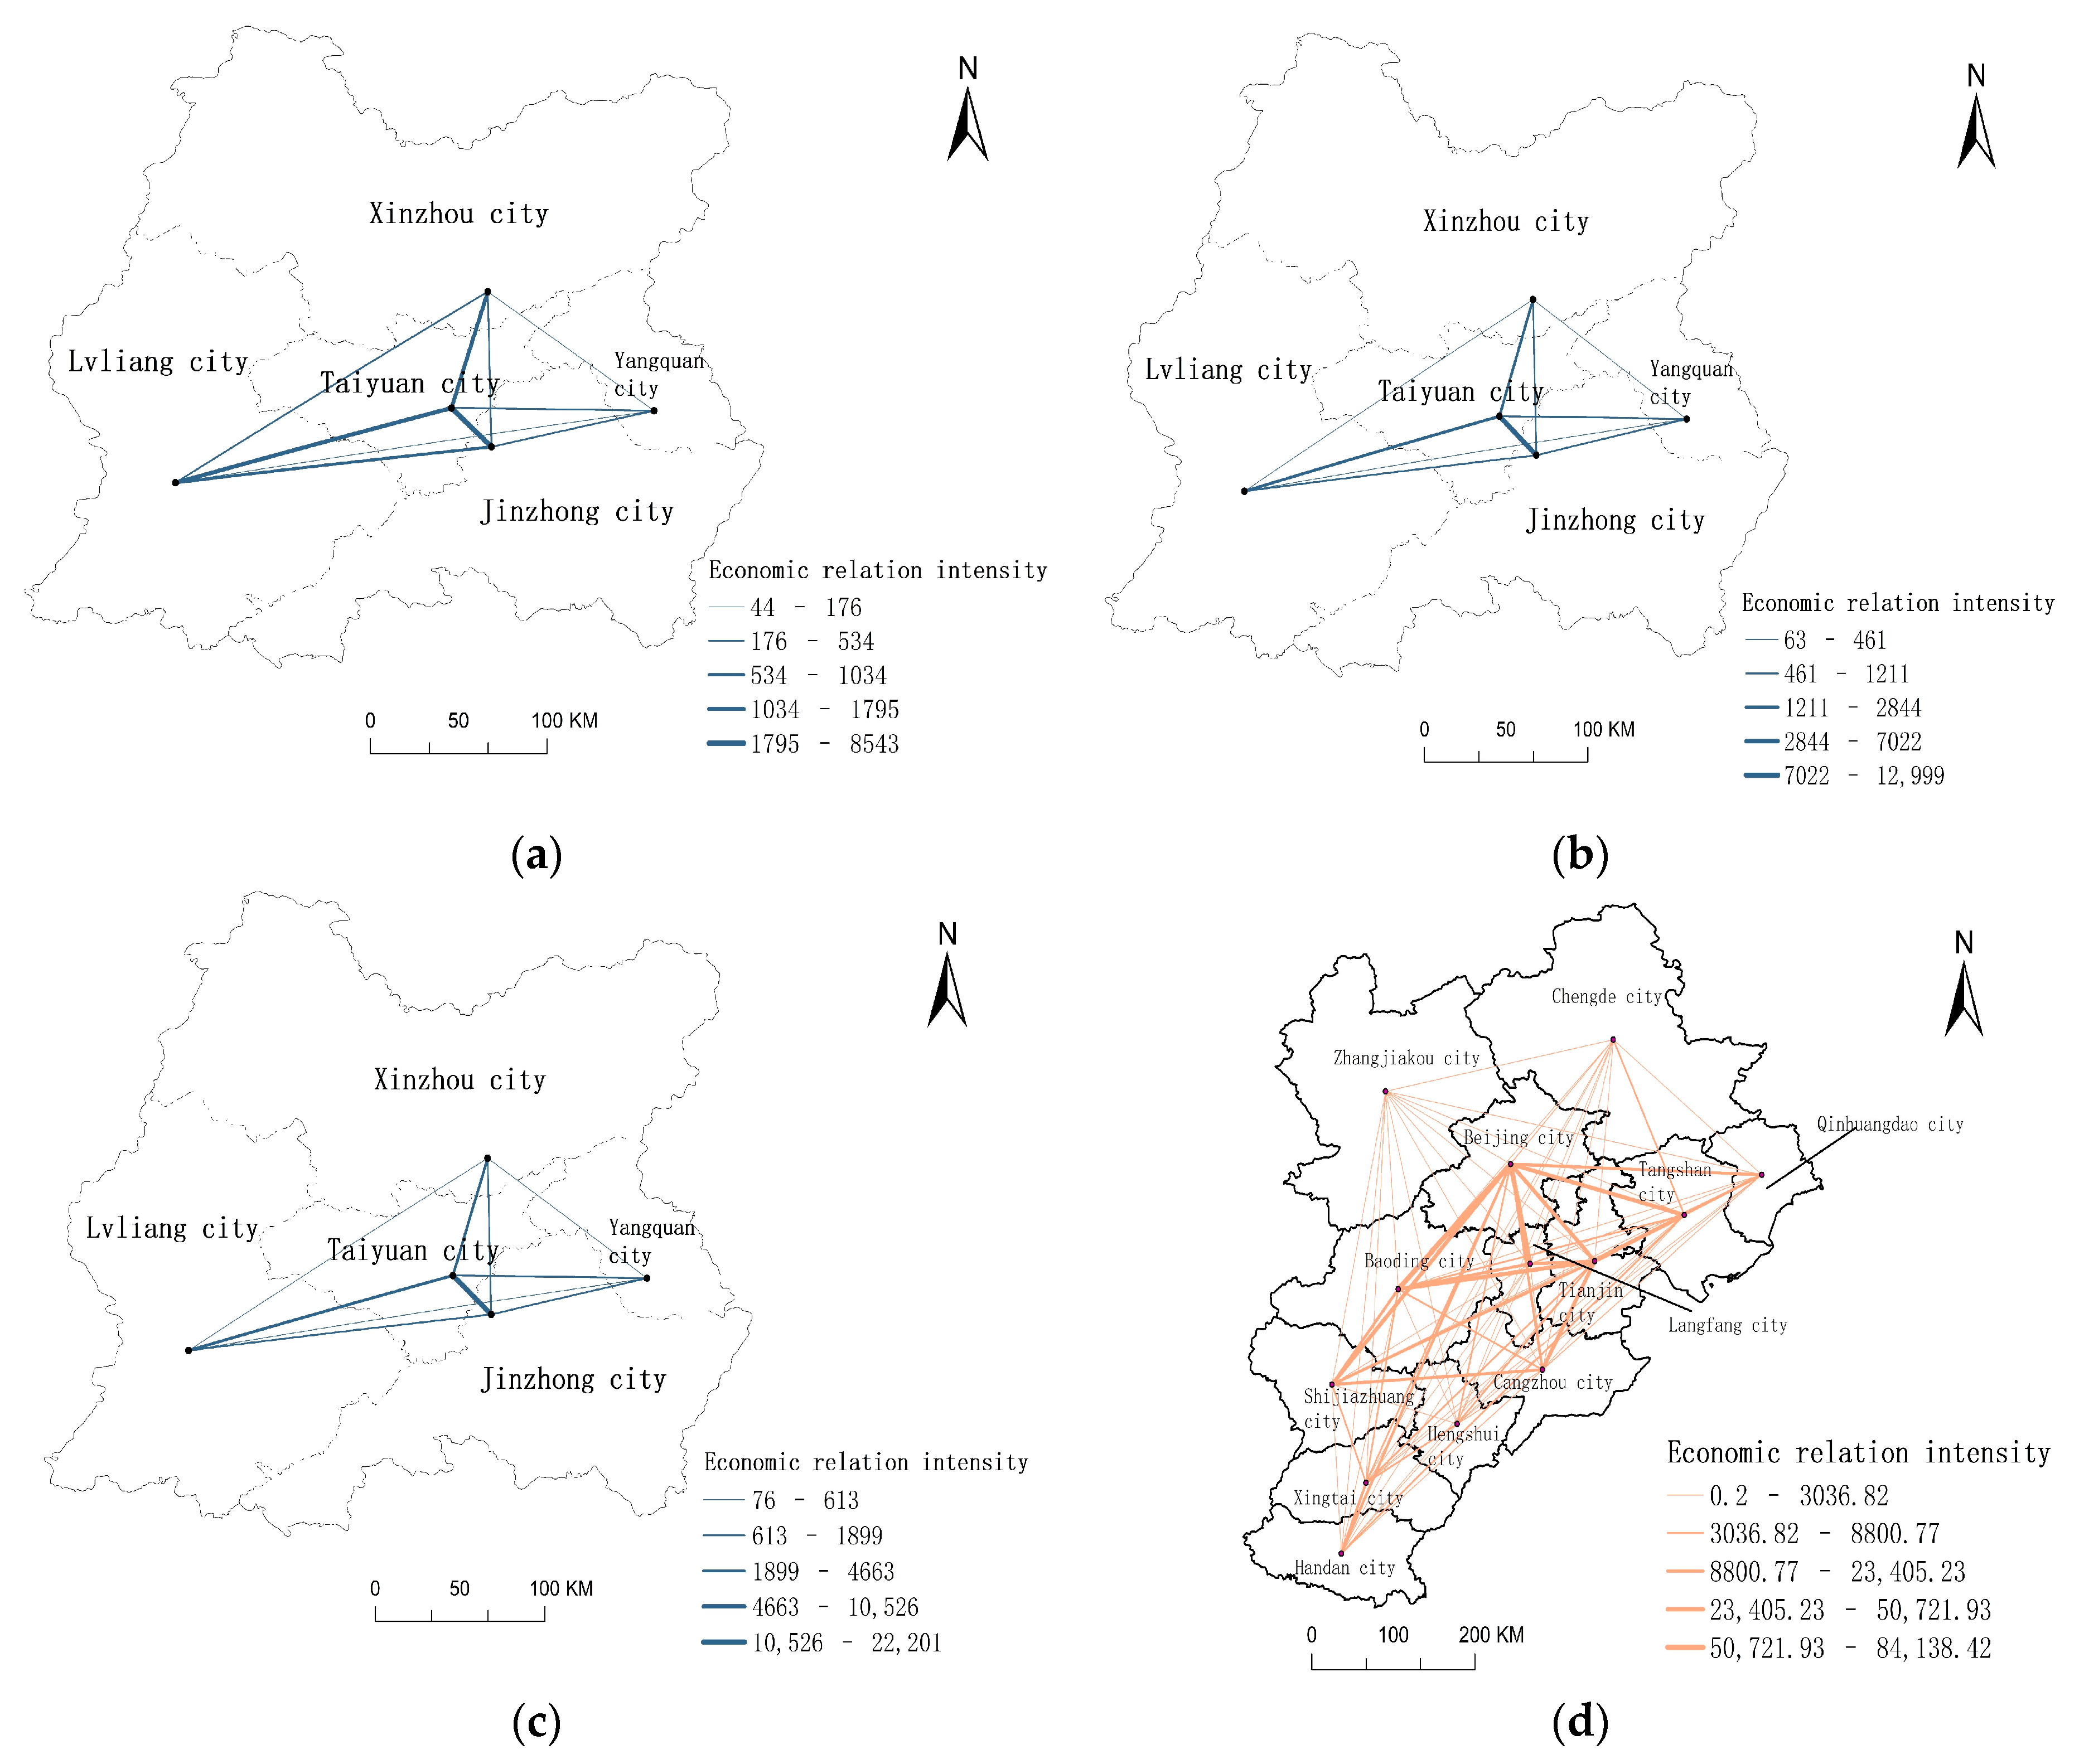
4.1.2. Strength Analysis of Economic Linkages

The intensity of economic ties is used to measure the economic capacity of a city in a region to influence other cities, reflecting the city’s position in the urban spatial interaction network. Based on the improved gravity model, this paper measures the economic connection strength of the urban agglomeration in central Shanxi in 2010, 2015 and 2020, and uses ArcGIS software to divide the connection strength into five grades by the natural discontinuity classification method (Figure 3) for visual expression analysis.
The internal analysis shows that, through the modified gravity model, the data from 2010, 2015 and 2020 show that the intensity of economic ties of urban agglomerations in central Shanxi is gradually increasing, but the overall level is low, showing a single core and single centre development trend, which limits the flow of economic ties and resource elements between urban agglomerations. Therefore, it is necessary to speed up the construction and sharing of infrastructure between cities, so as to promote the flow and agglomeration of economic resources in urban agglomerations and give full play to the radiation and driving effect of Taiyuan on other cities.
Taiyuan city reflects the core of urban agglomeration and its role as the provincial capital; it has the advantages of economic, political, policy and cultural leadership, showing it to be the growth pole of regional economic development. The intensity of economic ties with Jinzhong City is the strongest and is the driving force for the economic development of urban agglomeration. The reason is that the geographical distance between the two cities is small; the terrain is relatively flat; traffic is fluid; cooperation between government and enterprises is stronger, and the population flow is frequent. Therefore, it has the highest intensity of economic ties, and the economic coordination and cooperation between cities are better, which lays an economic foundation for the integration of Taiyuan. Jinzhong in addition to the economic ties with Taiyuan has good strength, while for the cities of Xinzhou, Yangquan and Lüliang, economic ties become weaker with increasing distance, proving the importance of traffic distance for economic ties between cities; Xinzhou and Taiyuan constitute the second level of economic ties, but due to the Taihang and Lüliang Mountains, traffic accessibility is low, creating poor economic ties between Xinzhou and Jinzhong and Yangquan and Lüliang.
Lüliang and Taiyuan constitute the third level of economic ties. There is greater economic cooperation with Taiyuan, but because of the Lüliang Mountains, contact with the other three cities is more problematic, and with increasing distance, the intensity of economic ties will decrease. The economic connection intensity between Yangquan and Jinzhong is the largest, but since the population and aggregate economy of Yangquan are the lowest in the urban agglomeration, the corresponding economic connection intensity with other cities is far lower.
External analysis showed a huge gap between the Beijing–Tianjin–Hebei urban agglomeration and economic ties. In 2020, the highest intensity of economic ties in the central urban agglomeration of Shanxi is Taiyuan and Jinzhong, reaching 22,201.00, but only 11 in the Beijing–Tianjin–Hebei urban agglomeration. Following the intensity of economic ties between Beijing and Tangshan (23,353.86), the largest intensity of economic ties in the Beijing–Tianjin–Hebei urban agglomeration is between Beijing and Baoding (84,138.42), which is 3.79 times greater than the strongest economic ties in the central urban agglomeration of Shanxi. The reason is that the agglomeration includes the capital, Beijing, Tianjin municipality and Hebei Province, which has been a densely populated area since ancient times. Beijing is the economic centre of northern China, with a strong economy and more supportive economic policies, which makes the population and aggregate economy huge. In addition, it is located on the North China Plain––low terrain, small altitude differences and accessible transportation, which makes connections between cities more convenient. The emerging central Shanxi urban agglomeration has a small scale, inadequate economic policies and environment, and there is still a net population outflow. Together with the obstacles of mountains and hills and inadequate transportation a huge gap exists in intercity economic links and with the Beijing–Tianjin–Hebei urban agglomeration.

4.2. Industrial Coordinated Development Level

Shanxi Province, as a major coal-producing province, has an industrial structure mainly based on coal resources, forming an industrial structure dominated by energy raw materials and highly dependent on coal. The total industrial economic benefits of coal in the mining and manufacturing industries of each city in 2015 and 2020 are selected to calculate the similarity coefficient of industrial structure (Table 2 and Table 3). The coordination of industrial structure changes in the past five years is analyzed, and the energy supply support ability and industrial structure optimization and upgrading are continuously improved [28].
In the past five years, the similarity coefficient of industrial structure among cities in the central Shanxi urban agglomeration has been improved to varying degrees, indicating that the coal-related industries in the industrial structure of each city are still important and the industrial layout and construction show a certain convergence, which affects the development of industrial coordination and cooperation among cities.
Among them, the similarity coefficient of Taiyuan increased in five years, but the overall value was the lowest, indicating that the industrial structure was quite different from the other four cities. Instead, according to urban planning, high-tech industries and emerging industries were developed to diversify the industrial structure and promote the optimization and upgrading of the industrial structure. The proportion of economic benefits generated by coal-related industries in industrial economic benefits is reduced from 0.18 to 0.16 (Figure 4). The industrial structure is gradually transformed and the dependence on coal resources is reduced. The industrial similarity between Yangquan and Lüliang is the highest in five years, indicating that their industrial structure has a certain convergence with that of other cities. The coal-related industries of the two cities occupy an important position in the local industrial structure. The economic benefits generated by the coal-related industries account for more than 50% of the industrial economic benefits, so the industrial structure cannot get rid of its dependence on coal resources. The similarity coefficient of Jinzhong and Xinzhou has also been improved, indicating that the industrial structure of the two cities has a trend of convergence. The economic benefits of coal-related industries account for the proportion of industrial economic benefits, and the economic influence of coal-related industries is large, which is related to the development of the local economy and society.

4.3. Population–Economic Coordinated Development Level

Population–economic growth elasticity can reflect the degree of coordinated development of the population and economy, representing the corresponding increase in population for every 1% of economic growth in a certain region. By calculating the population and economic aggregate data of an urban agglomeration from 2011 to 2020 (Table 4), it is concluded that the average annual growth rate of population in Taiyuan and Jinzhong is positive, indicating that the population continued to grow in the past decade, while Xinzhou, Yangquan and Lüliang were negative, indicating that the population continued to decrease and there was a population outflow in the past decade. The average annual economic growth rate of each city shows an increasing trend, and Taiyuan has the highest growth rate, which reflects the role of the provincial capital and the growth pole of regional economic development. The elasticity coefficient of population–economic growth in Taiyuan and Jinzhong is positive, indicating that the increase of population size caused by a 1% economic growth has a positive relationship. The coefficient of the remaining three cities is negative, indicating that a 1% decrease in population is inconsistent with economic development.
Using the natural fracture classification method, the average annual economic growth rate and population–economic growth elasticity is divided into two categories, which are divided into four quadrants (Figure 5). The first quadrant is where the average annual economic growth rate is high, and the population–economic growth elasticity is high, indicating that economic growth has a great pulling effect on population size. The coordinated development of population size and economic growth represents Taiyuan. The second quadrant is where the average annual economic growth rate is low, and the coordinated development of population and economy is high, indicating that the population growth rate is high at the same time economic growth is slow, and the representative city is Jinzhong. The third quadrant is where the average annual economic growth rate is low, the population–economic growth elasticity is low, and the pulling effect of economic growth on population size is small. The representative cities are Yangquan and Lüliang. The fourth quadrant shows that the average annual economic growth rate is high, and the coordinated development of the population and economy is low, indicating that, while maintaining rapid economic development, the population growth rate is low, and Xinzhou is representative.

5. Analysis and Discussion

5.1. Analysis

5.1.1. Poor Level of Coordinated Economic Development

As an emerging urban agglomeration proposed by China’s 14th Five-Year Plan, the central urban agglomeration of Shanxi should grow stronger, narrow the gap with other urban agglomerations, develop into a representative urban agglomeration in the central region as soon as possible, promote the economic and social development of the central region, and become the growth pole that drives the development of the central region.
Taiyuan is the capital of Shanxi, and in 2020, its total economic output ranked first in the province, Lüliang was in fourth place, Jinzhong in sixth, Xinzhou and Yangquan are the reciprocal second and reciprocal first. The economic strength of the whole urban agglomeration is weak, and there is huge room for economic development. Taiyuan lags far behind other capital cities, such as Shijiazhuang, Xi’an and Zhengzhou. Although the growth rate has been increasing in recent years, it still needs time to catch up. Through the modified gravity model, it can be seen that Jinzhong, Xinzhou, Yangquan and Lüliang in addition to the intensity of economic ties with Taiyuan, have weak economic ties, indicating that the coordination and cooperation of economic activities among the four cities is poor, and the economic advantages of the four cities can not be played out as a whole, which greatly reduces the economic strength of the urban agglomeration; it is necessary to carry out a targeted strategic deployment to improve the economic coordination and cooperation between cities. We should take the mature urban agglomeration represented by the Beijing–Tianjin–Hebei urban agglomeration as the development goal, reasonably plan the scale of urban agglomeration, and promote the high-quality development and growth of urban agglomeration.

5.1.2. Strong Dependence on Industrial Coal Resources

As a major coal province, Shanxi is rich in coal, and each city in the urban agglomeration has a certain amount of coal distribution. Therefore, most of them gradually formed an industrial structure heavily dependent on coal. In addition to Taiyuan, the economic benefits of coal-related industries in the four cities in 2020 comprised a large proportion. Coal-related industries have become a pillar industry of local development and affect the development of local economy and society. The overall similarity coefficient of industrial structure is low, indicating that the composition of industrial structure among cities is relatively different, but there is an improving trend, and the composition of industrial structure has gradually developed. Therefore, the government should pay more attention to the planning and layout of industrial development, improve the coordination of inter-city industries, transfer and upgrade relevant enterprises, or introduce more advanced enterprises in the industry from abroad to drive the optimization and transformation of the industry, and form a benign industrial atmosphere for cooperative development in the urban agglomeration.

5.1.3. Population Development and Economic Growth Are Not Coordinated

As the economy developed of economy, the population of the urban agglomeration was stagnant or even decreased, which cannot be coordinated. In urban agglomerations, in addition to the high level of coordinated development between population growth and economic development in Taiyuan, the coordination degree of the population and economy in Jinzhong was very low, close to 0, indicating that the development of the local economy has little effect on promoting population growth. The economic development of Xinzhou, Yangquan and Lüliang was not coordinated with the growth of the population, and the elasticity of population–economic growth was negative. The economic growth of the three cities has brought about a reduction in population. Taking Xinzhou as an example from 2011 to 2020, total economic output increased by more than CNY 48 billion, but the population decreased by more than 400,000. The population outflow trend increased, and the local economy developed rapidly; however, the economic employment situation cannot retain the population, so it went to other regions to find employment. In short, population development and economic growth of urban agglomerations show an uncoordinated state, and economic growth cannot drive the corresponding growth of the population.

5.2. Discussion

5.2.1. Strengthening Economic Planning and Improving Economic Development

As an emerging urban agglomeration cultivated and developed in the central region of Shanxi, the government should strengthen the Beijing–Tianjin planning from a macro perspective, coordinate the comparative economic advantages of Taiyuan, Jinzhong, Xinzhou, Lüliang and Yangquan, and coordinate economic development to continuously improve the economic level and build a development growth pole in the central region.
On the one hand, economic planning should build the core of Taiyuan into a national regional centre and enhance economic agglomeration and economic diffusion as the leader of urban agglomeration, economic competitiveness, economic radiation driving ability and the economic population carrying capacity of the urban agglomeration around Taiyuan; Jinzhong would build an all-round advance area to promote economic development; Xinzhou with Taiyuan would build the Taixin integrated economic zone; Yangquan to become the conduit into the Beijing–Tianjin–Hebei economic coordinated development important node, and Lüliang would build the Taiyuan core industry complementary and guaranteed service area.
On the other hand, economic planning should strengthen economic ties with the outside world, making full use of regional economic resources and expanding influence. Strengthening economic ties with the Beijing–Tianjin–Hebei, Hubao–Eyu, Guanzhong Plain, and the Central Plains urban agglomerations, will deepen economic cooperation in the Golden Triangle of the Great Wall of Inner Mongolia, Shanxi, and Henbei ⑤ (Reference Appendix A) and the Golden Triangle of the Yellow River ⑥ (Reference Appendix A).

5.2.2. Optimizing and Upgrading Industrial Structure and Eliminating Coal Dependency

To promote the optimization and upgrading of industrial structure, an urban agglomeration should first build a modern industrial system supported by advanced manufacturing, build advanced manufacturing heights, develop strategic emerging industries, and gradually get rid of its dependence on coal. Secondly, it has to build a modern energy industry system, which means continuously improving the energy supply support ability, formulating targeted policies to adjust to energy saving and emission reduction, increasing investment in research and development and production equipment renewal, and controlling the proportion of high-energy consumption industries [29]: essentially, renovating the traditional energy industry, eliminating backward and excess capacity, and achieving sustainable economic development [30].
From here, the transformation of the service industry should be accelerated by strengthening the role of the digital economy to make full use of rich cultural resources. The cultural industry and tourism will combine to build an eco-cultural tourism circle, promote the efficient development of agriculture, and strive to create an innovative ecology. Finally, the integration of the Taixin economic zone as the focus of industrial development of urban agglomeration will build a new system of industrial transformation and development that will include the construction of several new clusters: a new Taiyuan material industry, CNY billion-level high-end equipment manufacturing, green energy industry, ecological culture and tourism industry, and the formation of multiple industrial clusters that have a common development in the new industrial situation.

5.2.3. Strengthen Regional Ties and Improve the Level of Population Economic Coordination

On the one hand, cities should formulate positive employment and talent introduction policies according to economic development [31], by providing more employment opportunities, reducing population loss, and gathering high-tech talent to give economic and population growth a coordinated development. On the other hand, it is necessary to strengthen ties with the surrounding areas by taking full advantage of close geographical distance, similar customs and frequent personnel exchanges to promote the continuous flow of resources.
To improve the coordinated development of population and economy, the urban agglomeration in central Shanxi should actively integrate into the construction of the Xiong’an New Area. The Beijing–Tianjin–Hebei urban agglomeration is the core of China’s economy and important for national competitiveness [32], The construction of the Xiong’an New Area has important strategic significance for relieving the non-capital function of Beijing [33]. If a good connection can be established, it will promote the rapid development of urban agglomerations. Therefore, Taiyuan and Xinzhou should become an important corridor for Shanxi Province to integrate into Beijing–Tianjin–Hebei and serve the Xiong’an New Area, strengthen regional ties with Beijing–Tianjin–Hebei urban agglomeration to create more jobs and attract more talent, so that economic development and population growth can reach a coordinated level.

6. Conclusions

The emerging central Shanxi urban agglomeration has broad prospects for development. Based on the references, this paper conducted research into the relationship between economy, industry and population–economy and found three problems: low level of coordinated economic development, strong dependence on coal, and uncoordinated population development and economic growth; it put forward three reasonable strategies for the government to strengthen economic planning, improve economic development, optimize and upgrade the industrial structure, end dependency on coal, strengthen regional ties, and improve population and economic coordination; however, it is far from enough to study only from these three aspects. Next, more aspects and more in-depth studies are needed to analyze the various problems in the development of urban agglomerations, so that the one in central Shanxi can develop rapidly and become the support point of regional economic and social development and the growth pole of the development of the central region.

Author Contributions

Conceptualization, Y.C. and Z.Z.; methodology, Y.C.; software, Y.C.; validation, Y.C.; formal analysis, Y.C.; investigation, J.F. and H.L.; resources, Y.C., J.F. and H.L.; data curation, Y.C.; writing—original draft preparation, Y.C.; writing—review and editing, Z.Z. and Y.C.; visualization, Y.C.; supervision, Z.Z.; project administration, Z.Z.; funding acquisition, Z.Z. All authors have read and agreed to the published version of the manuscript.

Funding

This article was supported by the project “Shanxi Yellow River’ 5G +’ Tourism Planning Research” (HH202005).

Institutional Review Board Statement

Not applicable.

Informed Consent Statement

Not applicable.

Data Availability Statement

Not applicable.

Conflicts of Interest

The authors declare no conflict of interest.

Appendix A. Explanation of Some Nouns

  • ① spatial combination model:
  • From the perspective of space, the urban and industrial elements of urban agglomeration are reasonably arranged in space, which makes the urban agglomeration infrastructure, industrial structure, government regulation and economic policy achieve the optimal effect in space.
  • ② 14th Five-Year Plan:
  • The five-year plan is an important part of China’s long-term national economic plan; it mainly makes plans for major national construction projects, productivity distribution and important proportion relations of the national economy, and sets goals and directions for the development prospect of the national economy; it is now the fourteenth five-year plan period, referred to as the 14th five-year plan.
  • ③ the central region:
  • China’s central region refers to Shanxi, Henan, Anhui, Hubei, Jiangxi and Hunan provinces, Shanxi Province is in the northernmost central region.
  • ④ the second step:
  • China is divided into three steps according to altitude, mountains and topography, and each step has a different altitude. The highest elevation, above 4000 m, is the first step, the representative area is the Qinghai–Tibet Plateau; followed by the second step, 1000–2000 m, representing the Loess Plateau; the third step is below 500 m, represented by the middle and lower reaches of the Yangtze River plain.
  • ⑤ the Golden Triangle of the Great Wall of Inner Mongolia, Shanxi, and Henbei:
  • The Golden Triangle Cooperation Zone of the Great Wall of Mongolia, Shanxi and Hebei Province refers to the Ulanqab of Inner Mongolia Autonomous Region, Datong of Shanxi Province and Zhangjiakou of Hebei Province. The implementation of regional cooperation in the border area of the three provinces creates a cooperative and open platform for the coordinated development of the economy and society in the border area of the three provinces.
  • ⑥ the Golden Triangle of the Yellow River:
  • Yuncheng, Linfen, Sanmenxia, Henan Province and Weinan, Shaanxi Province, constitute the’ Yellow River Golden Triangle Area’ on the edge of Shanxi, Shaanxi and Henan Provinces.

References

  1. Yao, S.M.; Chen, S.; Chen, Z.G. New recognition on city group basic concept. Mod. Urban Res. 1998, 6, 15–17+61. [Google Scholar]
  2. Fang, C.L. Progress and the future direction of research into urban agglomeration in China. Acta Geogr. Sin. 2014, 69, 1130–1144. [Google Scholar]
  3. Fang, C.L. Research Progress and General Definition about Identification Standards of Urban Agglomeration Space. Urban Planning Forum. 2009, 4, 1–6. [Google Scholar]
  4. Fang, C.L.; Zhang, G.Y.; Xue, D.S. High-quality development of urban agglomerations in China and construction of science and technology collaborative innovation community. Acta Geogr. Sin. 2021, 76, 2898–2908. [Google Scholar]
  5. Gao, X.-L.; Xu, Z.-N.; Niu, F.-Q.; Long, Y. An evaluation of China’s urban agglomeration development from the spatial perspective. Spat. Stat. 2017, 21, 475–491. [Google Scholar] [CrossRef]
  6. Ding, R.Z.; Xu, B.Y.; Zhang, H. Can Urban Agglomeration Drive Regional Economic Growth? Empirical Analysis Based on Seven State-level Urban Agglomerations. Econ. Geogr. 2021, 41, 37–45. [Google Scholar]
  7. Bettencourt, L.M.A.; Lobo, J.; Strumsky, D. Invention in the city: Increasing returns to patenting as a scaling function of metropolitan size. Res. Policy 2006, 36, 107–120. [Google Scholar] [CrossRef]
  8. Bettencourt Luís, M.A.; Lobo, J. Urban scaling in Europe. J. R. Soc. Interface 2016, 13, 20160005. [Google Scholar] [CrossRef]
  9. Guo, S.; Jiang, L.; Zhang, H.O.; Ye, Y.Y.; Lin, H.X. The Functional Coordinated Development of Urban Agglomer-ation from the Perspective of Flow Space: A Case Study of San Francisco Bay Area. Trop. Geogr. 2022, 42, 195–205. [Google Scholar]
  10. Hu, Y.; Tang, L.; Can, H. Influence of Competition and Cooperation between Intercity of Urban Agglomeration on Urban Economic Development—Empirical Test on Urban Agglomeration of Yangtze River Delta Based on the Perspective of Spatial Spillover. West Forum 2018, 28, 76–83. [Google Scholar]
  11. Sun, Z.R.; Fan, J.; Sun, Y. Research on Spatial and Temporal Evolution of Cooperative Innovation Network in Chengdu-Chongqing Urban Agglomeration from the Perspective of Intra Group and Inter Group. Areal Res. Dev. 2022, 41, 26–31+44. [Google Scholar]
  12. Zhang, J.W.; Du, D.B. Study on the Model of Inter-city Cooperation based on the Evolutionary Theory. Urban Dev. Stud. 2011, 18, 82–88. [Google Scholar]
  13. Peng, J.; Lin, H.; Chen, Y.; Blaschke, T.; Luo, L.; Xu, Z.; Hu, Y.; Zhao, M.; Wu, J. Spatiotemporal evolution of urban agglomerations in China during 2000–2012: A nighttime light approach. Landsc. Ecol. 2020, 35, 421–434. [Google Scholar] [CrossRef]
  14. Fan, Y.; Guo, R.; He, Z.; Li, M.; He, B.; Yang, H.; Wen, N. Spatio–Temporal Pattern of the Urban System Network in the Huaihe River Basin Based on Entropy Theory. Entropy 2019, 21, 20. [Google Scholar] [CrossRef] [Green Version]
  15. Zhao, Z. Characteristics Analysis and Optimization Strategy of Logistics Network in Yangtze River Delta Urban Agglomeration. Int. Core J. Eng. 2021, 7, 653–662. [Google Scholar]
  16. Li, J.; Qiu, R.; Xiong, L.; Xu, J.D. A gravity-spatial entropy model for the measurement of urban sprawl. Sci. China Earth Sci. 2016, 59, 207–213. [Google Scholar] [CrossRef]
  17. Liang, S. Research on the Urban Influence Domains in China. Int. J. Geogr. Inf. Sci. 2009, 23, 1527–1539. [Google Scholar] [CrossRef]
  18. Matsumoto, H.; Domae, K. Assessment of competitive hub status of cities in Europe and Asia from an international air traffic perspective. J. Air Transp. Manag. 2019, 78, 88–95. [Google Scholar] [CrossRef]
  19. Li, P.; Lv, Y.; Yao, D. Calculation and Analysis of Synergy Potential of Exhibition Economy in the PRD Urban Agglomerations. Mod. Econ. 2017, 8, 1580–1593. [Google Scholar] [CrossRef] [Green Version]
  20. Su, D.; Fang, X.; Wu, Q.; Cao, Y. Exploring the Spatiotemporal Integration Evolution of the Urban Agglomeration through City Networks. Land 2022, 11, 574. [Google Scholar] [CrossRef]
  21. Zhou, S.H.; Hao, X.H.; Liu, L. Validation of spatial decay law caused by urban commercial center′s mutual attraction in polycentric city: Spatio-temporal data mining of floating cars’ GPS data in Shenzhen. Acta Geogr. Sin. 2014, 69, 1810–1820. [Google Scholar]
  22. Wang, D.Z.; Zhuang, R.X. The preliminary probe into the quantitative analysis of regional economic links-A Case Study on Economic Links between Su-Xi-Chang and Shanghai. Sci. Geogr. Sin. 1996, 16, 51–57. [Google Scholar]
  23. Liang, Y.Q.; Hui, W.D. Influence of plateau environment on automobile engine performance. Intern. Combust. Engine Parts 2021, 15, 69–70. [Google Scholar]
  24. Zhang, X.C.; Liu, Q.; Chen, S.Q.; Wang, W.K.; Luan, X.F. Measuring Economic Intergration of City Region:A Case Study of Shenzhen-Dongguan-Huizhou Sub-region. Urban Dev. Stud. 2019, 26, 18–28. [Google Scholar]
  25. Liu, J.; Gao, T.B. AHP-SWOTA analysis of Northeast Economics of Scale Development Strategy Undertaking New Economic Situation. J. Northeast. Norm. Univ. (Philos. Soc. Sci.) 2022, 2, 111–127+147. [Google Scholar]
  26. Lian, X.M.; Wu, J.H. Dynamics of Spatial Pattern between Population and Economies in Northeast China. Popul. J. 2018, 40, 45–55. [Google Scholar]
  27. Bai, X.; Guan, Y.M. The Evolution of the Spatial Pattern of Population and Economy in the GuangdongHong Kong-Macao Greater Bay Area. Geomat. World 2020, 27, 68–74+80. [Google Scholar]
  28. Liu, X.L.; Cui, L.L.; Li, B.; Du, X.W. Research on the High-quality Development Path of China’s Energy Industry under the Target of Carbon Neutralization. J. Beijing Inst. Technol. (Soc. Sci. Ed.) 2021, 23, 1–8. [Google Scholar]
  29. Zou, X.; Wang, P. Study on the Mechanism of Industrial Structure Adjustment on the Optimization of Energy Consumption Structure. Soft Sci. 2019, 33, 11–16. [Google Scholar]
  30. Wang, Q.; Yin, X.B. Research on the Impact of Technological Innovation and Industrial Structure Upgrading on Energy Consumption—A Case of the Yangtze River Delta. J. Ind. Technol. Econ. 2022, 41, 107–112. [Google Scholar]
  31. Shi, M.Y.; Shen, K.R. Research on Economic Growth and Spatial Spillover Effect of Talent Introduction Policy Tools—A Case Study of Yangtze River Delta. Inq. Into Econ. Issues 2022, 1, 32–49. [Google Scholar]
  32. Liang, R.W.; Wang, Z.B.; Fang, C.L.; Sun, Z. Spatiotemporal differentiation and coordinated development pattern of urbanization and the ecological environment of the Beijing-Tianjin-Hebei urban agglomeration. Acta Ecol. Sin. 2019, 39, 1212–1225. [Google Scholar]
  33. Kuang, W.H.; Yang, T.R.; Yan, F.Q. Regional urban land-cover characteristics and ecological regulation during the construction of Xiong’an New District, Hebei Province, China. Acta Geogr. Sin. 2017, 72, 947–959. [Google Scholar]
Figure 1. Central Shanxi Urban Agglomeration.
Sustainability 14 09924 g001
Figure 2. Urban economic quality of urban agglomerations. (a) Urban Quality of Central Shanxi Urban Agglomeration in 2010. (b) Urban Quality of Central Shanxi Urban Agglomeration in 2015. (c) Urban Quality of Central Shanxi Urban Agglomeration in 2020. (d) Urban Quality of Jing-Jin-Ji Urban Agglomeration in 2020.
Sustainability 14 09924 g002
Figure 3. Economic Linkage Strength of Urban Agglomeration. (a) Economic linkage intensity of central Shanxi urban agglomeration in 2010. (b) Economic linkage intensity of central Shanxi urban agglomeration in 2015. (c) Economic linkage intensity of central Shanxi urban agglomeration in 2020. (d) Economic Linkage Intensity of Jing–Jin–Ji Urban Agglomeration in 2020.
Sustainability 14 09924 g003
Figure 4. Proportion of coal-related Industrial Economic Benefits to Industrial Economic Benefits in Urban Agglomeration.
Sustainability 14 09924 g004
Figure 5. Coordinated relationship between population growth and economic growth. (a) Annual population growth rate. (b) Annual economic growth rate. (c) Population–economic growth elasticity. (d) Quadrant distribution.
Sustainability 14 09924 g005
Table 1. Comparison of Economic Quality between Central Shanxi Urban Agglomeration and Beijing–Tianjin–Hebei Urban Agglomeration.
Urban Agglomeration Urban Population 2020 (Millions)Total Urban Economy in 2020 (CNY Billion)The Output of the Tertiary Industry in 2020 (CNY Billion)Total Export-Import Volume in 2020 (CNY Million)Disposable Income in 2020 (CNY Yuan)Urban Economic Quality in 2020
Central ShanxiTaiyuan531.854153.252616.8312,114,678.0035,473.0019,012.22
Jinzhong338.041468.77689.84200,152.0026,187.004475.30
Xinzhou268.351034.56501.83188,696.0019,637.003487.97
Yangquan131.79742.24397.34150,488.0028,529.002782.77
Lüliang339.451538.04547.02383,983.0019,387.004629.29
Beijing–Tianjin–HebeiBeijing2189.0036,102.6030,278.60226,436,784.0069,434.00130,343.04
Tianjin1386.6014,083.739069.4771,594,526.0043,854.0056,108.41
Shijiazhuang1123.515935.103691.3213,411,470.5430,954.8425,227.73
Chengde335.441550.30716.47163,367.2523,222.564266.41
Zhangjiakou411.891600.10901.44391,100.1225,673.715690.21
Qinhuangdao313.691685.80901.413,590,551.6028,417.468657.53
Tangshan771.807210.902780.7510,210,667.2534,871.0022,296.40
Langfang546.413301.102057.643,924,196.0734,357.6213,799.52
Baoding1154.403954.302140.902,937,364.9025,204.3714,855.64
Cangzhou730.083699.871951.153,183,137.1626,887.7313,516.10
Hengshui421.291560.20835.552,353,981.3323,527.337881.75
Xingtai711.112200.401065.541,698,288.4823,772.079238.85
Handan941.403636.601688.652,116,951.8126,918.5512,692.71
Table 2. Industrial Structure Similarity Coefficient of Central Shanxi Urban Agglomeration in 2020.
TaiyuanJinzhongXinzhouYangquanLüliang
Taiyuan1.00
Jinzhong0.171.00
Xinzhou0.100.231.00
Yangquan0.080.240.221.00
Lüliang0.210.300.240.331.00
Table 3. Industrial Structure Similarity Coefficient of Central Shanxi Urban Agglomeration in 2010.
TaiyuanJinzhongXinzhouYangquanLüliang
Taiyuan1.00
Jinzhong0.111.00
Xinzhou0.070.131.00
Yangquan0.130.190.341.00
Lüliang0.110.200.190.371.00
Table 4. Urban population–economic growth elasticity.
Annual Population Growth RateAnnual Economic Growth RatePopulation–
Economic Growth Elasticity
Taiyuan2.32%8.04%0.29
Jinzhong0.39%6.16%0.06
Xinzhou−1.35%7.98%−0.17
Yangquan−0.38%5.10%−0.08
Lüliang−0.95%4.99%−0.19
Publisher’s Note: MDPI stays neutral with regard to jurisdictional claims in published maps and institutional affiliations.

