
Influence of Topographic Factors on the Characteristics of Gully Systems in Mountainous Areas of Ningnan Dry-Hot Valley, SW China

 and
and
Abstract
:1. Introduction
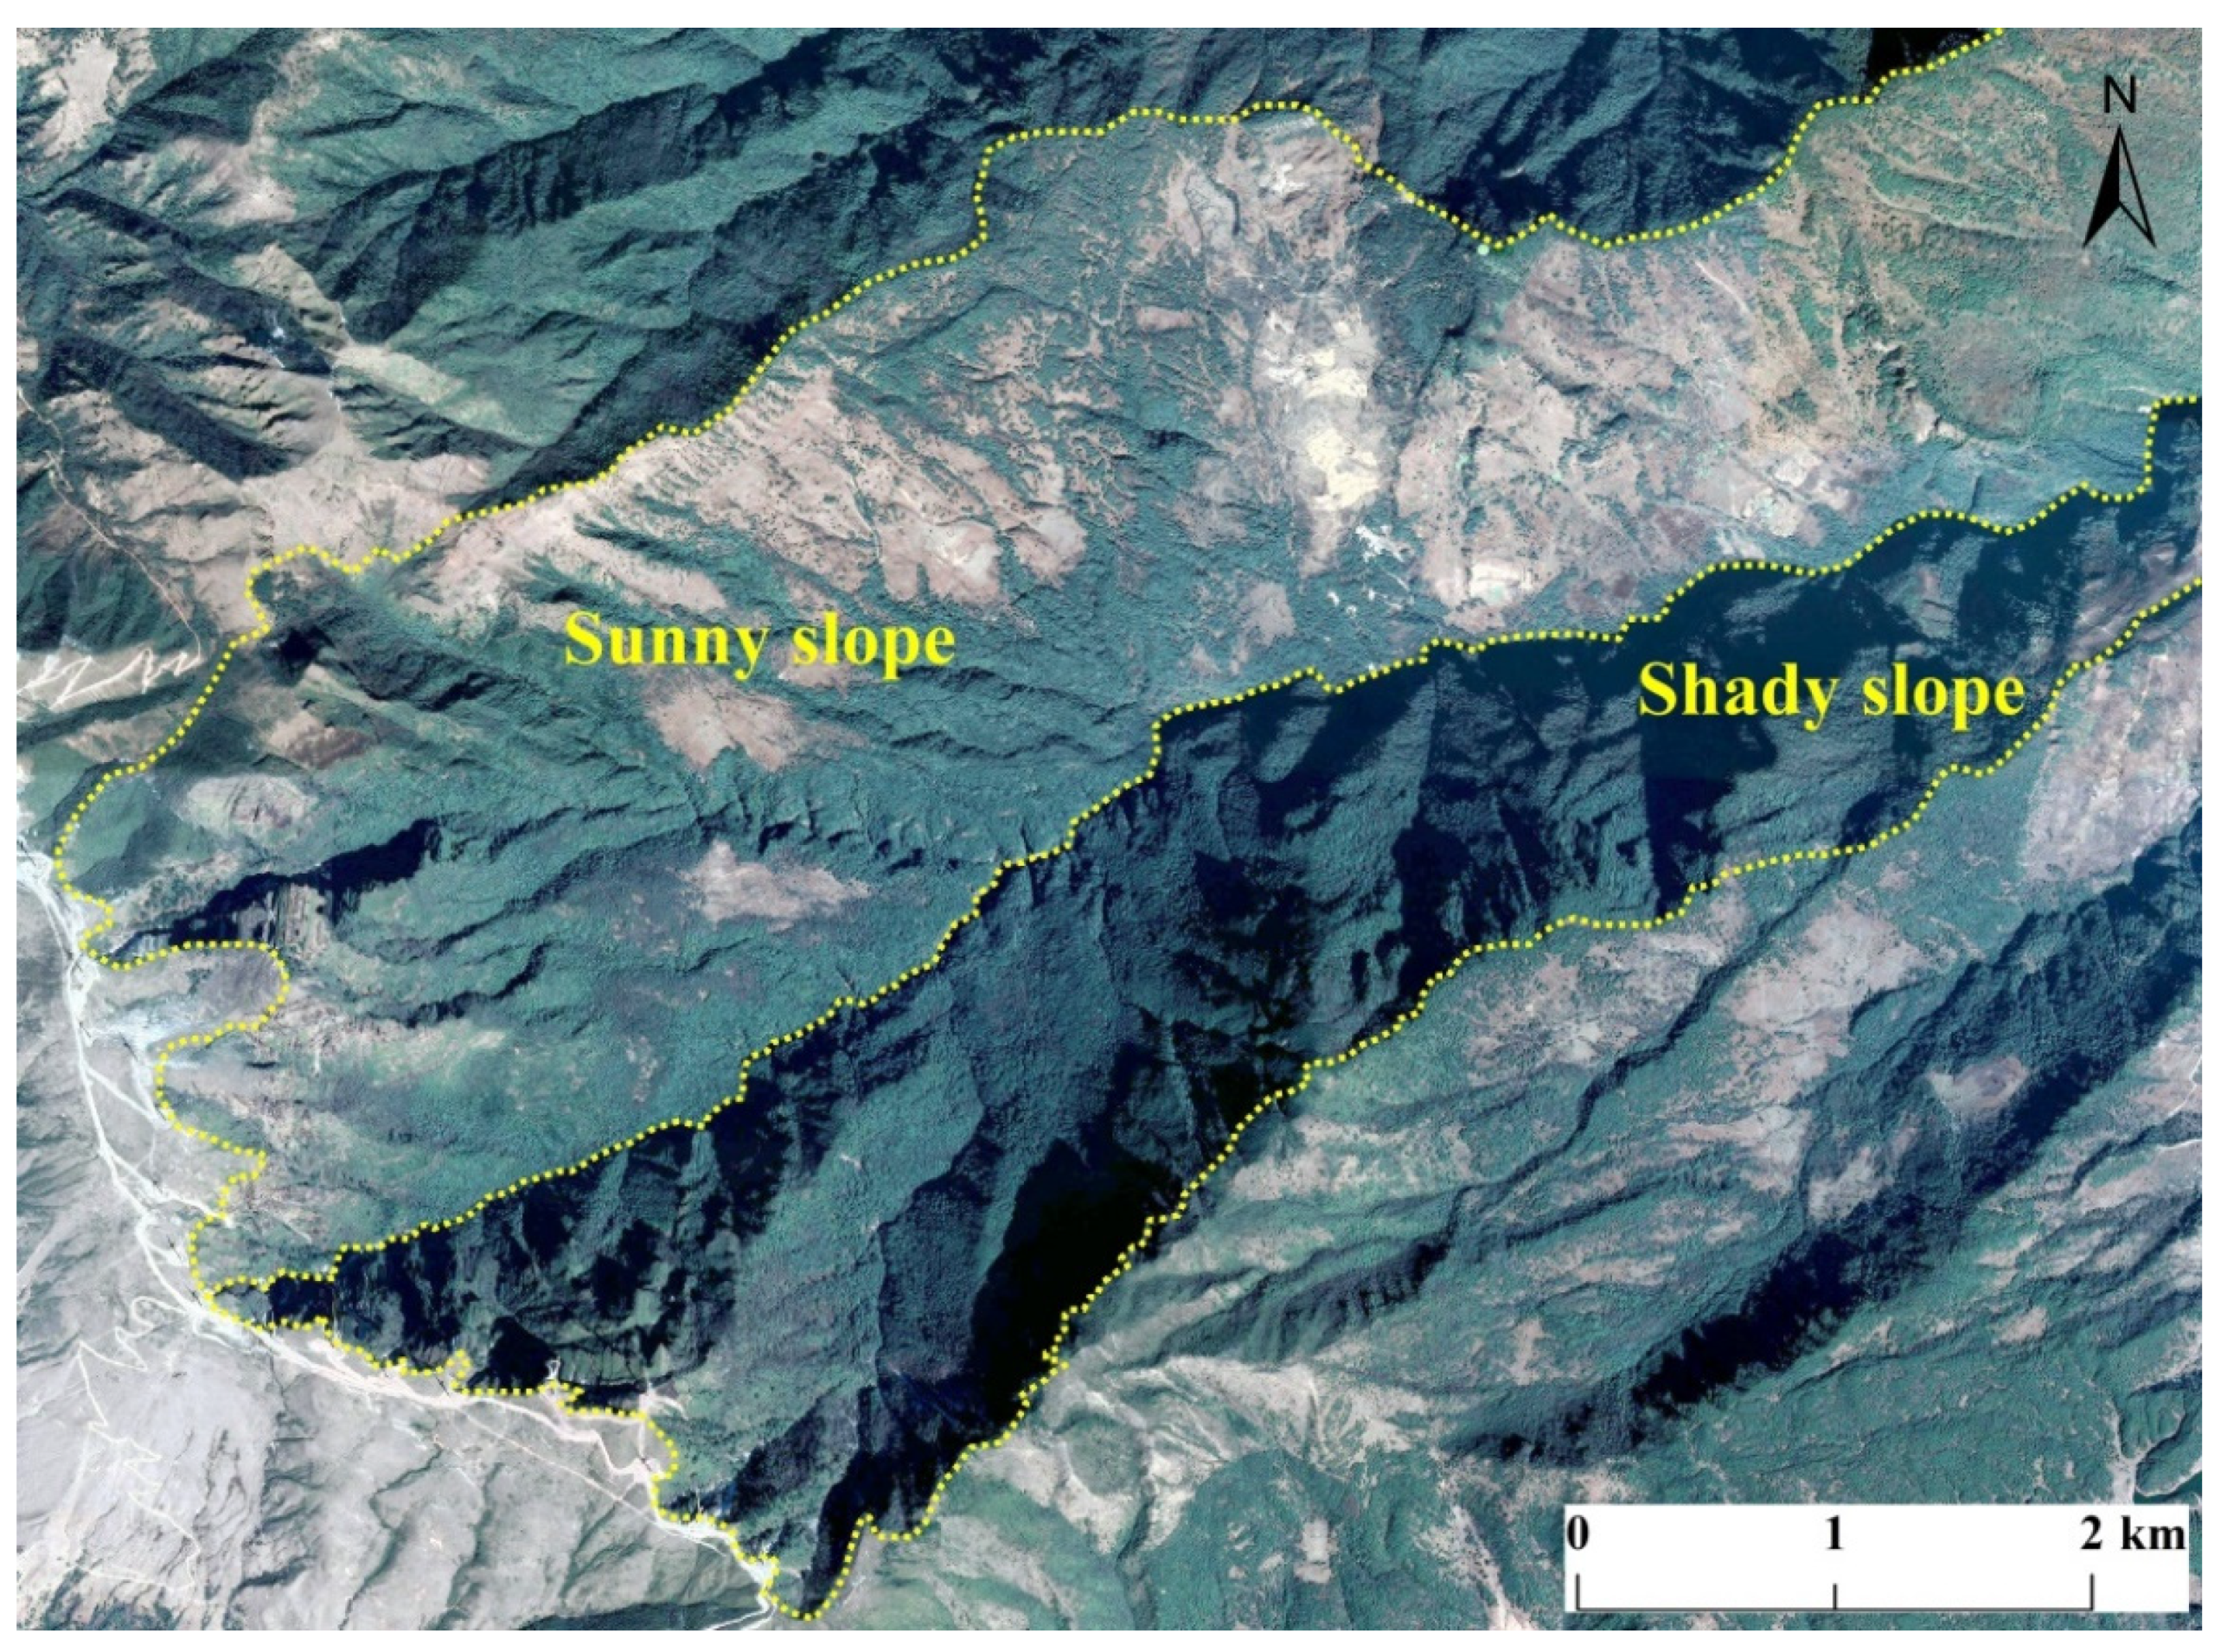
2. Study Area
3. Materials and Methods
3.1. Topographic Factor Extraction
3.2. Gully System Parameters
3.3. Ward’s Hierarchical Clustering Method
4. Results
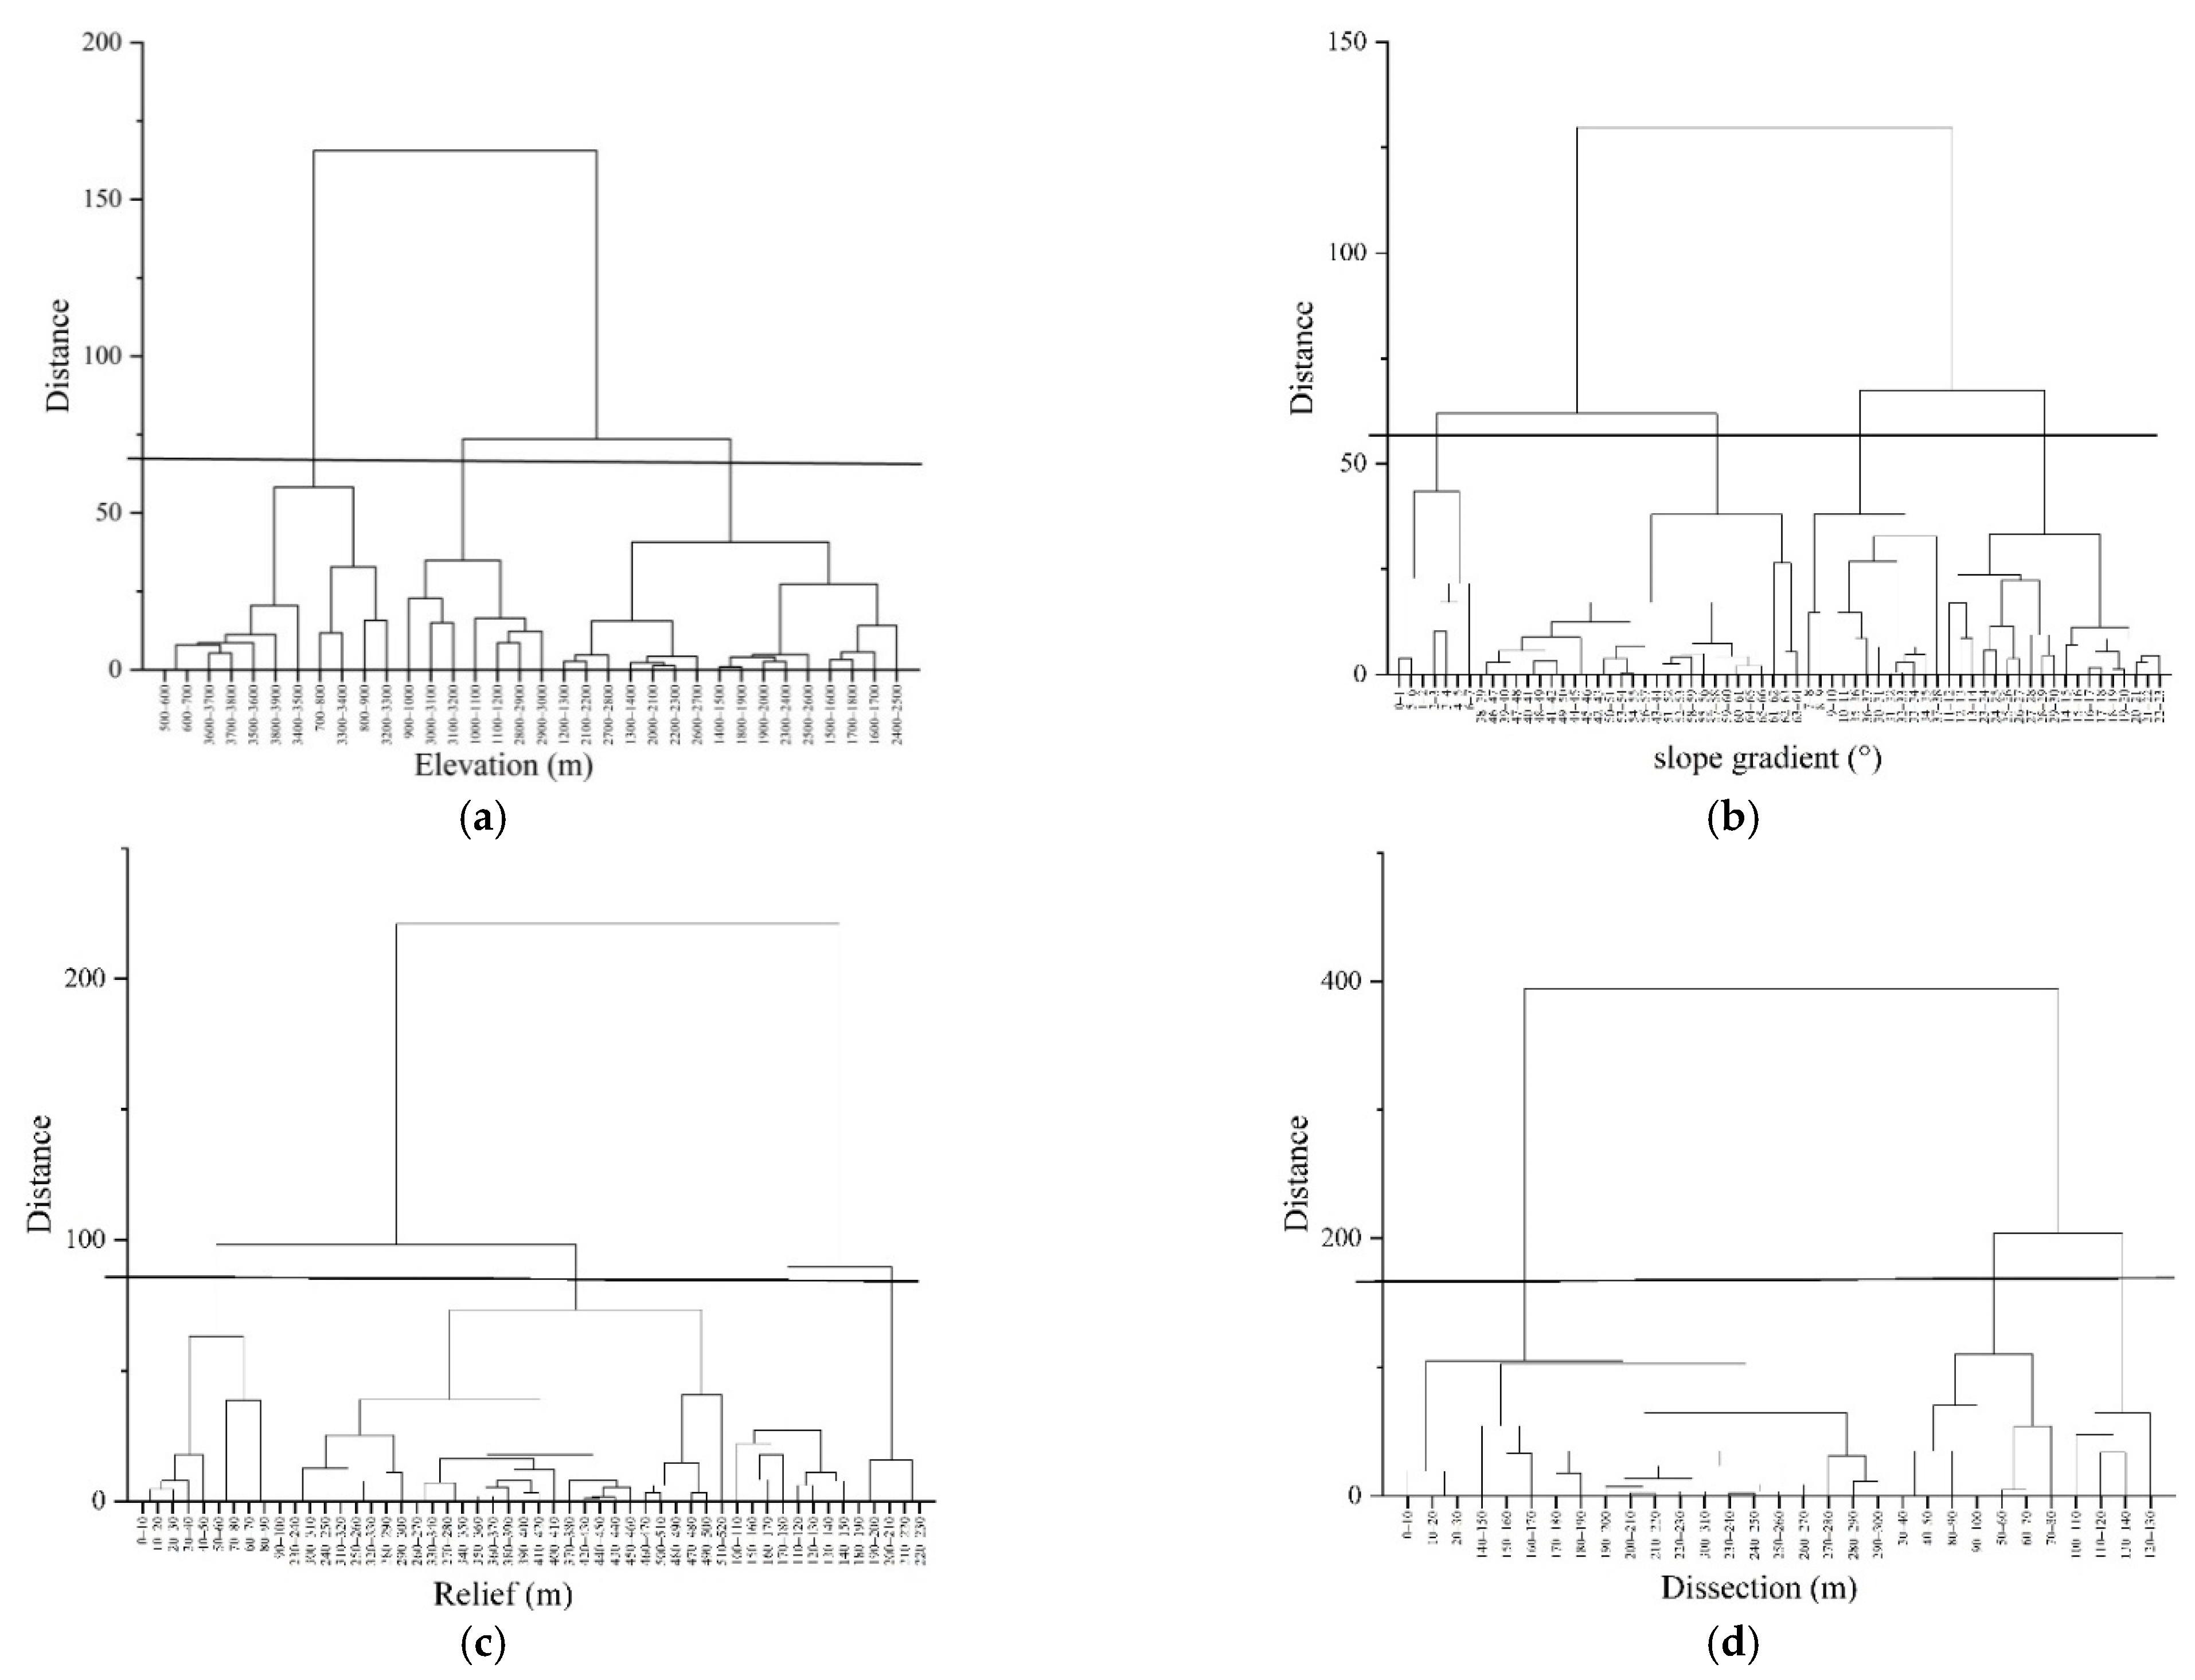
4.1. Reclassification of Topographic Factors
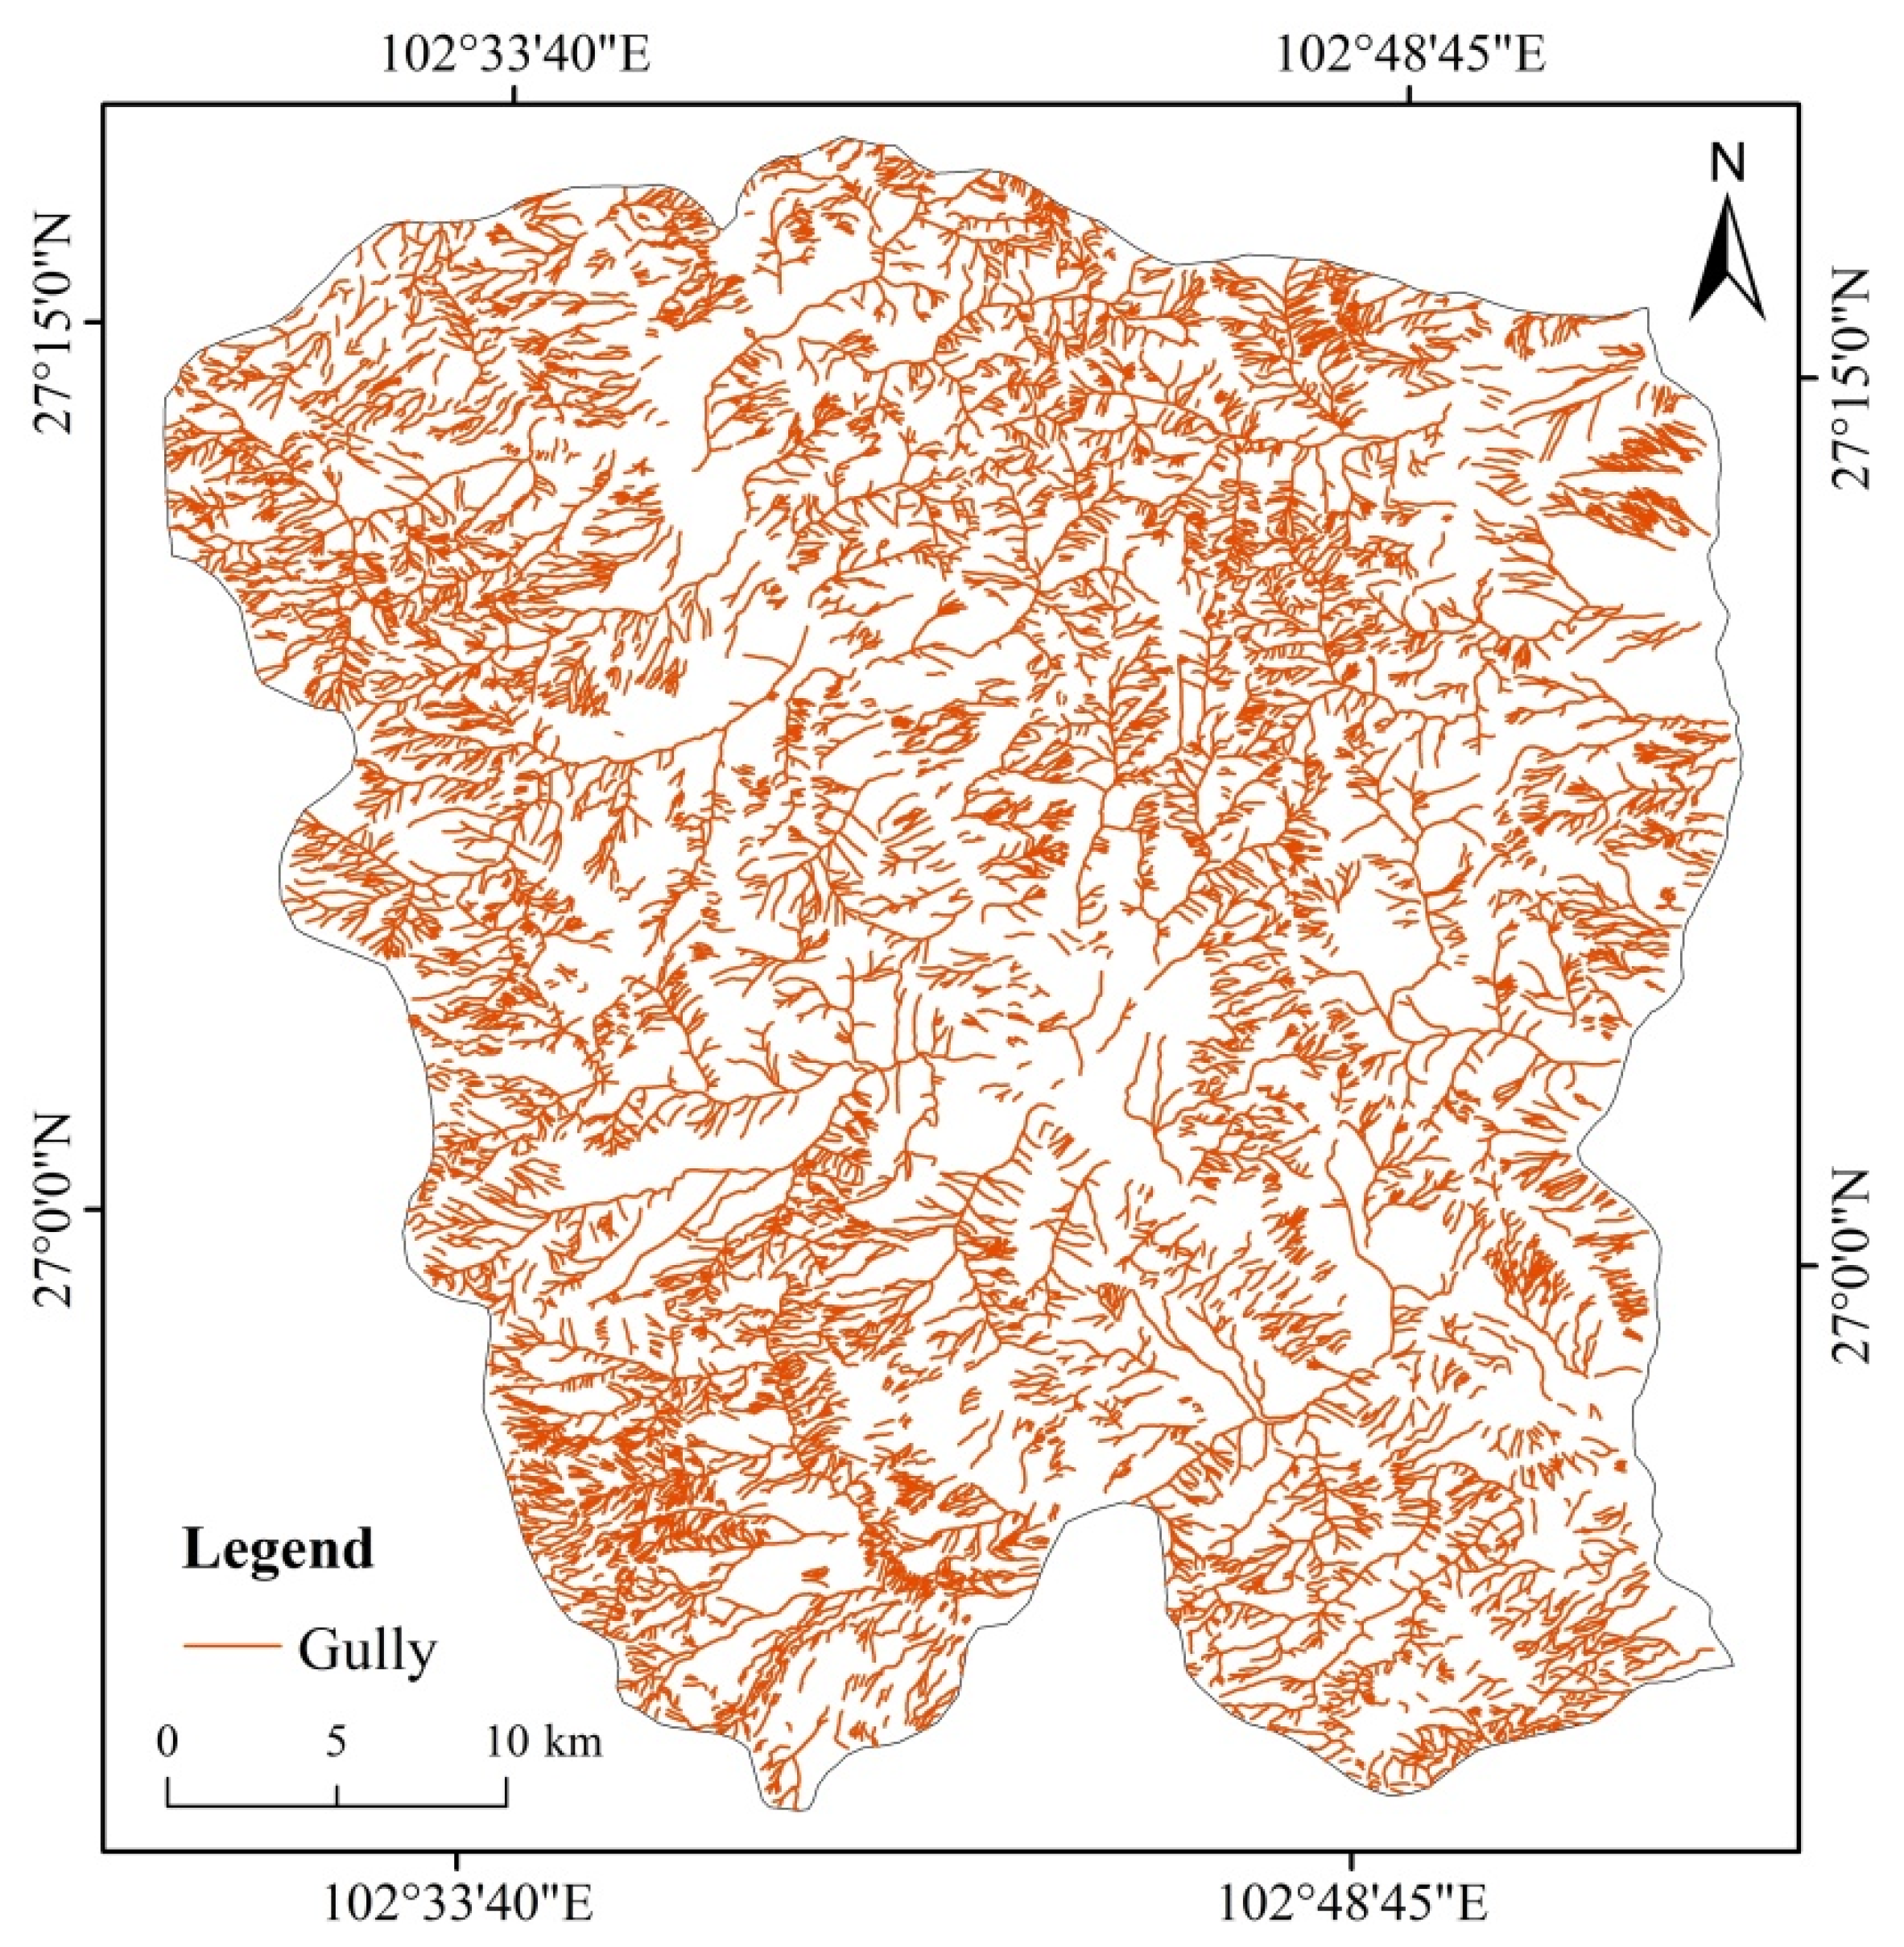
4.2. Characteristics of Gully Systems
4.3. Variation of Gully Parameters with Reclassified Topographic Factors
4.3.1. Elevation
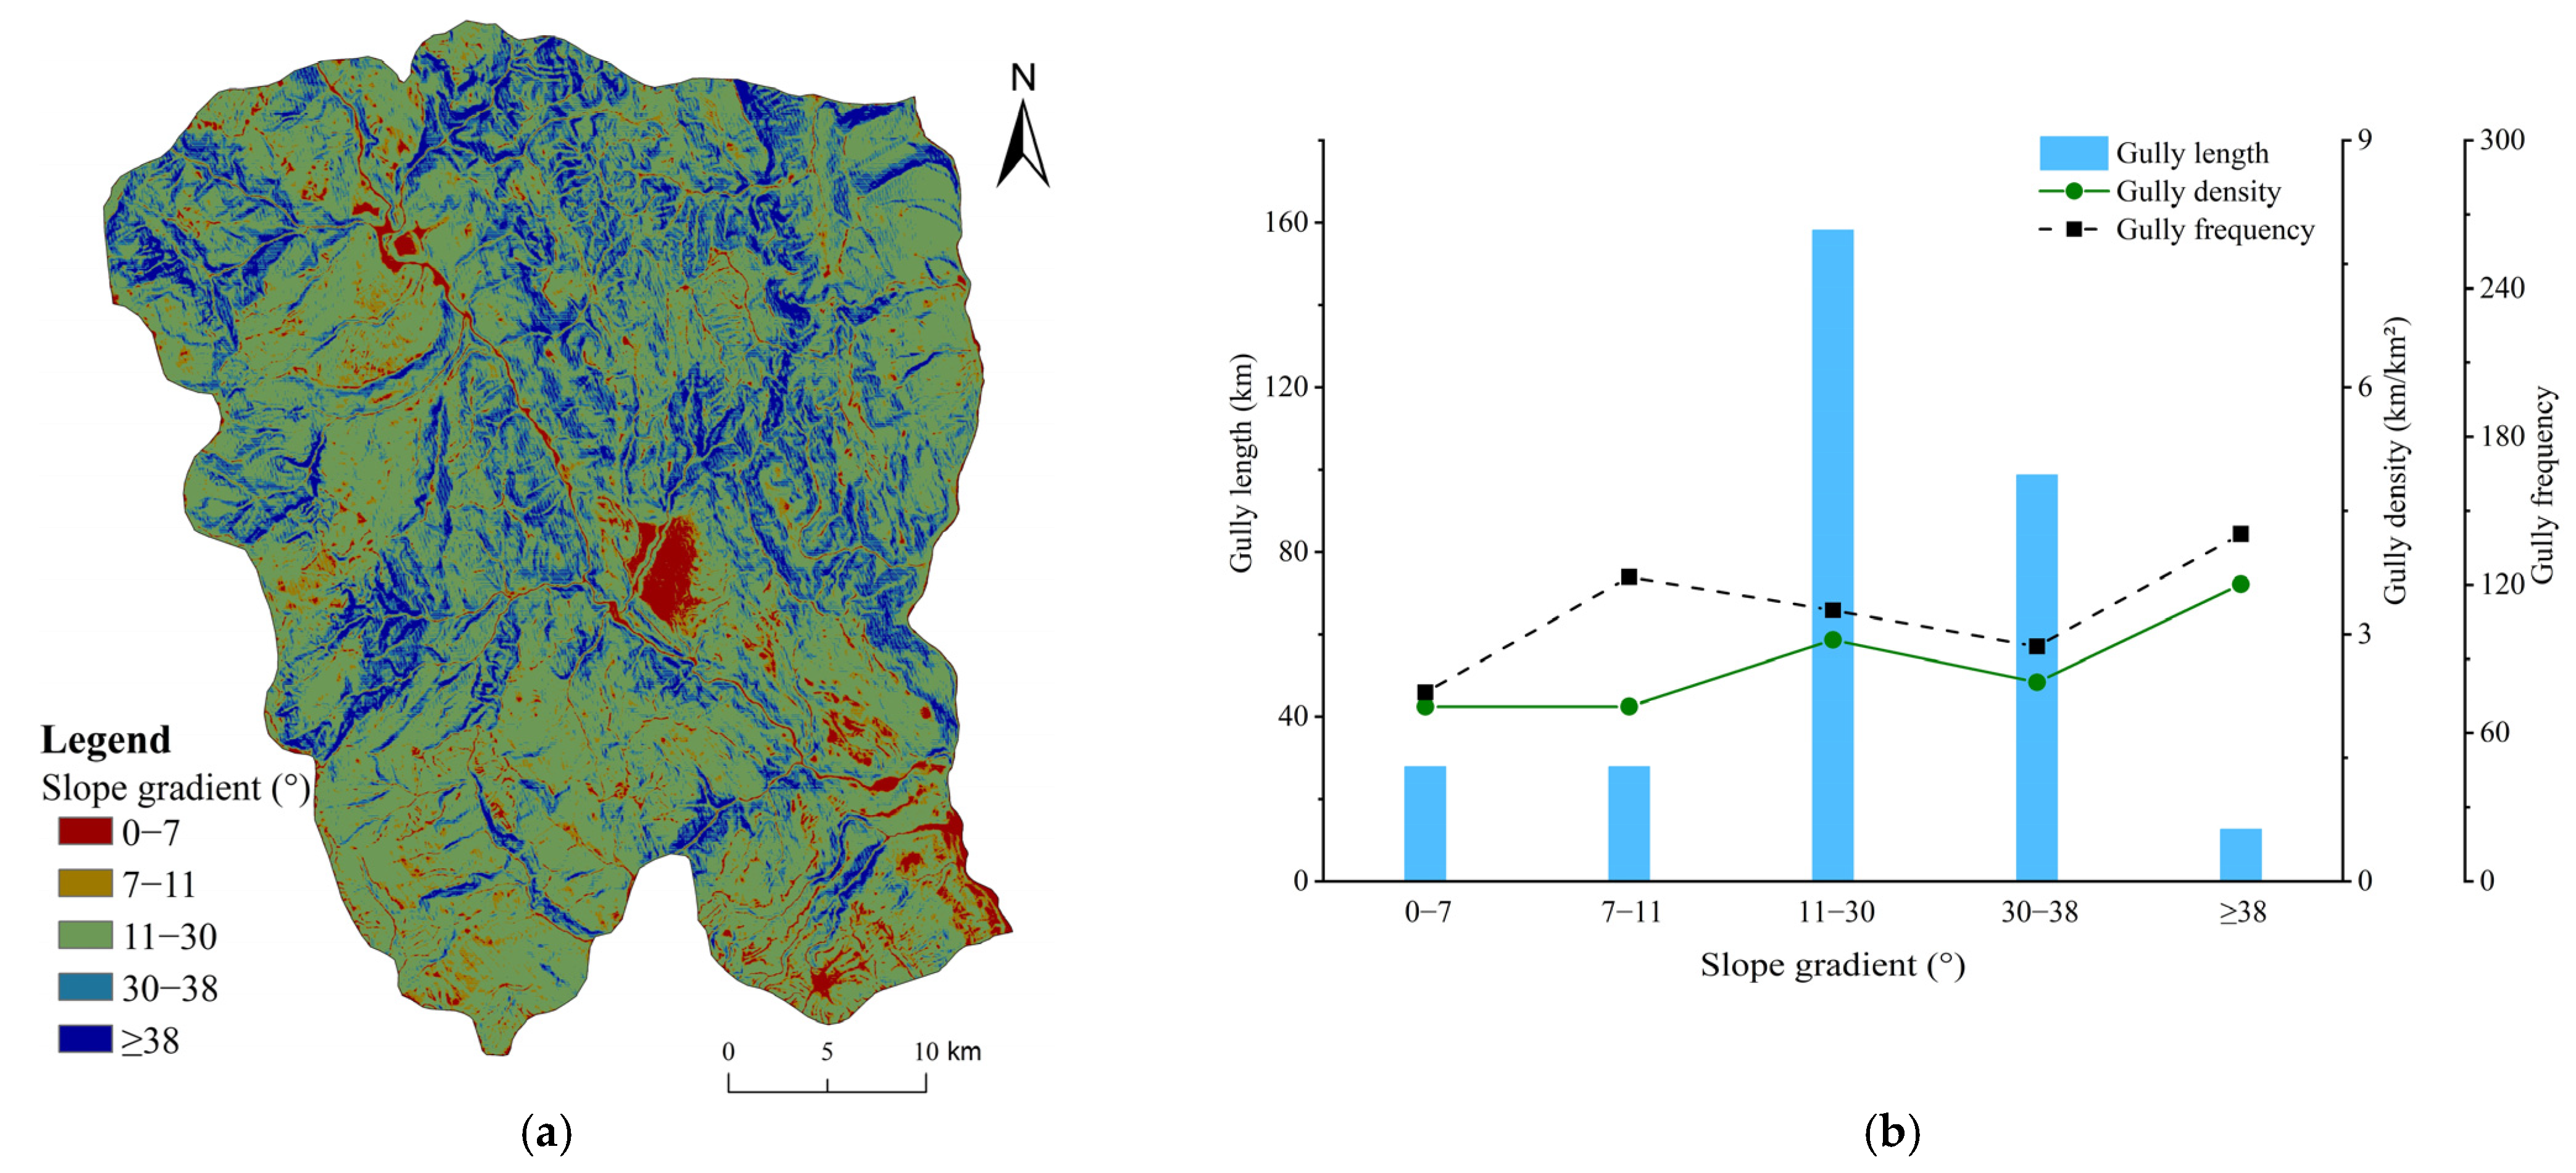
4.3.2. Slope Gradient
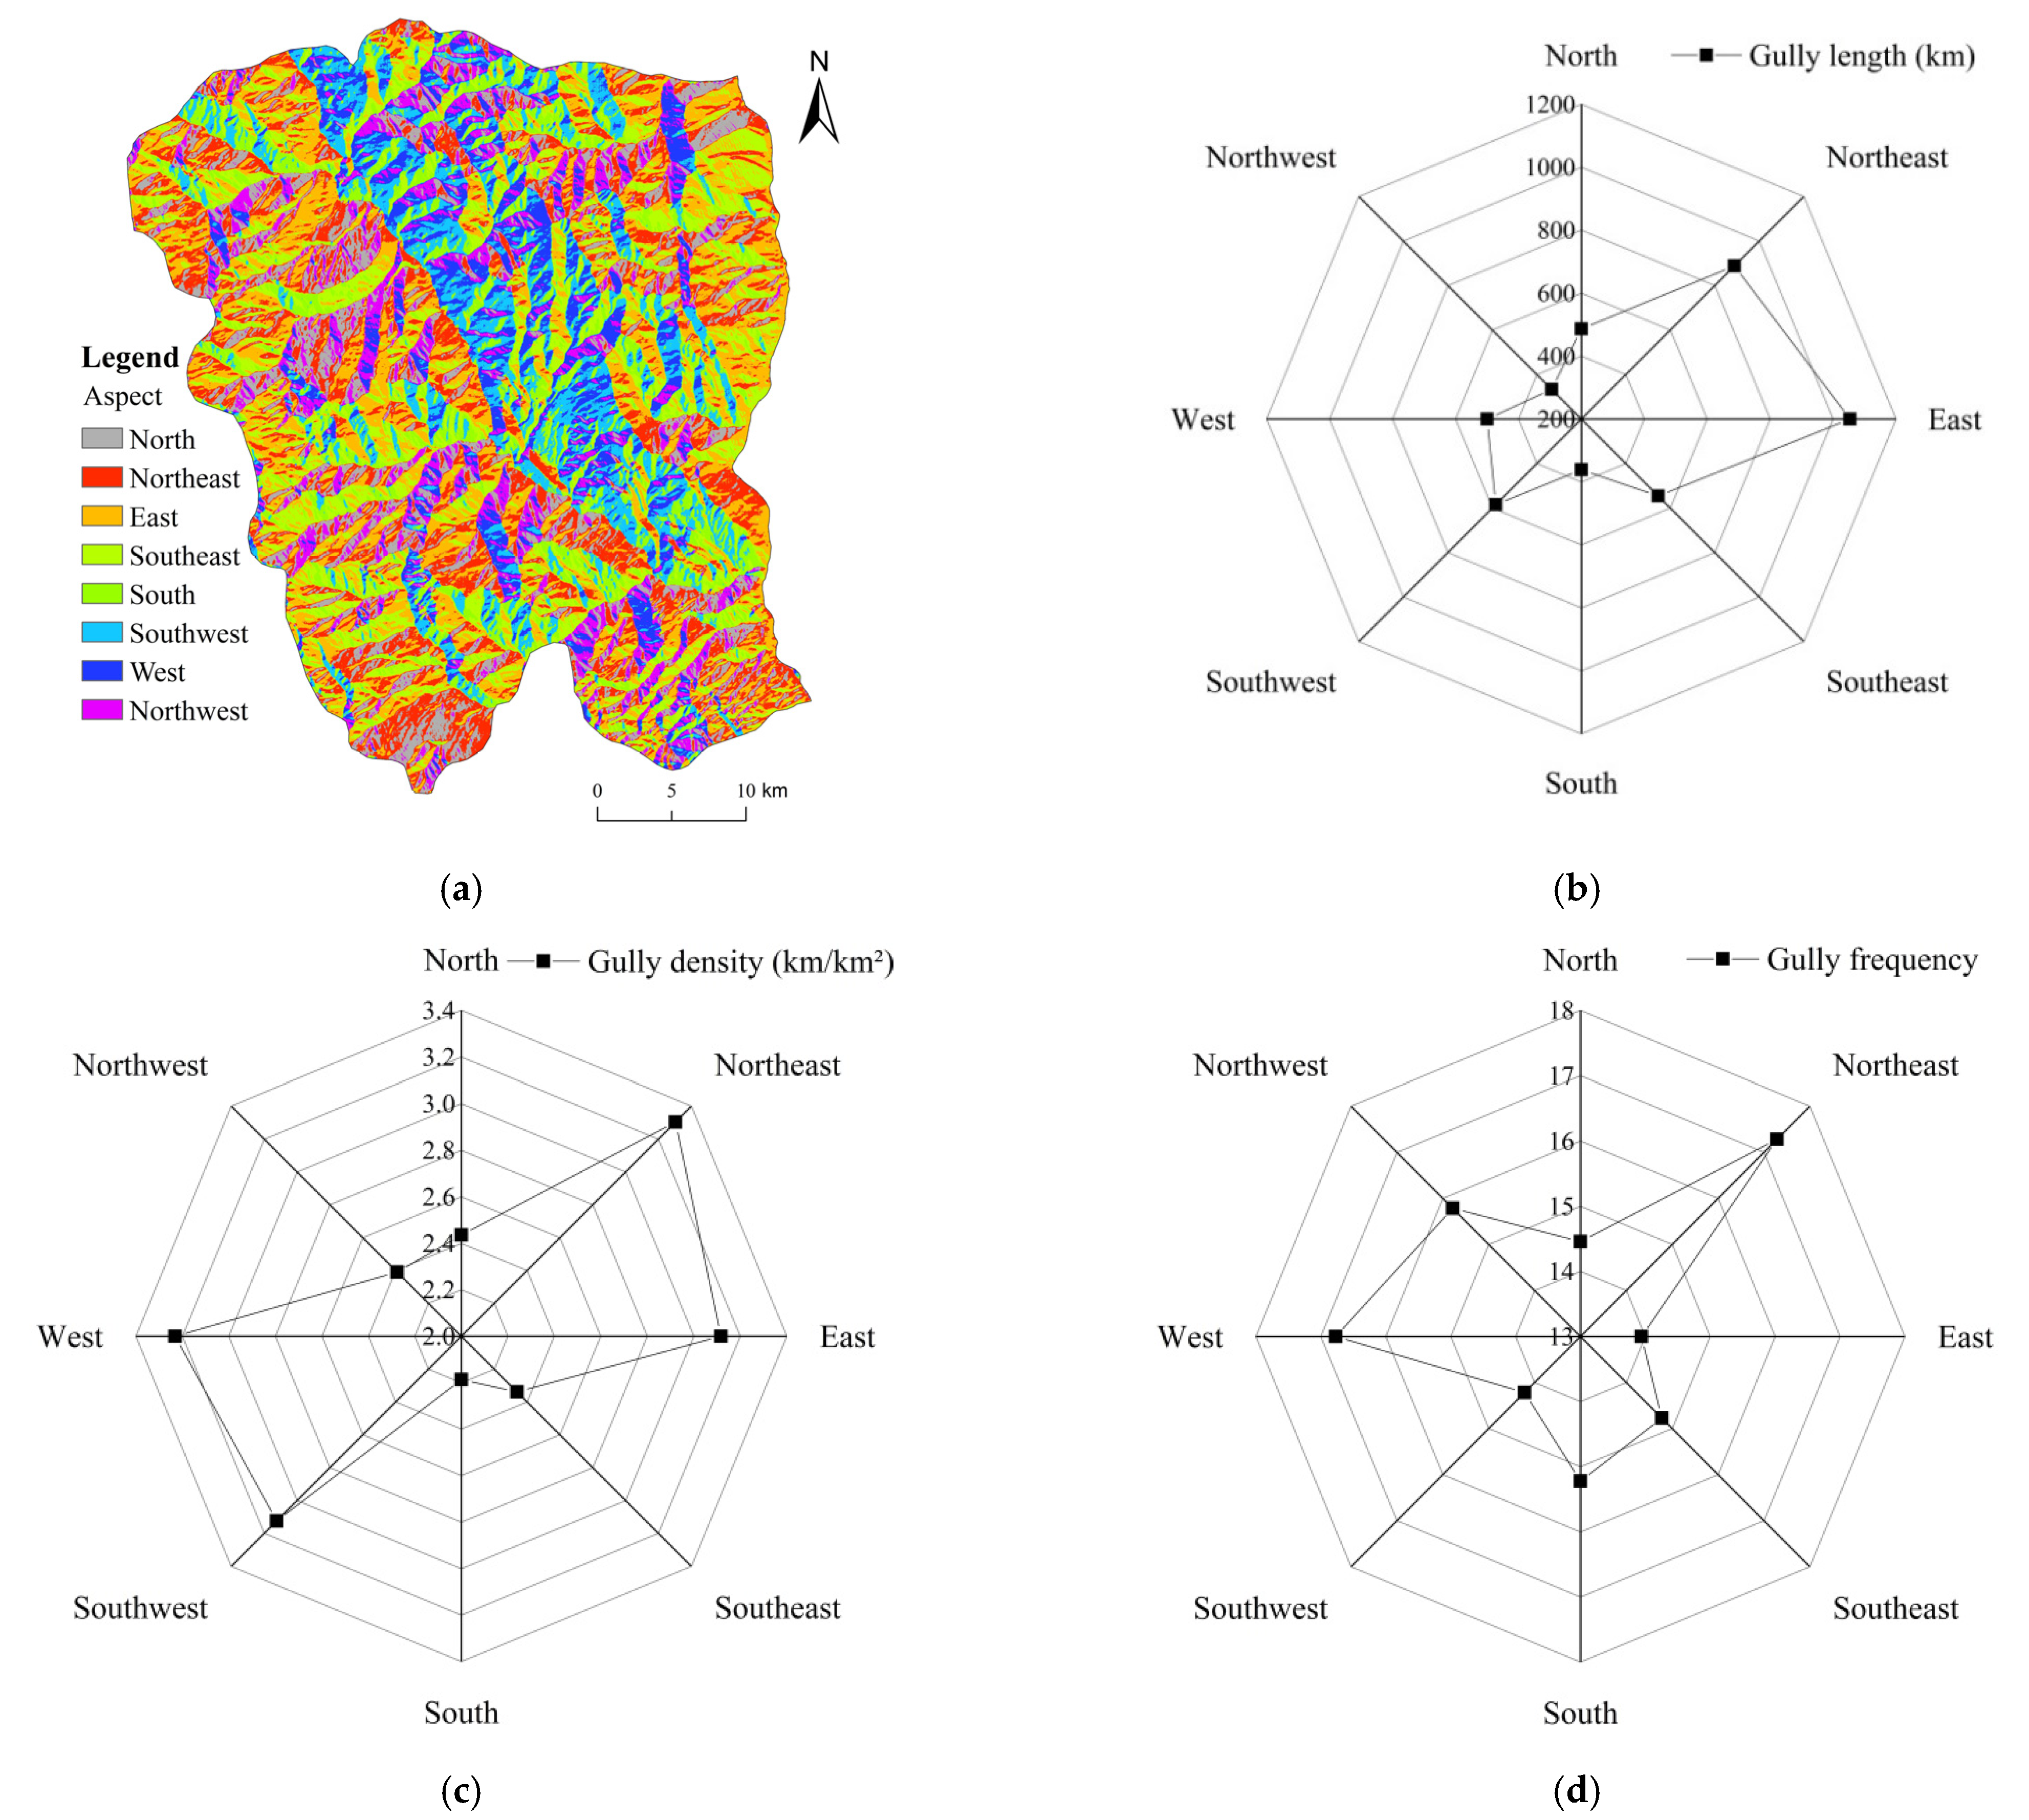
4.3.3. Aspect
4.3.4. Relief
4.3.5. Dissection
4.4. Correlations between Topographic Factors and Gully Parameters
5. Discussion
5.1. Influence of Topographic Factors on Gully Parameters
5.2. Influencing Factors of Gully Development
5.3. Stable and Active Gullies in Ningnan Dry-Hot Valley
6. Conclusions
Author Contributions
Funding
Institutional Review Board Statement
Informed Consent Statement
Data Availability Statement
Conflicts of Interest
References
- Ma, L.; Bu, Z.H.; Wu, Y.H.; Kerr, P.G.; Garre, S.; Xia, L.Z.; Yang, L.Z. An Integrated Quantitative Method to Simultaneously Monitor Soil Erosion and Non-Point Source Pollution in an Intensive Agricultural Area. Pedosphere 2014, 24, 674–682. [Google Scholar] [CrossRef]
- Vanmaercke, M.; Panagos, P.; Vanwalleghem, T.; Hayas, A.; Foerster, S.; Borrelli, P.; Rossi, M.; Torri, D.; Casali, J.; Borselli, L.; et al. Measuring, modelling and managing gully erosion at large scales: A state of the art. Earth-Sci. Rev. 2021, 218, 103637. [Google Scholar] [CrossRef]
- Poesen, J.; Nachtergaele, J.; Verstraeten, G.; Valentin, C. Gully erosion and environmental change: Importance and research needs. Catena 2003, 50, 91–133. [Google Scholar] [CrossRef]
- Mashi, S.A.; Yaro, A.; Jenkwe, E.D. Causes and consequences of gully erosion: Perspectives of the local people in Dangara area, Nigeria. Environ. Dev. Sustain. 2015, 17, 1–20. [Google Scholar] [CrossRef]
- Liu, G.; Zheng, F.L.; Wilson, G.V.; Xu, X.M.; Liu, C. Three decades of ephemeral gully erosion studies. Soil Tillage Res. 2021, 212, 105046. [Google Scholar] [CrossRef]
- Vandekerckhove, L.; Poesen, J.; Oostwoud Wijdenes, D.; Gyssels, G. Short-term bank gully retreat rates in Mediterranean environments. Catena 2001, 44, 133–161. [Google Scholar] [CrossRef]
- Wells, R.R.; Momm, H.G.; Rigby, J.R.; Bennett, S.J.; Bingner, R.L.; Dabney, S.M. An empirical investigation of gully widening rates in upland concentrated flows. Catena 2013, 101, 114–121. [Google Scholar] [CrossRef]
- Dong, Y.F.; Wu, Y.Q.; Qin, W.; Guo, Q.K.; Yin, Z.; Duan, X.W. The gully erosion rates in the black soil region of northeastern China: Induced by different processes and indicated by different indexes. Catena 2019, 182, 104146. [Google Scholar] [CrossRef]
- Yang, Y.; Shi, Y.Z.; Liang, X.Z.; Huang, T.T.; Fu, S.H.; Liu, B.Y. Evaluation of structure from motion (SfM) photogrammetry on the measurement of rill and interrill erosion in a typical loess. Geomorphology 2021, 385, 107734. [Google Scholar] [CrossRef]
- Bingner, R.L.; Wells, R.R.; Momm, H.G.; Rigby, J.R.; Theurer, F.D. Ephemeral gully channel width and erosion simulation technology. Nat. Hazards 2015, 80, 1949–1966. [Google Scholar] [CrossRef]
- Arabameri, A.; Nalivan, O.A.; Pal, S.C.; Chakrabortty, R.; Bui, D.T. Novel Machine Learning Approaches for Modelling the Gully Erosion Susceptibility. Remote Sens. 2020, 12, 2833. [Google Scholar] [CrossRef]
- Haimei, L.; Leichao, B.; Mingliang, L.; Zhicheng, W.; Dan, Y.; Bin, Z.; Yebin, L. A Multi-Criteria Framework for Identification of Gully Developmental Stages Based on UAV Data—A Case Study in Yuanmou County, Yunnan Province, SW China. Int. J. Environ. Res. Public Health 2022, 19, 8202. [Google Scholar] [CrossRef]
- Ballesteros Canovas, J.A.; Stoffel, M.; Martin-Duque, J.F.; Corona, C.; Lucia, A.; Bodoque, J.M.; Montgomery, D.R. Gully evolution and geomorphic adjustments of badlands to reforestation. Sci. Rep. 2017, 7, 45027. [Google Scholar] [CrossRef] [Green Version]
- Ollobarren, P.; Capra, A.; Gelsomino, A.; La Spada, C. Effects of ephemeral gully erosion on soil degradation in a cultivated area in Sicily (Italy). Catena 2016, 145, 334–345. [Google Scholar] [CrossRef]
- Deng, Q.C.; Qin, F.C.; Zhang, B.; Wang, H.P.; Luo, M.L.; Shu, C.Q.; Liu, H.; Liu, G.C. Characterizing the morphology of gully cross-sections based on PCA: A case of Yuanmou Dry-Hot Valley. Geomorphology 2015, 228, 703–713. [Google Scholar] [CrossRef]
- Li, P.F.; Mu, X.M.; Holden, J.; Wu, Y.P.; Irvine, B.; Wang, F.; Gao, P.; Zhao, G.J.; Sun, W.Y. Comparison of soil erosion models used to study the Chinese Loess Plateau. Earth-Sci. Rev. 2017, 170, 17–30. [Google Scholar] [CrossRef] [Green Version]
- Cheng, Y.; Li, J.W.; Xiong, L.Y.; Tang, G.A. Clustering gully profiles for investigating the spatial variation in landform formation on the Chinese Loess Plateau. J. Mt. Sci. 2021, 18, 2742–2760. [Google Scholar] [CrossRef]
- Jiang, C.C.; Fan, W.; Yu, N.Y.; Nan, Y.L. A New Method to Predict Gully Head Erosion in the Loess Plateau of China Based on SBAS-InSAR. Remote Sens. 2021, 13, 421. [Google Scholar] [CrossRef]
- Zhou, Y.S.; Zhang, B.; Qin, W.; Deng, Q.C.; Luo, J.; Liu, H.; Yang, D.; Wang, H.L.; Zhao, Y. Primary environmental factors controlling gully distribution at the local and regional scale: An example from Northeastern China. Int. Soil Water Conserv. Res. 2021, 9, 58–68. [Google Scholar] [CrossRef]
- Anderson, R.L.; Rowntree, K.M.; Le Roux, J.J. An interrogation of research on the influence of rainfall on gully erosion. Catena 2021, 206, 105482. [Google Scholar] [CrossRef]
- Li, Z.Y.; Fang, H.Y. Impacts of climate change on water erosion: A review. Earth-Sci. Rev. 2016, 163, 94–117. [Google Scholar] [CrossRef]
- Nearing, M.A.; Norton, L.D.; Bulgakov, D.A.; Larionov, G.A.; West, L.T.; Dontsova, K.M. Hydraulics and erosion in eroding rills. Water Resour. Res. 1997, 33, 865–876. [Google Scholar] [CrossRef]
- Jiang, C.C.; Fan, W.; Yu, N.Y.; Liu, E.L. Spatial modeling of gully head erosion on the Loess Plateau using a certainty factor and random forest model. Sci. Total Environ. 2021, 783, 147040. [Google Scholar] [CrossRef]
- Chowdhuri, I.; Pal, S.C.; Saha, A.; Chakrabortty, R.; Roy, P. Evaluation of different DEMs for gully erosion susceptibility mapping using in-situ field measurement and validation. Ecol. Inform. 2021, 65, 101425. [Google Scholar] [CrossRef]
- Amare, S.D.; Keesstra, S.D.; van der Ploeg, M.J.; Langendoen, E.J.; Steenhuis, T.S.; Tilahun, S. Causes and controlling factors of valley bottom gullies. Land 2019, 8, 141. [Google Scholar] [CrossRef] [Green Version]
- Tang, J.; Liu, G.; Xie, Y.; Dun, X.W.; Wang, D.A.; Zhang, S. Annual variation of ephemeral gully erosion in a cultivated catchment. Geoderma 2021, 401, 115166. [Google Scholar] [CrossRef]
- Zhang, T.Y.; Liu, G.; Duan, X.W.; Wilson, G.V. Spatial distribution and morphologic characteristics of gullies in the Black Soil Region of Northeast China: Hebei watershed. Phys. Geogr. 2016, 37, 228–250. [Google Scholar] [CrossRef]
- Yang, L.I.; Zhou, Y.; Lei, X.; Peilan, L.I.; Liang, C. Simulation of quantitative relationship between positive and negative topographic factors of loess based on catchment unit. J. Arid. Land Resour. Environ. 2019, 33, 78–84. [Google Scholar] [CrossRef]
- MuñOz-Robles, C.; Reid, N.; Frazier, P.; Tighe, M.; Briggs, S.V.; Wilson, B. Factors related to gully erosion in woody encroachment in south-eastern Australia. Catena 2010, 83, 148–157. [Google Scholar] [CrossRef]
- Castillo, C.; Gomez, J.A. A century of gully erosion research: Urgency, complexity and study approaches. Earth-Sci. Rev. 2016, 160, 300–319. [Google Scholar] [CrossRef]
- Zhang, B.; Fan, Z.M.; Du, Z.P.; Zheng, J.L.; Luo, J.; Wang, N.N.; Wang, Q. A Geomorphological Regionalization using the Upscaled DEM: The Beijing-Tianjin-Hebei Area, China Case Study. Sci. Rep. 2020, 10, 10532. [Google Scholar] [CrossRef]
- Arabameri, A.; Rezaie, F.; Pal, S.C.; Cerda, A.; Saha, A.; Chakrabortty, R.; Lee, S. Modelling of piping collapses and gully headcut landforms: Evaluating topographic variables from different types of DEM. Geosci. Front. 2021, 12, 135–152. [Google Scholar] [CrossRef]
- Wang, R.H.; Zhang, S.W.; Yang, J.C.; Pu, L.M.; Yang, C.B.; Yu, L.X.; Chang, L.P.; Bu, K. Integrated Use of GCM, RS, and GIS for the Assessment of Hillslope and Gully Erosion in the Mushi River Sub-Catchment, Northeast China. Sustainability 2016, 8, 317. [Google Scholar] [CrossRef]
- Arabameri, A.; Cerda, A.; Tiefenbacher, J.P. Spatial pattern analysis and prediction of gully erosion using novel hybrid model of entropy-weight of evidence. Water 2019, 11, 1129. [Google Scholar] [CrossRef] [Green Version]
- Zhao, Y.; Zhang, B.; He, Y.; Luo, J.; Wang, L.; Deng, Q.; Liu, H.; Yang, D. Influence of geological conditions on gully distribution in the Dry–hot Valley, SW China. Catena 2022, 214, 106274. [Google Scholar] [CrossRef]
- Xia, L.; Ru-Tian, B.I.; Song, X.Y.; Wei, H.U.; Chun-Juan, L.; Xu, X.I.; Huai-You, L.I. Soil moisture response to land use and topography across a semi-arid watershed: Implications for vegetation restoration on the Chinese Loess Plateau. J. Mt. Sci. 2022, 19, 18. [Google Scholar] [CrossRef]
- Chen, Z.; Li, Y.; Liu, Y.; Liu, X. Does rural residential land expansion pattern lead to different impacts on eco-environment? A case study of loess hilly and gully region, China. Habitat Int. 2021, 117, 102436. [Google Scholar] [CrossRef]
- Kong, W.; Yao, Y.; Hou, L.; Bao, K.; Zhang, L.; Wei, X. Effects of vegetation presence on soil net N mineralization are independent of landscape position and vegetation type in an eroding watershed. Agric. Ecosyst. Environ. 2022, 325, 107743. [Google Scholar] [CrossRef]
- Li, X.; Li, W.; Gao, C.; Shao, L.; Chen, G.; Wang, S. Study on the Change of Eco-Environmental Quality in Jiufeng Mountain Area Based on InVEST Model. Open J. Ecol. 2022, 12, 15. [Google Scholar] [CrossRef]
- Gao, C.D.; Li, P.F.; Hu, J.F.; Yan, L.; Latifi, H.; Yao, W.Q.; Hao, M.K.; Gao, J.J.; Dang, T.M.; Zhang, S.H. Development of gully erosion processes: A 3D investigation based on field scouring experiments and laser scanning. Remote Sens. Environ. 2021, 265, 112683. [Google Scholar] [CrossRef]
- Brecheisen, Z.S.; Richter, D.d. Gully-erosion estimation and terrain reconstruction using analyses of microtopographic roughness and LiDAR. Catena 2021, 202, 105264. [Google Scholar] [CrossRef]
- Lu, Y. Two opening-closing cycles and mineralization of the Sichuan-Yunnan meridional structural belt. J. Mineral. Petrol. 1998, 32–38. [Google Scholar] [CrossRef]
- Ministry of Natural Resources of the People’s Republic of China. Available online: https://www.mnr.gov.cn/ (accessed on 28 February 2018).
- Murtagh, F.; Legendre, P. Ward’s hierarchical agglomerative clustering method: Which algorithms implement Ward’s criterion? J. Classif. 2014, 31, 274–295. [Google Scholar] [CrossRef] [Green Version]
- Zhao, Y.; Zhang, B.; Qin, W.; Luo, J.; Liu, H.; Deng, Q.C.; Lv, W.; He, Y.L.; Wang, H.L. Spatial differentiation of gully clusters based on the regional scale: An example from northeastern China. Peerj 2020, 8, e9907. [Google Scholar] [CrossRef]
- Du, G.M.; Lei, G.P.; Zong, X.D. Analysis on pattern of gully erosion across typical black hilly region of Northeast China. Res. Soil Water Conserv. 2011, 18, 94–97, 271. [Google Scholar]
- Wei, L.; Zhang, B.; Wang, M. Effects of antecedent soil moisture on runoff and soil erosion in alley cropping systems. Agric. Water Manag. 2007, 94, 54–62. [Google Scholar] [CrossRef]
- Fu, B.J. Soil erosion and its control in the loess plateau of China. Soil Use Manag. 1989, 5, 76–82. [Google Scholar] [CrossRef]
- Majhi, A.; Nyssen, J.; Verdoodt, A. What is the best technique to estimate topographic thresholds of gully erosion? Insights from a case study on the permanent gullies of Rarh plain, India. Geomorphology 2021, 375, 107547. [Google Scholar] [CrossRef]
- Wang, D.C.; Fan, H.M. Distribution characteristics of gullies with slope gradient in Northeast China. Environ. Monit. Assess. 2019, 191, 379. [Google Scholar] [CrossRef]
- Jin, F.M.; Yang, W.C.; Fu, J.X.; Li, Z. Effects of vegetation and climate on the changes of soil erosion in the Loess Plateau of China. Sci. Total Environ. 2021, 773, 145514. [Google Scholar] [CrossRef]
- Xu, X.Z.; Xu, Y.; Chen, S.C.; Xu, S.G.; Zhang, H.W. Soil loss and conservation in the black soil region of Northeast China: A retrospective study. Environ. Sci. Policy 2010, 13, 793–800. [Google Scholar] [CrossRef]
- Li, M.J.; Li, T.Q.; Zhu, L.Q.; Meadows, M.E.; Zhu, W.B.; Zhang, S.W. Effect of Land Use Change on Gully Erosion Density in the Black Soil Region of Northeast China From 1965 to 2015: A Case Study of the Kedong County. Front. Environ. Sci. 2021, 9, 652933. [Google Scholar] [CrossRef]
- Busch, R.; Hardt, J.; Nir, N.; Schütt, B. Modeling Gully Erosion Susceptibility to Evaluate Human Impact on a Local Landscape System in Tigray, Ethiopia. Remote Sens. 2021, 13, 2009. [Google Scholar] [CrossRef]
- Egbueri, J.C.; Igwe, O.; Unigwe, C.O. Gully slope distribution characteristics and stability analysis for soil erosion risk ranking in parts of southeastern Nigeria: A case study. Environ. Earth Sci. 2021, 80, 1–19. [Google Scholar] [CrossRef]
- Maquaire, O.; Malet, J.P.; Remáìtre, A.; Locat, J.; Klotz, S.; Guillon, J. Instability conditions of marly hillslopes: Towards landsliding or gullying? The case of the Barcelonnette Basin, South East France. Eng. Geol. 2003, 70, 109–130. [Google Scholar] [CrossRef]


| Topographic Factor | Data Source and Processing Method | Classification Level |
|---|---|---|
| Elevation | Based on the 30 m-resolution DEM data of the study area. | The elevation was reclassified based on the actual situation of the study area. The elevation range of Ningnan dry-hot valley is 577.35–3833.82 m, the division range was selected as 500–3900 m and the elevation interval was 100 m. |
| Slope gradient | Using the DEM data constructed in the study area, the slope tool in the raster surface under the 3D Analyst tool module in ArcGIS 10.2 was used to extract the topographic parameter of the slope gradient in the study area. | The slope gradient range in the study area was 0–72° and the extracted slope gradient data was divided with 1° as the reclassification interval. |
| Aspect | Using the DEM data constructed in the study area, the aspect tool in the raster surface under the 3D Analyst tool module in ArcGIS 10.2 was used to extract the topographic parameter of the area aspect. | The aspects in the study area were reclassified into nine groups, 0° as true north, increasing clockwise, corresponding to the eight aspects of north, northeast, east, southeast, south, southwest, west, northwest, and flat land (without slope direction) to give a qualitative description of the different aspects. |
| Relief | Relief = maximum elevation minus minimum elevation (the difference between the highest altitude point and the lowest altitude point in the specified area). Using the ArcGIS platform, the DEM data in the study area with a rectangle as the analysis range was analyzed and the neighborhood radius was gradually increased with an equal interval of 1 m until the relief stopped increasing as they stabilized. The analysis obtained the best statistical unit of relief in this study area and then the field calculator was used to obtain the relief of the study area. | The range of relief that fell into the best statistical unit in the study area was 0–580.80 m and the raster data were reclassified and divided at 10 m intervals. |
| Dissection | Dissection = mean elevation minus minimum elevation (the difference between the average elevation of the neighborhood of a certain point on the ground and the minimum elevation of the neighborhood reflects the erosion and dissection of the ground). Using the ArcGIS platform, the DEM data in the study area with a rectangle as the analysis range was analyzed. The neighborhood radius was gradually increased with an equal interval of 1 m until the dissection stopped increasing after it stabilized. The analysis obtained the best statistical unit of dissection in this study area and then the field calculator was used to obtain the dissection of the study area. | The range of the dissection degree that fell into the best statistical unit in the study area was 0–340.77 m and the raster data were reclassified and divided at 10 m intervals. |
| Topographic Factor | Classification Range of Topographic Factors |
|---|---|
| Elevation (m) | 500–900, 900–1200, 1200–2800, 2800–3200, ≥3200 |
| Slope gradient (°) | 0–7, 7–11, 11–30, 30–38, ≥38 |
| Aspect | North, Northeast, East, Southeast, South, Southwest, West, Northwest |
| Relief (m) | 0–100, 100–180, 180–230, ≥230 |
| Dissection (m) | 0–30, 30–100, 100–140, ≥140 |
| Topographic Factor | Gully Length | Gully Density | Gully Frequency |
|---|---|---|---|
| Elevation | −0.237 | 0.278 | 0.580 ** |
| Slope gradient | −0.699 ** | 0.060 | 0.269 * |
| Aspect | −0.061 | −0.427 | −0.218 |
| Relief | −0.696 ** | 0.714 ** | 0.886 ** |
| Dissection | −0.840 ** | 0.403 * | 0.671 ** |
Publisher’s Note: MDPI stays neutral with regard to jurisdictional claims in published maps and institutional affiliations. |
© 2022 by the authors. Licensee MDPI, Basel, Switzerland. This article is an open access article distributed under the terms and conditions of the Creative Commons Attribution (CC BY) license (https://creativecommons.org/licenses/by/4.0/).
Share and Cite
Cen, Y.; Zhang, B.; Luo, J.; Deng, Q.; Liu, H.; Wang, L. Influence of Topographic Factors on the Characteristics of Gully Systems in Mountainous Areas of Ningnan Dry-Hot Valley, SW China. Int. J. Environ. Res. Public Health 2022, 19, 8784. https://doi.org/10.3390/ijerph19148784
Cen Y, Zhang B, Luo J, Deng Q, Liu H, Wang L. Influence of Topographic Factors on the Characteristics of Gully Systems in Mountainous Areas of Ningnan Dry-Hot Valley, SW China. International Journal of Environmental Research and Public Health. 2022; 19(14):8784. https://doi.org/10.3390/ijerph19148784
Chicago/Turabian StyleCen, Yuxin, Bin Zhang, Jun Luo, Qingchun Deng, Hui Liu, and Lei Wang. 2022. "Influence of Topographic Factors on the Characteristics of Gully Systems in Mountainous Areas of Ningnan Dry-Hot Valley, SW China" International Journal of Environmental Research and Public Health 19, no. 14: 8784. https://doi.org/10.3390/ijerph19148784
APA StyleCen, Y., Zhang, B., Luo, J., Deng, Q., Liu, H., & Wang, L. (2022). Influence of Topographic Factors on the Characteristics of Gully Systems in Mountainous Areas of Ningnan Dry-Hot Valley, SW China. International Journal of Environmental Research and Public Health, 19(14), 8784. https://doi.org/10.3390/ijerph19148784