Article

Prediction of Clinical Outcomes with Explainable Artificial Intelligence in Patients with Chronic Lymphocytic Leukemia

1
Department of Hematology, Oncology and Immunology, Philipps University Marburg, University Hospital Giessen and Marburg, Baldingerstrasse, 35043 Marburg, Germany
2
Department of Medicine 5, Universitätsklinikum Erlangen, Maximiliansplatz 2, 91054 Erlangen, Germany
3
Databionics, Mathematics and Computer Science, Philipps University Marburg, Hans-Meerwein-Strasse 6, 35032 Marburg, Germany
*
Author to whom correspondence should be addressed.
These authors contributed equally to this work.
Curr. Oncol. 2023, 30(2), 1903-1915; https://doi.org/10.3390/curroncol30020148
Submission received: 16 January 2023 / Accepted: 29 January 2023 / Published: 4 February 2023
(This article belongs to the Section Hematology)

Abstract

:
Background: The International Prognostic Index (IPI) is applied to predict the outcome of chronic lymphocytic leukemia (CLL) with five prognostic factors, including genetic analysis. We investigated whether multiparameter flow cytometry (MPFC) data of CLL samples could predict the outcome by methods of explainable artificial intelligence (XAI). Further, XAI should explain the results based on distinctive cell populations in MPFC dot plots. Methods: We analyzed MPFC data from the peripheral blood of 157 patients with CLL. The ALPODS XAI algorithm was used to identify cell populations that were predictive of inferior outcomes (death, failure of first-line treatment). The diagnostic ability of each XAI population was evaluated with receiver operating characteristic (ROC) curves. Results: ALPODS defined 17 populations with higher ability than the CLL-IPI to classify clinical outcomes (ROC: area under curve (AUC) 0.95 vs. 0.78). The best single classifier was an XAI population consisting of CD4+ T cells (AUC 0.78; 95% CI 0.70–0.86; p < 0.0001). Patients with low CD4+ T cells had an inferior outcome. The addition of the CD4+ T-cell population enhanced the predictive ability of the CLL-IPI (AUC 0.83; 95% CI 0.77–0.90; p < 0.0001). Conclusions: The ALPODS XAI algorithm detected highly predictive cell populations in CLL that may be able to refine conventional prognostic scores such as IPI.

1. Introduction

Chronic lymphocytic leukemia (CLL) is the most common leukemic disease in Western countries [1]. The WHO Classification for 2022 categorized CLL as a mature B-cell neoplasm [2]. CLL is diagnosed by the characteristic immunophenotype in multiparameter flow cytometry (MPFC) B-cell panels [3,4]. The prognosis of CLL is heterogeneous; some patients will not require treatment and some patients will progress quickly and some transform into high-grade lymphoma (Richter syndrome). Traditionally, the Rai and Binet classifications of CLL were used for clinical staging and to estimate the prognosis based primarily on leukemia burden [5,6]. In addition to the disease burden, genetic factors such as TP53 mutation or 17p deletion, 11q deletion, and a complex karyotype indicate a poor prognosis, while deletion of 13q14 and trisomy 12 harbors a favorable prognosis [7,8,9]. Furthermore, mutations in the NOTCH1, SF3B1, and BIRC3 genes are associated with shorter survival [10,11,12,13]. Expression of CD38 and ZAP-70 on CLL cells has been associated with unmutated IGHV and higher levels of beta2-microglobulin indicating an adverse prognosis [14,15,16,17,18,19,20].
In 2016, the International Prognostic Index for patients with chronic lymphocytic leukemia (CLL-IPI) was introduced [21]. Four prognostic subgroups based on five independent factors (TP53 status, IGHV mutational status, serum beta2-microglobulin concentration, clinical stage, and age) were defined [21]. Five-year overall survival ranges from 93.2% (low-risk CLL-IPI) to 23.3% (very-high-risk CLL-IPI) [21].
However, the five parameters of the CLL-IPI or single markers such as CD38 and ZAP-70 may not reflect the genetic, pathophysiological, and prognostic heterogeneity of the CLL at the individual level compared to structures in large and complex datasets.
The MPFC of peripheral blood from patients with CLL generates individual and complex high-dimensional data from malignant CLL cells and non-malignant surrounding white blood cells. MPCF data from CLL patients are acquired routinely for diagnostic purposes.
Dimensionality reduction techniques such as self-organizing maps (SOM) have already been applied to enhance the interpretation of MPFC data [22,23]. Furthermore, the Citrus (cluster identification, characterization, and regression) algorithm can be applied to find cell-type specific differences between groups in MPFC data [24,25].
Our group described the algorithmic population description approach (ALPODS) which is based on explainable artificial intelligence (XAI) and has been used for classification tasks. The XAI provides sample-based explanations of its decisions by visualizing the immune cell populations which were distinctive for bone marrow compared to peripheral blood [26,27]. ALPODS delivered disjunct cell populations which can be visualized in usual flow cytometry two-dimensional dot plots of FCS data files. This enables human flow cytometry operators to classify these cell populations by conventional MPCF gating.
MPFC data of diagnostic B-cell panels should include information about the individual CLL prognosis and outcome. Therefore, we used the ALPODS algorithm to identify the crucial cell populations that are overrepresented in CLL patients who experienced death or failure of the first line of systemic therapy [26].

2. Materials and Methods

2.1. Patients, Data Acquisition, and Processing

MPFC data of the peripheral blood from 157 unselected patients with CLL diagnosis were re-analyzed for this study and matched to clinical data. MPFC data were acquired for routine diagnostic analysis at the University Hospital Marburg from 2014 to 2020. The study was approved by the local ethics committee in Marburg. Clinical data included the following: CLL-IPI (i.e., TP53 mutation status, IGHV mutation status, age, Binet, beta2-microglobulin), sex, ECOG, Richter transformation, treatment, date of death, treatment failure, and last follow-up. In case of incomplete or unknown CLL-IPI parameters, half of the score points of the missing parameters were given. The patients were separated into a group with an inferior outcome and a group with a superior outcome. Patients who died during follow-up and had a failure of the first-line systemic therapy were categorized as TTF 1 (time to first-line treatment failure), that is, inferior outcome. All other patients were classified as TTF 0 which indicated a superior CLL outcome.
We used the ALPODS XAI algorithm [26] to identify cell populations in flow cytometry data that were over or underrepresented in patients with the inferior result (TTF 1) or superior outcomes (TTF 0). The predictive value of the XAI populations was compared to the frequency of CD38-positive CLL cells and CLL-IPI on the receiver operating characteristic (ROC) curves. Multiple logistic regression analysis in repeated 10 bootstrap trials was performed for the combination of more than one independent variable to predict dichotomous groups. Therefore, three randomly selected patients from each group (TTF 0 and TTF1) were left out 10 times to test if the results can be generalized for other patients.

2.2. Antigen Panel, Flow Cytometry Staining, and Analysis

For diagnosing CLL and other B-cell lymphomas we used a B-cell panel which consisted of two tubes with different fluorescence antibody panels. The first tube (T1) included fluorescence antibodies against B-cell antigens (CD19, CD20, FMC7, CD79b, CD23, light chains of kappa and lambda), T-cell antigens (CD3, CD5, CD2, CD7, CD4, CD8), and the activation marker CD38, which has been described to be prognostic for CLL [14]. The second tube (T2) contained B-cell antigens (CD19, CD20, IgM), markers of hairy-cell leukemia (CD103, CD11c, CD25), follicular lymphoma, and high-grade lymphoma (CD10), and additional markers to ensure the diagnosis of CLL (CD43, CD200). The complete antibody panel, clones, and fluorescence dyes are stated in the Supplementary Information (Table S1).
Two 5 mL polystyrene FACS tubes with fluorescence antibodies in a dried-down layer (DuraClone-Technology, Beckman Coulter, Krefeld, Germany) were incubated for 15 min at room temperature in 100 μL prewashed peripheral blood. After antibody staining, red cells were lysed in 2 mL of VersaLyse™ (Beckman Coulter, Krefeld, Germany) for 10 min, washed with 3 mL of buffered phosphate saline (PBS Biochrom, Berlin, Germany), and centrifuged with 300× g for 5 min. The cell pellet was resuspended in 500 μL PBS and measured on a Navios Flow Cytometer (Beckman Coulter, Krefeld, Germany). In total, up to 1 × 10⁵ cells were acquired.

2.3. Data Processing

The raw flow cytometry data were compensated, and log transformed. Events with very high side scatter (i.e., mainly granulocytes) were excluded to reduce the amount of data that adds little informative value. Thereafter, data were range standardized between zero and 6 based on the adapted Milligan cooper standardization [28,29]. From the total number of recorded cell events of each sample, a 1% random data set was drawn. Using this 1% sample for training ALPODS a 1000-fold cross-validation was performed. The populations that were relevant for the distinction of TTF 1 versus TTF 0 were selected from ALPODS and the most important populations were filtered using Cohen’s D effect size measure. The computed ABC analysis [30] selected optimal limits for subset division by exploiting the mathematical properties related to the distribution of the items analyzed. ABC analysis divides the data into three disjoint subsets A, B, and C, with subset A comprising very profitable values, i.e., largest data values (“the important few”), subset B comprising values where the yield equals the effort required to obtain it, and the subset C comprising of non-profitable values.

2.4. Statistics

The graphs and statistics were compiled with Excel 2016 (Microsoft Corporation, Redmond, WA, USA) and in the R package ggplot2 [31] and DataVisualizations [32], GraphPad Prism® Version 9.4.1 (GraphPad Software, San Diego, CA, USA), R (programming language), www.R-project.org (accessed on 6 October 2022).

3. Results

3.1. Patient Characteristics

From the 157 CLL patients N = 42 had inferior outcomes (death and/or first-line treatment failure) and N = 115 patients did not reach the defined endpoints (superior outcome, TTF 0). The median age of the total cohort was 68 years (range 26–91 years), and 62 (39.5%) of the patients were female and 95 (60.5%) were male. A total of 83 (52.9%) of the patients were diagnosed with Binet A, 24 (15.3%) with Binet B, and 12 (7.6%) with Binet C. Follow-up was in the median 31.5 months (interquartile range 9–65 months). Additional patient characteristics for the total cohort and separated for TTF 1 or TTF 0 are denoted in Table 1.

3.2. Cell Populations Identified by ALPODS

Standardized flow cytometry data and outcome group (TTF 1 or TTF 0) were used as input information for the ALPODS algorithm. ALPODS identified N = 17 distinctive cell populations in the MPFC data which were overrepresented (N = 14/17) or underrepresented (N = 3/17) in the TTF 1 patients’ cohort. Seven out of 17 populations were identified in the first tube (T1) of the diagnostic flow cytometry B-cell panel. Ten out of 17 populations were identified in the second tube (T2) of the B-cell panel. The workflow is depicted in Figure 1.
Mann–Whitney U test and ROC analysis were performed to detect the most predictive XAI populations for inferior outcomes. The results were listed in Table 2. XAI populations with a significant predictive ability for the outcome (TTF 1 vs. TTF 0) were verified for their prognostic value in patients with high IPI (≥4) compared to patients with low IPI (≤1) (Supplementary Information, Table S2). XAI populations with a significant predictive value for the outcome (TTF 1 vs. TTF 0) and the prognosis (IPI low vs. IPI high) were T1C0011, T1C0016, T2C0004, and T2C0018 (bold script in Table 2). Among these populations, solely T1C0016 had a higher frequency in the patients with a good outcome (TTF 0; mean 13.51% vs. 4.91%; SE of difference 1.83) and good prognosis (IPI ≤ 1; mean 12.50% vs. 5.37%; SE of difference 2.42).
In ROC curve analysis, T1C0016 had the highest predictive ability for the outcome of all XAI populations. It should be noted that only the T1C0016 population had the same predictive value as the CLL-IPI score (Table 2; both: AUC 0.78; 95% CI 0.70–0.86). Furthermore, the frequency of CD38-positive CLL cells had a lower predictive ability (AUC 0.66; 95% CI 0.57–0.76, p = 0.0018) than all verified XAI populations TC0011 (AUC 0.76; 95% CI 0.68–0.84, p < 0.0001), T1C0016 (AUC 0.78; 95% CI 0.70–0.86, p < 0.0001), T2C0004 (AUC 0.69; 95% CI 0.58–0.80, p = 0.0002), and T2C0018 (AUC 0.73; 95% CI 0.63–0.82, p < 0.0001).
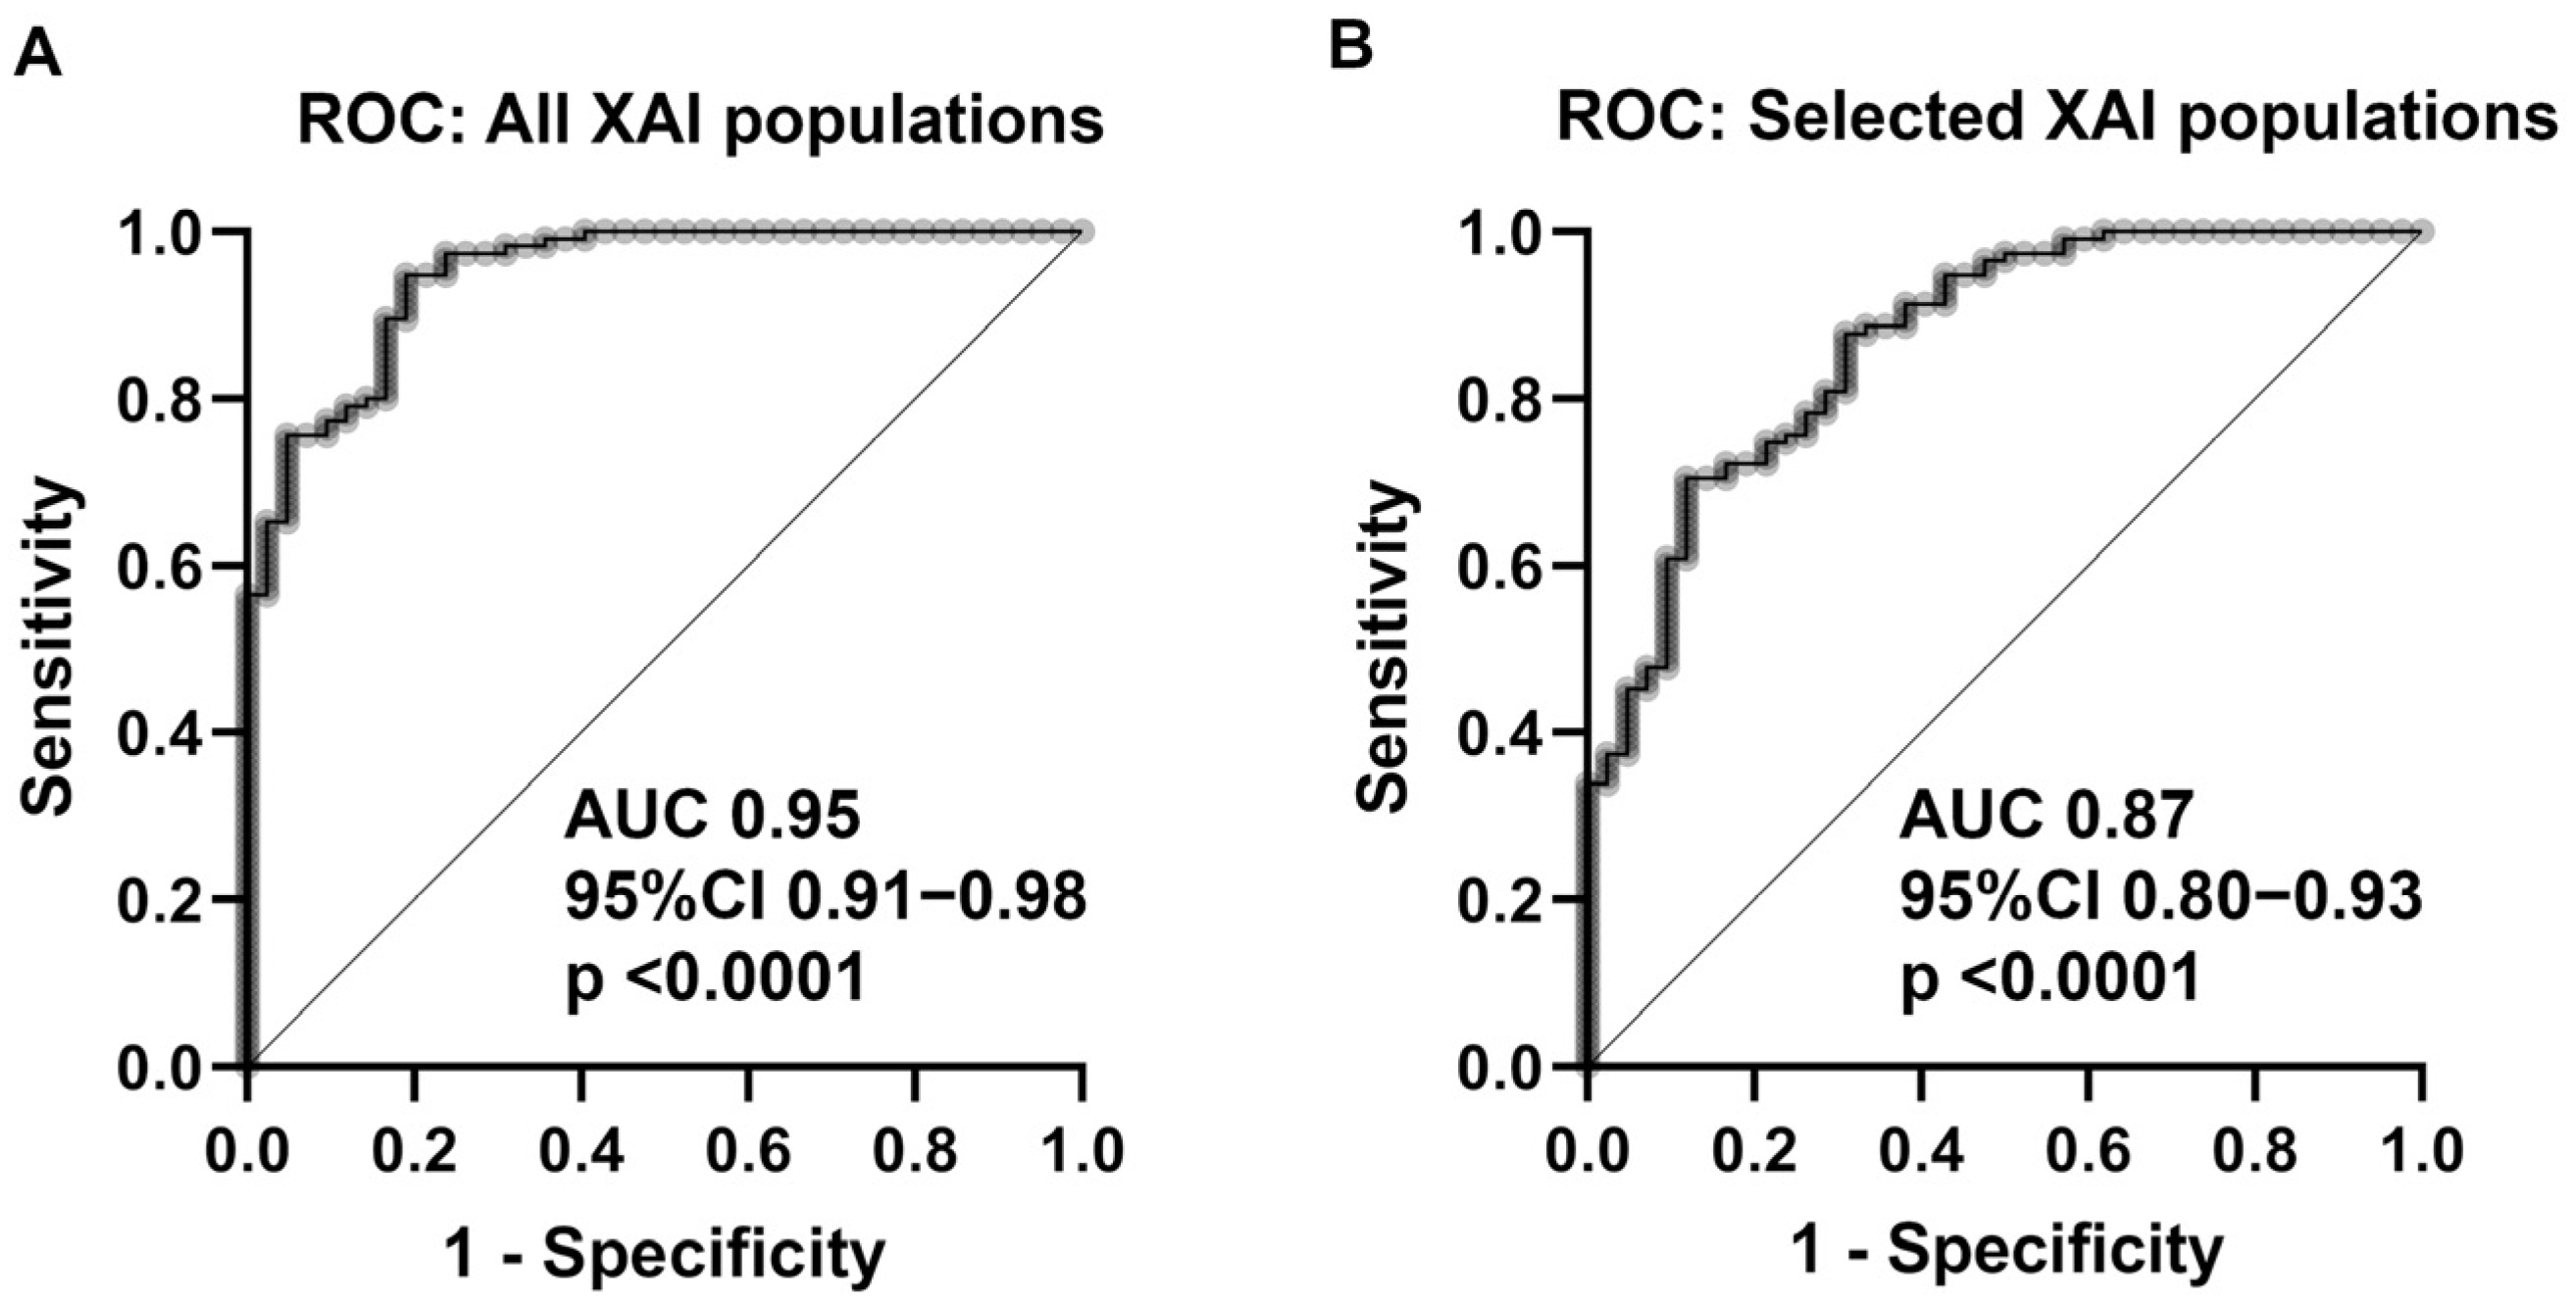
The 17 XAI populations in combination had a predictive ability of 0.95 AUC (95% CI 0.91–0.98; p < 0.0001) for TTF using multiple logistic regression analysis (Figure 2A), which was significantly higher than IPI (p = 0.0008; Hanley–McNeil test). Restriction on the four populations of XAI (that is, T1C0011, T1C0016, T2C0004, and T2C0018), which were verified to be predictive of IPI, resulted in a lower diagnostic ability of 0.87 AUC (95% CI 0.80–0.93; p < 0.0001) (Figure 2B), but still higher than the conventional IPI (AUC 0.87 vs. 0.78) in this patient cohort, although the difference did not reach statistical significance (p = 0.0771; Hanley–McNeil test).

3.3. Identification of the XAI-Populations

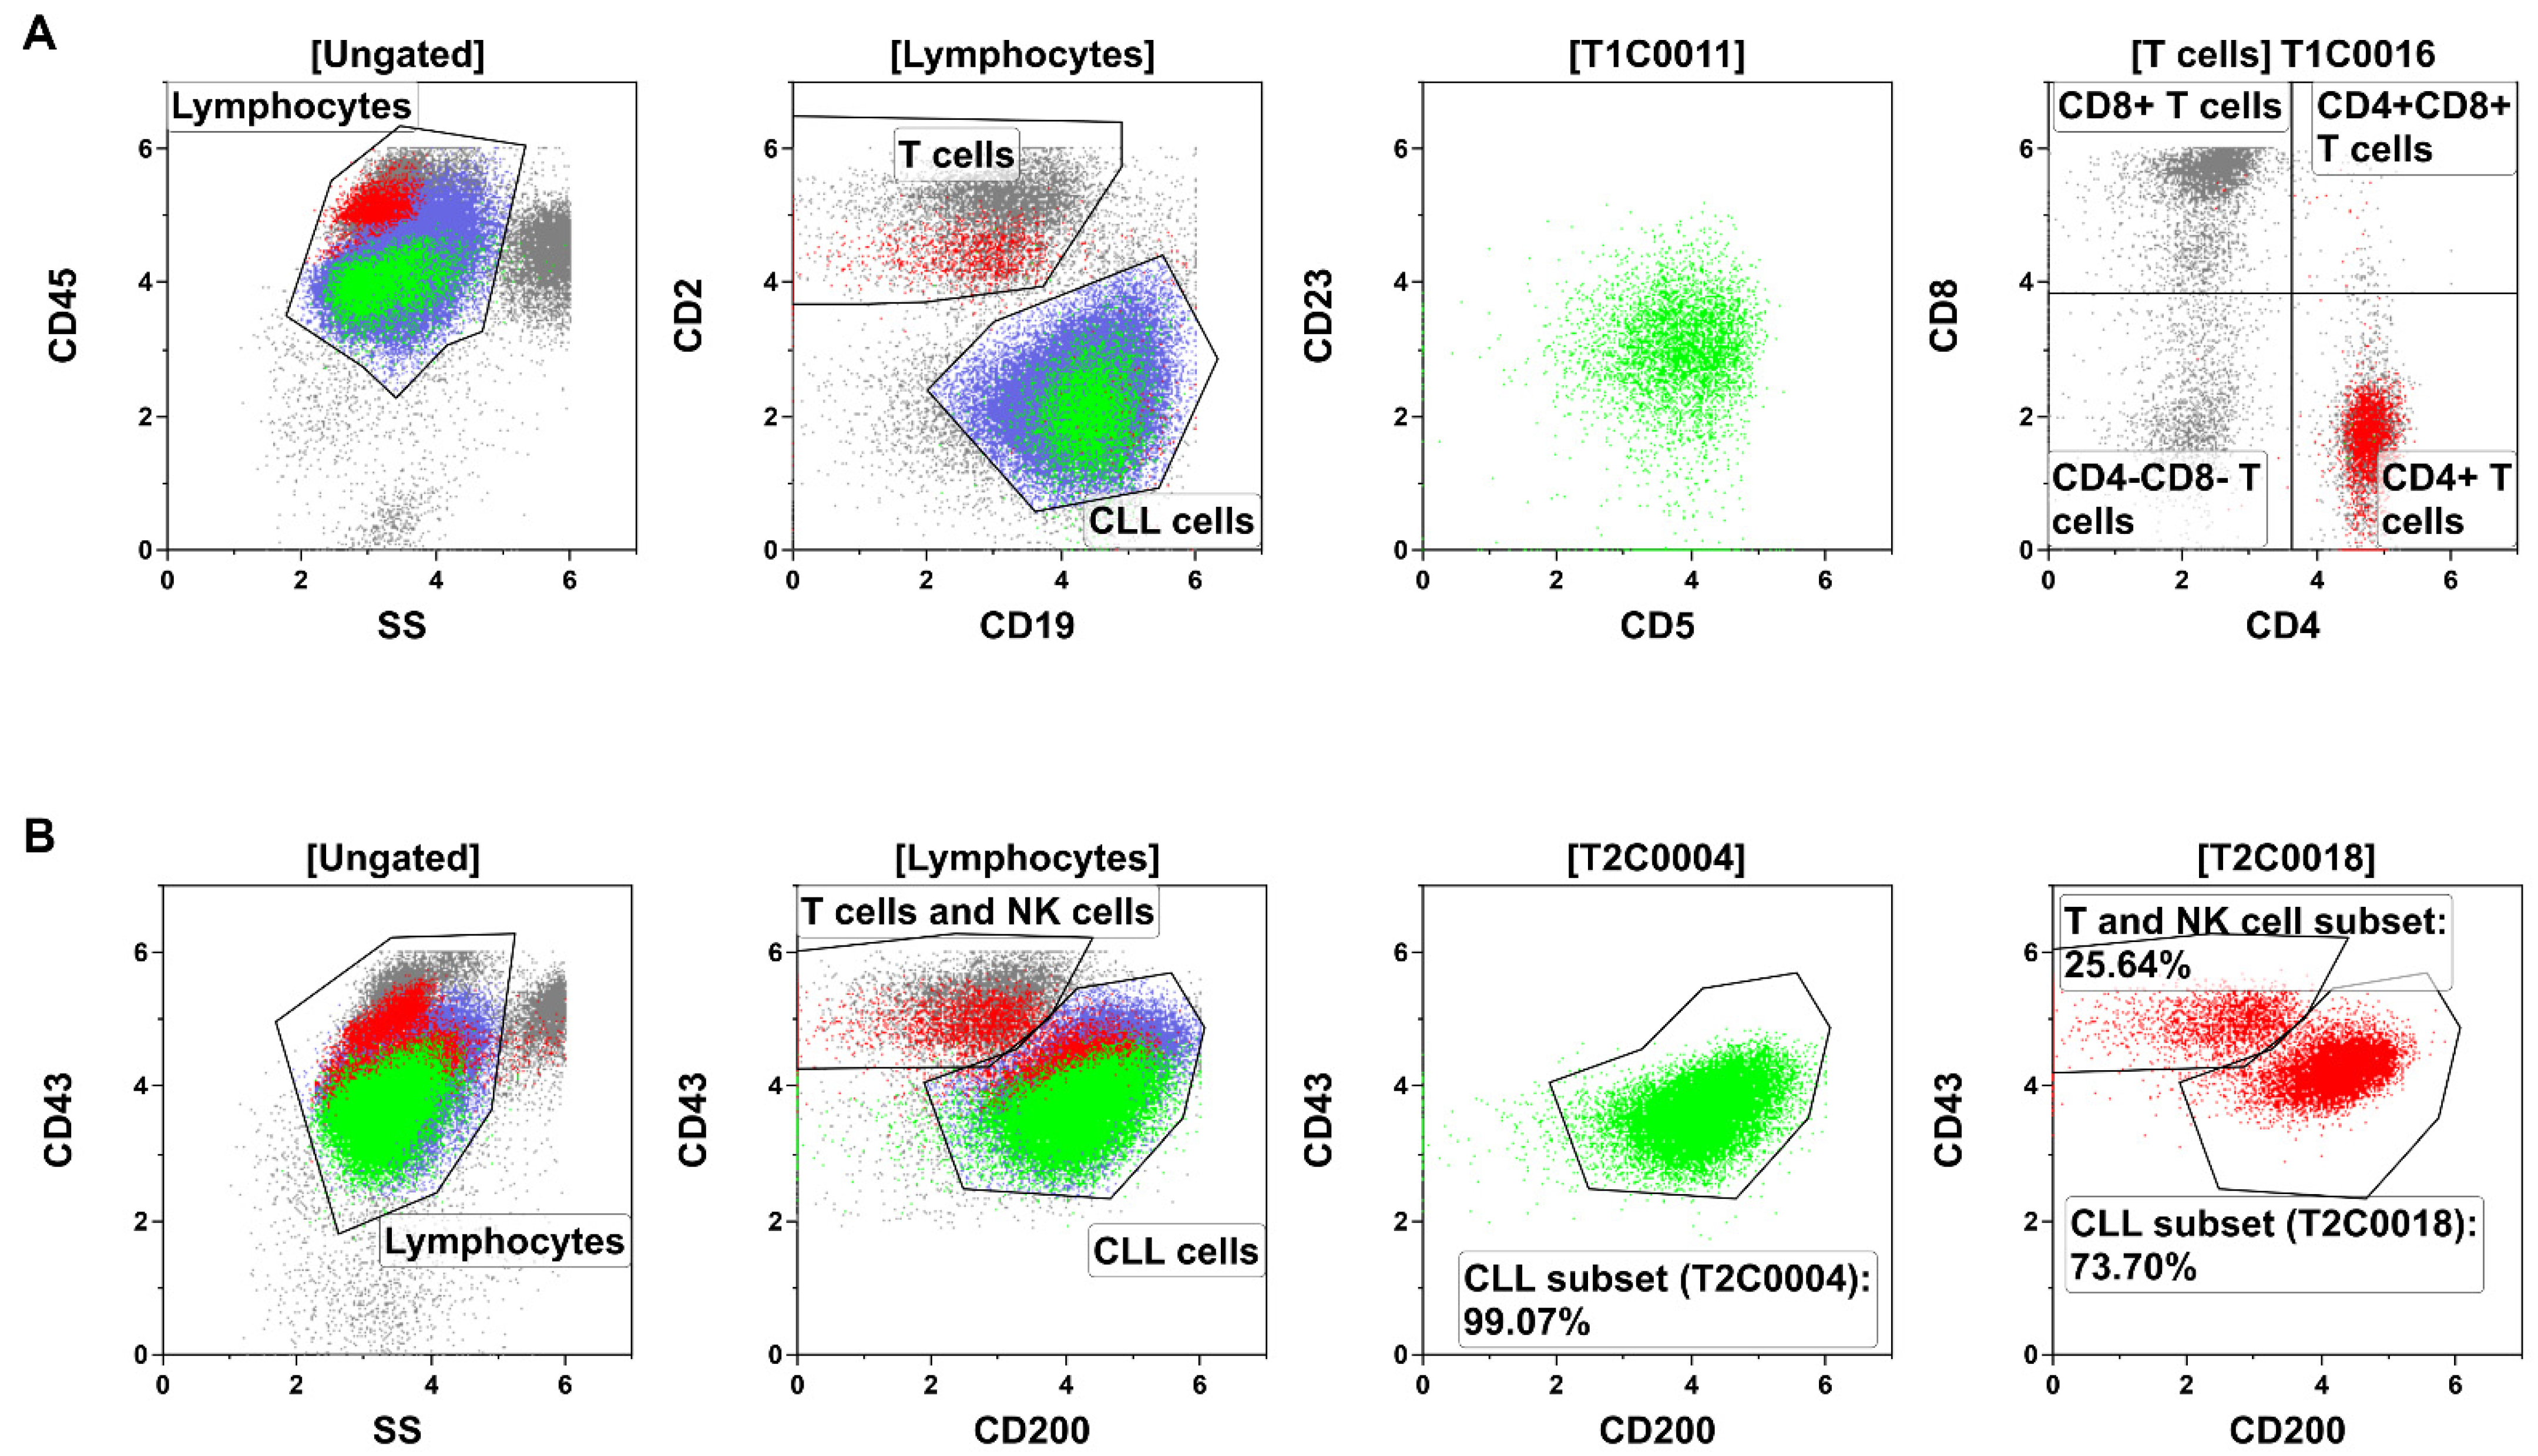
The ALPODS algorithm calculated FCS data files that can be depicted with conventional two-dimensional flow cytometry dot plots. Therefore, XAI populations can be gated and analyzed by a human flow cytometry expert. The population T1C0011 has been located within the CLL cells while T1C0016 consisted of CD4+ T cells (Figure 3A). T2C0004 represented nearly exclusively a subset of CLL cells (Figure 3B) and T2C0018 was a mixture of a CLL cell subset (higher fraction) and a T and NK cell subset (lower fraction).
Interestingly, the most relevant cell population for the outcome (T1C0016) in CLL was not part of the malignant cells but consisted of T helper cells, which were overrepresented in patients with a favorable outcome. This observation led to the question of whether increased CD8+ T cells were predictive of an inferior outcome. Indeed, we found that the XAI population T1C0023 consisted of CD8+ T cells (Supplementary Information, Figure S1). T1C0023 was significantly more abundant in patients with an inferior prognosis (IPI ≥ 4 mean 4.30% vs. IPI ≤ 1 mean 0.48; SE of difference 0.77; p < 0.00461). However, in the ROC analysis, population T1C0023 was not able to classify between TTF 1 and TTF 0 on its own (AUC 0.53; 95% CI 0.41–0.65; p = 0.5573).

3.4. Characterization of Predictive Subsets within CLL Cells

Besides T1C0016 (CD4+ T cells) and T1C0023 (CD8+ T cells), most of the XAI populations were CLL subsets (Tube 1: T1C0011, T1C0012, T1C0017, T1C0019, and T1C0020; Tube 2: T2C0002, T2C0004, T2C0009, T2C0010, T2C0014, T2C0018, and TC0020). The most crucial CLL subsets were T1C0011, T2C0004, and T2C0018, which are shown in Figure 4. Additionally, the median levels of antigen expression and scatter height for relevant subpopulations of CLL cells were compared to the median antigen expression of CLL cells from the average patient in the cohort using a heat map. (Figure 4A,B).
It is noteworthy that the populations T1C0011 and T2C0002 showed a decreased forward scatter expression and a decreased antigen brightness compared to mean CLL cells. Visualized on flow cytometry forward scatter, these populations were located partly in the area of dead and apoptotic cells CLL cells (Figure 4C). This finding suggests that a higher frequency of dead and apoptotic CLL cells is associated with a worse prognosis and outcome. In contrast, the CLL subsets T2C0004, T2C0014, T2C0018, and T2C0020 showed higher antigen expression and scatter light profile than mean CLL cells. In summary, CLL cells with small cell volume (low forward scatter) were overrepresented in MPFC data independent of the B-cell panel tube and indicated a poor outcome. On the contrary, subsets of CLL cells with large cell volumes (high forward scatter) also indicated poor outcomes.

3.5. Clinical Significance

The XAI method ALPODS identified 17 cell populations that were effective at predicting outcome. However, correct manual gating of these populations without using ALPODS is sophisticated, especially for the CLL subsets. Exceptions were the populations T1C0016 and T1C0023, which compromised CD4+ T cells and CD8+ T cells, respectively. Both populations were easy to gate manually in flow cytometry dot plots. Therefore, we tested whether T1C0016 (CD4+ T cells) and T1C0023 (CD8+ T cells) add predictive value to IPI and CD38-positive CLL cells. Multiple logistic regression was performed for this four-factor model (Table 3). Odds ratio (OR) >1 favored inferior outcome and <1 favored superior outcome.
In the four-factor model, T1C0023 (OR 1.14; 95% CI 0.95–1.77; p = 0.3305) and CD38-positive CLL cells (OR 1.01; 95% CI 1.00–1.02; p = 0.1790) were dispensable. IPI and T1C0016 (two-factor model with IPI) showed only slightly lower predictive value than the four-factor model (0.84 AUC; 95% CI 0.77–0.91; p < 0.0001 vs. 0.83 AUC; 95% CI 0.77–0.90; p < 0.0001). In the two-factor model (IPI and T1C0016) IPI can be replaced by T1C0023 with an acceptable diagnostic ability (0.79 AUC; 95% CI 0.71–0.87; p < 0.0001).

4. Discussion

In this single-center study, we analyzed immunophenotypes of 157 CLL patients employing an explainable AI (XAI). The XAI identified 17 cell populations in MPFC data which could in combination predict the clinical outcome of CLL with a higher ability than CLL-IPI or the frequency of CD38-positive CLL cells. Most of the 17 cell populations were located completely or in part within the abundant CLL population. However, some cell populations were non-malignant. For example, the T1C0016 population consisted of CD4+ T cells entirely and was underrepresented in patients with a poorer outcome. T1C0016 (CD4+ T cells) was the best single classifier for the outcome of the 17 XAI-identified cell populations. In contrast, T1C0023 compromised CD8+ T cells that were overrepresented in patients with inferior outcomes.
T cells in CLL have been described as dysregulated. CD4+ T cells and CD8+ T cells in patients with CLL deviate from healthy individuals by the accumulation of memory T cells and loss of naïve T cells, increased expression of immune checkpoint receptors (i.e., PD1, TIGIT, CTLA-4), and increased activation [33,34,35,36,37,38]. Inversion of the CD4/CD8 ratio is typical for CLL [39,40,41,42]. Furthermore, Elston et al. showed that patients with a CD4/CD8 ratio >1 have better overall survival and progression-free survival [34]. This is in line with our findings that CD4+ T cells indicated a good outcome and CD8+ T cells an adverse outcome. It would be of interest in further studies to determine which subset of CD4+ cells plays the most significant role in favorable outcomes for patients with CLL. Gating of CD4+ T cells and CD8+ T cells is simple in contrast to XAI populations of CLL subsets and transferrable to other flow cytometry panels that include antibodies against CD4 and CD8. For this reason, we developed a simplified approach to predict the outcome in CLL by the combination of IPI and CD4+ T cells or CD4+ T cells and CD8+ T cells. Both two-factor models discriminate between inferior and superior outcomes in more than 80% of the CLL cases.
In addition to diagnostic ability, the XAI populations provided insight into the immunopathology of CLL. For example, we showed that CLL subsets that predict inferior outcomes were small apoptotic/dead CLL events (T1C0011, T2C0002) with low forward scatter. These results are in line with Witkowska et al. and Jahrsdörfer et al. who described that spontaneous in vitro apoptosis of CLL cells correlated with disease progression and cytogenetics with worse prognosis [43,44].
On other hand, CLL subsets with high forward and side scatter (T2C0004, T2C0014, T2C0018, and T2C0020) were associated with adverse outcomes as well. Forward and side scatter correlates with bigger cell size and internal complexity and suggests the prognostic importance of prolymphocytes in CLL. Oscier et al. described that prolymphocytes >10% in CLL are associated with shorter OS and PFS [45].
There are limitations in this study, as some patients did not have complete data for all components of the IPI. In these cases, a half-point score was assigned, which may result in the inaccurate categorization of some patients. A larger patient cohort is warranted to validate our discoveries in multivariate Cox regression models. This would also allow a better clue, if the results are independent of different treatment strategies. Furthermore, an analysis of other prognostic markers for CLL, such as CD49d and ZAP-70, would strengthen the conclusions of the study [46]. However, in addition to the established markers that have been shown to have prognostic value in CLL, our XAI study provides new insights into the prognostic factors related to the immunology of CLL and the non-malignant, reactive immune system.

5. Conclusions

The ALPODS XAI algorithm identified and described highly predictive immune cell populations related to outcomes in CLL. In particular, CD4+ T cells were identified as the best single classifier and improved the predictive ability of CLL-IPI. These findings should be further refined with a different immunophenotyping panel and an independent patient cohort.

Supplementary Materials

The following supporting information can be downloaded at: https://www.mdpi.com/article/10.3390/curroncol30020148/s1, Table S1: Fluorochrome, antigens, and antibody clones; Table S2: IPI prediction of the XAI populations; Table S3: Multicollinearity analysis of the four-factor model; Figure S1: T1C0023 (CD8+ T cells).; Figure S2: Kaplan–Meyer curve.

Author Contributions

Conceptualization, J.H. and C.B.; methodology, M.C.T. and A.U. formal analysis, S.E. and M.C.T.; investigation, J.H. and S.E.; resources, C.B. and A.N.; data curation, S.E.; writing—original draft preparation, J.H.; writing—review and editing, S.E., M.C.T., C.B., A.N., C.W., A.U. and S.W.K.; supervision, A.N., A.U. and S.W.K.; project administration, C.W.; funding acquisition, A.N., J.H. and C.B. All authors have read and agreed to the published version of the manuscript.

Funding

This work was supported in part by the Deutsche José Carreras Leukämie-Stiftungunder the Grants AH 06-01, 15 R/2020 and in part by a research grant from the University Medical Center Giessen and Marburg (UKGM).

Institutional Review Board Statement

The study was conducted in accordance with the Declaration of Helsinki, and approved by the Ethics Committee of Philipps University (ek_mr_19_10_2020).

Informed Consent Statement

Patient consent was waived because flow cytometry data were acquired and recorded for routine diagnostic purposes and data were anonymized and retrospectively analyzed.

Data Availability Statement

Not applicable.

Acknowledgments

We thank Andrea Gruen, Ute Niebergall, and Ute Meissauer for their technical assistance.

Conflicts of Interest

The authors declare that they have no conflicts of interest. The funders had no role in the design of the study, in the collection, analyses, or interpretation of data, in the writing of the manuscript, or in the decision to publish the results.

References

  1. Swerdlow, S.H.; Campo, E.; Pileri, S.A.; Harris, N.L.; Stein, H.; Siebert, R.; Advani, R.; Ghielmini, M.; Salles, G.A.; Zelenetz, A.D.; et al. The 2016 Revision of the World Health Organization Classification of Lymphoid Neoplasms. Blood 2016, 127, 2375–2390. [Google Scholar] [CrossRef] [PubMed]
  2. Alaggio, R.; Amador, C.; Anagnostopoulos, I.; Attygalle, A.D.; de Oliveira Araujo, I.B.; Berti, E.; Bhagat, G.; Borges, A.M.; Boyer, D.; Calaminici, M.; et al. The 5th Edition of the World Health Organization Classification of Haematolymphoid Tumours: Lymphoid Neoplasms. Leukemia 2022, 36, 1720–1748. [Google Scholar] [CrossRef] [PubMed]
  3. Matutes, E.; Owusu-Ankomah, K.; Morilla, R.; Garcia Marco, J.; Houlihan, A.; Que, T.H.; Catovsky, D. The Immunological Profile of B-Cell Disorders and Proposal of a Scoring System for the Diagnosis of CLL. Leukemia 1994, 8, 1640–1645. [Google Scholar] [PubMed]
  4. Hoffmann, J.; Rother, M.; Kaiser, U.; Thrun, M.C.; Wilhelm, C.; Gruen, A.; Niebergall, U.; Meissauer, U.; Neubauer, A.; Brendel, C. Determination of CD43 and CD200 Surface Expression Improves Accuracy of B-Cell Lymphoma Immunophenotyping. Cytom. B Clin. Cytom. 2020, 98, 476–482. [Google Scholar] [CrossRef] [PubMed]
  5. Rai, K.R.; Sawitsky, A.; Cronkite, E.P.; Chanana, A.D.; Levy, R.N.; Pasternack, B.S. Clinical Staging of Chronic Lymphocytic Leukemia. Blood 1975, 46, 219–234. [Google Scholar] [CrossRef] [PubMed]
  6. Binet, J.L.; Auquier, A.; Dighiero, G.; Chastang, C.; Piguet, H.; Goasguen, J.; Vaugier, G.; Potron, G.; Colona, P.; Oberling, F.; et al. A New Prognostic Classification of Chronic Lymphocytic Leukemia Derived from a Multivariate Survival Analysis. Cancer 1981, 48, 198–206. [Google Scholar] [CrossRef] [PubMed]
  7. Döhner, H.; Stilgenbauer, S.; Benner, A.; Leupolt, E.; Kröber, A.; Bullinger, L.; Döhner, K.; Bentz, M.; Lichter, P. Genomic Aberrations and Survival in Chronic Lymphocytic Leukemia. N. Engl. J. Med. 2000, 343, 1910–1916. [Google Scholar] [CrossRef]
  8. Cramer, P.; Hallek, M. Prognostic Factors in Chronic Lymphocytic Leukemia—What Do We Need to Know? Nat. Rev. Clin. Oncol. 2011, 8, 38–47. [Google Scholar] [CrossRef]
  9. Zenz, T.; Benner, A.; Döhner, H.; Stilgenbauer, S. Chronic Lymphocytic Leukemia and Treatment Resistance in Cancer: The Role of the P53 Pathway. Cell Cycle 2008, 7, 3810–3814. [Google Scholar] [CrossRef]
  10. Wang, L.; Lawrence, M.S.; Wan, Y.; Stojanov, P.; Sougnez, C.; Stevenson, K.; Werner, L.; Sivachenko, A.; DeLuca, D.S.; Zhang, L.; et al. SF3B1 and Other Novel Cancer Genes in Chronic Lymphocytic Leukemia. N. Engl. J. Med. 2011, 365, 2497–2506. [Google Scholar] [CrossRef]
  11. Rossi, D.; Rasi, S.; Fabbri, G.; Spina, V.; Fangazio, M.; Forconi, F.; Marasca, R.; Laurenti, L.; Bruscaggin, A.; Cerri, M.; et al. Mutations of NOTCH1 Are an Independent Predictor of Survival in Chronic Lymphocytic Leukemia. Blood 2012, 119, 521–529. [Google Scholar] [CrossRef]
  12. Puente, X.S.; López-Otín, C. The Evolutionary Biography of Chronic Lymphocytic Leukemia. Nat. Genet. 2013, 45, 229–231. [Google Scholar] [CrossRef] [PubMed]
  13. Baliakas, P.; Hadzidimitriou, A.; Sutton, L.-A.; Rossi, D.; Minga, E.; Villamor, N.; Larrayoz, M.; Kminkova, J.; Agathangelidis, A.; Davis, Z.; et al. Recurrent Mutations Refine Prognosis in Chronic Lymphocytic Leukemia. Leukemia 2015, 29, 329–336. [Google Scholar] [CrossRef] [PubMed]
  14. Damle, R.N.; Wasil, T.; Fais, F.; Ghiotto, F.; Valetto, A.; Allen, S.L.; Buchbinder, A.; Budman, D.; Dittmar, K.; Kolitz, J.; et al. Ig V Gene Mutation Status and CD38 Expression As Novel Prognostic Indicators in Chronic Lymphocytic Leukemia. Blood 1999, 94, 1840–1847. [Google Scholar] [CrossRef] [PubMed]
  15. Hamblin, T.J.; Orchard, J.A.; Ibbotson, R.E.; Davis, Z.; Thomas, P.W.; Stevenson, F.K.; Oscier, D.G. CD38 Expression and Immunoglobulin Variable Region Mutations Are Independent Prognostic Variables in Chronic Lymphocytic Leukemia, but CD38 Expression May Vary during the Course of the Disease. Blood 2002, 99, 1023–1029. [Google Scholar] [CrossRef]
  16. Hamblin, T.J.; Davis, Z.; Gardiner, A.; Oscier, D.G.; Stevenson, F.K. Unmutated Ig VH Genes Are Associated With a More Aggressive Form of Chronic Lymphocytic Leukemia. Blood 1999, 94, 1848–1854. [Google Scholar] [CrossRef]
  17. Kröber, A.; Seiler, T.; Benner, A.; Bullinger, L.; Brückle, E.; Lichter, P.; Döhner, H.; Stilgenbauer, S. VH Mutation Status, CD38 Expression Level, Genomic Aberrations, and Survival in Chronic Lymphocytic Leukemia. Blood 2002, 100, 1410–1416. [Google Scholar] [CrossRef]
  18. Rassenti, L.Z.; Jain, S.; Keating, M.J.; Wierda, W.G.; Grever, M.R.; Byrd, J.C.; Kay, N.E.; Brown, J.R.; Gribben, J.G.; Neuberg, D.S.; et al. Relative Value of ZAP-70, CD38, and Immunoglobulin Mutation Status in Predicting Aggressive Disease in Chronic Lymphocytic Leukemia. Blood 2008, 112, 1923–1930. [Google Scholar] [CrossRef]
  19. Schroers, R.; Griesinger, F.; Trümper, L.; Haase, D.; Kulle, B.; Klein-Hitpass, L.; Sellmann, L.; Dührsen, U.; Dürig, J. Combined Analysis of ZAP-70 and CD38 Expression as a Predictor of Disease Progression in B-Cell Chronic Lymphocytic Leukemia. Leukemia 2005, 19, 750–758. [Google Scholar] [CrossRef]
  20. Heintel, D.; Schwarzinger, I.; Chizzali-Bonfadin, C.; Thalhammer, R.; Schwarzmeier, J.; Fritzer-Szekeres, M.; Weltermann, A.; Simonitsch, I.; Lechner, K.; Jaeger, U. Association of CD38 Antigen Expression with Other Prognostic Parameters in Early Stages of Chronic Lymphocytic Leukemia. Leuk. Lymphoma 2001, 42, 1315–1321. [Google Scholar] [CrossRef]
  21. International CLL-IPI Working Group. An International Prognostic Index for Patients with Chronic Lymphocytic Leukaemia (CLL-IPI): A Meta-Analysis of Individual Patient Data. Lancet Oncol. 2016, 17, 779–790. [Google Scholar] [CrossRef]
  22. Van Gassen, S.; Callebaut, B.; Van Helden, M.J.; Lambrecht, B.N.; Demeester, P.; Dhaene, T.; Saeys, Y. FlowSOM: Using Self-Organizing Maps for Visualization and Interpretation of Cytometry Data. Cytom. A 2015, 87, 636–645. [Google Scholar] [CrossRef]
  23. Saeys, Y.; Van Gassen, S.; Lambrecht, B.N. Computational Flow Cytometry: Helping to Make Sense of High-Dimensional Immunology Data. Nat. Rev. Immunol. 2016, 16, 449–462. [Google Scholar] [CrossRef] [PubMed]
  24. Bruggner, R.V.; Bodenmiller, B.; Dill, D.L.; Tibshirani, R.J.; Nolan, G.P. Automated Identification of Stratifying Signatures in Cellular Subpopulations. Proc. Natl. Acad. Sci. USA 2014, 111, E2770–E2777. [Google Scholar] [CrossRef] [PubMed]
  25. Polikowsky, H.G.; Drake, K.A. Supervised Machine Learning with CITRUS for Single Cell Biomarker Discovery. In Mass Cytometry: Methods and Protocols; McGuire, H.M., Ashhurst, T.M., Eds.; Methods in Molecular Biology; Springer: New York, NY, USA, 2019; pp. 309–332. ISBN 978-1-4939-9454-0. [Google Scholar]
  26. Ultsch, A.; Hoffmann, J.; Röhnert, M.; Von Bonin, M.; Oelschlägel, U.; Brendel, C.; Thrun, M.C. An Explainable AI System for the Diagnosis of High Dimensional Biomedical Data. arXiv Prepr. 2021, arXiv:2107.01820. [Google Scholar]
  27. Hoffmann, J.; Thrun, M.C.; Röhnert, M.A.; von Bonin, M.; Oelschlägel, U.; Neubauer, A.; Ultsch, A.; Brendel, C. Identification of Critical Hemodilution by Artificial Intelligence in Bone Marrow Assessed for MRD Analysis in Acute Myeloid Leukemia: The Cinderella Method. Cytom. Part A J. Int. Soc. Anal. Cytol. 2022. [Google Scholar] [CrossRef] [PubMed]
  28. Milligan, G.W.; Cooper, M.C. A Study of Standardization of Variables in Cluster Analysis. J. Classif. 1988, 5, 181–204. [Google Scholar] [CrossRef]
  29. Thrun, M. Projection-Based Clustering through Self-Organization and Swarm Intelligence: Combining Cluster Analysis with the Visualization of High-Dimensional Data; Springer Nature: Berlin/Heidelberg, Germany, 2018; ISBN 978-3-658-20540-9. [Google Scholar]
  30. Ultsch, A.; Lötsch, J. Computed ABC Analysis for Rational Selection of Most Informative Variables in Multivariate Data. PLoS ONE 2015, 10, e0129767. [Google Scholar] [CrossRef]
  31. Wickham, H. Ggplot2. WIREs Comput. Stat. 2011, 3, 180–185. [Google Scholar] [CrossRef]
  32. Thrun, M.C.; Gehlert, T.; Ultsch, A. Analyzing the Fine Structure of Distributions. PLoS ONE 2020, 15, e0238835. [Google Scholar] [CrossRef]
  33. Catakovic, K.; Gassner, F.J.; Ratswohl, C.; Zaborsky, N.; Rebhandl, S.; Schubert, M.; Steiner, M.; Gutjahr, J.C.; Pleyer, L.; Egle, A.; et al. TIGIT Expressing CD4+T Cells Represent a Tumor-Supportive T Cell Subset in Chronic Lymphocytic Leukemia. OncoImmunology 2018, 7, e1371399. [Google Scholar] [CrossRef] [PubMed]
  34. Elston, L.; Fegan, C.; Hills, R.; Hashimdeen, S.S.; Walsby, E.; Henley, P.; Pepper, C.; Man, S. Increased Frequency of CD4+PD-1+HLA-DR+ T Cells Is Associated with Disease Progression in CLL. Br. J. Haematol. 2020, 188, 872–880. [Google Scholar] [CrossRef] [PubMed]
  35. Palma, M.; Gentilcore, G.; Heimersson, K.; Mozaffari, F.; Näsman-Glaser, B.; Young, E.; Rosenquist, R.; Hansson, L.; Österborg, A.; Mellstedt, H. T Cells in Chronic Lymphocytic Leukemia Display Dysregulated Expression of Immune Checkpoints and Activation Markers. Haematologica 2017, 102, 562–572. [Google Scholar] [CrossRef]
  36. Tötterman, T.H.; Carlsson, M.; Simonsson, B.; Bengtsson, M.; Nilsson, K. T-Cell Activation and Subset Patterns Are Altered in B-CLL and Correlate With the Stage of the Disease. Blood 1989, 74, 786–792. [Google Scholar] [CrossRef] [PubMed]
  37. Peller, S.; Kaufman, S. Decreased CD45RA T Cells in B-Cell Chronic Lymphatic Leukemia Patients: Correlation With Disease Stage. Blood 1991, 78, 1569–1573. [Google Scholar] [CrossRef]
  38. Serrano, D.; Monteiro, J.; Allen, S.L.; Kolitz, J.; Schulman, P.; Lichtman, S.M.; Buchbinder, A.; Vinciguerra, V.P.; Chiorazzi, N.; Gregersen, P.K. Clonal Expansion within the CD4+CD57+ and CD8+CD57+ T Cell Subsets in Chronic Lymphocytic Leukemia. J. Immunol. 1997, 158, 1482–1489. [Google Scholar] [CrossRef]
  39. Matutes, E.; Wechsler, A.; Gomez, R.; Cherchi, M.; Catovsky, D. Unusual T-Cell Phenotype in Advanced B-Chronic Lymphocytic Leukaemia. Br. J. Haematol. 1981, 49, 635–642. [Google Scholar] [CrossRef] [PubMed]
  40. Mills, K.H.G.; Cawley, J.C. Suppressor t Cells in B-Cell Chronic Lymphocytic Leukaemia: Relationship to Clinical Stage. Leuk. Res. 1982, 6, 653–657. [Google Scholar] [CrossRef]
  41. Mittelman, A.; Denny, T.; Gebhard, D.; Cirrincione, C.; Kurland, E.; Koziner, B. Analysis of T-Cell Subsets in B-Cell Chronic Lymphocytic Leukemia: A Correlation with the Stage of Disease. Am. J. Hematol. 1984, 16, 67–73. [Google Scholar] [CrossRef]
  42. Platsoucas, C.D.; Galinski, M.; Kempin, S.; Reich, L.; Clarkson, B.; Good, R.A. Abnormal T Lymphocyte Subpopulations in Patients with B Cell Chronic Lymphocytic Leukemia: An Analysis by Monoclonal Antibodies. J. Immunol. 1982, 129, 2305–2312. [Google Scholar] [CrossRef]
  43. Witkowska, M.; Nowak, W.; Cebula-Obrzut, B.; Majchrzak, A.; Medra, A.; Robak, T.; Smolewski, P. Spontaneous in Vitro Apoptosis of de Novo Chronic Lymphocytic Leukemia Cells Correlates with Risk of the Disease Progression. Cytom. B Clin. Cytom. 2014, 86, 410–417. [Google Scholar] [CrossRef] [PubMed]
  44. Jahrsdörfer, B.; Wooldridge, J.E.; Blackwell, S.E.; Taylor, C.M.; Link, B.K.; Weiner, G.J. Good Prognosis Cytogenetics in B-Cell Chronic Lymphocytic Leukemia Is Associated in Vitro with Low Susceptibility to Apoptosis and Enhanced Immunogenicity. Leukemia 2005, 19, 759–766. [Google Scholar] [CrossRef] [PubMed]
  45. Oscier, D.; Else, M.; Matutes, E.; Morilla, R.; Strefford, J.C.; Catovsky, D. The Morphology of CLL Revisited: The Clinical Significance of Prolymphocytes and Correlations with Prognostic/Molecular Markers in the LRF CLL4 Trial. Br. J. Haematol. 2016, 174, 767–775. [Google Scholar] [CrossRef]
  46. Bulian, P.; Shanafelt, T.D.; Fegan, C.; Zucchetto, A.; Cro, L.; Nückel, H.; Baldini, L.; Kurtova, A.V.; Ferrajoli, A.; Burger, J.A.; et al. CD49d Is the Strongest Flow Cytometry–Based Predictor of Overall Survival in Chronic Lymphocytic Leukemia. J. Clin. Oncol. 2014, 32, 897–904. [Google Scholar] [CrossRef] [PubMed]
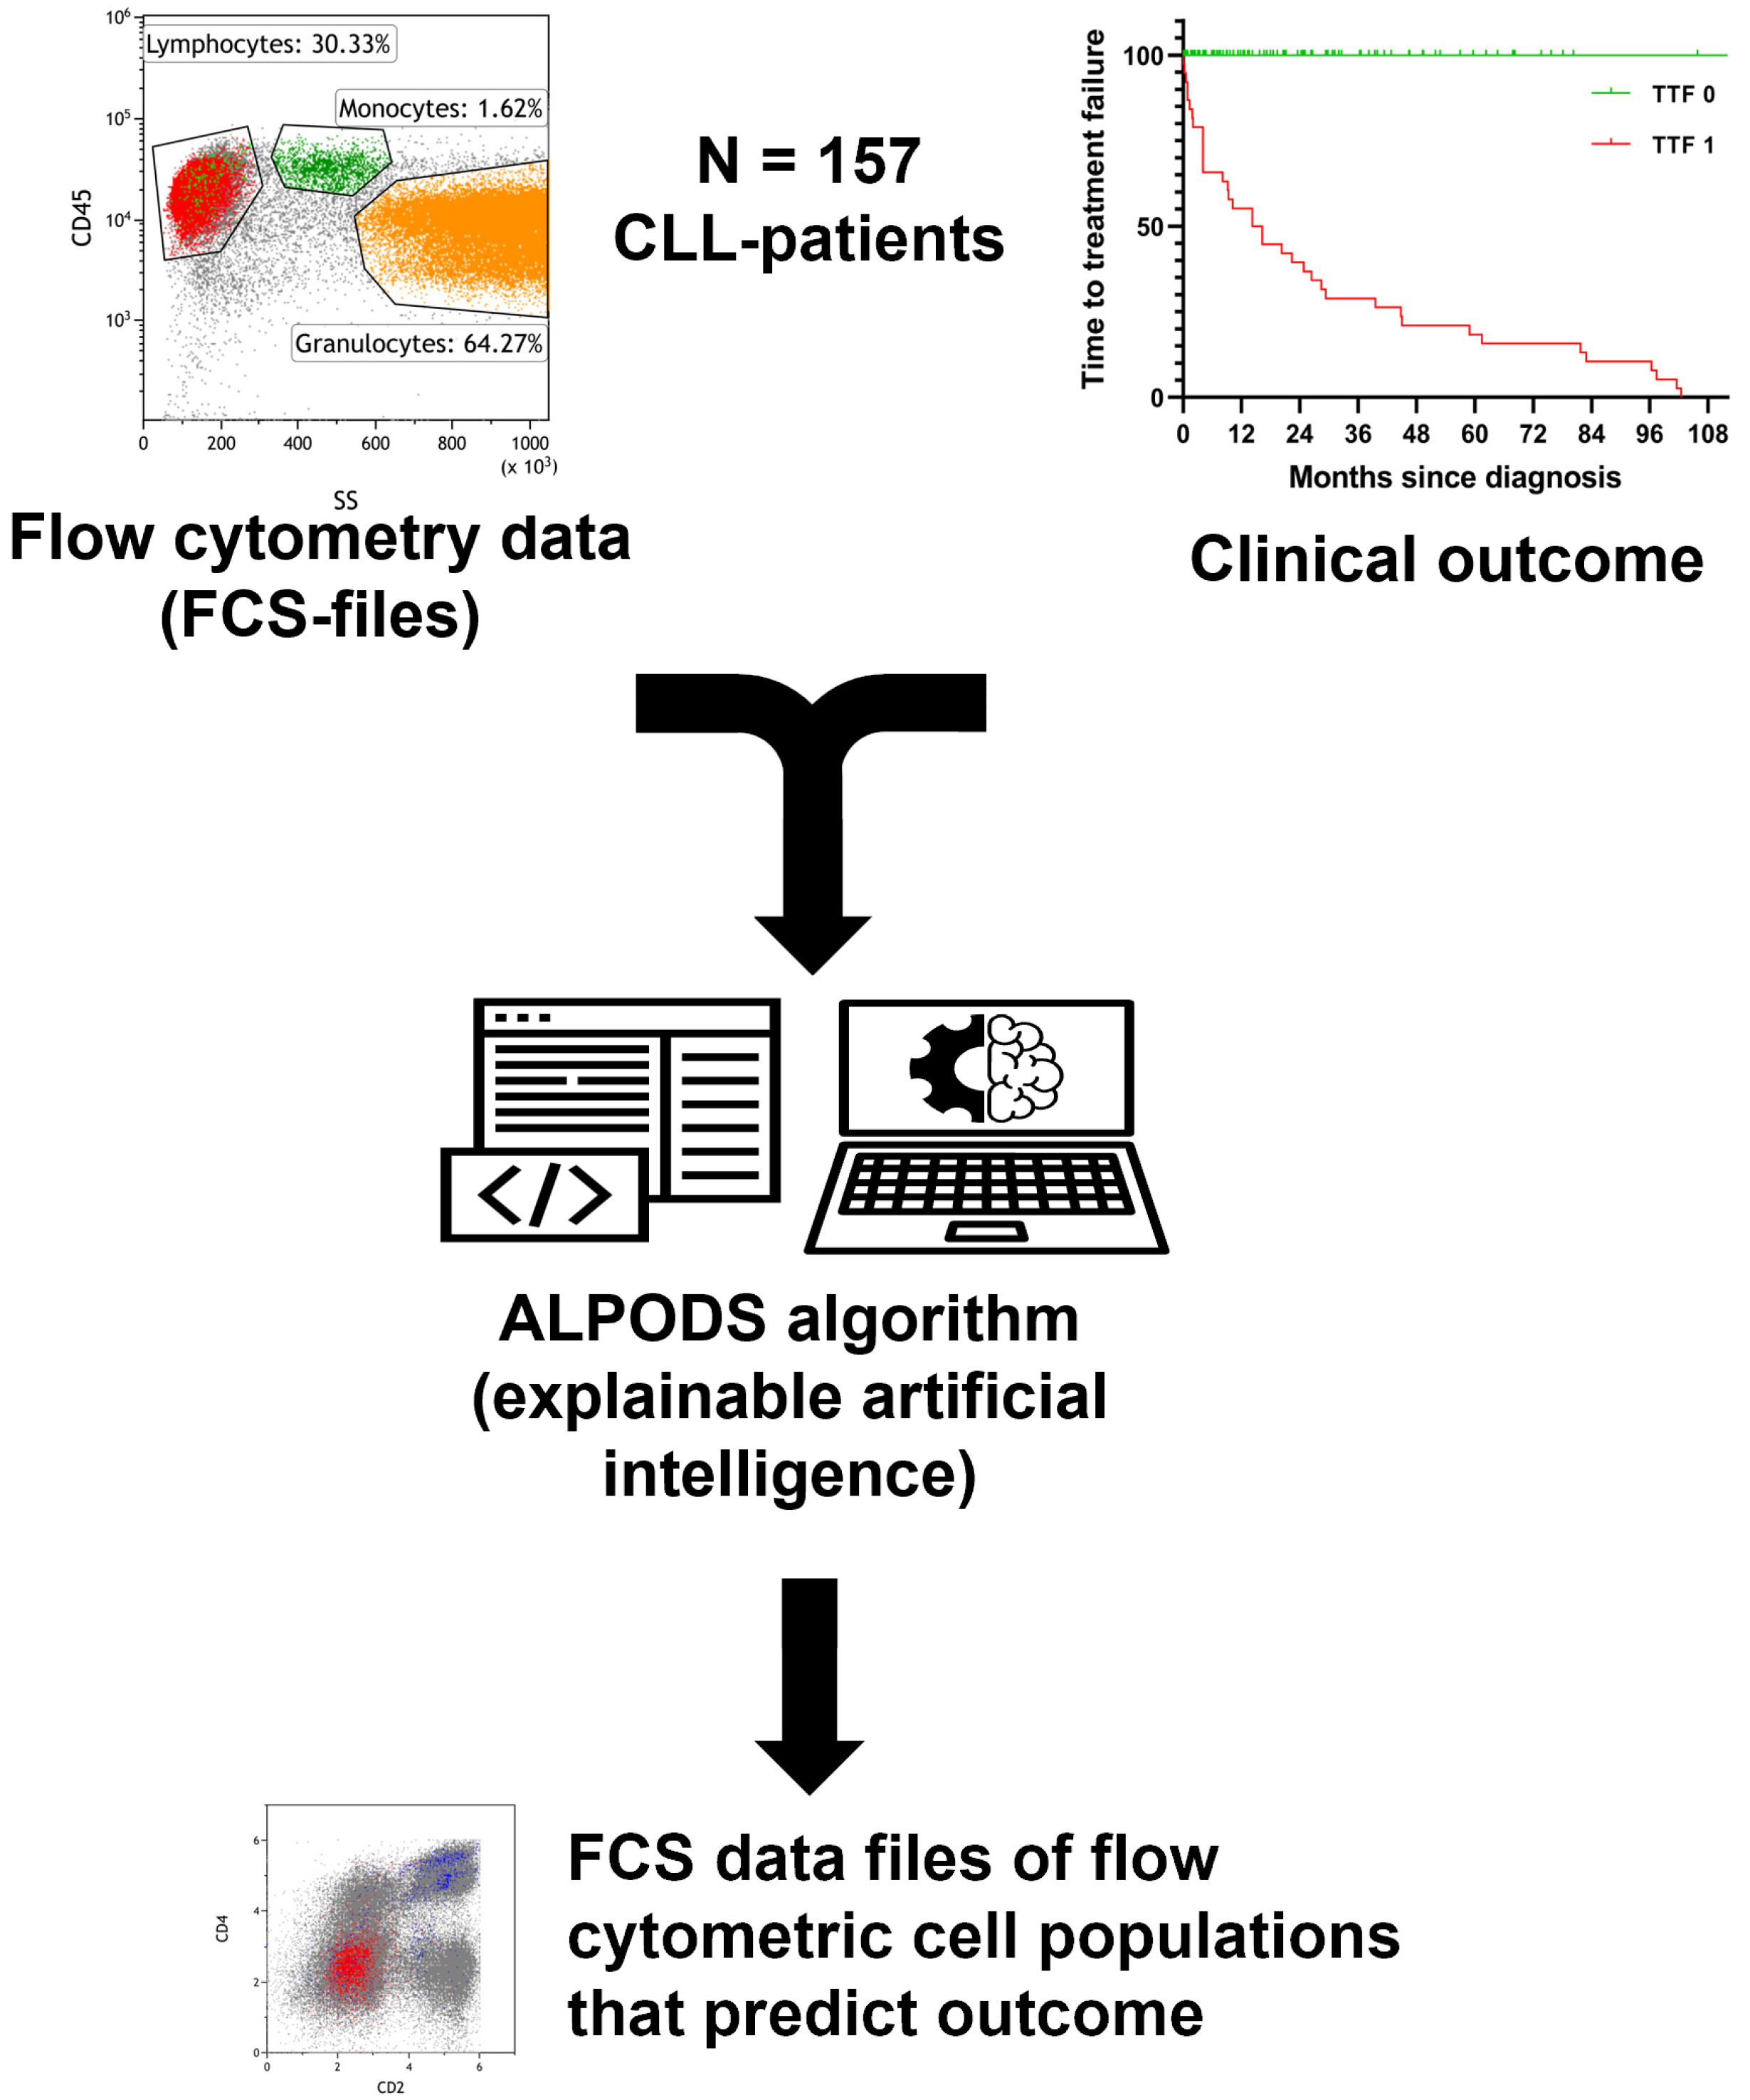
Figure 1. Workflow and data processing. Flow cytometry raw data was standardized and assigned to the outcome group (TTF 1 inferior, TTF 0 superior). The ALPODS algorithm was used to identify distinctive cell populations with different frequencies in TTF 1 versus TTF 0 The most important populations for determination were visualized in flow cytometry bivariate dot plots and assigned to their biological counterparts.
Curroncol 30 00148 g001
Figure 2. Multiple logistic regression with ROC curve analysis for (A) all XAIpopulations revealed a predictive ability of AUC 0.95 (95% CI 0.91–0.98; p < 0.0001). (B): The restriction of the four most predictive XAI populations for the outcome (TTF) and prognosis (IPI) resulted in lower predictive ability (AUC 0.87; 95% CI 0.80–0.93; p < 0.0001). Abbreviations: ROC = receiver operation characteristics; XAI = explainable artificial intelligence; AUC = area under curve; CI = confidence interval.
Curroncol 30 00148 g002
Figure 3. Identification and description of the XAI population through flow cytometry gating in a representative sample. (A) The populations T1C0011 (green) and T1C0016 (red) were the most relevant populations for the outcome and prognosis in Tube 1 (T1) of the analyzed B-cell panel. T1C0011 (green) could be located within the CLL cells (blue). The population of T1C0016 (red) corresponded to CD4+ T cells (i.e., T helper cells). (B) T2C0004 (green) and T2C0018 (red) were the most relevant populations for the outcome and prognosis in Tube 2 (T2). Both were located mainly within the CLL cells (blue), but T2C0018 was a mixture of a biologically different population (CLL cells and T/NK cells).
Curroncol 30 00148 g003
Figure 4. Median antigen expression and scatter properties of CLL subsets with predictive ability for outcome (TTF) were compared with the CLL cells of the average patient. The population T1C0011 (A), which was identified in tube 1 (T1), showed lower forward scatter (FS) and diminished antigen expression. T2C0002 (B) in tube 2 (T2) shared the lower FS and antigen expression with T1C0011. In flow cytometry dot plots (C), parts of T1C0011 and T2C0002 were located in the very low FS region of apoptotic/dead CLL cells. This may indicate a predictive value of apoptotic/dead CLL cells for outcome.
Curroncol 30 00148 g004
Table 1. Patient characteristics.
Total (N = 157)TTF 1 (N = 42)TTF 0 (N = 115)
Age (years)
   Median (range)68 (26–91)70 (50–88)67 (26–91)
Sex
   Female62 (39.5%)17 (40.5%)45 (39.1%)
   Male95 (60.5%)25 (59.5%)70 (60.9%)
Binet
   A83 (52.9%)15 (35.7%)68 (59.1%)
   B24 (15.3%)7 (16.7%)17 (14.8%)
   C12 (7.6%)8 (19.0%)4 (3.5%)
   unknown31 (19.7%)9 (21.4%)22 (19.1%)
CLL-IPI
   Low84 (53.5%)9 (21.4%)75 (65.2%)
   Intermediate53 (33.8%)20 (47.6%)33 (28.7%)
   High16 (10.2%)11 (26.2%)5 (4.3%)
   Very High4 (2.5%)2 (4.8%)2 (1.7%)
Follow up
   Median (IQR) months31 (9–65)71 (38–114)24 (7–46)
   Death (N)16 (10.2%)16 (38.1%)0 (0%)
   Treatment failure first line (N)34 (21.7%)34 (80.1%)0 (0%)
   Richter’s syndrome (N)4 (2.5%)3 (7.1%)1 (0.9%)
Therapy (first line)
   R-Bendamustin25 (15.9%)17 (40.5%)8 (7.0%)
   Ibrutinib12 (7.6%)6 (14.3%)6 (5.2%)
   Other24 (15.3%)15 (35.7%)9 (7.8%)
   No therapy80 (51.0%)0 (0%)80 (70.0%)
   Unknown16 (10.2%)4 (9.5%)12 (10.4%)
Abbreviations: N = number; CLL = chronic lymphocytic leukemia; IPI = International Prognostic Index; TTF = time to first-line treatment failure; IQR = interquartile range; R = rituximab.
Table 2. Outcome prediction of the XAI populations.
TTF 1TTF 0 ROC
Mean (%)Mean (%)SE of Differencep-Value (MWU-Test)AUC95% CIp-Value
CLL-IPI2.845 *1.322 *0.2712<0.00010.780.70–0.86<0.0001
CD38+37.0522.515.4140.00160.660.57–0.760.0018
XAI-populations
Total 0.950.91–0.98<0.0001
T1C00115.361.390.81<0.00010.760.68–0.84<0.0001
T1C00121.911.610.400.26500.560.45–0.660.2635
T1C00164.9113.511.83<0.00010.780.70–0.86<0.0001
T1C00176.464.151.320.21360.570.46–0.670.2124
T1C00195.196.381.010.09700.590.47–0.700.0966
T1C00200.350.110.080.15140.580.47–0.680.1506
T1C00232.250.570.490.55930.530.41–0.650.5573
T2C00012.595.501.310.00110.670.57–0.760.0012
T2C00022.850.730.610.00520.640.54–0.750.0055
T2C00049.641.231.290.00020.690.58–0.800.0002
T2C00091.740.840.490.68770.520.41–0.630.6859
T2C00100.550.210.150.53690.530.43–0.640.5349
T2C00148.1912.141.970.00780.640.54–0.740.0081
T2C00185.371.660.720.00010.730.63–0.82<0.0001
T2C00204.381.750.63<0.00200.660.55–0.770.0022
T2C00213.252.740.730.42860.040.44–0.640.4266
T2C00280.850.360.140.20210.570.45–0.680.2010
* Score points (≠percentage). Abbreviations: TTF = time to first-line treatment failure; ROC = receiver operation characteristics; SE = standard error; MWU = Mann–Whitney U; AUC = area under curve; CI = confidence interval, IPI = International Prognostic Index; T1 = Tube 1 (first tube of the flow cytometry panel; T2 = Tube 2 (second tube of the flow cytometry panel).
Table 3. Predictive models for outcome.
OR95% CIp-ValueAUC95% CIp-Value
All XAI populations 0.950.91–0.98<0.0001
CLL-IPI 0.780.70–0.86<0.0001
Four-factor model0.840.77–0.91<0.0001
CLL-IPI1.531.19–2.040.0018
T1C0016 (CD4+ T cells)0.860.78–0.930.0003
T1C0023 (CD8+ T cells)1.140.95–1.770.3305
CD381.011.00–1.020.1790
Two-factor model with IPI0.830.77–0.90<0.0001
CLL-IPI1.641.29–2.160.0001
T1C0016 (CD4+ T cells)0.850.78–0.920.0002
Two-factor model w/o IPI0.790.71–0.87<0.0001
T1C0016 (CD4+ T cells)0.850.78–0.91<0.0001
T1C0023 (CD8+ T cells)1.291.05–2.140.1390
Abbreviations: OR = odds ratio; TTF = time to first-line treatment failure; AUC = area under curve; CI = confidence interval, IPI = International Prognostic Index.
Disclaimer/Publisher’s Note: The statements, opinions and data contained in all publications are solely those of the individual author(s) and contributor(s) and not of MDPI and/or the editor(s). MDPI and/or the editor(s) disclaim responsibility for any injury to people or property resulting from any ideas, methods, instructions or products referred to in the content.