Article

Evaluation of Agricultural Traits, Phytochemical Contents, and Antioxidant Activities in the Leaves of Amaranth Accessions of Nine Species

1
National Agrobiodiversity Center, National Institute of Agricultural Sciences, Rural Development Administration, Jeonju 54874, Korea
2
International Technology Cooperation Center, Rural Development Administration, Jeonju 54875, Korea
3
Department of Applied Chemistry, Adama Science and Technology University, Adama 1888, Ethiopia
*
Author to whom correspondence should be addressed.
Plants 2022, 11(13), 1758; https://doi.org/10.3390/plants11131758
Submission received: 23 May 2022 / Revised: 19 June 2022 / Accepted: 19 June 2022 / Published: 1 July 2022
(This article belongs to the Special Issue Antioxidant Activity of Medicinal and Aromatic Plants)

Abstract

:
Amaranthus species are widely cultivated as dietary crops and are promising sources of phytochemical compounds with antioxidant properties. To explore Amaranthus as a potential medical resource, 289 accessions (nine species) were cultivated, and their agricultural characteristics, total phenolic content (TPC), rutin contents, and antioxidant activities [2,2-diphenyl-1-picrylhydrazyl (DPPH) and 2,2′-azino-bis-(3-ethylbenzothiazoline-6-sulfonic acid) (ABTS)] were studied. Wide variations in agricultural traits, phytochemical contents, and antioxidant activities were observed between the accessions and across species. The effects of agricultural traits were evaluated, and the results indicated that yellow-flowered amaranth genotypes could be important because of their high values of TPC, rutin contents, DPPH, and ABTS. In addition, leaf length, days until 50% flowering, days until 50% heading and days until maturity, showed positive correlations with TPC, rutin contents, DPPH, and ABTS. The whole dataset was subjected to principal component analysis, and distinctive aggregation was observed across the Amaranthus species. In total, 289 accessions were clustered into three groups, and seven genotypes were determined as being good medical resources due to their high phytochemical content and antioxidant activities. Our findings provide important information for the development of new varieties with high phytochemical contents and high levels of antioxidant activity.

1. Introduction

Amaranth (Amaranthus spp. L.), which comprises about 70 species, is an annual plant in the family Amaranthaceae. As a superfood, it was named “the grain of God”, and it is widely distributed and cultivated in tropical and subtropical areas around the world [1,2]. Amaranth is a promising food crop in arid regions because of its rapid growth and resistance to stressful environments [3,4]. The morphological diversity of Amaranthus is remarkable, and there are obvious morphological differences within species. The plants can grow to a height of 1–2.5 m, and variations have been reported in the sharpness and color of leaves, flowers, stems, and seed coats [5]. A previous study also reported wide variations in other morphological traits, including stem diameter, leaf number, and leaf thickness, in weedy types of Indonesian amaranth [6]. Such morphological differences illustrate the genotypic diversity and high variability of phenotypic features at the genetic level; therefore, investigating genetic variations, and relationships between agricultural traits and metabolite levels, could provide useful data for breeding new varieties that are both rich in metabolites and that possess the desired morphological appearance [6,7].
Amaranthus species are domesticated and cultured for use as a vegetable, grain, fodder, an ornamental plant, and in traditional medicine [8,9]. Among the different tissues, those that comprise amaranth leaves and stems are of great interest because of their high nutritional value. They have high amounts of iron, copper, calcium, and other minerals, as well as carotene, vitamin C, essential amino acids, phenolic compounds, flavonoids, lignins, and hydroxybenzoic acids, among others [10,11,12,13,14,15]. Moreover, extracts from various Amaranthus species have been used in therapies for urinary infections, respiratory disorders, pain, cardiovascular diseases, hypertension, tumors, and diabetes [16,17]. Studies have demonstrated that polyphenolic compounds, which are among the most widely used plant chemicals, have powerful antioxidant effects. They have been studied for suppressing inflammation, and for treating dementia and atherosclerosis [18,19,20]. Several Amaranthus species are rich sources of polyphenolic compounds, and they are of increasing interest to scientists due to their potential for preserving human health. Among the different classes of polyphenols, flavonoids are considered effective for inhibiting age-related diseases. Rutin, also known as rutoside, quercetin-3-rutinoside, and sophorin, is one of the most common flavonoids in plants, and is effective for colorectal carcinogenesis therapy [21]. From a dietary perspective, the rutin content of amaranth is an important factor, and high levels of this compound are important for the prevention of diseases caused by modern society [22,23]. Due to their broad range of pharmacological effects and metabolite contents, Amaranthus species are becoming popular with many consumers [24].
Many scientists have studied the biochemical contents and antioxidant activities of Amaranthus genotypes [8,24,25,26,27,28,29]; however, few have investigated the correlations between agricultural traits, phytochemicals, and antioxidant activities [6,10,15,30,31,32]. To obtain a thorough understanding of such associations, studies involving large numbers of amaranth genotypes are required. In this study, 289 amaranth accessions (nine species) were obtained and cultivated under uniform field conditions. Next, the associations between agricultural traits, phytochemical contents, and antioxidant activities were investigated. The results of this study could provide important knowledge for the propagation of amaranth, and it could help breeding programs develop new amaranth varieties with high metabolite contents and strong antioxidant activities.

2. Materials and Methods

2.1. Reagents and Chemicals

The chemicals and reagents used in this study, including the Folin–Ciocalteu phenol reagent, 2,2-diphenyl-1-picrylhydrazyl (DPPH), 2,2′-azino-bis-(3-ethylbenzothiazoline-6-sulfonic acid) (ABTS), rutin, sodium carbonate, ethanol, gallic acid, standard Trolox, and methanol, were purchased from Sigma Aldrich (St. Louis, MO, USA). All chemicals were of analytical grade and used without further purification.

2.2. Amaranth Cultivation and Sample Preparation

The seeds of 289 amaranth genotypes of nine species, including A. cruentus (n = 22), A. hybridus (n = 21), A. hypochondriacus (n = 77), A. powellii (n = 7), A. quitensis (n = 8), A. spinosus (n = 13), and A. tricolor (n = 77), were obtained from the gene bank of the National Agrobiodiversity Center (NAC), Rural Development Administration (RDA), Jeonju, South Korea. The seeds, which originated from more than 40 countries, were seeded and cultivated on a research farm at the NAC in 2021.
Initially, amaranth leaves were dried in an oven (40 °C) and ground into a fine powder. Crude extraction was performed following a previously described method, with some modifications [33]. Briefly, 2 g of each sample (in triplicate) was mixed with 20 mL of 75% ethanol, and the mixture was processed with an accelerated solvent extractor (ASE) (ASE-350; Dionex, Sunnyvale, CA, USA) using nitrogen gas for 15 min. The pressure and temperature were set at 1200 psi and 70 °C, respectively. After extraction, the crude extracts were transferred separately to a new 50 mL conical tube and they were concentrated using a vacuum concentrator (HT-6; Genevac, Ipswich, UK) at 40 °C for 10 h.

2.3. Agricultural Traits

Agricultural traits were measured according to a previously described method [6]. Leaf length (LL), leaf width (LW), panicle length (PL), and panicle width (PW) were measured using a slide caliper. Values are represented as the average of five plants for each accession. The leaf color, flower color, seed coat color, days until 50% flowering (FD), days until 50% heading (HD), and days until maturity (MD) of each accession were recorded during field inspections.

2.4. Determination of Total Phenolic Content

The total phenolic content (TPC) was determined using the Folin–Ciocalteu colorimetric method, as described by Waterhouse [34], and subsequently modified by Assefa et al. [33], with gallic acid used as a standard. The dried extracts were dissolved in 75% ethanol, using appropriate concentrations, filtered through a 0.45-µm filter using a needleless syringe, and readied for TPC analysis. The Folin–Ciocalteu reagent (100 µL) was added to each sample or standard (100 µL), and they were incubated at room temperature for 3 min. Next, 100 µL of 2% Na2CO3 was added to each mixture, followed by an incubation period in the dark at room temperature for 30 min for color development. The absorbance of the solutions was measured using an Eon Microplate Spectrophotometer (Bio-Tek, Inc., Winooski, VT, USA) at 750 nm, and 75% ethanol was used as a blank specimen. TPC was calculated based on the standard curves which were prepared using various concentrations of the gallic acid standard. The results are presented as μg gallic acid equivalent per mg sample (μg·GAE/mg) from triplicate measurements.

2.5. Determination of Rutin Content

Rutin content was determined using the method by Tundis et al. [35], with some modifications. The obtained dried extract was dissolved in 80% methanol, using appropriate concentrations, and filtered through a 0.45-µm filter. It was identified by using ultra-high-performance liquid chromatography (UHPLC) with a Cortecs C18 (1.6 µm, 2.1 × 150 mm) column. During the analysis, a solvent system composed of solvent A (1% formic acid in water) and solvent B (1% formic acid in acetonitrile) was used as the mobile phase at a flow rate of 0.2 mL/min, and the target was detected at 350 nm. Gradient elution of the organic modifier was conducted using the following schemes: 0 min, 2% B; 15 min, 4% B; 30 min, 20% B; 75 min, 50% B; 85 min, 2% B. The concentration of rutin in amaranth leaves was calculated with a standard curve that was prepared using various concentrations of the pure rutin standard. The equation and correlation coefficient of the standard curve was y = 30.075 x + 83.441, R2 = 0.9992 (y is the peak area and x is rutin concentration).

2.6. Antioxidant Capacity Assay

Antioxidant capacity was assessed using the method by Sarker et al. [36], with some modifications. For the DPPH radical scavenging assay, 100 µL of each sample extract, dissolved in 75% ethanol, using appropriate concentrations, and filtered through a 0.45-µm filter, was mixed with 150 µL of 150 µM anhydrous ethanol, followed by a 30 min incubation period in the dark at 25 °C. The DPPH radical scavenging activity was evaluated by measuring the absorbance at 517 nm using a spectrophotometer (NanoQuant Plate; Tecan, Männedorf, Switzerland). During the ABTS assay, a working solution was initially prepared by mixing equal volumes of 7 mM ABTS solution and 2.45 mM potassium persulfate stock solution, followed by storage in the dark for 12 h at 4 °C. Next, 190 µL of ABTS working solution was added to 10 µL of each sample extract. The mixtures were kept in the dark for 30 min, followed by an absorbance measurement at 734 nm using a spectrophotometer (NanoQuant Plate; Tecan). In each case, 75% ethanol was used as a blank. The DPPH and ABTS radical scavenging activities were calculated using the following equation:
Antioxidant activity (%) = [(Ablank − Asample)/(Ablank)] × 100
where Asample is the absorbance of the test extract and Ablank is the absorbance of the blank sample (100 µL 75% ethanol (DPPH), 10 μL 75% ethanol (ABTS) instead of extract). Trolox was used as the standard, and the results are expressed in µg Trolox equivalent per mg (µg·TE/mg) of the dried sample.

2.7. Statistical Analysis

All of the experiments in this study were conducted in triplicate, and the data were subjected to analysis of variance (ANOVA) using R software (version 4.1.2; R Development Core Team, Vienna, Austria). TPC, rutin content, and DPPH radical and ABTS radical scavenging activities are reported as the mean ± standard deviation (SD). Quantitative measures of agricultural traits are reported as the average values obtained from five amaranth plants. Principal component analysis (PCA), hierarchical clustering principal component (HCPC) analysis, and partial least squares discriminant analysis (PLS-DA) were also performed using R software (version 4.1.2) [37,38,39].

3. Results and Discussion

3.1. Agricultural Traits
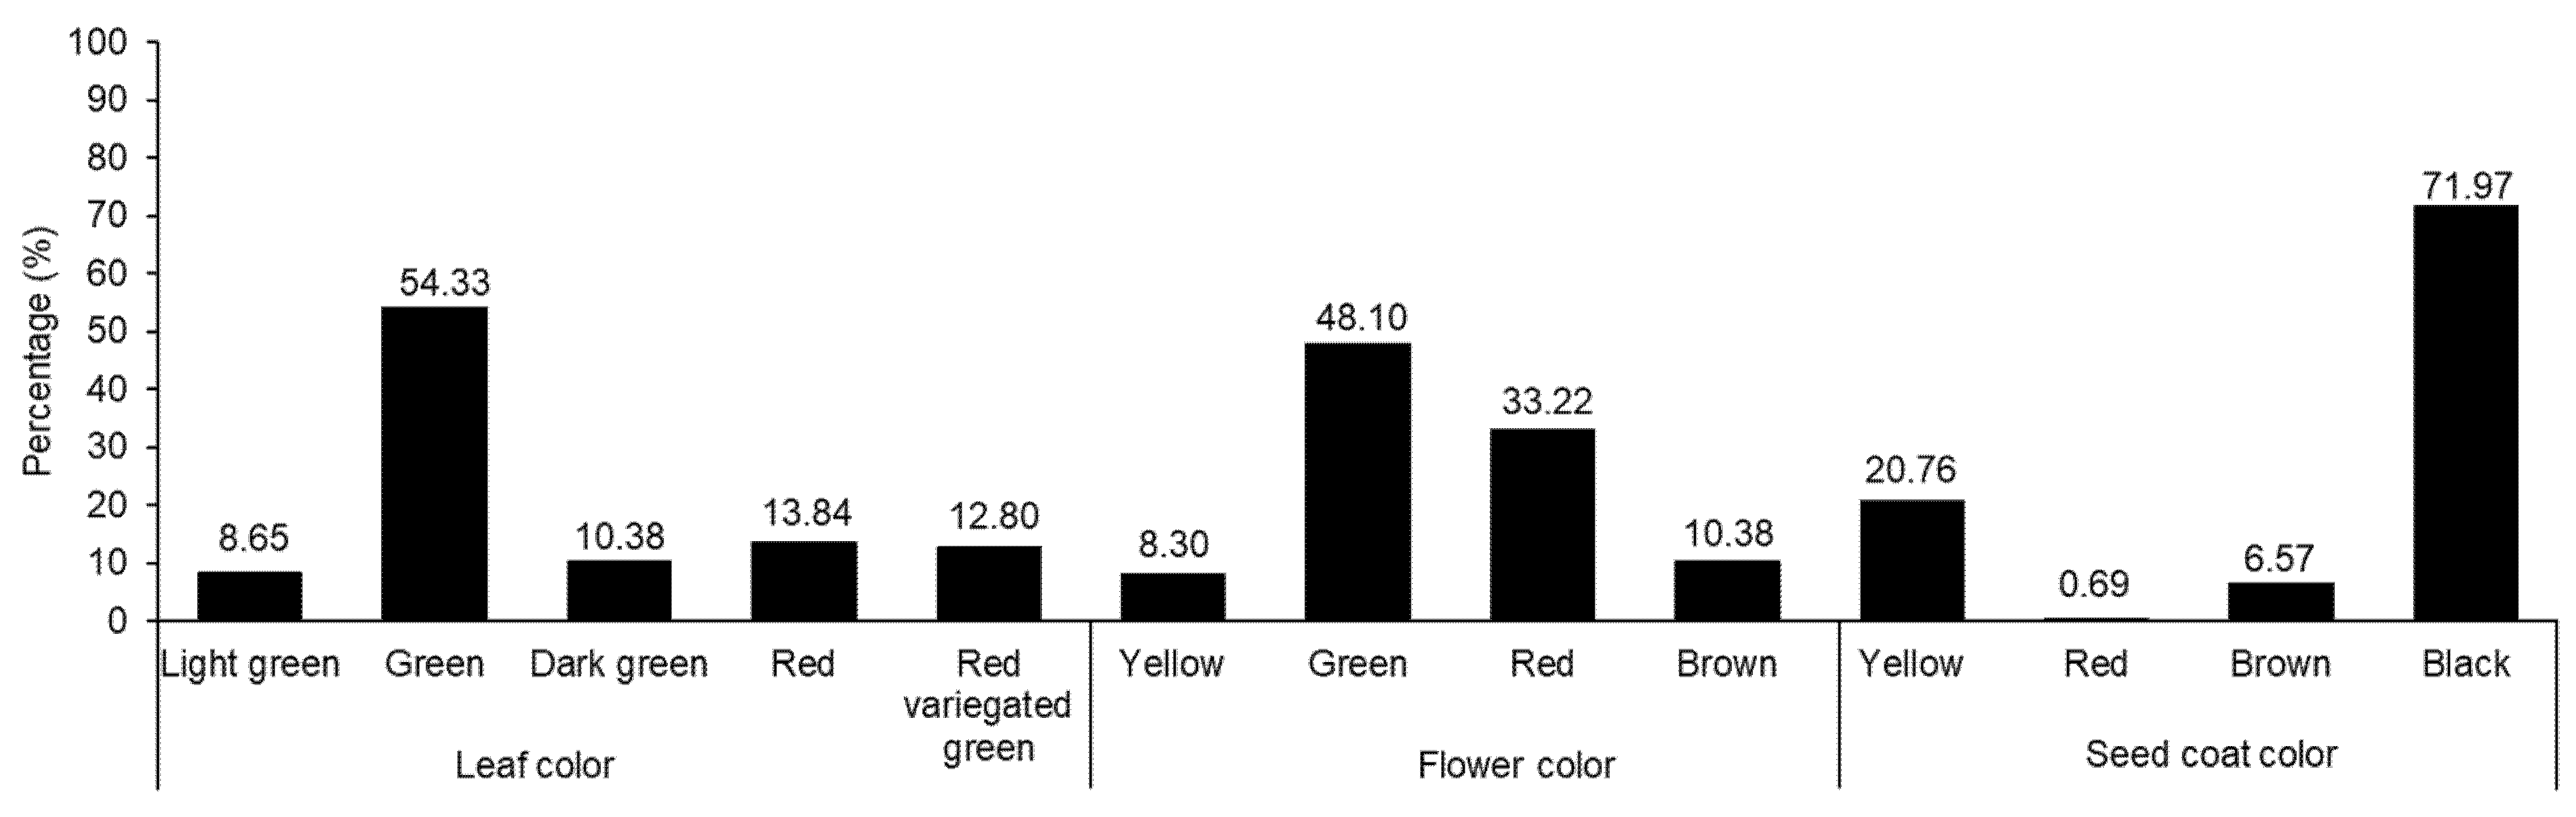
3.1.1. General

The variations in agricultural traits, including LL, LW, PL, PW, FD, HD, MD, leaf color, flower color, and seed coat color, were recorded and are presented in Table 1 and Figure 1. In each case, wide diversity was observed. Previous studies have also shown wide variations in agricultural traits among Amaranthus accessions [5,7,10,40]. The LL and LW values ranged from 6.84 to 32.16 and 3.00 to 21.33 cm, respectively. Likewise, PL and PW ranged from 0.66 to 29.10 and 0.50 to 6.16 cm, respectively. The FD, HD, and MD values were in the ranges of 35–108, 45–125, and 54–162 days, respectively. Compared with the results of previous studies, our results showed wider variations in some agronomic traits. For instance, Akaneme and Ani reported the LL and LW values as being in the ranges of 13.63–33.15 and 8.47–14.76 cm, respectively, and the FD value was in the range of 41.00–66.00 days [41]. Gerrano et al. recorded PL values from 17.44 to 44.57 cm when observing Amaranthus genetic resources from South Africa [42]. Variations were also observed in leaf, flower, and seed coat colors. Green was the predominant leaf color (54.33%), followed by red (13.84%). Green was also the main color of the flower (48.10%), followed by red (33.22%). Most of the accessions had black seeds (91.97%), followed by yellow seeds (20.76%), although two accessions produced red seeds (0.69%).

3.1.2. Variations of Agricultural Traits According to Species

The variations of agricultural traits in the nine Amaranthus species are shown in Table 2. Significant differences were observed between the phenotypic traits of the Amaranthus species. A. cruentus exhibited the highest average LL (25.65 cm) and LW (13.30 cm), followed by A. caudatus (22.05 and 12.75 cm, respectively), whereas A. spinosus had the lowest average LL (10.30 cm) and LW (5.53 cm) values. In addition, A. cruentus exhibited the highest average PW (1.64 cm). Andini et al. also reported that A. cruentus exhibited the largest leaf size, followed by A. caudatus, among the Amaranthus genetic resources in Indonesia [6]. In contrast, A. spinosus developed the highest average PL (15.48 cm) and A. caudatus displayed the lowest average PL (4.13 cm). It was well studied in rice that large leaf area, length, and width promote panicle development [43]. Furthermore, in another study of amaranth, LL showed a positive association with PL [44]. In the present study, A. spinosus had the lowest average LL and LW, but the highest average PL. This could be a special characteristic of A. spinosus. Moreover, A. caudatus displayed the longest average FD (60.74 days) and HD (74.19 days), and A. spinosus exhibited the shortest average FD (40.69 days), HD (59.46 days), and MD (79.15 days). In conclusion, both A. cruentus and A. spinosus showed genetic characteristics that are advantageous for breeding. A. cruentus could be a good donor for developing new vegetable varieties because of its larger LL and LW, and A. spinosus could contribute to the development of new grain varieties because of its higher PL and shorter MD.

3.2. Phytochemical Contents and Antioxidant Activities

3.2.1. General

The amaranth accessions showed significant variations in TPC, rutin content, and antioxidant activities (Table 1). TPC ranged from 159.62 to 958.19 µg·GAE/mg·DE, with a mean value of 456.05 µg·GAE/mg·DE. TPC had a wider range and higher average value than in other studies [15,45,46]. The rutin content was low, and varied widely among the genotypes from 0.12 to 42.30 mg/g, with an average value of 10.06 mg/g. Similarly, Li et al. [45] reported a rutin content of 333.25 ± 10.87 mg/100 g dry weight in A. hypochondriacus and 264.21 ± 5.57 mg/100 g dry weight in A. caudatus. Sarker and Oba reported that the rutin content ranged from 17.29 to 46.56 µg g−1 FW in leafy vegetable amaranth [47]. Moreover, in another study, the rutin content also varied remarkably among amaranth genotypes according to species and development stage [22]. The antioxidant activities also varied significantly among the amaranth genotypes. The DPPH radical scavenging activity ranged from 1.03 to 49.22 µg·TE/mg·DE, with a mean value of 20.24 µg·TE/mg·DE. The ABTS radical scavenging activity was in the range of 75.20–449.61 µg·TE/mg·DE, with a mean value of 200.73 µg·TE/mg·DE. Compared with previous studies, the DPPH radical and ABTS radical scavenging activity values recorded in the present study showed wider variations [15,48,49]. This could be attributed to the large number of genotypes considered in the present study. Additionally, studies have shown that differences in experimental methods and genotypes also affect the metabolite levels and antioxidant activities of various plants [50].

3.2.2. Association of Agronomic Characters with Metabolite Contents and Antioxidant Activities

The influences of seed coat color, flower color, and leaf color on TPC levels, rutin content, and antioxidant activities were also investigated, and the results are provided in Figure 2 and Table S1. The TPC value did not show a significant difference among genotypes possessing different leaf or seed coat colors; however, the TPC level varied significantly (p < 0.05) between genotypes with different flower colors. Amaranth accessions that developed a yellow flower color had the highest average TPC level (533.18 µg·GAE/mg·DE). Regarding rutin content, differences in both leaf and seed coat color highlighted remarkable and significant variations (p < 0.001), unlike flower color (p < 0.1). Accessions that had dark green leaves, yellow flowers, and brown seed coats had the highest average rutin content (14.22, 14.08, and 14.25 mg/g, respectively). Once again, antioxidant activities did not differ significantly according to seed coat color. Unlike these results, both the DPPH radical and ABTS radical scavenging activities differed by flower color. Leaf color highlighted significant differences in DPPH radical scavenging activity, but not ABTS radical scavenging activity.
Several studies have investigated the phytochemical and antioxidant activities of different Amaranthus species and genotypes, as well as in the different tissues of the sprout, flower, leaf, stalk, and seed [15,45,50,51]; however, few studies have investigated the associations between agricultural traits, phytochemical content, and antioxidant activities across a large population of amaranth species. This study evaluated the associations between agricultural traits, phytochemical content, and antioxidant activities in amaranth leaves using a large number of amaranth genotypes from various species. More specifically, our results revealed the relationships between agricultural traits (leaf, flower, and seed coat colors) and the phytochemical and antioxidant activities of amaranth leaves. Overall, seed coat color might not be a useful parameter for discriminating between amaranth genotypes because it was not significantly associated with the TPC level or DPPH and ABTS radical scavenging activities; however, amaranth accessions with a red seed coat color could be important resources, as they displayed the highest TPC level and strongest antioxidant activities. Nevertheless, in this study, only two accessions (IT262653 and IT262667) had red seed coats. Hence, further studies of such genotypes are highly recommended. In addition, the average TPC level, rutin content, and DPPH and ABTS radical scavenging activities ranked highest in terms of accessions that developed a yellow flower color. These observations indicate that such genotypes could be useful for breeding improved cultivars. Moreover, the average level of rutin content (10.39 mg/g) and average ABTS radical scavenging activity (212.27 µg·TE/mg·DE) in red-flowered accessions were not significantly different from the highest levels of rutin content (14.08 mg/g) and ABTS radical scavenging activity (214.36 µg·TE/mg·DE) observed in yellow-flowered accessions. This indicates that accessions with red flowers could be additional sources of antioxidants.

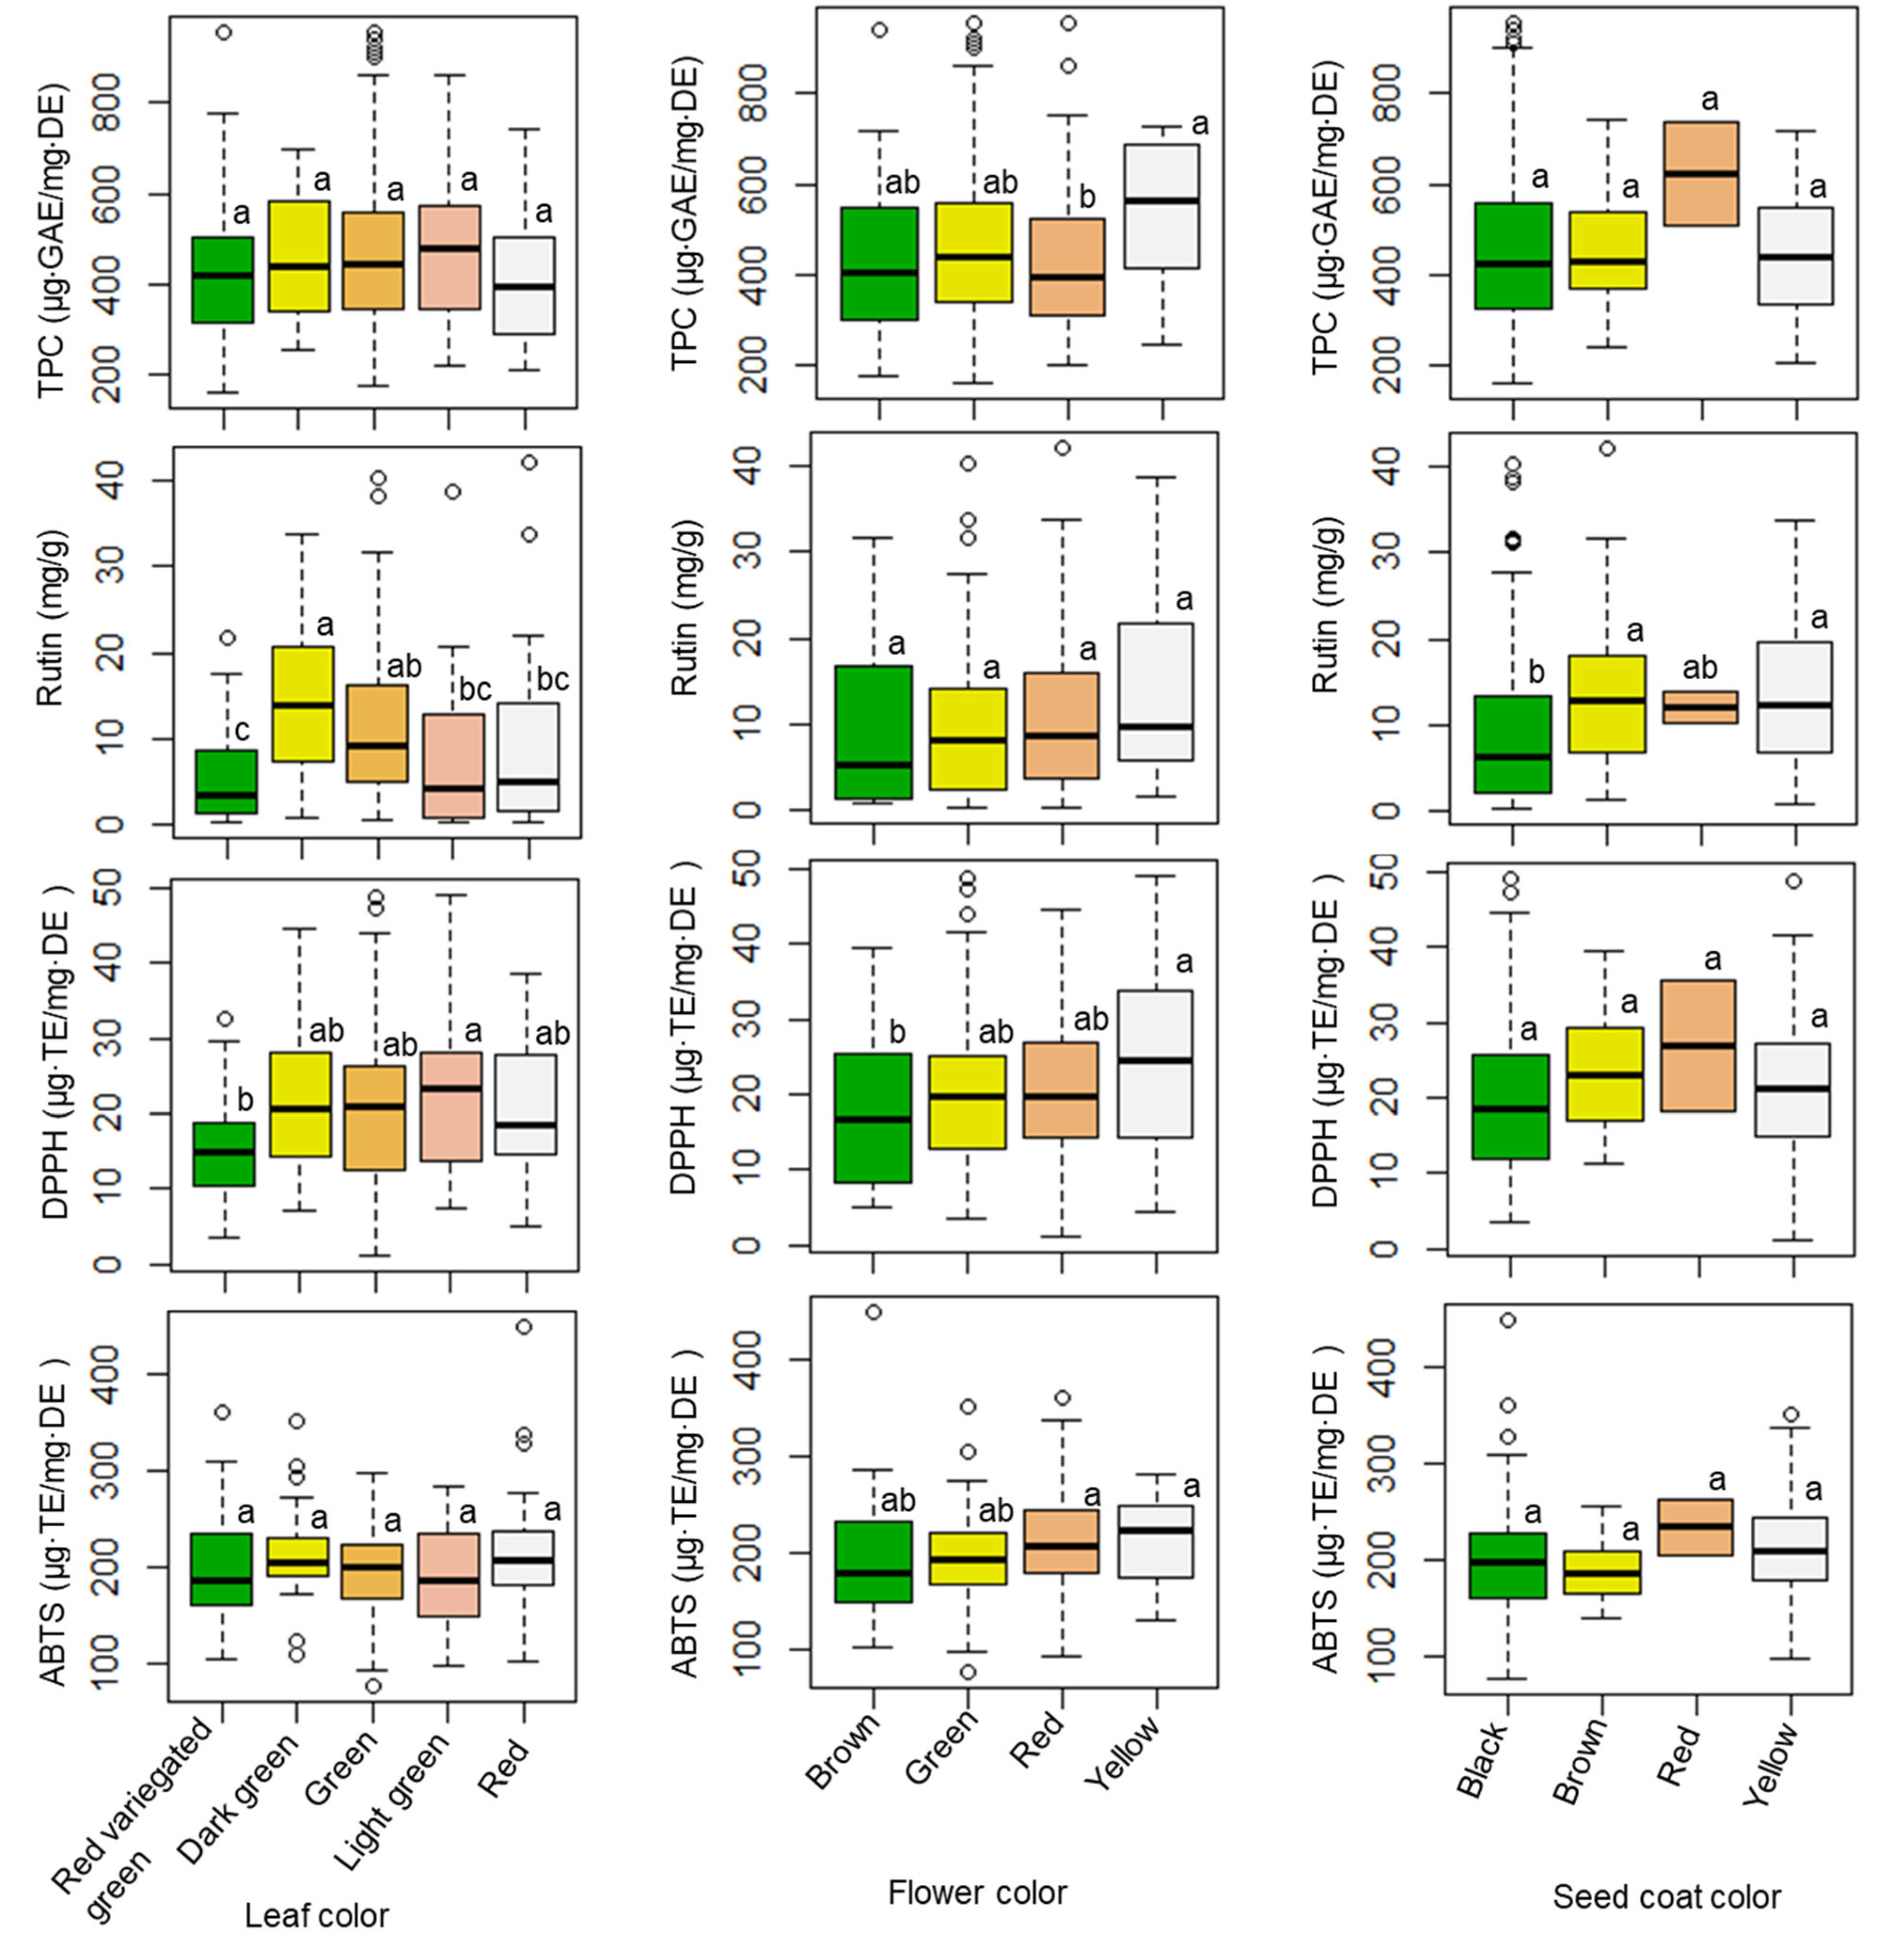
3.2.3. Variations of Metabolite Content and Antioxidant Activities between Species

The distributions of TPC, rutin content, and DPPH and ABTS radical scavenging activities in the 289 accessions are presented in Table 3. Among the nine Amaranthus species, the highest average TPC level was recorded in the A. caudatus accessions (494.27 µg·GAE/mg·DE), followed by the A. hypochondriacus accessions (473.84 µg·GAE/mg·DE). The lowest average TPC level (277.18 µg·GAE/mg·DE) was found in the A. powellii accessions (p < 0.05); however, other studies found a higher TPC level in A. hypochondriacus than A. caudatus [45,49], and in A. hybridus than A. hypochondriacus [49]. Our study evaluated a larger number of amaranth species genotypes; thus, as a result, the data showed a wider variation compared with other studies. A significant variation in rutin content was also observed among the nine species (p < 0.001). A. cruentus accessions displayed the highest average rutin content (17.88 mg/g), followed by A. hybridus (12.71 mg/g). A. spinosus exhibited the lowest average rutin content (3.74 mg/g). Similarly, Kalinova and Dadakova, who also evaluated the rutin content among Amaranthus species, concluded that A. hybridus and A. cruentus were the best sources of rutin [22]. A comparison of DPPH and ABTS radical scavenging activities across the nine Amaranthus species also revealed significant variation (p < 0.001). A. cruentus had the highest average level of DPPH radical scavenging activity (24.34 µg·TE/mg·DE), and A. spinosus had the lowest average level of DPPH radical scavenging activity (11.62 µg·TE/mg·DE). The highest average level of ABTS radical scavenging activity was exhibited by A. hybridus (236.97 µg·TE/mg·DE), and the lowest average value was found in A. spinosus (160.84 µg·TE/mg·DE). Likewise, Bang et al. [49] compared the antioxidant activities across Amaranthus species. A. hybridus exhibited the highest DPPH and ABTS values among Amaranthus species in 2018; however, A. dubius displayed the highest levels in 2019. Our results differed slightly from the results of previous studies. Despite the different environmental conditions, genetic variation could also explain the antioxidant activity differences.

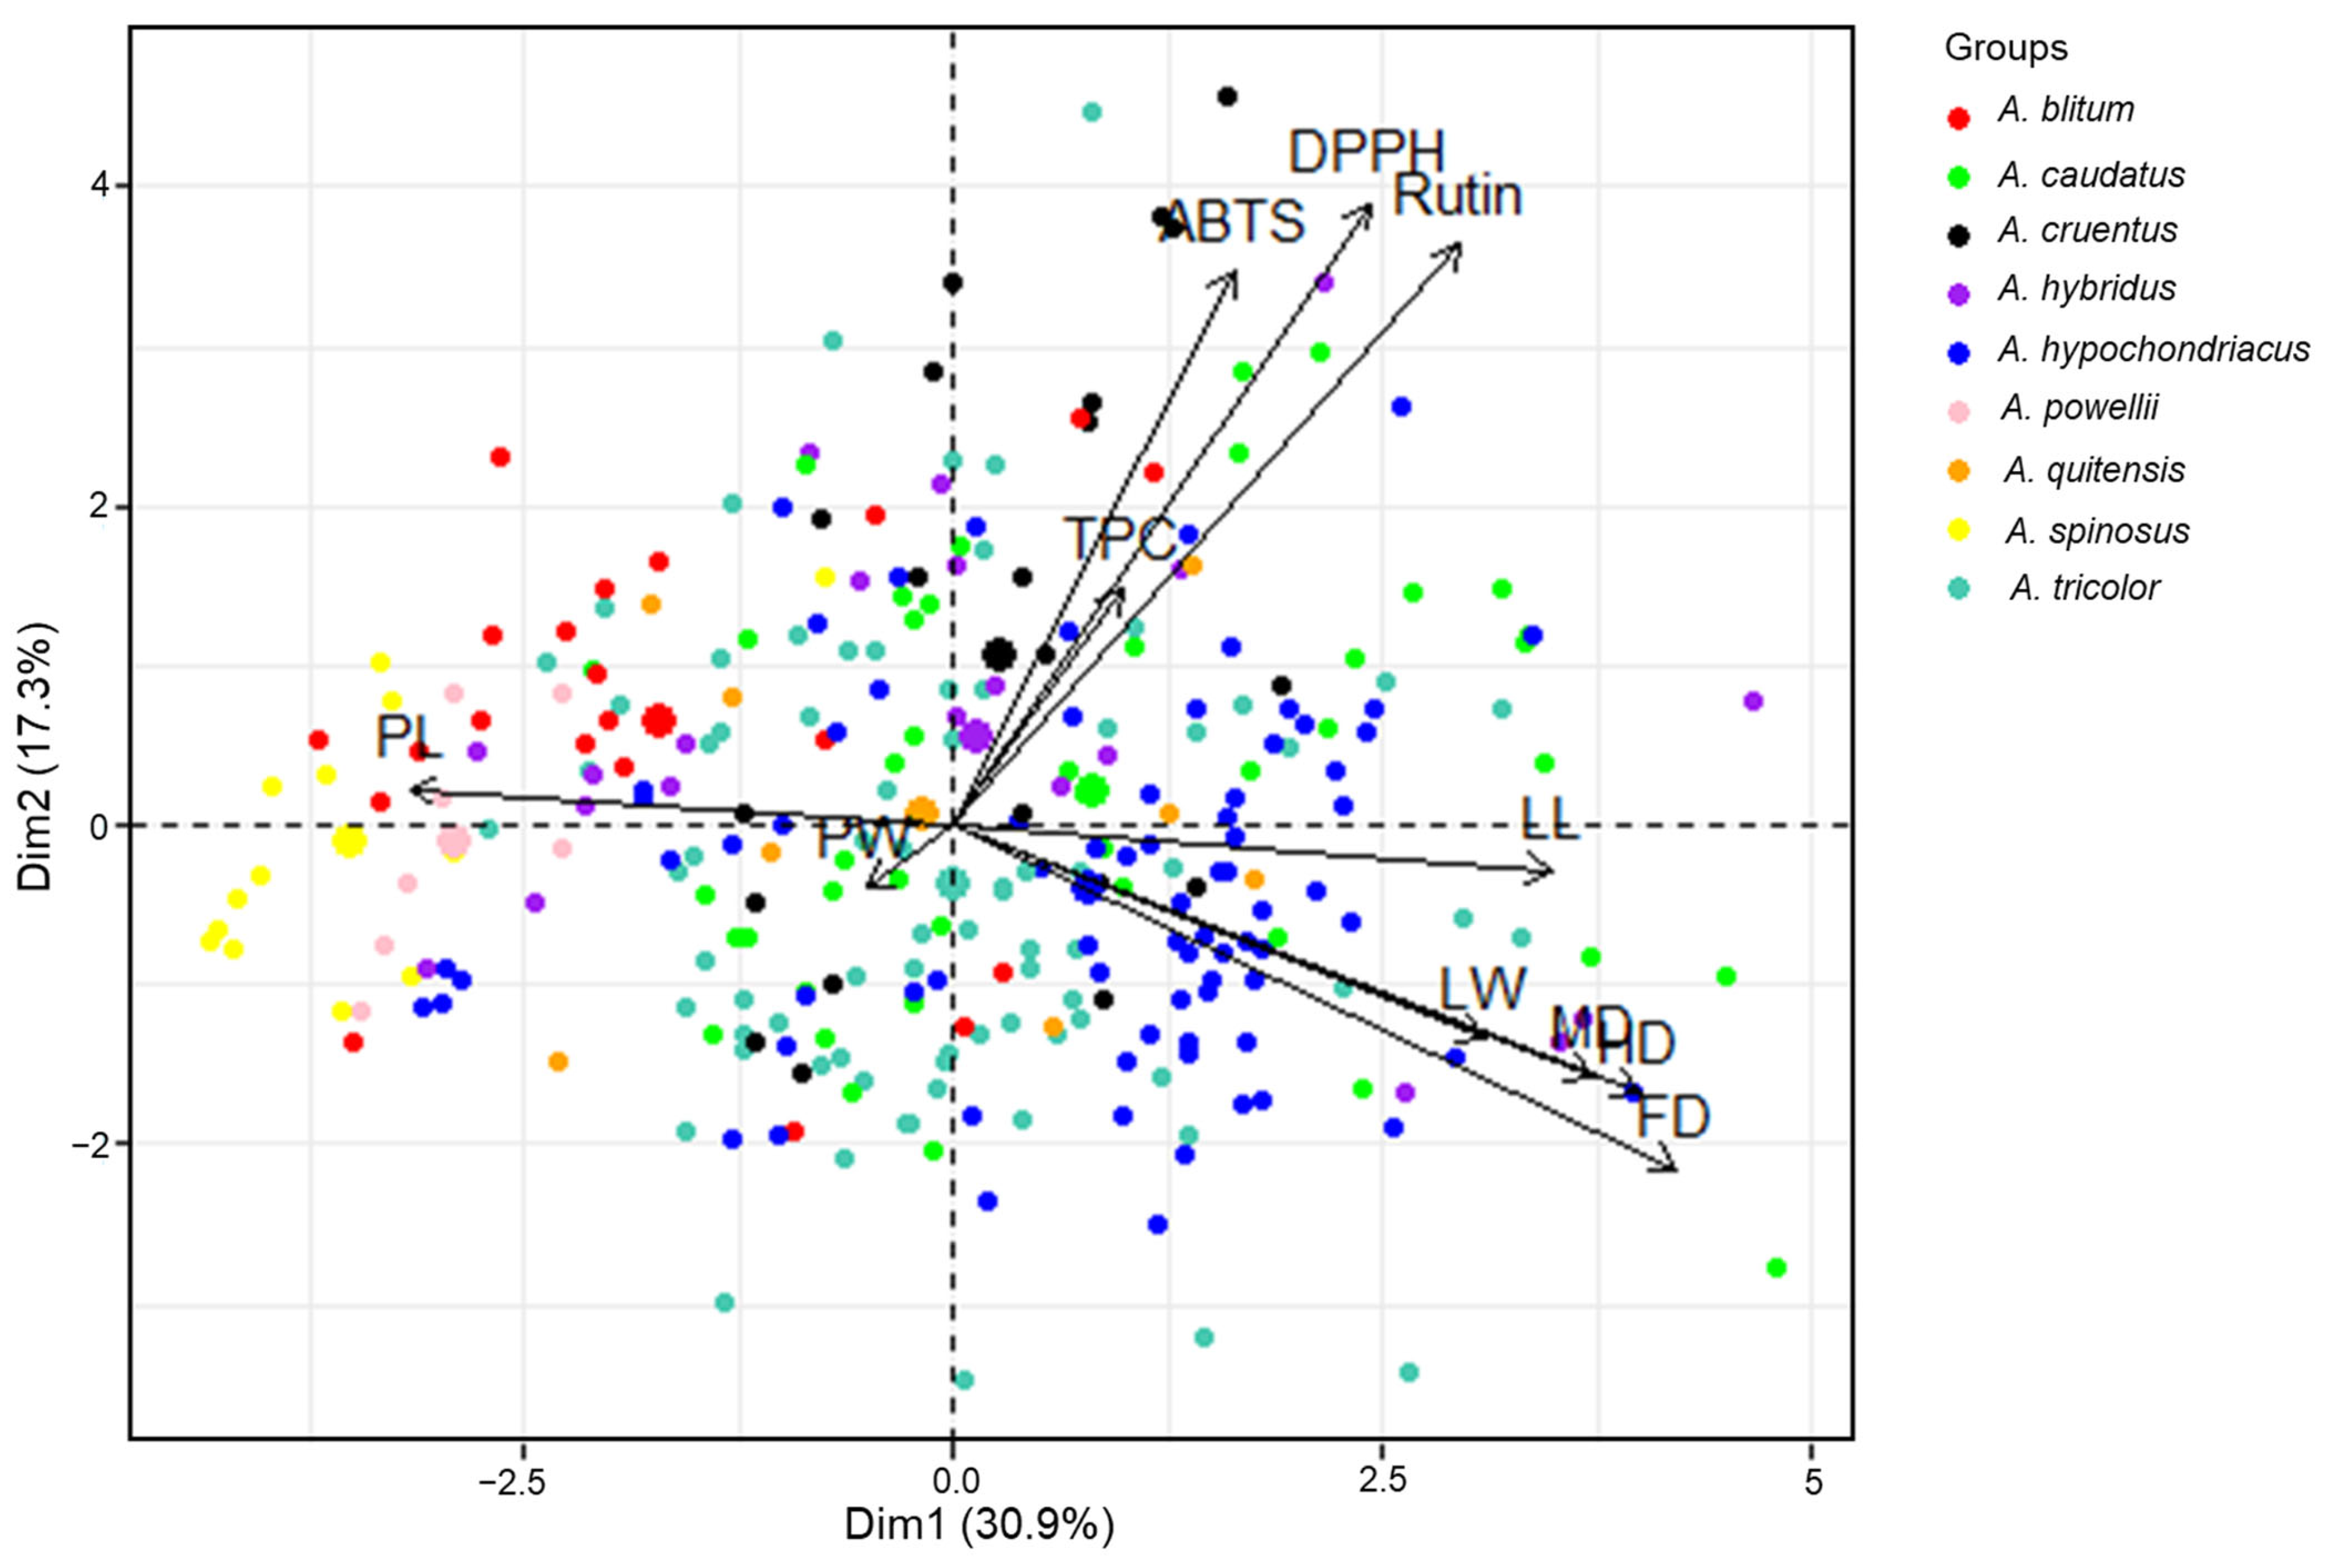
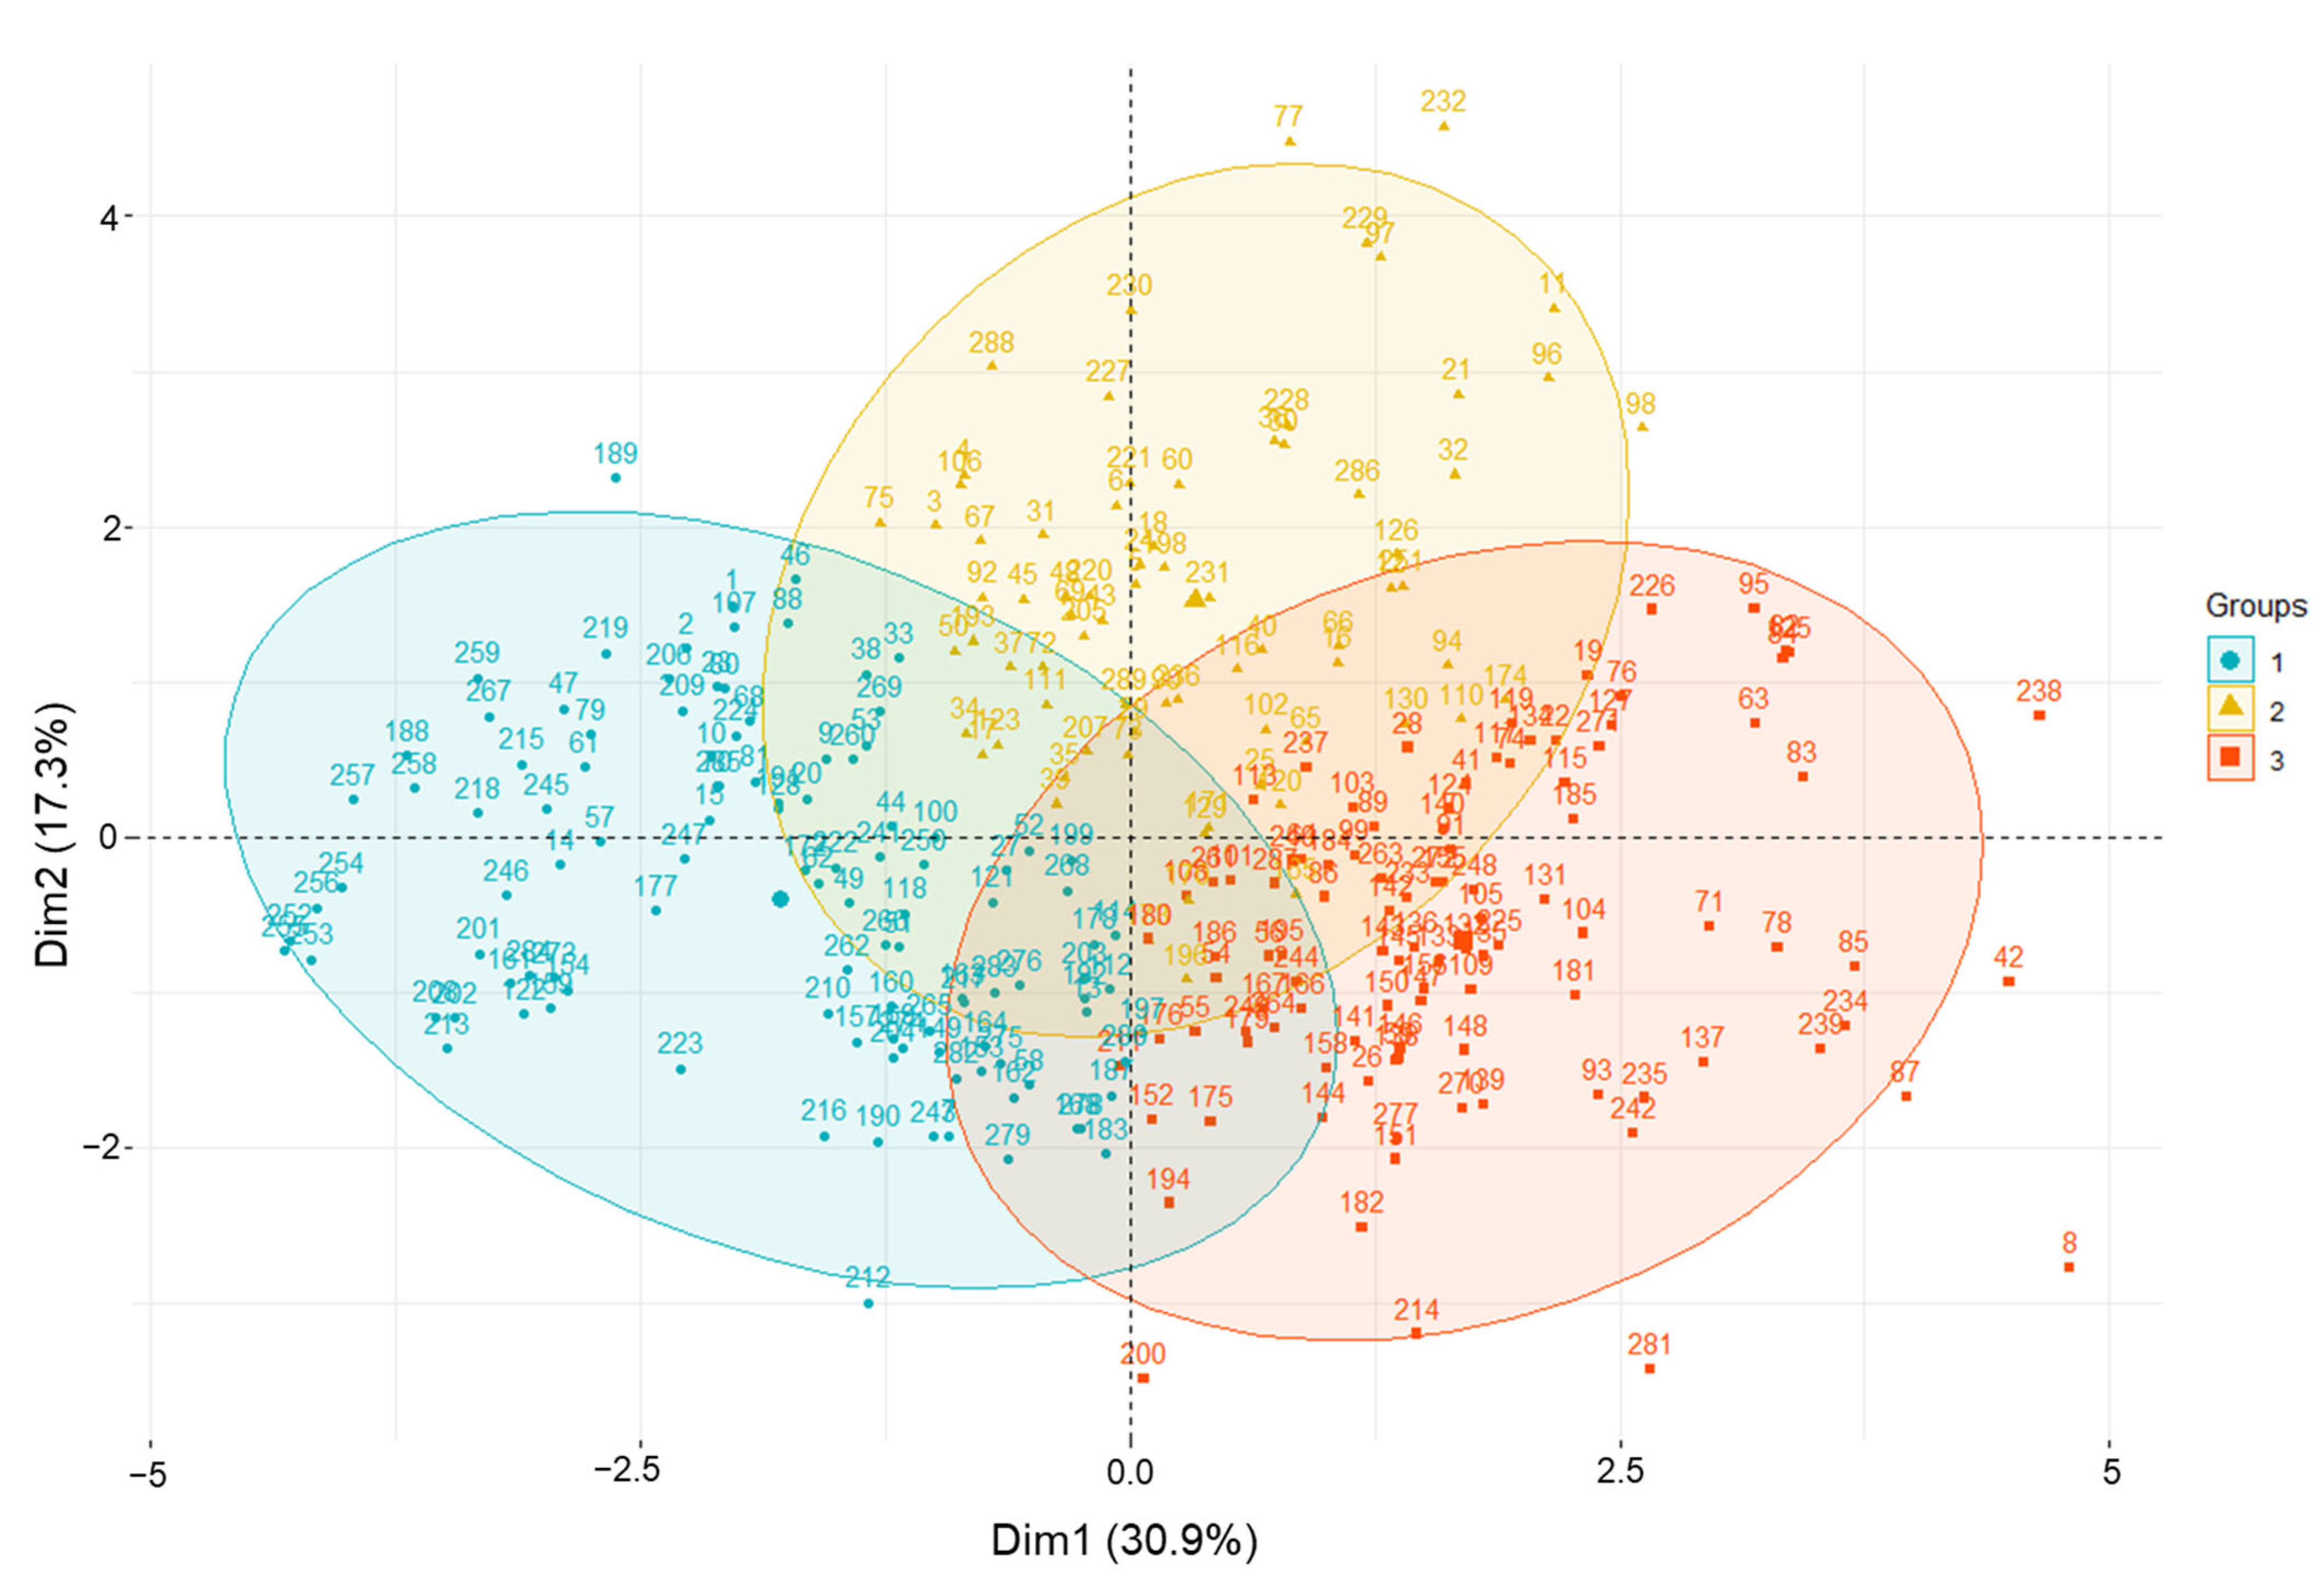
3.3. Pearson’s Correlation, PCA and PLS-DA

The associations between TPC, rutin content, antioxidant activities, and agricultural traits were calculated using Pearson’s correlation analysis. The correlation coefficients (r) and their level of significance are given in Table 4. TPC showed significant positive correlations with rutin content (r = 0.25) and DPPH radical scavenging activity (r = 0.22). Likewise, significant positive associations were observed between rutin content, DPPH radical scavenging activity (r = 0.68), and ABTS radical scavenging activity (r = 0.45). Moreover, the correlation between the two antioxidant activities was strong and significant (r = 0.44). Our results corroborated previous studies that also reported positive associations between antioxidant activities and phytochemical content [15,45,48,49]. Interestingly, regarding the morphological characteristics, LL exhibited a significant positive correlation with rutin content (r = 0.40); hence, this could be an important parameter for the development of high rutin content genotypes. The relationships between the morphological characteristics were also investigated. LL showed significant positive correlations between LW, FD, HD, and MD. Furthermore, FD, HD, and MD showed significant positive correlations with each other. Similarly, other studies obtained positive correlations between LL and LW, as well as FD and MD [44,52].
PCA of the agricultural traits, phytochemical contents, and antioxidant activities of the 289 accessions was performed, which yielded 11 principal components (PCs). PCs 1–4 (Table S2) had eigenvalues >1, and explained 72.62% of the total variance (30.91%, 17.30%, 13.59%, and 10.82%, respectively); therefore, the score and loading plots computed from PC1 and PC2 were used to analyze the distributions of, and associations between, agricultural traits, biochemical contents, and antioxidant activities of amaranth genotypes. The PCA showed the rough distribution of amaranth genotypes according to species. This distribution could occur if the genotypes of species differentially impacted the levels of diverse classes of agricultural characteristics, phytochemical contents, and antioxidant activities (Figure 3). PL (18.12%), PW (16.37%), MD (14.21%), LL (12.45%), and FD (10.16%) made the largest contributions to the variance that was explained by PC1. The main contributors to the variance explained by PC2 were DPPH (27.78%), rutin (24.24%), and ABTS (22.03%). The associations between the contributions observed in the PCA were consistent with the correlations derived from the Pearson’s correlation analysis. According to the score plot, A. spinosus and A. powellii were distributed on the negative side of PC1. The genetic resources of A. spinosus and A. powellii had higher PL values than other species. The comparison between PC1 and PC2 revealed a distinctive aggregation between the accessions of A. powellii and A. cruentus, A. powellii and A. caudatus, A. cruentus and A. spinosus, and A. hypochondriacus and A. spinosus (Figure 3 and Figure S1). In accordance with this, Steffensen et al. [51] demonstrated that Amaranthus species could be distinguished by PCA, based on the polyphenol content of seeds; however, some different results were also noted in the present study. In Steffensen’s results, A. cruentus and A. hypochondriacus were distinctively grouped by PCA, and A. hypochondriacus displayed a higher content of phytochemicals compared with other species [51]; however, in the present study, genotypes of A. hypochondriacus showed a wide variation, and they were not distinct from other Amaranthus species after PCA. These differences could be explained in two main ways. First, the results for amaranth leaf extracts may differ from those for amaranth seed extracts. Second, the findings of this study were based on a large number of genotypes, which allowed for more comprehensive analyses and better comparisons.
PLS-DA was performed to confirm the relationship between agricultural traits and targeted metabolomic profiles (Figure S2). The statistical parameters obtained by PLS-DA were summarized in Table S3. The correlations observed in PLS-DA were similar to the associations observed in Pearson’s correlation analysis and PCA. TPC, rutin content, DPPH, and ABTS showed positive correlations with each other. The morphological traits LL, LW, and PW exhibited positive correlations with TPC, rutin content, DPPH, and ABTS. FD, HD, and MD exhibited positive correlations with each other. In addition, A. cruentus had high level of rutin content, DPPH, and ABTS. A. spinosus, A. powellii, and A. blitum had large size of PLs. Nevertheless, slight differences were observed, PW, for instance, displayed a positive correlation between phytochemical content and antioxidant activities in PLS-DA, but showed negative correlations in PCA. This could be attributed to the different methods used in the study. Overall, PLS-DA provided additional evidence for the relationship between agricultural traits, phytochemical content, and antioxidant activities.
HCPC analysis was conducted based on agricultural traits, phytochemical content, and antioxidant activities. Scatter plots of amaranth samples and loading plots are presented in Figure 4. The values for each group are summarized in Table S4, and the related amaranth genotypes used in this study are listed in Table S5. Cluster 1 contained 112 accessions which, based on PL and PW, were significantly related, and showed the lowest values of TPC, rutin, DPPH, and ABTS. Cluster 2 consisted of 74 accessions and showed the highest levels of TPC, rutin, DPPH, and ABTS. Cluster 3 included 103 accessions with high values for LL, LW, FD, HD, and MD. Based on the distance from the assigned position of each accession in the cluster to the center, the cluster analysis revealed that groups 1–3 were characterized by accession Nos. 255, 232, and 8, respectively. In cluster 2, accessions A. cruentus K038188 (No. 232), A. tricolor IT203379 (No. 77), A. cruentus K038185 (No. 229), A. cruentus IT238341 (No. 97), A. hybridus IT197077 (No. 11), A. caudatus IT238335 (No. 96), and A. hypochondriacus IT238342 (No. 98) were further away from their assigned position to the center, compared with other genotypes. Indeed, these accessions had high values of TPC, rutin content, DPPH, and ABTS, and thus, they could be good medical resources and potential donors for breeding programs for the development of better varieties.

4. Conclusions

This study demonstrated the genotypic diversity in a large population of amaranth accessions, across nine species, based on their agricultural traits, phytochemical content, and antioxidant activities. The findings of the present study suggest that some agricultural traits, including leaf color, flower color, and seed coat color, could indicate the phytochemical content and antioxidant activities of amaranth leaves. In particular, yellow-flowered amaranth genotypes could be important because of the high biochemical content level and antioxidant capacity. Among the Amaranthus species, A. cruentus had the greatest leaf length and width, and A. spinosus developed the highest panicle length. These genetic advantages could be considered when breeding and developing better varieties. On the other hand, A. caudatus accessions displayed the highest average TPC, and A. hybridus accessions exhibited the highest average values of ABTS. In particular, A. cruentus accessions could be good genetic resources since they recorded the highest average level of rutin content and DPPH radical scavenging activity. This species also displayed the second-highest level of ABTS. Overall, seven accessions of amaranth, K038188, IT203379, K038185, IT238341, IT197077, IT238335, and IT238342, were determined as being good medical resources, given the high phytochemical content and antioxidant activities in the leaves of these plants. Our study could provide important context for the development of new varieties with high phytochemical content and antioxidant activity levels.

Supplementary Materials

The following supporting information can be downloaded at: https://www.mdpi.com/article/10.3390/plants11131758/s1. Table S1: Variations of biochemical contents and antioxidant activities in 289 Amaranthus accessions according to seed coat, flower, and leaf colors; Table S2: Principal component analysis of the phytochemicals, antioxidant activities, and agricultural traits of 289 accessions in nine Amaranthus species, with eigenvalues and individual and cumulative contributions of variables in the first five principal components; Table S3: Statistical parameters achieved by PLS-DA; Table S4: Average cluster values of agricultural traits, phytochemicals, and antioxidant activities of 289 accessions of Amaranthus; Table S5: List of 289 Amaranthus genotypes in this study; Figure S1: Principal component biplot for Amaranthus species based on their agricultural traits, phytochemical content, and antioxidant activities using the entire dataset; Figure S2: PLS discriminant analysis between agricultural traits, and phytochemical content and antioxidant activities using the entire dataset.

Author Contributions

W.L. performed research, analyzed data, and wrote the paper. E.Y. performed research and analyzed data. S.L. performed research and analyzed data. H.J.N. performed research and analyzed data. S.J.H. performed research and analyzed data. K.T.D. performed research and wrote the paper. G.-A.L. designed the research, performed research, and wrote the paper. All authors have read and agreed to the published version of the manuscript.

Funding

This work was supported by the Research Program for Agricultural Science and Technology Development (Project No. PJ014859) of National Institute of Agricultural Sciences, Rural Development Administration (Jeonju, Republic of Korea).

Institutional Review Board Statement

Not applicable.

Informed Consent Statement

Not applicable.

Data Availability Statement

Data is contained within the article and Supplementary Materials.

Conflicts of Interest

The authors declare that they have no conflict of interest.

References

  1. Suresh, S.; Chung, J.W.; Cho, G.T.; Sung, J.S.; Park, J.H.; Gwag, J.G.; Baek, H.J. Analysis of molecular genetic diversity and population structure in Amaranthus germplasm using SSR markers. Plant Biosyst. Int. J. Deal. Asp. Plant Biol. 2014, 148, 635–644. [Google Scholar]
  2. Saunders, R.; Becker, R. Amaranthus: A potential food and feed resource. Adv. Cereal Sci. Technol. 1984, 6, 357–396. [Google Scholar]
  3. Sammour, R.H.; Radwan, S.A.; Mira, M. Genetic diversity in genus Amaranthus: From morphology to genomic DNA. Res. Rev. Biosci. 2012, 6, 351–360. [Google Scholar]
  4. Vardhana, H. In vitro antibacterial activity of Amaranthus spinosus root extracts. Pharmacophore 2011, 2, 229–234. [Google Scholar]
  5. Thapa, R.; Blair, M.W. Morphological assessment of cultivated and wild amaranth species diversity. Agronomy 2018, 8, 272. [Google Scholar] [CrossRef] [Green Version]
  6. Andini, R.; Yoshida, S.; Yoshida, Y.; Ohsawa, R. Amaranthus genetic resources in Indonesia: Morphological and protein content assessment in comparison with worldwide amaranths. Genet. Resour. Crop Evol. 2013, 60, 2115–2128. [Google Scholar] [CrossRef] [Green Version]
  7. Jain, S.K.; Wu, L.; Vaidya, K.R. Levels of morphological and allozyme variation in Indian amaranths: A striking contrast. J. Hered. 1980, 71, 283–285. [Google Scholar] [CrossRef]
  8. Kumar, B.S.A.; Lakshman, K.; Jayaveera, K.N.; Shekar, D.S.; Kumar, A.A.; Manoj, B. Antioxidant and antipyretic properties of methanolic extract of Amaranthus spinosus leaves. Asian Pac. J. Trop. Med. 2010, 3, 702–706. [Google Scholar] [CrossRef] [Green Version]
  9. Kusumaningtyas, R.; Kobayashi, S.; Takeda, S. Mixed species gardens in Java and the transmigration areas of Sumatra, Indonesia: A comparison. J. Trop. Agric. 2007, 44, 15–22. [Google Scholar]
  10. Sarker, U.; Islam, M.T.; Rabbani, M.G.; Oba, S. Genotypic variability for nutrient, antioxidant, yield and yield contributing traits in vegetable amaranth. J. Food Agri. Environ. 2014, 12, 168–174. [Google Scholar]
  11. Sarker, U.; Islam, T.; Rabbani, G.; Oba, S. Genotype variability in composition of antioxidant vitamins and minerals in vegetable amaranth. Genetika 2015, 47, 85–96. [Google Scholar] [CrossRef]
  12. Tucker, J.B. Amaranth: The once and future crop. Bioscience 1986, 36, 9–13. [Google Scholar] [CrossRef]
  13. Kasote, D.M.; Katyare, S.S.; Hegde, M.V.; Bae, H. Significance of antioxidant potential of plants and its relevance to therapeutic applications. Int. J. Biol. Sci. 2015, 11, 982–991. [Google Scholar] [CrossRef] [PubMed] [Green Version]
  14. Sarker, U.; Islam, M.T.; Rabbani, M.G.; Oba, S. Phenotypic divergence in vegetable amaranth for total antioxidant capacity, antioxidant profile, dietary fiber, nutritional and agronomic traits. Acta Agric. Scand. Sect. B Soil Plant Sci. 2018, 68, 67–76. [Google Scholar] [CrossRef]
  15. Sarker, U.; Oba, S. Antioxidant constituents of three selected red and green color Amaranthus leafy vegetable. Sci. Rep. 2019, 9, 18233. [Google Scholar] [CrossRef] [Green Version]
  16. Baral, M.; Datta, A.; Chakraborty, S.; Chakraborty, P. Pharmacognostic studies on stem and leaves of Amaranthus spinosus Linn. Int. J. Appl. Biol. Pharm. Technol. 2011, 2, 41–47. [Google Scholar]
  17. Olajide, O.A.; Ogunleye, B.R.; Erinle, T.O. Anti-inflammatory properties of Amaranthus spinosus leaf extract. Pharm. Biol. 2004, 42, 521–525. [Google Scholar] [CrossRef] [Green Version]
  18. Manach, C.; Scalbert, A.; Morand, C.; Rémésy, C.; Jiménez, L. Polyphenols: Food sources and bioavailability. Am. J. Clin. Nutr. 2004, 79, 727–747. [Google Scholar] [CrossRef] [Green Version]
  19. Santhakumar, A.B.; Battino, M.; Alvarez-Suarez, J.M. Dietary polyphenols: Structures, bioavailability and protective effects against atherosclerosis. Food Chem. Toxicol. 2018, 113, 49–65. [Google Scholar] [CrossRef]
  20. Hügel, H.M.; Jackson, N. Polyphenols for the prevention and treatment of dementia diseases. Neural Regener. Res. 2015, 10, 1756. [Google Scholar] [CrossRef]
  21. Kreft, S.; Knapp, M.; Kreft, I. Extraction of rutin from buckwheat (Fagopyrum esculentum Moench) seeds and determination by capillary electrophoresis. J. Agric. Food Chem. 1999, 47, 4649–4652. [Google Scholar] [CrossRef] [PubMed]
  22. Kalinova, J.; Dadakova, E. Rutin and total quercetin content in amaranth (Amaranthus spp.). Plant Foods Hum. Nutr. 2009, 64, 68–74. [Google Scholar] [CrossRef] [PubMed]
  23. Kwon, K.H.; Murakami, A.; Tanaka, T.; Ohigashi, H. Dietary rutin, but not its aglycone quercetin, ameliorates dextran sulfate sodium-induced experimental colitis in mice: Attenuation of pro-inflammatory gene expression. Biochem. Pharmacol. 2005, 69, 395–406. [Google Scholar] [CrossRef]
  24. López-Mejía, O.A.; López-Malo, A.; Palou, E. Antioxidant capacity of extracts from amaranth (Amaranthus hypochondriacus L.) seeds or leaves. Ind. Crop. Prod. 2014, 53, 55–59. [Google Scholar] [CrossRef]
  25. Ahmed, S.A.; Hanif, S.; Iftkhar, T. Phytochemical profiling with antioxidant and antimicrobial screening of Amaranthus viridis L. leaf and seed extracts. Open J. Med. Microbiol. 2013, 3, 16–171. [Google Scholar] [CrossRef] [Green Version]
  26. Bulbul, I.J.; Nahar, L.; Ripa, F.A.; Haque, O. Antibacterial, cytotoxic and antioxidant activity of chloroform, n-hexane and ethyl acetate extract of plant Amaranthus spinosus. Int. J. PharmTech Res. 2011, 33, 1675–1680. [Google Scholar]
  27. Ishtiaq, S.; Ahmad, M.; Hanif, U.; Akbar, S.; Kamran, S.H. Phytochemical and in-vitro antioxidant evaluation of different fractions of Amaranthus graecizan subsp. silvestris (vill.) Brenan. Asian Pac. J. Trop. Biomed. 2014, 412, 965–971. [Google Scholar]
  28. Jin, Y.; Xuan, Y.; Chen, M.; Chen, J.; Jin, Y.; Piao, J.; Tao, J. Antioxidant, antiinflammatory and anticancer activities of Amaranthus viridis L. Extracts. Asian J. Chem. 2013, 25, 8901–8904. [Google Scholar] [CrossRef]
  29. Maiyo, Z.C.; Ngure, R.N.; Matasyoh, J.C.; Chepkorir, R. Phytochemical constituents and antimicrobial activity of leaf extract of three Amaranthus plant species. Afr. J. Biotechnol. 2010, 9, 3178–3182. [Google Scholar]
  30. Sarker, U.; Oba, S. Leaf pigmentation, its profiles and radical scavenging activity in selected Amaranthus tricolor leafy vegetables. Sci. Rep. 2020, 10, 18617. [Google Scholar] [CrossRef]
  31. Sarker, U.; Hossain, M.; Oba, S. Nutritional and antioxidant components and antioxidant capacity in green morph Amaranthus leafy vegetable. Sci. Rep. 2020, 10, 1336. [Google Scholar] [CrossRef]
  32. Sarker, U.; Rabbani, M.; Oba, S.; Eldehna, W.M.; Al-Rashood, S.T.; Mostafa, N.M.; Eldahshan, O.A. Phytonutrients, colorant pigments, phytochemicals, and antioxidant potential of orphan leafy Amaranthus species. Molecules 2022, 27, 2899. [Google Scholar] [CrossRef]
  33. Assefa, A.D.; Jeong, Y.J.; Kim, D.J.; Jeon, Y.A.; Lee, J.R.; Ko, H.C.; Baek, H.J.; Sung, J.S. Assessing phenolic content and antioxidant potential diversity in Allium plants using multivariate data analysis. Hortic. Environ. Biotechnol. 2018, 59, 759–773. [Google Scholar] [CrossRef]
  34. Waterhouse, A.L. Determination of total phenolics. Curr. Protoc. Food Anal. Chem. 2002, 6, I1.1.1–I1.1.8. [Google Scholar]
  35. Tundis, R.; Ursino, C.; Bonesi, M.; Loizzo, M.R.; Sicari, V.; Pellicanò, T.; Manfredi, I.L.; Figoli, A.; Cassano, A. Flower and leaf extracts of Sambucus nigra L.: Application of membrane processes to obtain fractions with antioxidant and antityrosinase properties. Membranes 2019, 9, 127. [Google Scholar] [CrossRef] [PubMed] [Green Version]
  36. Sarker, U.; Hossain, M.N.; Iqbal, M.A.; Oba, S. Bioactive components and radical scavenging activity in selected advance lines of salt-tolerant vegetable amaranth. Front. Nutr. 2020, 7, 587257. [Google Scholar] [CrossRef]
  37. Grosjean, P.; Ibanez, F.; Etienne, M. Pastecs: Package for analysis of space-time ecological series. R Package Version 2014, 1, 1–3. [Google Scholar]
  38. Dieme, R.M.A.; Faye, I.; Zoclanclounon, Y.A.B.; Fonceka, D.; Ndoye, O.; Diedhiou, P.M. Identification of sources of resistance for peanut Aspergillus flavus colonization and aflatoxin contamination. Int. J. Agron. 2018, 2018, 5468602. [Google Scholar] [CrossRef] [Green Version]
  39. Pérez-Enciso, M.; Tenenhaus, M. Prediction of clinical outcome with microarray data: A partial least squares discriminant analysis (PLS-DA) approach. Hum. Genet. 2003, 112, 581–592. [Google Scholar]
  40. Brenner, D.M.; Baltensperger, D.D.; Kulakow, P.A.; Lehmann, J.W.; Myers, R.L.; Slabbert, M.M.; Sleugh, B.B. Genetic resources and breeding of Amaranthus. Plant Breed. Rev. 2010, 19, 227–285. [Google Scholar]
  41. Akaneme, F.I.; Ani, G.O. Morphological assessment of genetic variability among accessions of Amaranthus hybridus. World Appl. Sci. J. 2013, 28, 568–577. [Google Scholar]
  42. Gerrano, A.S.; Jansen van Rensburg, W.S.; Adebola, P.O. Agro-morphological variability of Amaranthus genotypes in South Africa. Acta Hort. 2014, 1035, 183–188. [Google Scholar] [CrossRef]
  43. Bing, Y.U.E.; Ya, X.W.; Jun, L.L.; Zhong, X.Y. QTL analysis for flag leaf characteristics and their relationships with yield and yield traits in rice. Acta Genet. Sin. 2006, 33, 824–832. [Google Scholar]
  44. Gerrano, A.S.; Jansen van Rensburg, W.S.; Adebola, P.O. Genetic diversity of Amaranthus species in South Africa. S. Afr. J. Plant Soil 2015, 32, 39–46. [Google Scholar] [CrossRef]
  45. Li, H.; Deng, Z.; Liu, R.; Zhu, H.; Draves, J.; Marcone, M.; Sun, Y.; Tsao, R. Characterization of phenolics, betacyanins and antioxidant activities of the seed, leaf, sprout, flower and stalk extracts of three Amaranthus species. J. Food Compos. Anal. 2015, 37, 75–81. [Google Scholar] [CrossRef]
  46. Sarker, U.; Oba, S. Protein, dietary fiber, minerals, antioxidant pigments and phytochemicals, and antioxidant activity in selected red morph Amaranthus leafy vegetable. PLoS ONE 2019, 14, e0222517. [Google Scholar] [CrossRef] [Green Version]
  47. Sarker, U.; Oba, S. Phenolic profiles and antioxidant activities in selected drought-tolerant leafy vegetable amaranth. Sci. Rep. 2020, 10, 18287. [Google Scholar] [CrossRef]
  48. Sarker, U.; Oba, S. Polyphenol and flavonoid profiles and radical scavenging activity in leafy vegetable Amaranthus gangeticus. BMC Plant Biol. 2020, 20, 499. [Google Scholar] [CrossRef]
  49. Bang, J.H.; Lee, K.J.; Jeong, W.T.; Han, S.; Jo, I.H.; Choi, S.H.; Cho, H.; Hyun, T.K.; Sung, J.; Lee, J.; et al. Antioxidant activity and phytochemical content of nine Amaranthus species. Agronomy 2021, 11, 1032. [Google Scholar] [CrossRef]
  50. Floegel, A.; Kim, D.O.; Chung, S.J.; Koo, S.I.; Chun, O.K. Comparison of ABTS/DPPH assays to measure antioxidant capacity in popular antioxidant-rich US foods. J. Food Compos. Anal. 2011, 24, 1043–1048. [Google Scholar] [CrossRef]
  51. Steffensen, S.K.; Rinnan, Å.; Mortensen, A.G.; Laursen, B.; de Troiani, R.M.; Noellemeyer, E.J.; Janovska, D.; Dusek, K.; Délano-Frier, J.; Taberner, A.; et al. Variations in the polyphenol content of seeds of field grown Amaranthus genotypes. Food Chem. 2011, 129, 131–138. [Google Scholar] [CrossRef]
  52. Patial, M.; Chauhan, A.; Singh, K.P.; Sharma, D. Character association and path coefficient analysis in grain amaranth (Amaranthus spp.). Int. J. Agric. Environ. Biotechnol. 2014, 7, 101–106. [Google Scholar] [CrossRef]
Figure 1. Percentage distributions of amaranth accessions based on the morphological characters of leaf, flower, and seed coat colors.
Plants 11 01758 g001
Figure 2. Variations of TPC, rutin, DPPH, and ABTS according to leaf, flower, and seed coat colors. Different letters indicate significant differences between groups (p < 0.05). TPC = total phenolic content, DPPH = DPPH radical scavenging activity, ABTS = ABTS radical scavenging activity.
Plants 11 01758 g002
Figure 3. Principal component biplot for Amaranthus species based on their agricultural traits, phytochemical content, and antioxidant activities using the entire dataset. TPC = total phenolic content, DPPH = DPPH radical scavenging activity, ABTS = ABTS radical scavenging activity, LL = leaf length, LW = leaf width, PL = panicle length, PW = panicle width, FD = days until 50% flowering, HD = days until 50% heading, MD = days until maturity.
Plants 11 01758 g003
Figure 4. Principal component analysis biplot showing amaranth genetic resource clustering based on agricultural traits, phytochemical content, and antioxidant activities using the whole dataset.
Plants 11 01758 g004
Table 1. Basic statistics of agricultural traits, the phytochemical content, and antioxidant activities of 289 Amaranthus accessions.
CharacterMaximumMinimumMeanSDCV (%)
TPC (µg·GAE/mg·DE)958.19159.62456.05165.3536.26
Rutin (mg/g)42.300.1210.068.5484.89
DPPH (µg·TE/mg·DE)49.221.0320.249.3946.39
ABTS (µg·TE/mg·DE)449.6175.20200.7350.9925.40
LL (cm)32.166.8421.006.2029.52
LW (cm)21.333.0011.733.6531.12
PL (cm)29.100.666.265.5188.02
PW (cm)6.160.501.040.7067.31
FD (day)108.0035.0056.3713.1923.40
HD (day)125.0045.0071.2211.3415.92
MD (day)162.0054.0097.8223.4623.98
TPC: total phenolic content; DPPH: DPPH radical scavenging activity; ABTS: ABTS radical scavenging activity; LL: leaf length; LW: leaf width; PL: panicle length; PW: panicle width; FD: days until 50% flowering; HD: days until 50% heading; MD: days until maturity; SD: standard deviation; CV: coefficient of variation.
Table 2. Comparison of agricultural traits of nine Amaranthus species.
Scientific NameNo. AccValuesLL
(cm)
LW
(cm)
PL
(cm)
PW
(cm)
FD
(day)
HD
(day)
MD
(day)
A. blitum21Range6.8–30.03.5–18.41.8–22.80.5–1.537–6245–6977–87
Mean14.38 cd8.87 bc6.54 bcd0.97 ab44.10 bc62.19 b81.10 b
CV (%)57.5151.8667.1327.8416.879.714.66
A. caudatus43Range13.7–29.87.9–19.51.0–16.80.5–3.038–10865–12580–162
Mean22.05 ab12.75 a4.13 d0.91 b60.74 a74.19 a101.00 ab
CV (%)19.0022.8275.5458.2422.7917.8127.35
A. cruentus22Range16.3–32.26.1–21.32.2–19.20.5–4.937–7663–7778–133
Mean25.65 a13.30 a8.06 bcd1.64 a52.64 abc66.55 ab87.18 b
CV (%)13.8028.0559.9380.4916.475.4416.57
A. hybridus21Range10.3–29.55.8–16.31.5–21.00.5–1.637–8665–10178–145
Mean21.90 ab11.22 ab8.54 bc0.86 b55.86 ab72.71 a96.24 b
CV (%)26.2628.1576.0038.3729.4718.4324.89
A. hypochondriacus77Range8.8–30.36.3–19.81.0–29.10.5–3.035–9852–11877–146
Mean24.49 a12.38 a5.00 cd0.93 b60.08 a74.05 a113.36 a
CV (%)15.1914.14120.0049.4619.6415.2321.65
A. powellii7Range8.2–16.54.9–10.46.7–18.10.5–2.037–4858–6578–86
Mean11.67cd7.00 bc13.07 ab0.99 ab41.86 bc61.43 b82.86 b
CV (%)23.9131.7128.6250.5110.275.394.80
A. quitensis8Range8.9–23.57.2–13.52.8–14.40.5–2.638–7363–7978–133
Mean18.03 bc10.90 ab6.86 bcd1.09 ab55.50 abc70.25 ab107.63 ab
CV (%)27.9019.8268.6658.7224.479.3724.56
A. spinosus13Range7.7–21.04.5–9.55.6–25.80.5–1.638–6758–6677–86
Mean10.30 d5.53 c15.48 a0.95 ab40.69 c59.46 b79.15 b
CV (%)34.6624.2332.2428.4219.864.884.35
A. tricolor77Range7.0–32.13.0–19.20.7–21.00.5–6.237–10858–11354–162
Mean20.15 b12.55 a5.31 cd1.13 ab58.82 a73.09 a92.04 b
CV (%)25.4632.0379.1076.9920.1614.9018.70
p-Value ********************
LL: leaf length; LW: leaf width; PL: panicle length; PW: panicle width; FD: days until 50% flowering; HD: days until 50% heading; MD: days until maturity; CV: coefficient of variation. Values within a column with different letters are significantly different (p < 0.05). **, *** represent significant at p < 0.01, 0.001, respectively.
Table 3. Comparison of the total phenolic content (TPC), rutin content, and DPPH and ABTS antioxidant activities of nine Amaranthus species.
Scientific NameNo. AccValuesTPC (µg·GAE/mg·DE)Rutin
(mg/g)
DPPH(µg·TE/mg·DE)ABTS (µg·TE/mg·DE)
A. blitum21Range204.75–958.190.29–27.524.90–37.87100.95–327.52
Mean438.00 ab7.37 b21.53 ab198.09 abcd
CV (%)43.30100.1439.3926.62
A. caudatus43Range238.02–958.190.19–42.305.98–48.75123.62–449.61
Mean494.27 a12.6 ab22.45 a216.22 abc
CV (%)35.7176.3549.4931.20
A. cruentus22Range220.23–727.254.74–38.808.09–49.22140.05–309.64
Mean468.7 ab17.88 a24.34 a228.08 ab
CV (%)36.9762.4246.0619.84
A. hybridus21Range239.01–692.330.82–33.796.51–34.15155.46–336.63
Mean454.88 ab12.71 ab20.78 ab236.97 a
CV (%)29.4363.0236.5720.28
A. hypochondriacus77Range218.26–941.390.37–31.113.59–41.74105.40–291.94
Mean473.84 ab11.03 b18.5 ab196.11 bcd
CV (%)35.7855.1243.2420.63
A. powellii7Range176.09–453.483.68–12.607.28–20.5392.80–304.71
Mean277.18 b5.68 b12.19 ab184.30 cd
CV (%)33.3256.5134.2137.03
A. quitensis8Range234.07–580.651.96–16.888.12–35.82122.00–252.35
Mean450.76 ab8.43 b21.84 ab209.35 abcd
CV (%)30.3956.5840.4320.65
A. spinosus13Range239.01–647.860.61–21.705.11–27.7975.20–212.76
Mean399.28 ab3.74 b11.62 b160.84 d
CV (%)31.96150.8058.5223.69
A. tricolor77Range159.62–775.680.12–40.421.03–47.3996.97–272.61
Mean444.93 ab7.08 b21.11 ab187.05 cd
CV (%)35.73118.6444.1022.65
p-Value ·*********
TPC: total phenolic content; DPPH: DPPH radical scavenging activity; ABTS: ABTS radical scavenging activity; CV: coefficient of variation. Values within a column with different letters are significantly different (p < 0.05). · and *** represent significant at p < 0.1, 0.001, respectively.
Table 4. Pearson’s correlation coefficients of agricultural traits, total phenolic content, rutin content, and DPPH and ABTS antioxidant capacities.
VariablesTPCRutinDPPHABTSLLLWPLPWFDHD
Rutin0.25 ***
DPPH0.22 ***0.68 ***
ABTS0.010.45 ***0.44 ***
LL0.050.40 ***0.110.15 **
LW−0.010.18 **0.030.000.75 ***
PL−0.02−0.16 **−0.23 ***−0.16 **−0.25 ***−0.25 ***
PW0.050.02−0.06−0.090.080.15 *0.43 ***
FD0.100.13 *0.12 *0.010.33 ***0.40 ***−0.43 ***−0.02
HD0.060.19 **0.17 **0.070.26 ***0.28 ***−0.31 ***−0.030.80 ***
MD0.080.18 **0.12*0.030.30 ***0.19 **−0.37 ***−0.050.63 ***0.62 ***
TPC: total phenolic content; DPPH: DPPH radical scavenging activity; ABTS: ABTS radical scavenging activity; LL: leaf length; LW: leaf width; PL: panicle length; PW: panicle width; FD: days until 50% flowering; HD: days until 50% heading; MD: days until maturity. *, **, *** represent significant at p < 0.05, 0.01, 0.001, respectively.
Publisher’s Note: MDPI stays neutral with regard to jurisdictional claims in published maps and institutional affiliations.

