
Three-Dimensional Spatial Distribution and Influential Factors of Soil Total Nitrogen in a Coal Mining Subsidence Area

1
School of Public Administration, North China University of Water Resources and Hydropower, Zhengzhou 450046, China
2
College of Water Resources, North China University of Water Resources and Hydropower, Zhengzhou 450046, China
*
Author to whom correspondence should be addressed.
Sustainability 2022, 14(13), 7897; https://doi.org/10.3390/su14137897
Submission received: 14 May 2022
/
Revised: 21 June 2022
/
Accepted: 27 June 2022
/
Published: 28 June 2022
Abstract
:Soil nitrogen is very important for crop growth and development. However, the factors affecting the three-dimensional spatial distribution of soil total nitrogen (TN), particularly in coal mining subsidence areas, are unclear. In this study, Markov geostatistics was used to analyse the three-dimensional spatial distribution characteristics and influential factors of TN by examining 180 soil samples from the Zhaogu mine in China. The results showed that the TN content was significantly different at different soil depths (0–20, 20–40, 40–60 cm) and decreased with increasing soil depth. The variation coefficient of the TN content decreased gradually from top to bottom, ranging from 18.18 to 25.62%. In addition, the TN content was greatly affected by mining subsidence, rainfall, irrigation, fertilization and management mode. The factors that influenced the TN content also varied across different slope positions. The TN content of the upslope was the highest, and the TN content of the middle slope was the lowest. These results can provide research ideas and technical countermeasures for ecological environment improvement and sustainable land development in coal mining subsidence areas.
1. Introduction
China is a large energy consumer. Abundant natural resources are very important to China’s economic development, especially coal and arable land [1]. Coal energy accounts for approximately 75% of the total primary energy production in China. More than 95% of coal is mined underground in China [2]. However, underground coal mining produces cracks and land subsidence [3,4]. Subsidence refers to the surface movement or local sudden depression caused by the movement of the overlying strata, ground subsidence or cracks caused by underground coal mining activities [2]. Underground coal mining has destroyed many land resources, most of which are farmland. Additionally, population growth and economic growth have led to a dramatic increase in food demand worldwide, and underground coal mining can also negatively impact vegetation and soil quality and alter soil physicochemical properties, putting food security at risk [5,6]. Coal mining subsidence leads to the decrease of soil nutrient content in the arable land in the mining area; therefore, the quality of soil in arable land in mining areas is degraded, affecting the growth of crops and reducing grain yield [7]. Coal mining subsidence will also accelerate soil erosion and underground leakage, leading to a serious loss of total nitrogen (TN) in the soil, making the land more barren and affecting the growth of vegetation in a mining area [8,9]. Approximately 200 km2 of agricultural areas in China have been affected by underground coal mining, resulting in soil erosion and degradation of arable land [10]. In addition, the subsidence area of mining areas increases by approximately 20,000 hectares every year [11,12]. Additionally, the eastern plain of China is characterised by long-term, multifrequency and high-intensity mining. The underground water level of the mining area is high, and coal mining subsidence is likely to form a large subsidence water area, resulting in serious damage to cultivated land and a reduction in grain production [13,14,15]. Therefore, it is necessary to improve the soil quality of the mining area and promote the sustainable development of the ecological environment of the cultivated land [16,17,18].
Soil nutrients are widely used to study and analyze ecosystem degradation [19]. External environment can influence spatial variability of soil nutrients [20,21]. Soil nutrients are important for food security and sustainable development [22,23]. Soil TN is an important indicator used to measure soil quality. Soil TN provides plants with sufficient nitrogen by enhancing carbon absorption and promoting crop photosynthesis, thereby promoting plant growth. In addition, fertilization management is also the key to improving the soil total nitrogen content [24]. In addition, soil TN is an important nutrient element index. The quantity and quality of soil TN directly affect soil characteristics and can reflect the level of soil fertility [23,25,26]. Therefore, an in-depth understanding of the three-dimensional spatial variation characteristics of soil total nitrogen will help to improve the sustainable development of mining land and provide valuable guidance and a basis for land consolidation and precision agriculture in mining areas [27,28,29]. Soil is a continuous three-dimensional entity with spatial variation in both horizontal and vertical directions. By studying soil characteristics through three-dimensional spatial distribution, a more comprehensive understanding of soil quality can be obtained [30,31]. At present, research on the spatial variation in soil properties mainly focuses on the two-dimensional horizontal direction, and the properties of different soil layers are discontinuous in the vertical direction. If the influence of the vertical direction is ignored, the crop availability of nutrient elements in different soil layers will be affected. Markov chain theory has been introduced into the field of spatial distribution in recent years. This method uses transition probability to describe the spatial variation of elements, which is descriptive, easy to understand, and well supported by random theory [32,33,34].
At present, domestic and foreign scholars mainly study the effects of soil erosion, land use change and other factors on soil total nitrogen, in grassland, forestland, wetland, and cultivated land areas, thus providing a good foundation for regional agricultural soil. The evaluation of total nitrogen provides a theoretical basis [35]. Markov geostatistical methods are widely used in the analysis of soil salinity, soil saturated hydraulic conductivity, heavy metal contents, water content, soil texture, and the soil clay content [36]. For example, Zhang et al. (2022) studied the spatial driving force of grassland degradation on nutrients such as total nitrogen in the topsoil of an alpine meadow in Sanjiangyuan National Park. The research results can provide theoretical support for the management and restoration of soil nutrient function [37]. Tian et al. (2022) studied the effect of different land use types on soil total nitrogen. The study found that the different land use types had a significant impact on nitrogen distribution [38]. Turgay Dindaroglu et al. (2021) investigated soil organic carbon and total nitrogen contents in a semiarid karst ecosystem. The analysis showed that soil total nitrogen, organic carbon, pH and land use were the most effective variables that affected the distinction between depressions and nondepressions in karst ecosystems. Among them, forest and pasture soil total nitrogen and organic carbon had the highest values, while farmland had the lowest values [39]. Yongqiang Zhang et al. (2021) examined different vegetation types and altitudes of the Yunnan Mountains and analysis of soil organic carbon and total nitrogen content. The results showed that vegetation type, altitude and pH were the main factors [40]. Jinlin Li et al. (2018) used the Markov chain and kriging interpolation methods to study the soil texture in the mountainous area of Northwest China. The results showed that the kriging interpolation method has a certain smoothing effect, which reduces the accuracy of the simulation; the Markov stochastic simulation method realizes the stochastic simulation of spatial variables, which is more suitable for the study of soil texture in mountainous areas [41]. Badreddine Dahmoune et al. (2019) used the Markov chain model to study the earthquake disaster in northwestern Algeria; and used the transition probability matrix to simulate the probability of earthquake occurrence in the next few decades [42]. Afsaneh Ghaffari Rad et al. (2021) used the Markov chain method to select drill bits for different sedimentary formations and proposed appropriate drill bits for different sedimentary formations [43]. However, in summary, there are few studies of soil TN in coal mining subsidence areas, especially three-dimensional spatial simulation research, which is not conducive to the accurate evaluation of soil total nitrogen in mining areas and ecological restoration research.
Therefore, this study aims to (1) construct the three-dimensional spatial distribution of soil TN by using the Markov stochastic simulation method, (2) analyse the differences in the spatial distribution of soil TN at different locations and (3) explore the influence of the spatial distribution of the main influential factors of total nitrogen.
2. Materials and Methods
2.1. Study Area
The study area (112.53°–113.63°E, 34.8°–35.5°N) is located in the Zhaogu No. 2 Mine in northwestern Henan Province, China (Figure 1). The average coal seam thickness of the Zhaogu No. 2 Mine is 6.16 m. The study area is approximately 69,300 m2, of which nearly 85% is cultivated land and 15% is water accumulation. The slope of the study area is less than 6°, and the slope length is approximately 400 m. The region has a semiarid and semihumid continental monsoon climate, and the ecology is relatively fragile. The mean annual precipitation is approximately 650 mm, and rainfall from July to September accounts for 75% of the total amount. The mean annual temperature is 14 °C, with the lowest temperature in February and the highest in August. The mean annual evaporation is approximately 2039 mm. The main soil type in the study area is cinnamon soil. The main crops are summer maize and winter wheat, and routine field management is carried out [44].
2.2. Soil Sampling and Analysis
In May 2017, 900 soil samples were collected in the study area, as shown in Figure 2. Soil samples were collected at depths of 0–20 cm, 20–40 cm, and 40–60 cm, with a horizontal collection interval of 50 m. Sampling at each point was carried out in a plum blossom shape, and five soil samples were collected from each sampling point and mixed into one sample. Handheld GPS was used to record the coordinates of each sampling point. During data analysis, it is necessary to convert the GPS data to the Beijing 54 coordinate system. The sampling distribution is shown in Figure 1 c, and the layout of each soil sampling point is shown in Figure 1 d. Soil samples were transported to the laboratory on ice packs, air-dried and hand-sieved through a 1 mm sieve to remove various impurities. The TN content of the soil was determined by Kjeldahl distillation [45].
2.3. Markov Geostatistical Methods
The Markov geostatistical method uses transition probability to describe the spatial variation of regional variables and uses sequence indication simulation or annealing simulation algorithms to generate random simulation data based on measured data [46]. In addition, the method can also incorporate a variety of data modelling techniques in the simulation process to reflect the spatial distribution and mutual conversion laws of variables, as well as the asymmetry and anisotropy of the spatial distribution of the research object. The introduction of transition probability makes the geostatistical spatial modelling process simpler and easier to understand than traditional methods [47]. Markov geostatistics is an effective method to solve the spatial relationship of variables of research objects, and its basic tool is the transition probability matrix (). The expression is as follows:
where represents the conditional probability, that is, the probability of at point under the condition that at point occurs.
If the variable is stationary, then the conditional probability depends only on the step size.
There are three main types of Markov geostatistical models: continuous, discrete and embedded.
- (1)
- Continuous Markov chain
The expression of a continuous Markov chain in geostatistics is a continuous distribution, and its transition probability matrix expression is as follows:
In the formula, is the matrix; is the -order transition intensity matrix, representing the rate of change.
- (2)
- Discrete Markov Chains
For a given step size, a discrete Markov chain has the following properties:
where the -step transition probability is equal to the power of the one-step transition probability, and is the sampling interval. In modelling, an appropriate spatial step is usually selected, and the discrete Markov process is used to approximate the spatial continuous distribution of soil properties to obtain approximate data in theory.
- (3)
- Embedded Markov chain
Embeded Markov chains are commonly used in geostatistics. The transfer probability embedded in the Markov chain is defined as the probability that soil characteristic is distributed below and soil characteristic is distributed above, and the vertical embedding transfer probability can be defined as:
where and represent the occurrence of embedding. The relationship between continuous transfer intensity and embedded transfer probability is as follows:
where represents the conditional probability and is the average length of geological type in the direction.
The general steps of the Markov method are as follows: (1). Calculate the transition probability in the X-Y direction and the Z direction; (2). Build the Markov chain model in the horizontal and vertical directions; (3). Use the Markov chain model for conditional simulation.
2.4. Data Processing
The maximum value, minimum value, mean, standard deviation, coefficient of variation, and K-S test were carried out by SPSS 20.0. p < 0.05 was considered a significant difference. The coefficient of variation of soil total nitrogen can be divided into three grades: weak variation (CV < 15%), moderate variation (15% ≤ CV ≤ 35%) and strong heterogeneity (CV > 35%) [3]. The submodule T-PROGS in GMS 7.1 was used to calculate the one-dimensional continuous Markov chain model and its characteristic parameters (distribution ratio, average length and maximum entropy coefficient) of soil texture types in the study area in the vertical and horizontal directions. Then, a three-dimensional continuous Markov chain model was generated to simulate the three-dimensional distribution of soil texture types in the study area.
3. Results
3.1. Descriptive Statistics
Statistical analysis of the soil total nitrogen content in different soil layers in the study area is shown in Table 1. If the data are partially and normally distributed, the data need to be transformed to fit the normal distribution. The K-S test results of the total nitrogen content of each soil layer were 0.756, 0.832, and 0.861, and the data were in line with a normal distribution. It can be seen from the coefficient of variation that the variation range of total nitrogen content was 18.18–25.62%. The coefficient of variation of the total nitrogen content in the soil layer was the largest, i.e., 25.62%. The maximum value of the TN content in the 0–20 cm soil layer was 2.38 times the minimum value, the maximum value of the TN content in the 20–40 cm soil layer was 1.98 times the minimum value, and the maximum value of the TN content in the 40–60 cm soil layer was 1.72 times the minimum value. The TN content gradually decreased from the upper layer to the lower layers. Underground coal mining had the greatest influence on the TN content in the surface soil. Fertilization and irrigation additionally promoted the accumulation of TN in the surface soil, so the TN content in the surface soil was the highest.
The study found a significant positive correlation between the soil TN content in different soil layers, as shown in Table 2. The correlation between the 20–40 cm soil layer and the 40–60 cm soil layer was the highest. The results showed that with increasing soil depth, the difference in the spatial distribution of the TN content gradually decreased.
3.2. Descriptive Statistics
Based on the change in the soil total nitrogen in the vertical direction in the coal mining subsidence area, the embedded transition probability matrix between different contents of total nitrogen at a depth of 60 cm was calculated according to Equation (1), and the result is shown in Equation (6), where a represents a total nitrogen content greater than 1.45 g/kg, b represents a total nitrogen content between 1.25 and 1.45 g/kg, c represents a total nitrogen content between 0.95 and 1.25 g/kg, d represents a total nitrogen content between 0.75 and 0.95 g/kg, and e represents a total nitrogen content less than 0.75 g/kg.
It can be seen from the above transition probability matrix that the TN in the soil from the surface layer to the lower layer, and transfers from a to b (0.46), a to c (0.42), b to a (0.51), b to c (0.39), c to b (0.33), c to d (0.36), d to c (0.46), d to e (0.35), e to c (0.32), and e to d (0.53) were more common. Transfers between a and d, between a and e, between b and e, and between b and d occurred less frequently. The transfer values on the two slashes parallel to the diagonal line are larger, indicating that more total nitrogen was transferred between adjacent values.
Based on formula 2, the transfer intensity matrix between the various values of soil total nitrogen in the vertical direction was obtained as shown in formula 7. The values on the diagonal are all negative, and the absolute value is the largest. All other values are positive, and the sum of the individual values in each row is 0.
Combined with the transition probabilities of the five numerical intervals of a, b, c, d, and e, a Markov chain model of the vertical direction of the soil total nitrogen content was established, as shown in Figure 3.
Starting from point (0, 1), the intersection of the tangent of the self-transfer Markov chain and the abscissa is the average length of the corresponding soil total nitrogen in the vertical direction, that is, the average thickness. The distribution ratio and average length of the soil total nitrogen content in the five intervals in the vertical direction are shown in Table 3.
The embedded Markov chain model was used to describe the transfer probability of soil total nitrogen in the vertical direction. As shown in Figure 3 and Table 3, soil total nitrogen contents between 0.75 g/kg and less than 0.75 g/kg accounted for a large proportion, and the average length was relatively long, which was most widely distributed in the study area, indicating that the distribution of soil TN was more continuous than that in the other ranges. From to Table 3, it can be seen that in the 20–40 and 40–60 cm soil layers, the soil TN content was in the range of d and e. In the 0–20 cm soil layer, the variation range of the TN content was the largest, ranging from 0.71 to 1.69 g/kg. This also indicates that the surface layer was most affected by coal mining subsidence.
In the horizontal direction, the distance between adjacent sampling points was much larger than the distance between adjacent sampling points in the vertical direction. Therefore, the accuracy of the transfer probability of the soil TN content in the horizontal (X-Y) direction was lower than that in the vertical direction, which can roughly reflect the total soil nitrogen content. The transition probability and Markov chain model of the soil TN content in the horizontal direction are shown in Figure 4. The transfer probability of the soil TN content in the study area in the horizontal (X-Y) direction and the vertical direction was similar to that of the Markov chain model. The fitting degree was smaller than the fitting degree of the measured soil TN and the Markov chain model in the vertical direction, and the step size in the horizontal direction was larger than that in the vertical direction, indicating that the autocorrelation range of the soil TN content in the horizontal direction was greater than that in the vertical direction.
3.3. Three-Dimensional Spatial Distribution of Soil Total Nitrogen Influential Factors
Geostatistics software (T-PROGS) was used to conduct 100 random simulations of the soil TN content in the study area. The simulation results were processed according to the probability distribution of the soil TN content. To obtain better visual effects, the vertical direction was enlarged by 80 times. The simulation results reflected the possibility of spatial distribution of soil total nitrogen content. The simulation results of random sampling 6 times are shown in Figure 5.
Figure 5 and Figure 6 show that the three-dimensional spatial distribution trend of the soil TN content of different simulation results was basically the same; that is, the soil TN content first decreased and then increased from the upper slope to the lower slope, with the highest TN content on the upper slope and the lowest total nitrogen content on the middle slope, and the TN content on the lower slope was slightly lower than that on the upper slope. The TN content on the upper and lower slopes was mainly greater than 1.25 g/kg, and the TN content on the upper and lower slopes ranged between 0.95 and 1.25 g/kg, indicating that the distribution of the TN content had certain spatial uncertainty. The TN content on the middle slope was between 0.95 and 1.25 g/kg and between 0.75 and 0.95 g/kg, and the TN content mainly ranged from 0.75 to 0.95 g/kg. From the top layer to the bottom layer, the TN content gradually decreased, and the TN content in the 20–40 cm and 40–60 cm soil layers was mainly less than 0.95 g/kg and tended to be stable. There are two main reasons that affect the distribution of TN in soil, one is the influence of artificial farming factors, and the other is the influence of underground coal mining.
4. Discussion
In this study, the soil total nitrogen content showed moderate spatial variability, and internal and external factors could not be ignored. The internal factors mainly include the influence of soil texture, topography, and soil physical and chemical properties; the external factors mainly include the influence of artificial fertilization management and coal mining subsidence. Muhtar Emat (2022) studied the spatial variation characteristics and influential factors of the total nitrogen content in the topsoil of cultivated land in northwestern Hubei. Studies have shown that total nitrogen has a positive correlation with organic matter, altitude and effective soil layer thickness and a negative correlation with soil pH [48]. Tao Chen et al. (2016) studied the spatial variation characteristics of soil nutrient on the southern Loess Plateau. The main factors affecting SOM and TN changes were topography, soil type and farm management practices. However, the influence of human activities is growing [49].
4.1. Effects of Soil Texture on Soil TN
This study found that soil texture had a certain influence on the spatial distribution of TN, which is consistent with previous studies. The soil texture of mining subsidence slopes is mainly clay and sand. Table 4 shows the distribution of the TN content of different soil textures. The TN content in clay soil was higher than that in sandy soil, and the average TN content in clay soil was 1.06 g/kg. Table 5 shows the analysis of variance test results of the TN content of the different soil textures. Through one-way analysis of variance, it was observed that the sum of the mean squares between the soil texture groups was greater than the sum of the mean squares within groups, and the mean square deviation between groups was greater than the mean square deviation within groups. The F value of soil TN in different soil textures was 15.63 (p = 0.000), indicating that in the study area, the differences in the soil TN content under different soil textures were significant. Therefore, in this paper, soil texture could affect TN content.
4.2. The Effect of Topography on Soil TN
Topography has a direct impact on soil moisture, as well as the migration and transformation of soil nutrients. This study area is a coal mining subsidence slope, and the terrain gradually decreases from the upper slope to the lower slope. Analysis of the soil TN content indicated certain differences in soil nutrient migration and accumulation in different terrains. Table 6 shows the soil TN content in combination with topography.
Table 7 shows the variance analysis results of the TN content in the relief groups. The average TN content in the high terrain area was 1.32 g/kg, and the average TN content in the low terrain area was 1.08 g/kg. Theoretically, areas with low terrain are conducive to the accumulation of TN in the soil, but in addition to the influence of terrain on the migration and accumulation of TN, the influence of comprehensive factors such as land use type, farmer’s farming management level, and fertilization should also be considered. In areas with a low TN content, farmers can improve the soil environment by increasing fertilization, and the influence of these external factors is far greater than the influence of terrain on the TN content of the soil. The F value was 1.808, and p = 0.210 was greater than 0.05, indicating that the difference in the topography had no obvious effect on the TN content of the soil. There are many comprehensive factors that affect the spatial distribution of the TN content, but the topography of the study area did not result in a statistically significant difference and had little effect on the TN content.
4.3. Other Factors of Soil TN
This study found that environmental factors affected more than three-quarters of the spatial variation in soil TN. However, approximately one-quarter of the spatial variability remains unexplained due to a lack of soil temperature, soil respiration, soil mineral composition, and soil microbial data. Relevant studies have found that under similar external conditions, soil particle size can affect soil nutrients [50]. Soil temperature is an important factor that affects microbial respiration, as well as the absorption and decomposition rate of soil TN. Underground coal mining can cause ground subsidence and surface cracks [51]. In this study, there were small cracks on the middle slope, and the cracks were a factor. The TN content of the upper slope was the highest, and the TN content of the middle slope was the lowest. This is because the middle slope is located above the goaf. Mining causes land subsidence and cracks, and cracks enhance soil respiration and change the soil temperature and moisture. In addition, the mid-slope area has a steep slope and serious soil erosion, and some nutrients collect downslope, resulting in an increase in the TN content of the soil downslope [3]. Underground coal mining causes the surface water level to rise, which will result in water accumulation in the subsidence area [13,52]. In this study area, there was a large amount of stagnant water in the subsidence area at the edge of the downslope. The stagnant water leads to an increase in soil viscosity and a decrease in soil respiration, which affects the TN content.
In addition, external fertilization management has a certain influence on the soil nutrient content. Different tillage and fertilization measures have different effects on soil erosion and nutrient loss [53]. The interviews with the residents in the mining area found that the management level of each household on the farmland is very different. Due to the impact of coal mining, the quality of cultivated land has declined, and some farmers are unwilling to invest more time and energy in managing their farmland. They prefer to engage in higher-paying jobs, such as going out to work. As a result, part of the farmland will be abandoned. There are also great differences in fertilization among farmers, mainly including chemical fertilizers, organic fertilizers, biological fertilizers, and green manures. Each fertilizer works differently and can also affect soil nutrients. In addition, the amount of fertilizer and the time of fertilization are also the main influencing factors. There are also great differences in fertilization among farmers, mainly including chemical fertilizers, organic fertilizers, biological fertilizers, and green manures. Each fertilizer works differently and can also affect soil nutrients. In addition, the amount of fertilizer and the time of fertilization are also the main influencing factors. The main crops grown in the study area include wheat, corn, peanut, soybean, and sweet potato. The nitrogen fixation capacity of each crop is different. Sunshine time, slope aspect, solar radiation and other factors will also affect the total nitrogen content, and the coal mining subsidence time also has a certain influence on the soil total nitrogen content. Soil total nitrogen is an important indicator for measuring the soil fertility level and plays a very important role in farmland ecosystems [54,55]. Farmers managed the hillsides carefully, applied a large amount of nitrogen fertilizer, and conducted ridge planting, which reduced the loss of organic matter, total nitrogen, total phosphorus and other nutrients to conserve fertilizer. Due to the existence of small cracks on the middle slope, the fertilizer retention capacity was reduced.
5. Conclusions
This paper takes the Zhaogu mining area, Huixian city, Henan Province, as the research object and studies the spatial distribution characteristics of soil TN at different soil depths (0–20 cm, 20–40 cm, 40–60 cm). The three-dimensional continuous Markov chain model of the TN content realizes the three-dimensional spatial simulation of the TN content. Combined with natural factors and human factors, soil total nitrogen content is analyzed, including sunshine time, soil texture, coal mining subsidence, cracks, water content, etc. The results show that (1) the soil TN content in the coal mining subsidence area has obvious spatial distribution differences at different soil layer depths, and soil TN has the largest spatial variation at soil depths 0–20 cm; with increasing soil depth, the spatial variation gradually decreases, and the spatial variation in TN in the 40–60 cm soil layer tends to stabilize. (2) The vertical and horizontal (X-Y) transfer probability models can directly reflect the spatial distribution characteristics of soil TN and describe the spatial distribution variability of soil TN. In this paper, the TN content less than 0.95 g/kg accounted for the largest proportion, approximately 70%, mainly distributed beneath the 0–20 cm soil layer. (3) Soil texture had a certain effect on the soil TN content. Coal mining subsidence cracks accelerated soil erosion, reduced the soil fertility retention capacity, and had a strong impact on the soil TN content. External management also had a certain effect on soil TN. The amount of fertilizer, crop planting and management methods, as well as irrigation methods have a certain effect on the TN content of soil. This study suggested that coal mining, soil texture, and artificial management methods are all crucial to soil TN storage and should be considered. At the same time, the spatial distribution of soil TN was affected by sunshine duration, crop and fertilization. In addition, results such as these can provide a reference for ecological restoration and sustainable development research in ecologically degraded areas.
Author Contributions
H.Z. analysed the data, created the tables and figures, and drafted the paper; W.L. provided important suggestions for the methodology and designed and drafted the paper; Q.Z. reviewed the literature of the subject and modified the manuscript format; X.H. contributed valuable opinions during the manuscript writing. All authors have read and agreed to the published version of the manuscript.
Funding
This work was funded by the Joint Funds of the National Natural Science Foundation of China (U21A20109) and Doctoral Fund of North China University of Water Resources and Electric Power (4001/40933).
Institutional Review Board Statement
Not applicable.
Informed Consent Statement
Not applicable.
Data Availability Statement
Not applicable.
Conflicts of Interest
The authors declare no conflict of interest.
References
- Jing, Z.R.; Wang, J.M.; Zhu, Y.C.; Feng, Y. Effects of land subsidence resulted from coal mining on soil nutrient. J. Clean. Prod. 2017, 177, 350–361. [Google Scholar] [CrossRef]
- Guo, J.; Zhang, Y.; Huang, H.; Yang, F. Deciphering soil bacterial community structure in subsidence area caused by underground coal mining in arid and semiarid area. Appl. Soil Ecol. 2021, 163, 103916. [Google Scholar] [CrossRef]
- Zhang, H.; Liu, W.; Zhang, H.; Fan, L.; Ma, S. Spatial distribution of soil organic matter in a coal mining subsidence area. Acta Agric. Scand. Sect. B Soil Plant Sci. 2020, 70, 117–127. [Google Scholar] [CrossRef]
- Bi, Y.; Xie, L.; Wang, J.; Zhang, Y.; Wang, K. Impact of host plants, slope position and subsidence on arbuscular mycorrhizal fungal communities in the coal mining area of north-central China. J. Arid Environ. 2019, 163, 68–76. [Google Scholar] [CrossRef]
- Arefieva, O.D.; Nazarkina, A.V.; Gruschakova, N.V.; Skurikhina, Y.E.; Kolycheva, V.B. International soil and water conservation research. Int. Soil Water Conserv. Res. 2019, 7, 57–63. [Google Scholar] [CrossRef]
- Tong, Y.; Niu, H.; Fan, L. Willingness of farmers to transform vacant rural residential land into cultivated land in a major grain-producing area of central China. Sustainability 2016, 8, 1192. [Google Scholar] [CrossRef] [Green Version]
- Zhang, H.J.; Ma, S.C.; Liu, W.K.; Zhang, H.B.; Yuan, S.H. Three-dimensional spatial simulation and distribution characteristics of soil organic matter in coal mining subsidence area. Mater. Sci. Forum 2020, 980, 437–448. [Google Scholar] [CrossRef]
- Yang, D.J.; Zhang, Y.; Chen, X. Effect of coal mining on soil nitrogen distribution in semi-arid mining area of western China. J. Environ. Eng. Landsc. 2019, 3, 163–173. [Google Scholar] [CrossRef]
- Jarasiunas, G.; Kinderiene, I. Impact of agro-environmental systems on soil erosion processes and soil properties on hilly landscape in Western Lithuania. J. Environ. Eng. Landsc. 2016, 24, 60–69. [Google Scholar] [CrossRef]
- Xu, Q.; Shao, W.; Li, Y.; Zhang, X.; Ouyang, X.; Liu, J.; Liu, B.; Wu, Z.; Ouyang, X.; Tang, X.; et al. High-performance surface barrier x-ray detector based on methylammonium lead tribromide single crystals. ACS Appl. Mater. Interfaces 2019, 11, 9679–9684. [Google Scholar] [CrossRef]
- Chen, C.; Lu, H. Evaluation of mine geological environment of guqiao coal mine. J. Geosci. Environ. Prot. 2021, 9, 110–117. [Google Scholar]
- Hou, H.; Ding, Z.; Zhang, S.; Guo, S. Spatial estimate of ecological and environmental damage in an underground coal mining area on the Loess Plateau: Implications for planning restoration interventions. J. Clean. Prod. 2021, 287, 125061. [Google Scholar] [CrossRef]
- Ignacy, D. Comprehensive method of assessing the flood threat of artificially drained mine subsidence areas for identification and sustainable repair of mining damage to the aquatic environment. Water Resour. Ind. 2021, 26, 100153. [Google Scholar] [CrossRef]
- He, T.; Xiao, W.; Zhao, Y.; Chen, W.; Deng, X.; Zhang, J. Continues monitoring of subsidence water in mining area from the eastern plain in China from 1986 to 2018 using Landsat imagery and Google Earth Engine. J. Clean. Prod. 2021, 10, 123610. [Google Scholar] [CrossRef]
- Mason, T.J.; Krogh, M.; Popovic, G.C.; Glamore, W.; Keith, D.A. Persistent effects of underground longwall coal mining on freshwater wetland hydrology. Sci. Total Environ. 2021, 772, 144772. [Google Scholar] [CrossRef] [PubMed]
- Xiao, L.; Bi, Y.; Du, S.; Wang, Y.; Guo, C. Effects of re-vegetation type and arbuscular mycorrhizal fungal inoculation on soil enzyme activities and microbial biomass in coal mining subsidence areas of Northern China. Catena 2019, 177, 202–209. [Google Scholar] [CrossRef]
- Ahirwal, J.; Pandey, V.C. Restoration of mine degraded land for sustainable environmental development. Restor. Ecol. 2021, 29, 13268. [Google Scholar] [CrossRef]
- Sun, J.; Guo, E.; Yang, X.; Kong, Y.; Yang, L. Seasonal and spatial variations in soil biochemical properties in areas with different degrees of mining subsidence in central China. SSRN 2022, 508, 21. [Google Scholar] [CrossRef]
- Ma, K.; Zhang, Y.; Ruan, M.; Guo, J.; Chai, T. Land subsidence in a coal mining area reduced soil fertility and led to soil degradation in arid and semi-arid regions. Int. J. Environ. Res. Public Health 2019, 16, 3929. [Google Scholar] [CrossRef] [Green Version]
- Long, L.; Liu, Y.; Chen, X.; Guo, J.; Li, X.; Guo, Y.; Zhang, X.; Lei, S. Analysis of spatial variability and influencing factors of soil nutrients in western China: A Case Study of the Daliuta Mining Area. Sustainability 2022, 14, 2793. [Google Scholar] [CrossRef]
- Wang, Z.; Wang, G.; Zhang, G.; Wang, H.; Ren, T. Effects of land use types and environmental factors on spatial distribution of soil total nitrogen in a coalfield on the Loess Plateau, China. Soil Tillage Res. 2021, 211, 105027. [Google Scholar] [CrossRef]
- Hinz, R.; Sulser, T.B.; Huefner, R.; Mason-D’Croz, S.; Dunston, S.; Nautiyal, S.; Ringler, C.; Schuengel, J.; Tikhile, P.; Wimmer, F.; et al. Agricultural development and land use change in India: A scenario analysis of trade-offs between UN sustainable development goals (SDGs). Earth’s Future 2020, 8, e2019EF001287. [Google Scholar] [CrossRef] [Green Version]
- Deng, X.; Ma, W.; Ren, Z.; Zhang, M.; Grieneisen, M.L.; Chen, X.; Fei, X.; Qin, F.; Zhan, Y. Spatial and temporal trends of soil total nitrogen and C/N ratio for croplands of East China. Geoderma 2020, 361, 114035. [Google Scholar] [CrossRef]
- Yu, Q.; Hu, X.; Ma, J.; Ye, J.; Sun, W.; Wang, Q.; Lin, H. Effects of long-term organic material applications on soil carbon and nitrogen fractions in paddy fields. Soil Tillage Res. 2020, 196, 104483. [Google Scholar] [CrossRef]
- Dang, P.; Li, C.; Huang, T.; Lu, C.; Li, Y.; Qin, X. Effects of different continuous fertilizer managements on soil total nitrogen stocks in China: A meta-analysis. Pedosphere 2022, 32, 39–48. [Google Scholar] [CrossRef]
- Hagos, M.B.; Xu, M.; Liang, Z.Y.; Shi, J.L.; Wei, G.H. Efffects of Long-term Straw Return on Soil Organic Carbon Storage and Sequestration Rate in North China Upland Crops: A Meta-Analysis. Glob. Change Biol. 2020, 4, 2686–2710. [Google Scholar]
- Huang, Y.; Cao, Y.; Pietrzykowski, M.; Zhou, W.; Bai, Z. Spatial distribution characteristics of reconstructed soil bulk density of opencast coal-mine in the loess area of China. Catena 2021, 199, 105116. [Google Scholar] [CrossRef]
- Kwang, J.S.; Thaler, E.A.; Quirk, B.J.; Quarrier, C.L.; Larsen, I.J. A landscape evolution modeling approach for predicting three-dimensional soil organic carbon redistribution in agricultural landscapes. JGR Biogeosciences 2022, 2, G6616. [Google Scholar] [CrossRef]
- Xiao, W.; Zheng, W.; Zhao, Y.; Chen, J.; Hu, Z. Examining the relationship between coal mining subsidence and crop failure in plains with a high underground water table. J. Soils Sediments 2021, 21, 2908–2921. [Google Scholar] [CrossRef]
- Wei, H.; Li, S.; Li, C.; Zhao, F.; Xiong, L.; Tang, G. Quantification of loess landforms from three-dimensional landscape pattern perspective by using DEMs. ISPRS Int. J. Geo-Inf. 2021, 10, 693. [Google Scholar] [CrossRef]
- Ma, Y.; Minasny, B.; McBratney, A.; Poggio, L.; Fajardo, M. Predicting soil properties in 3D: Should depth be a covariate? Geoderma 2021, 383, 114794. [Google Scholar] [CrossRef]
- Deng, Z.; Jiang, S.; Niu, J.; Pan, M.; Liu, L. Stratigraphic uncertainty characterization using generalized coupled Markov chain. Bull. Eng. Geol. Environ. 2020, 79, 5061–5078. [Google Scholar] [CrossRef]
- Zhang, J.; Huang, H.; Zhang, D.; Phoon, K.K.; Liu, Z.; Tang, C. Quantitative evaluation of geological uncertainty and its influence on tunnel structural performance using improved coupled Markov chain. Acta Geotech. 2021, 16, 3709–3724. [Google Scholar] [CrossRef]
- Kalyani, N.N.; Fordoei, A.R.; Panahi, F.; Musavi, H. Prediction of soil hydrological responses under land-use/cover changes using markov chains in Jiroft Watershed, Iran. Ecopersia 2022, 1, 47–59. [Google Scholar]
- Cheng, J.X.; Nie, X.J.; Liu, C.H. Spatial variation of soil organic carbon in coal-mining subsidence areas. J. China Coal Soc. 2014, 12, 2495–2500. [Google Scholar]
- Chen, C.; Hu, K.L.; He, Y. 3D stochastic simulation and uncertainty assessment of soil texture at field scale. Soils 2013, 2, 319–325. [Google Scholar]
- Zhang, F.W.; Li, H.Q.; Yi, L.B.; Luo, F.L. Spatial response of topsoil organic carbon, total nitorgen, and total phosphor content of alpine meadows to grassland degradation in the Sanjiangyuan National Park. Acta Ecol. Sin. 2022, 14, 1–8. [Google Scholar]
- Tian, Y.T.; Han, Z.W.; Zhao, R.; Tian, Y.Z. Effects of typical land use types on soil nitrogen characteristics in karst Agricultural areas of Southwest China. Chin. Agric. Sci. Bull. 2022, 38, 1–7. [Google Scholar]
- Dindaroglu, T.; Babur, E.; Battaglia, M.; Seleiman, M.; Uslu, O.S.; Roy, R. Impact of depression areas and land-Use change in the soil organic carbon and total nitrogen contents in a semi-arid karst ecosystem. Cerne 2021, 27, e-102980. [Google Scholar] [CrossRef]
- Zhang, Y.Q.; Aia, J.J.; Sun, Q.W.; Li, Z.; Hou, L. Soil organic carbon and total nitrogen stocks as affected by vegetation types and altitude across the mountainous regions in the Yunnan Province, southwestern China. Catena 2021, 196, 104872. [Google Scholar] [CrossRef]
- Li, J.; Zhang, L.; He, C.; Zhao, C. A comparison of markov chain random field and ordinary kriging methods for calculating soil texture in a mountainous watershed, Northwest China. Sustainability 2018, 10, 2819. [Google Scholar] [CrossRef] [Green Version]
- Badreddine, D.; Hamidi, M. Algerian northwestern seismic hazard evaluation based on the Markov model. Rud.-Geol.-Naft. Zb. 2019, 10, 114–125. [Google Scholar]
- Afsaneh, G.R.; Sajjad, N.; Behzad, T.; Hossein, M. Drill bit selection in a formation with different sedimentary facies using the Markov chain: A case study at one of the oil fields in the south of Iran. Rud.-Geol.-Naft. Zb. 2021, 2, 83–92. [Google Scholar]
- Ma, S.C.; Xie, F.F.; Ding, C.; Zhang, H.B. Spatio-temporal change of landscape ecological quality and influencing factors based on four-quadrant model in overlapped area of cropland and coal production. Trans. CSAE 2020, 4, 259–268. [Google Scholar]
- Lee, D.H.; Park, Y. Study on the correlation between soil chemical properties and bioactive compounds of acer tegmentosum maxim. Plant Resour. Soc. Korea 2021, 6, 566–574. [Google Scholar]
- Zakeri, F.; Mariethoz, G. A review of geostatistical simulation models applied to satellite remote sensing: Methods and applications. Remote Sens. Environ. 2021, 259, 112381. [Google Scholar] [CrossRef]
- Wang, W.P.; Liu, J.L.; Li, X.P. Transition Probability based 3D stochastic simulation and uncertainty assessment of soil texture at field scale. Soils 2014, 46, 1121–1128. [Google Scholar]
- Amat, M.; Zhou, Y.; Wu, Z. Total nitrogen in plough layer soil in northwest Hubei: Spatial variability and influencing factors. J. Agric. 2022, 1, 12–21. [Google Scholar]
- Chen, T.; Chang, Q.; Liu, J.; Clevers, J.G.P.W. Spatio-temporal variability of farmland soil organic matter and total nitrogen in the southern Loess Plateau, China: A case study in Heyang County. Environ. Earth Sci. 2016, 75, 28. [Google Scholar] [CrossRef]
- Yao, X.; Yan, D.; Li, J.; Liu, Y.; Sheng, Y.; Xie, S.; Luan, Z. Spatial distribution of soil organic carbon and total nitrogen in a ramsar wetland, dafeng milu national nature reserve. Water 2022, 14, 197. [Google Scholar] [CrossRef]
- Bi, Y.; Zhang, J.; Song, Z.; Wang, Z.; Qiu, L.; Hu, J.; Gong, Y. Arbuscular mycorrhizal fungi alleviate root damage stress induced by simulated coal mining subsidence ground fissures. Sci. Total Environ. 2019, 652, 398–405. [Google Scholar] [CrossRef] [PubMed]
- Liu, H.; Zhang, M.; Su, L.; Chen, X.; Liu, C.; Sun, A. A boundary model of terrain reconstruction in a coal-mining subsidence waterlogged area. Environ. Earth Sci. 2021, 80, 187. [Google Scholar] [CrossRef]
- Ma, S.C.; Zhang, H.B.; Ma, S.T. Effects of tillage on water use efficiency and grain yield of summer maize in sloping farmland in coal-mining subsidence areas. J. Ecol. Rural. Environ. 2014, 2, 201–205. [Google Scholar]
- Song, Y.-Q.; Yang, L.-A.; Li, B.; Hu, Y.-M.; Wang, A.-L.; Zhou, W.; Cui, X.-S.; Liu, Y.-L. Spatial Prediction of soil organic matter using a hybrid geostatistical model of an extreme learning machine and ordinary kriging. Sustainability 2017, 9, 754. [Google Scholar] [CrossRef] [Green Version]
- Yin, C.Y.; Bai, Z.J.; Luo, D.F.; Peng, J. Comparative study on estimation models of soil total nitrogen content based on hyperspectral data. China Soil Fertil. 2022, 1, 9–15. [Google Scholar]
Figure 1.
Location of the study area. (a) map of Huixian city, Henan Province; (b) map of land use in the study area; (c) map of the soil samples; (d) map of a single soil sample collection.
Figure 1.
Location of the study area. (a) map of Huixian city, Henan Province; (b) map of land use in the study area; (c) map of the soil samples; (d) map of a single soil sample collection.
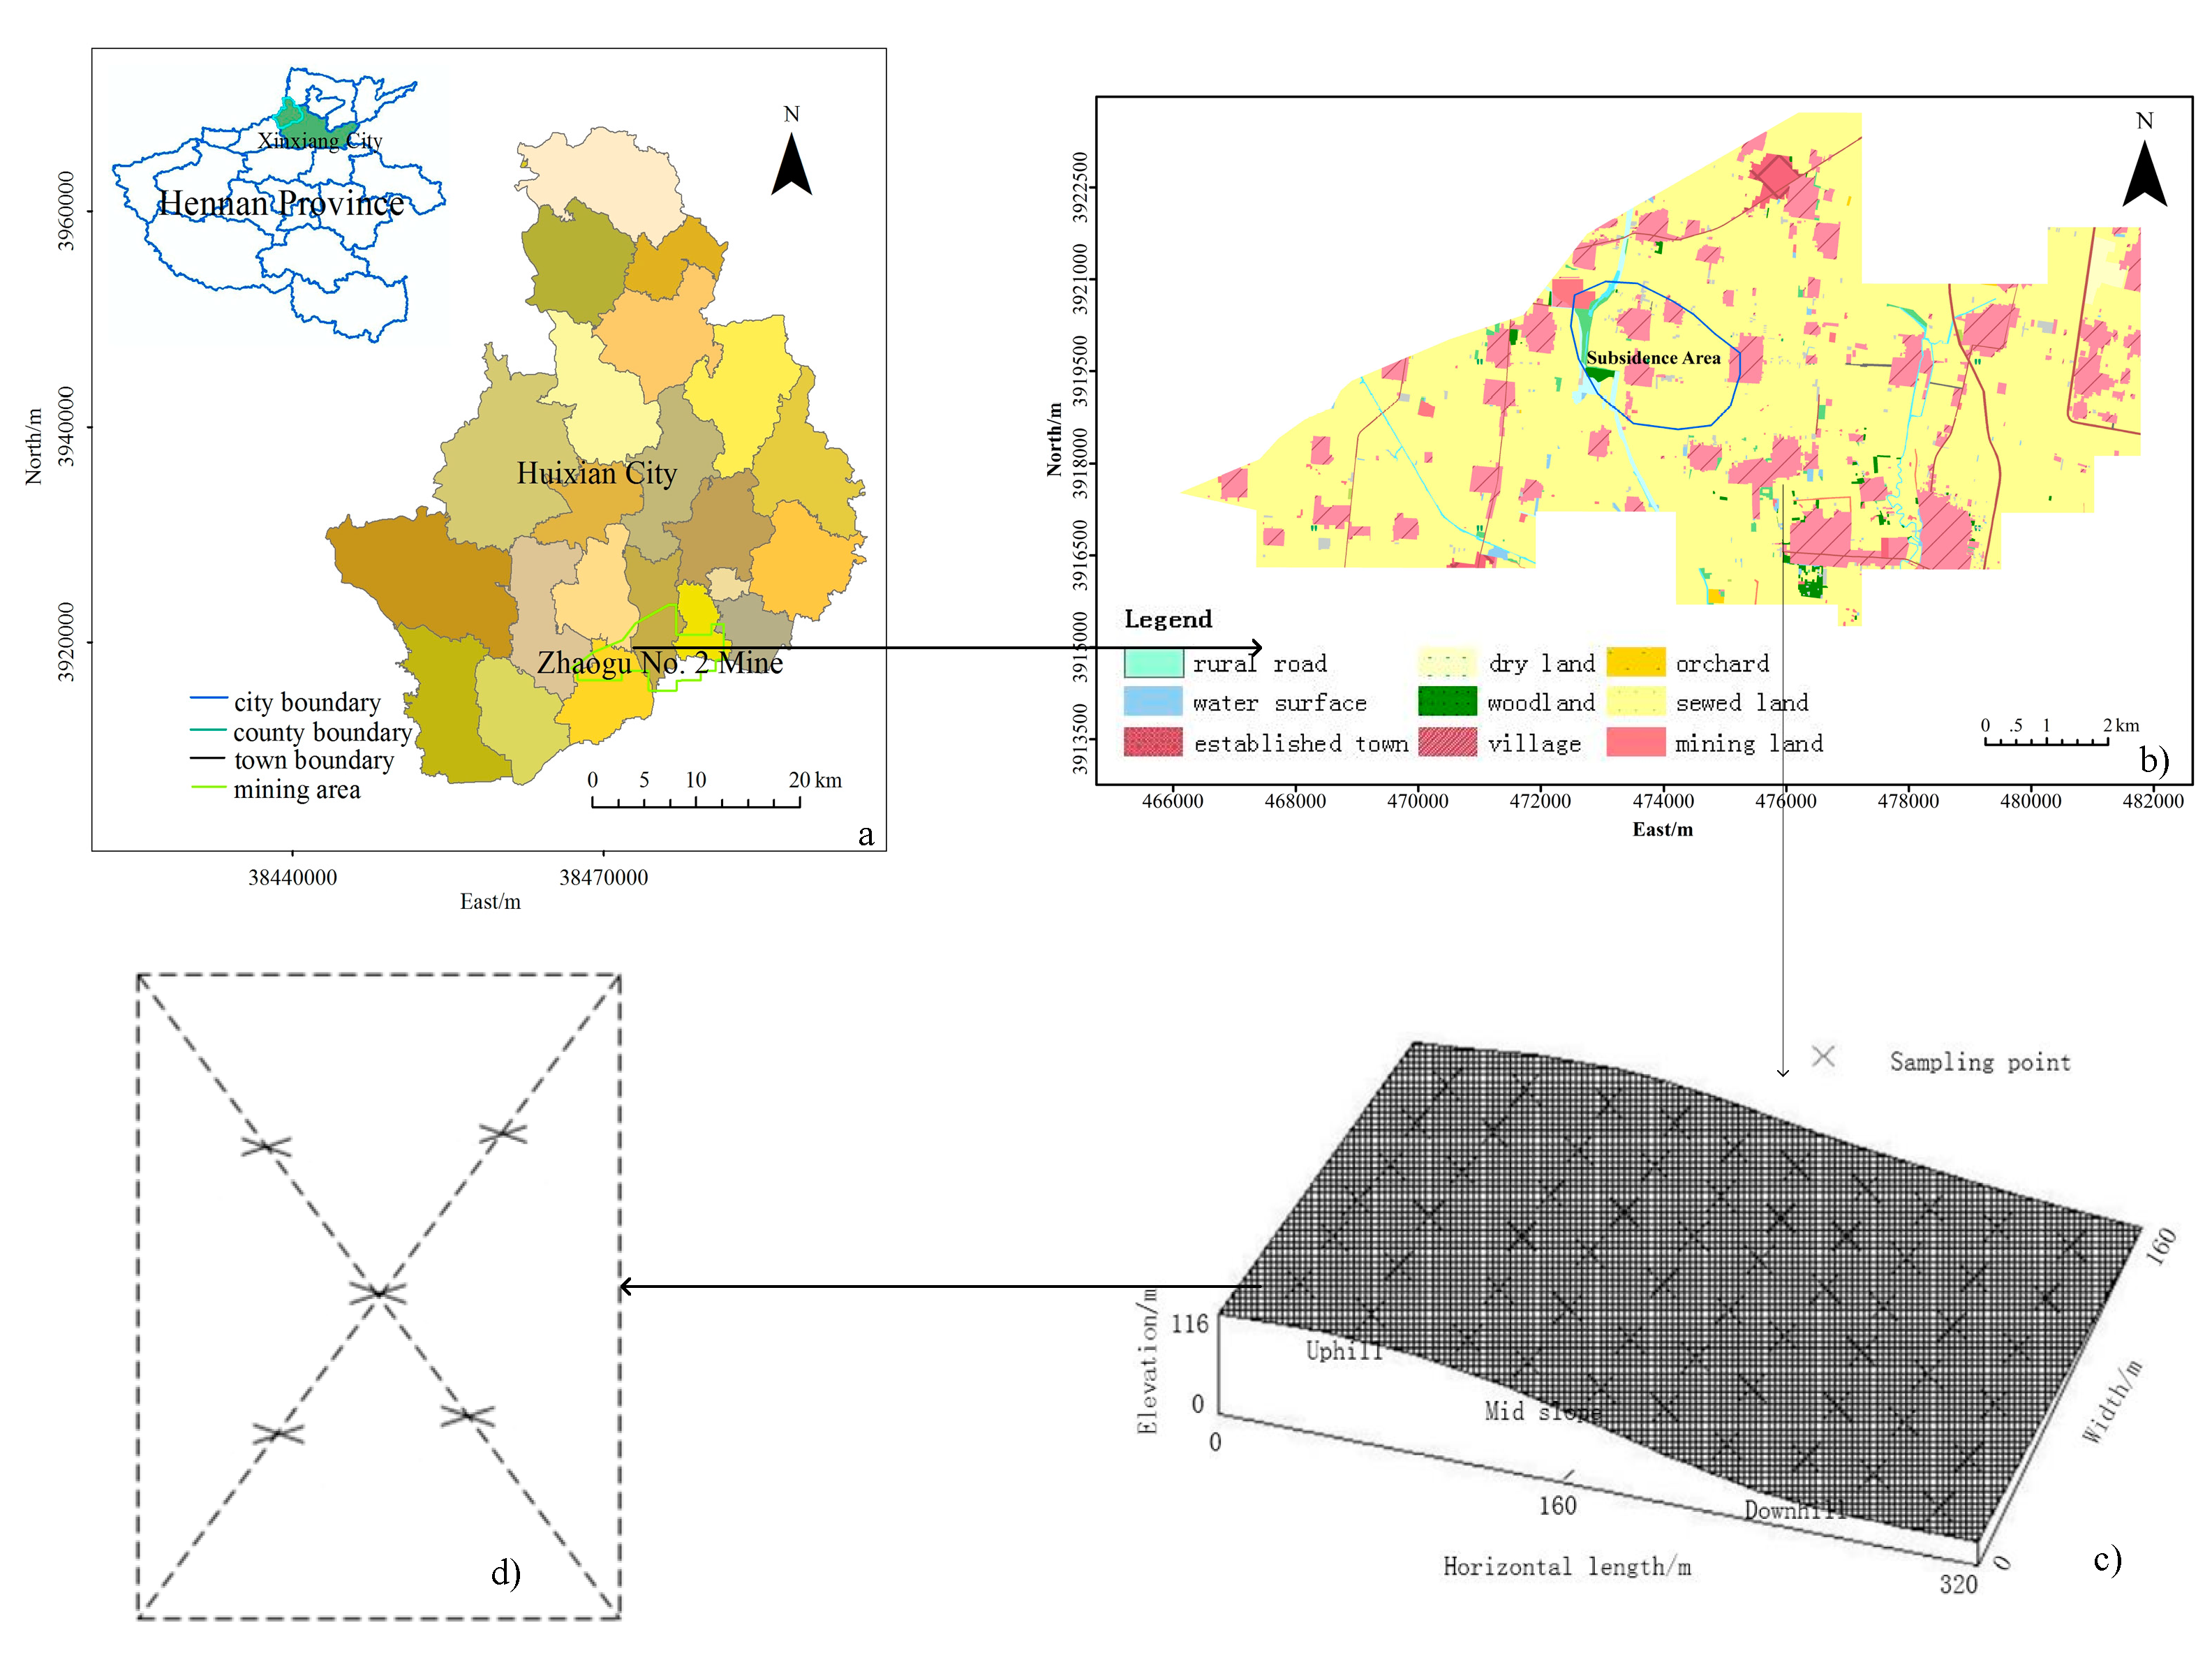
Figure 2.
Coal mining subsidence area and soil sampling.
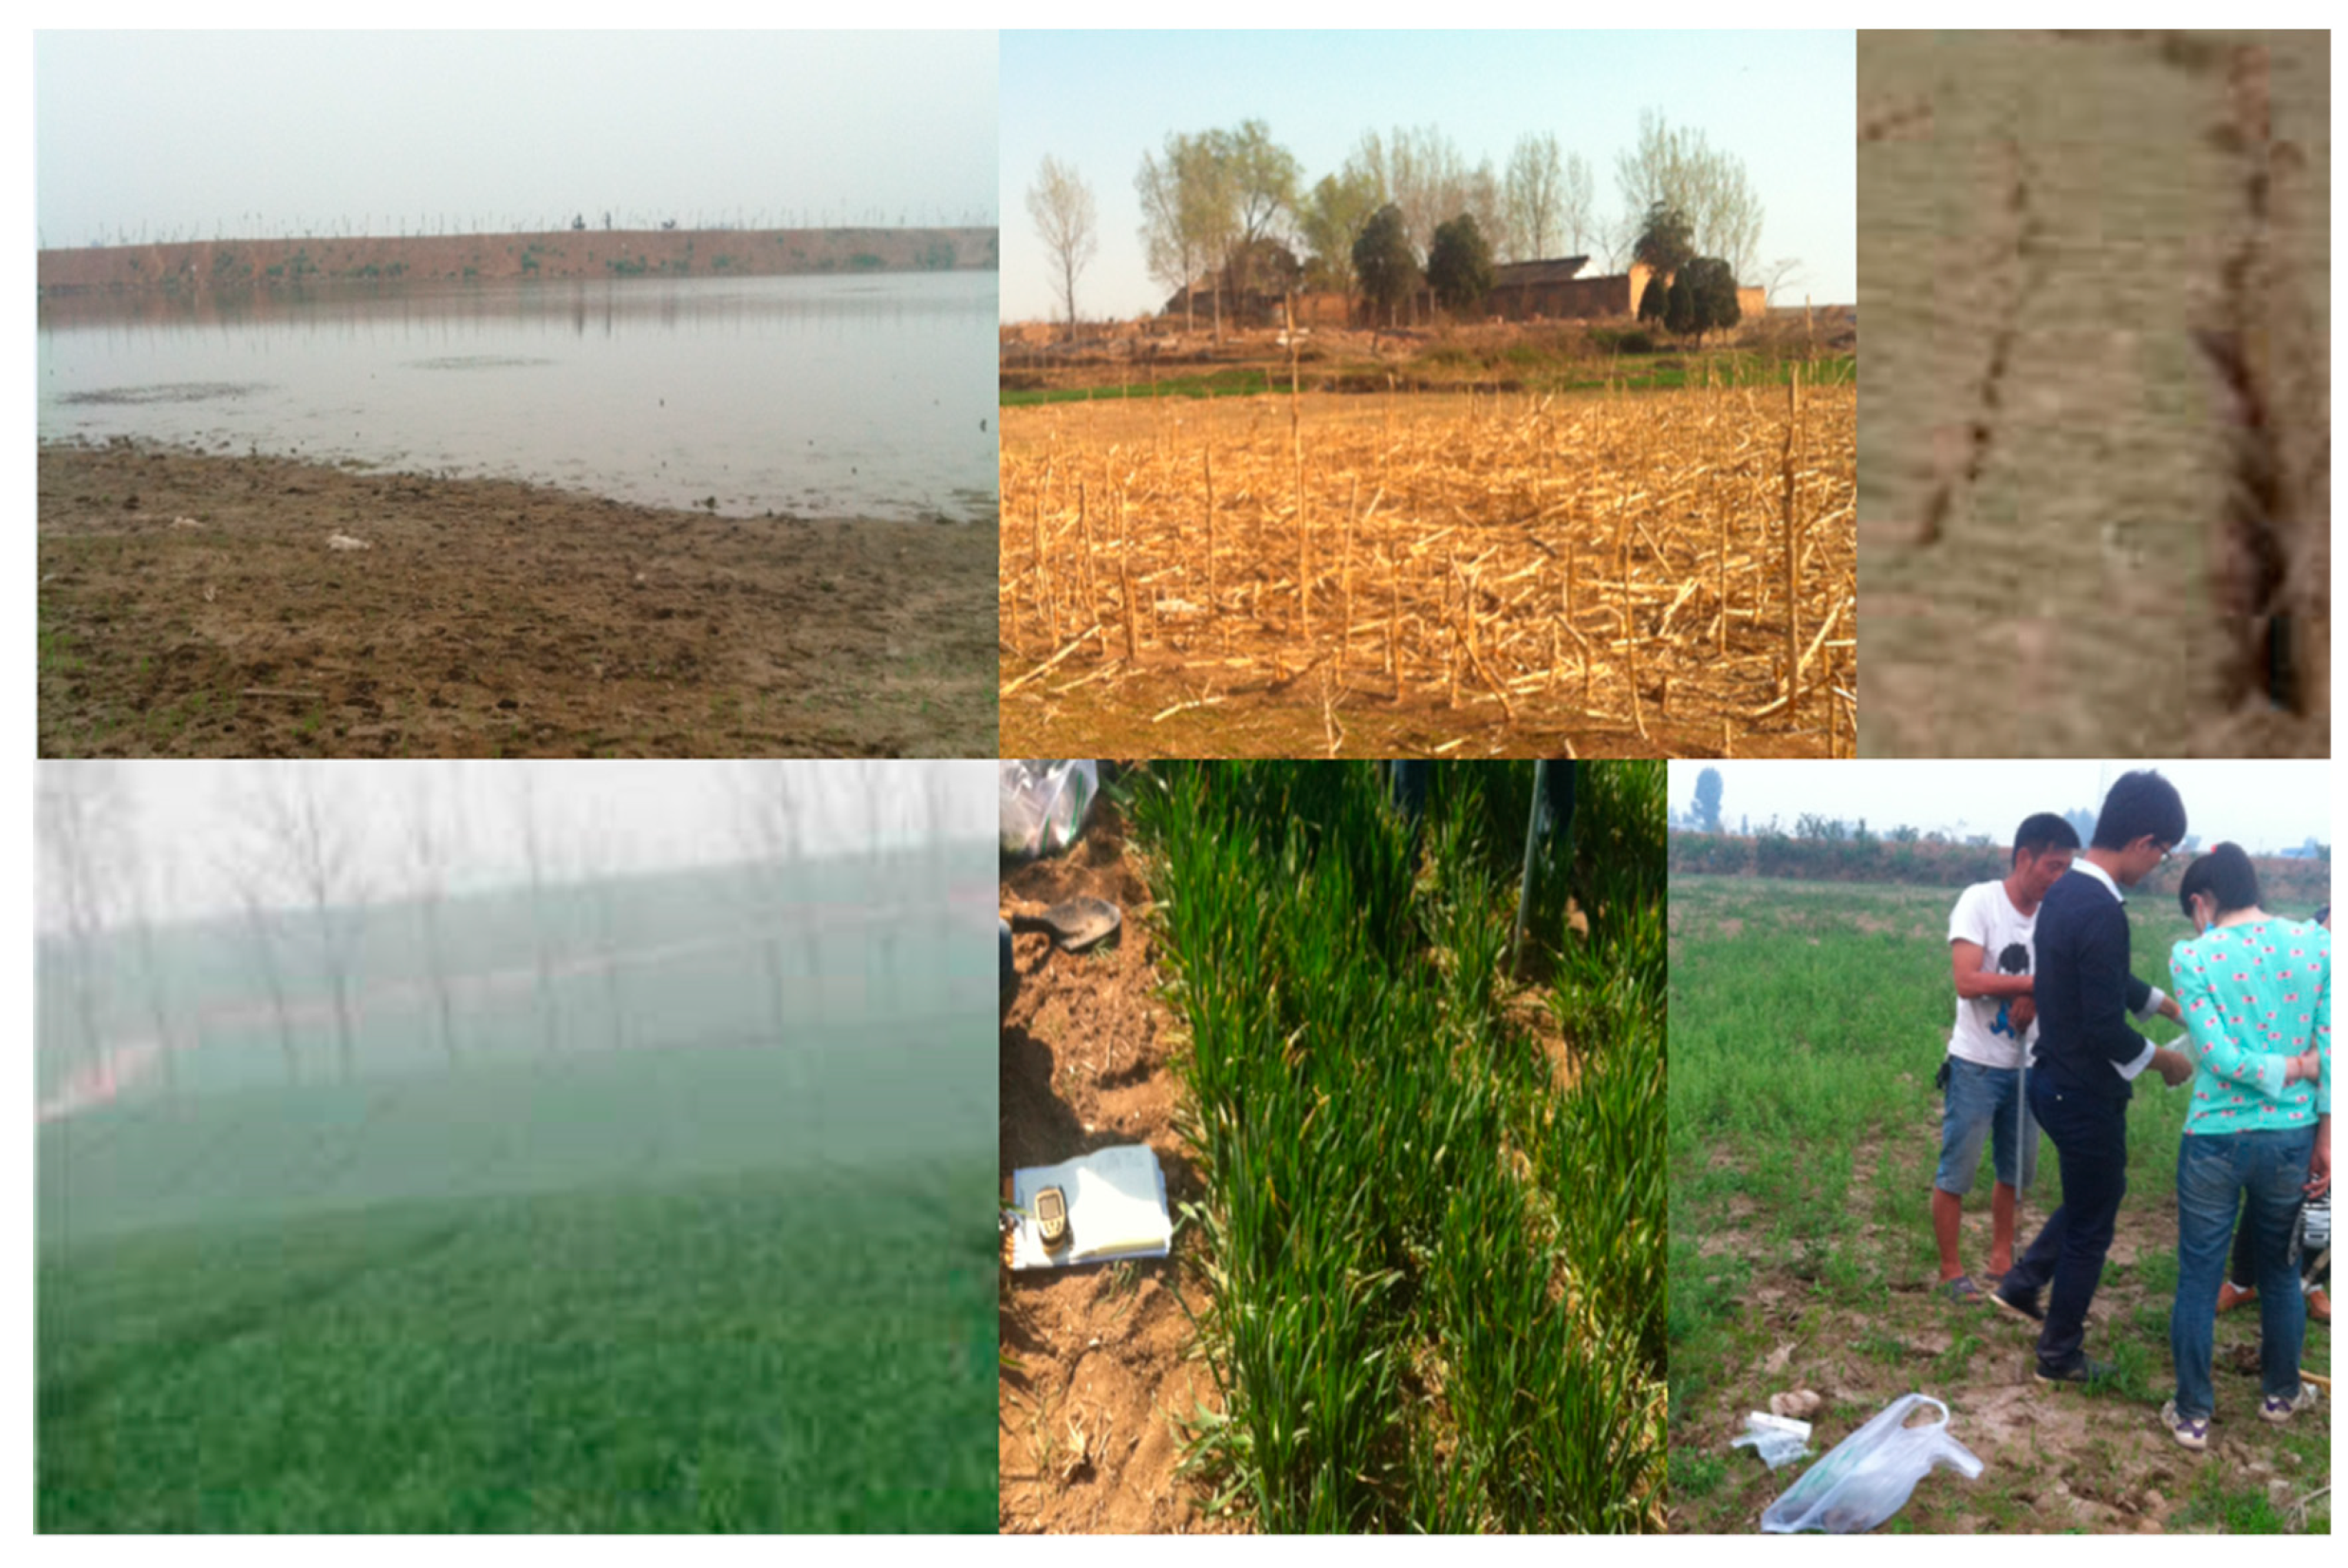
Figure 3.
Vertical transition probability and Markov chain model.

Figure 4.
Horizontal (X-Y) direction transition probability and Markov chain model.
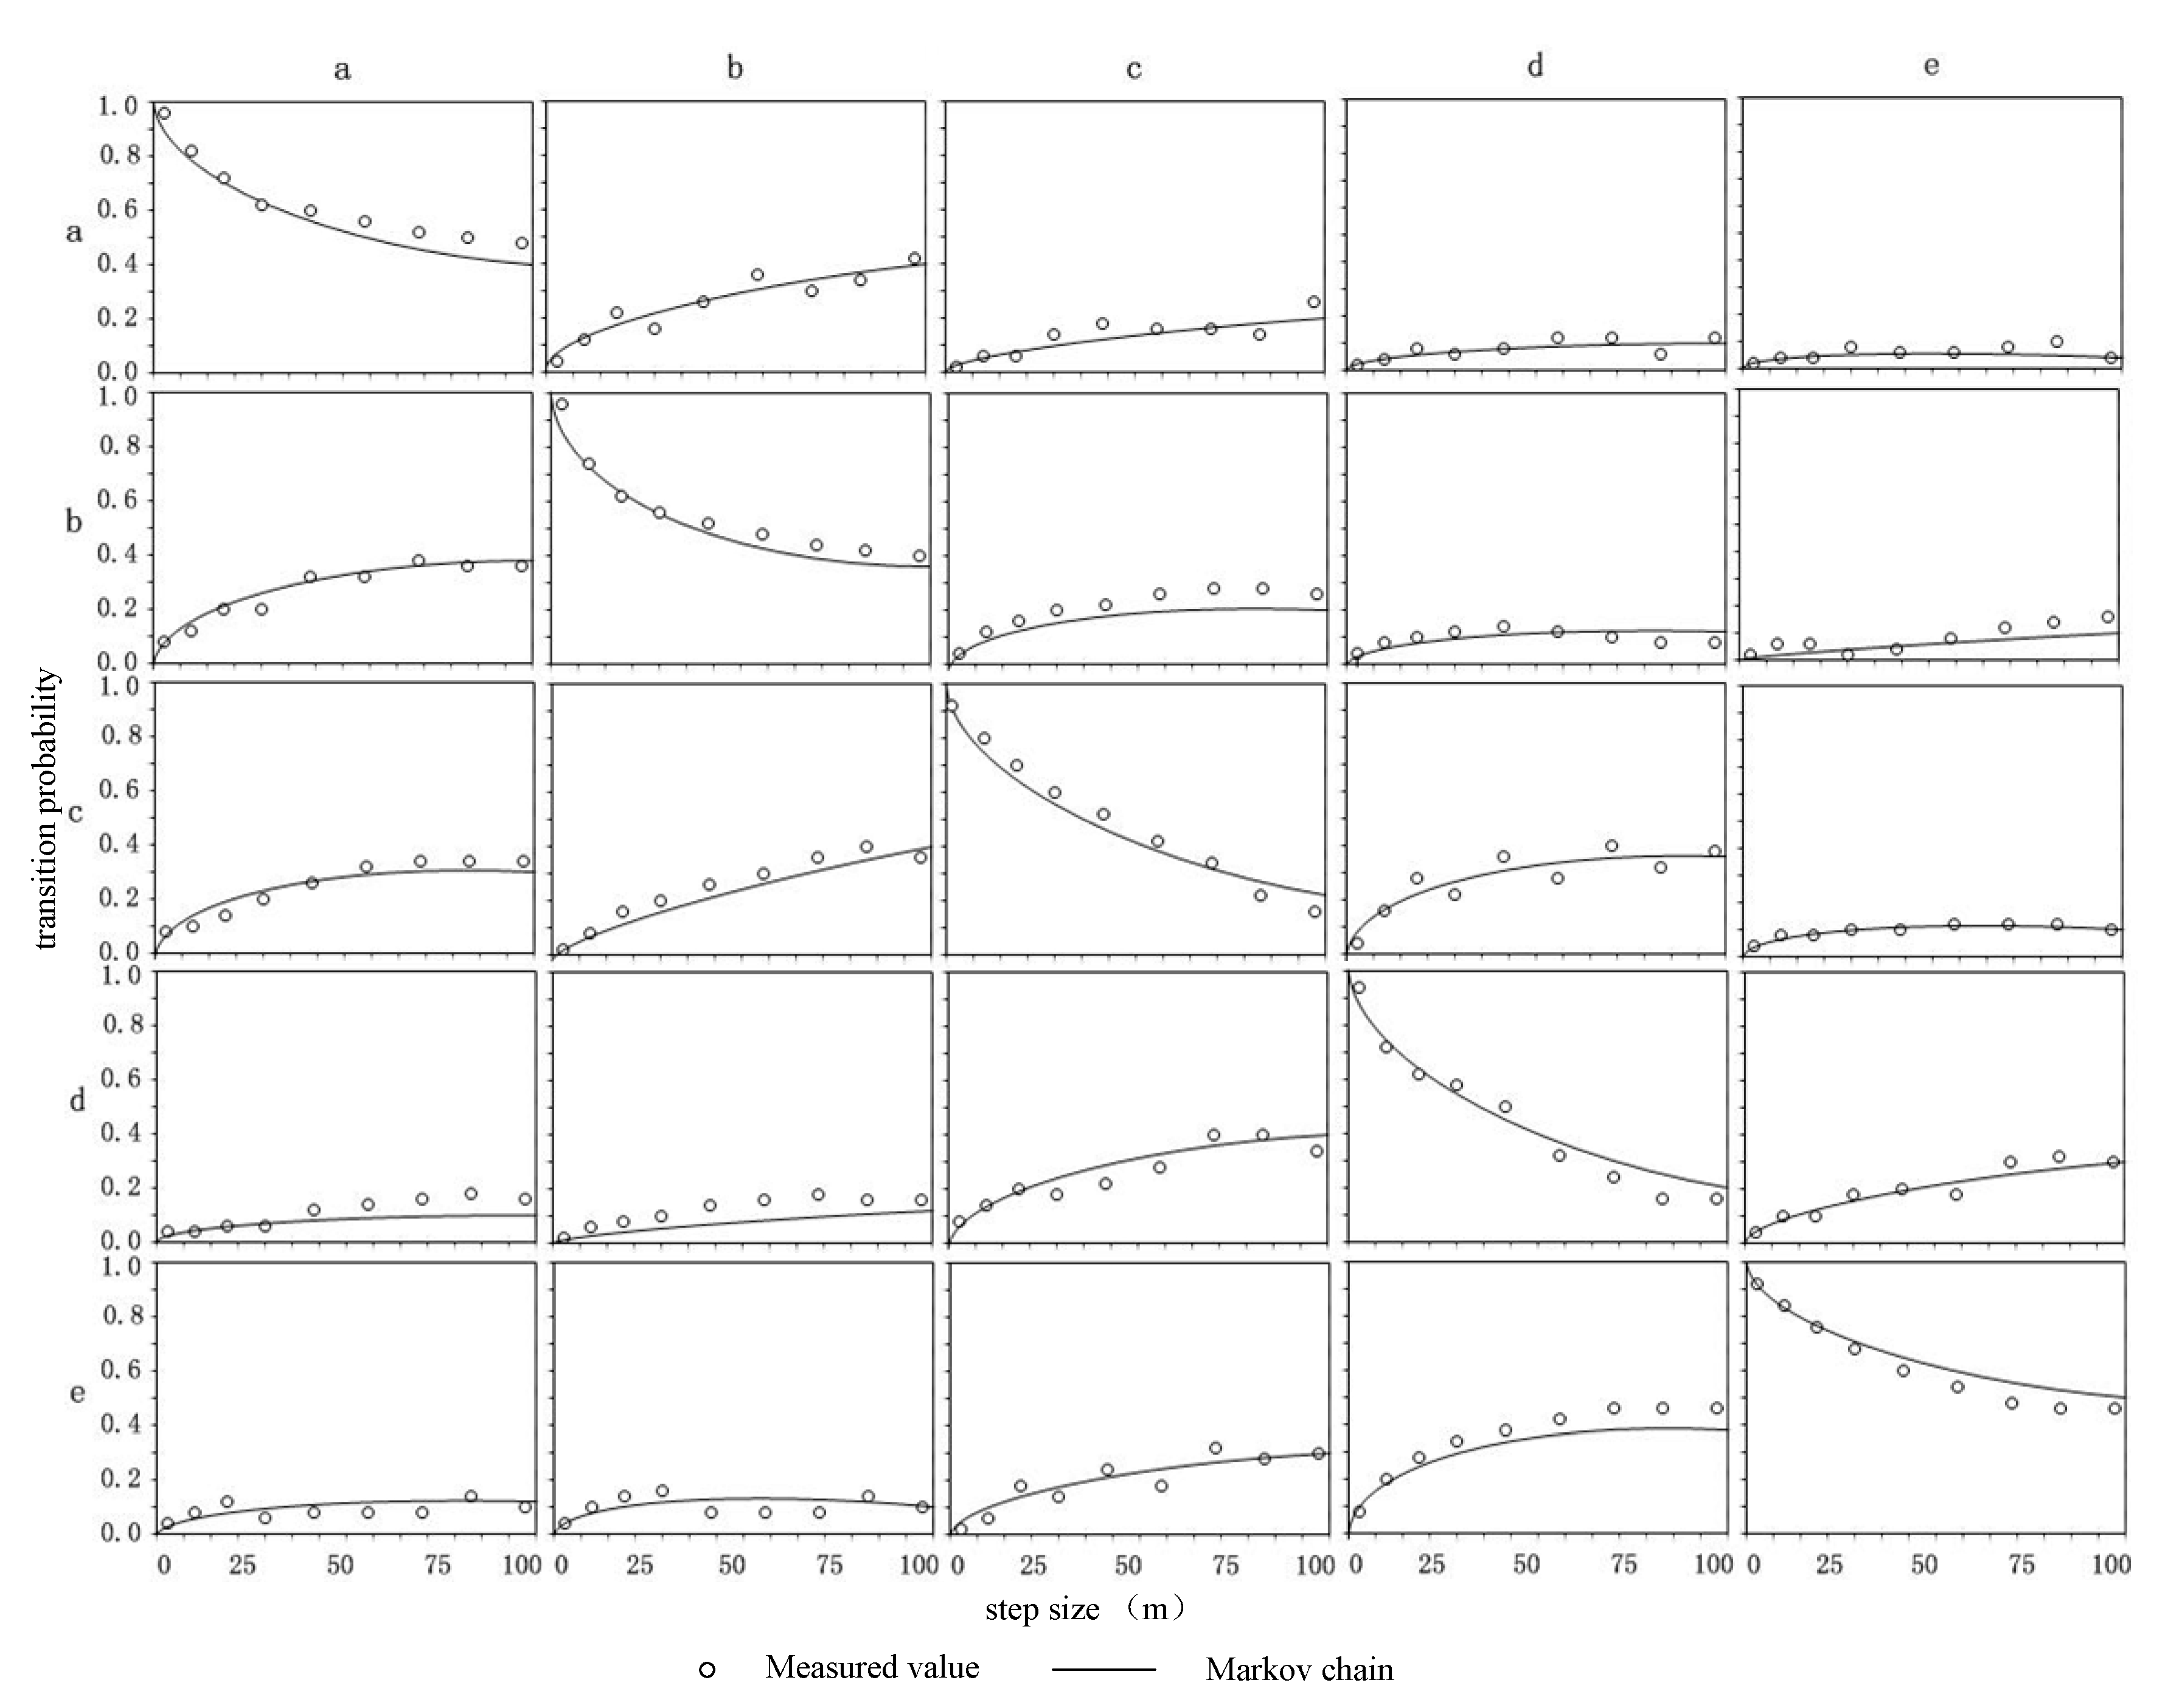
Figure 5.
Three-dimensional spatial distribution of the soil total nitrogen.
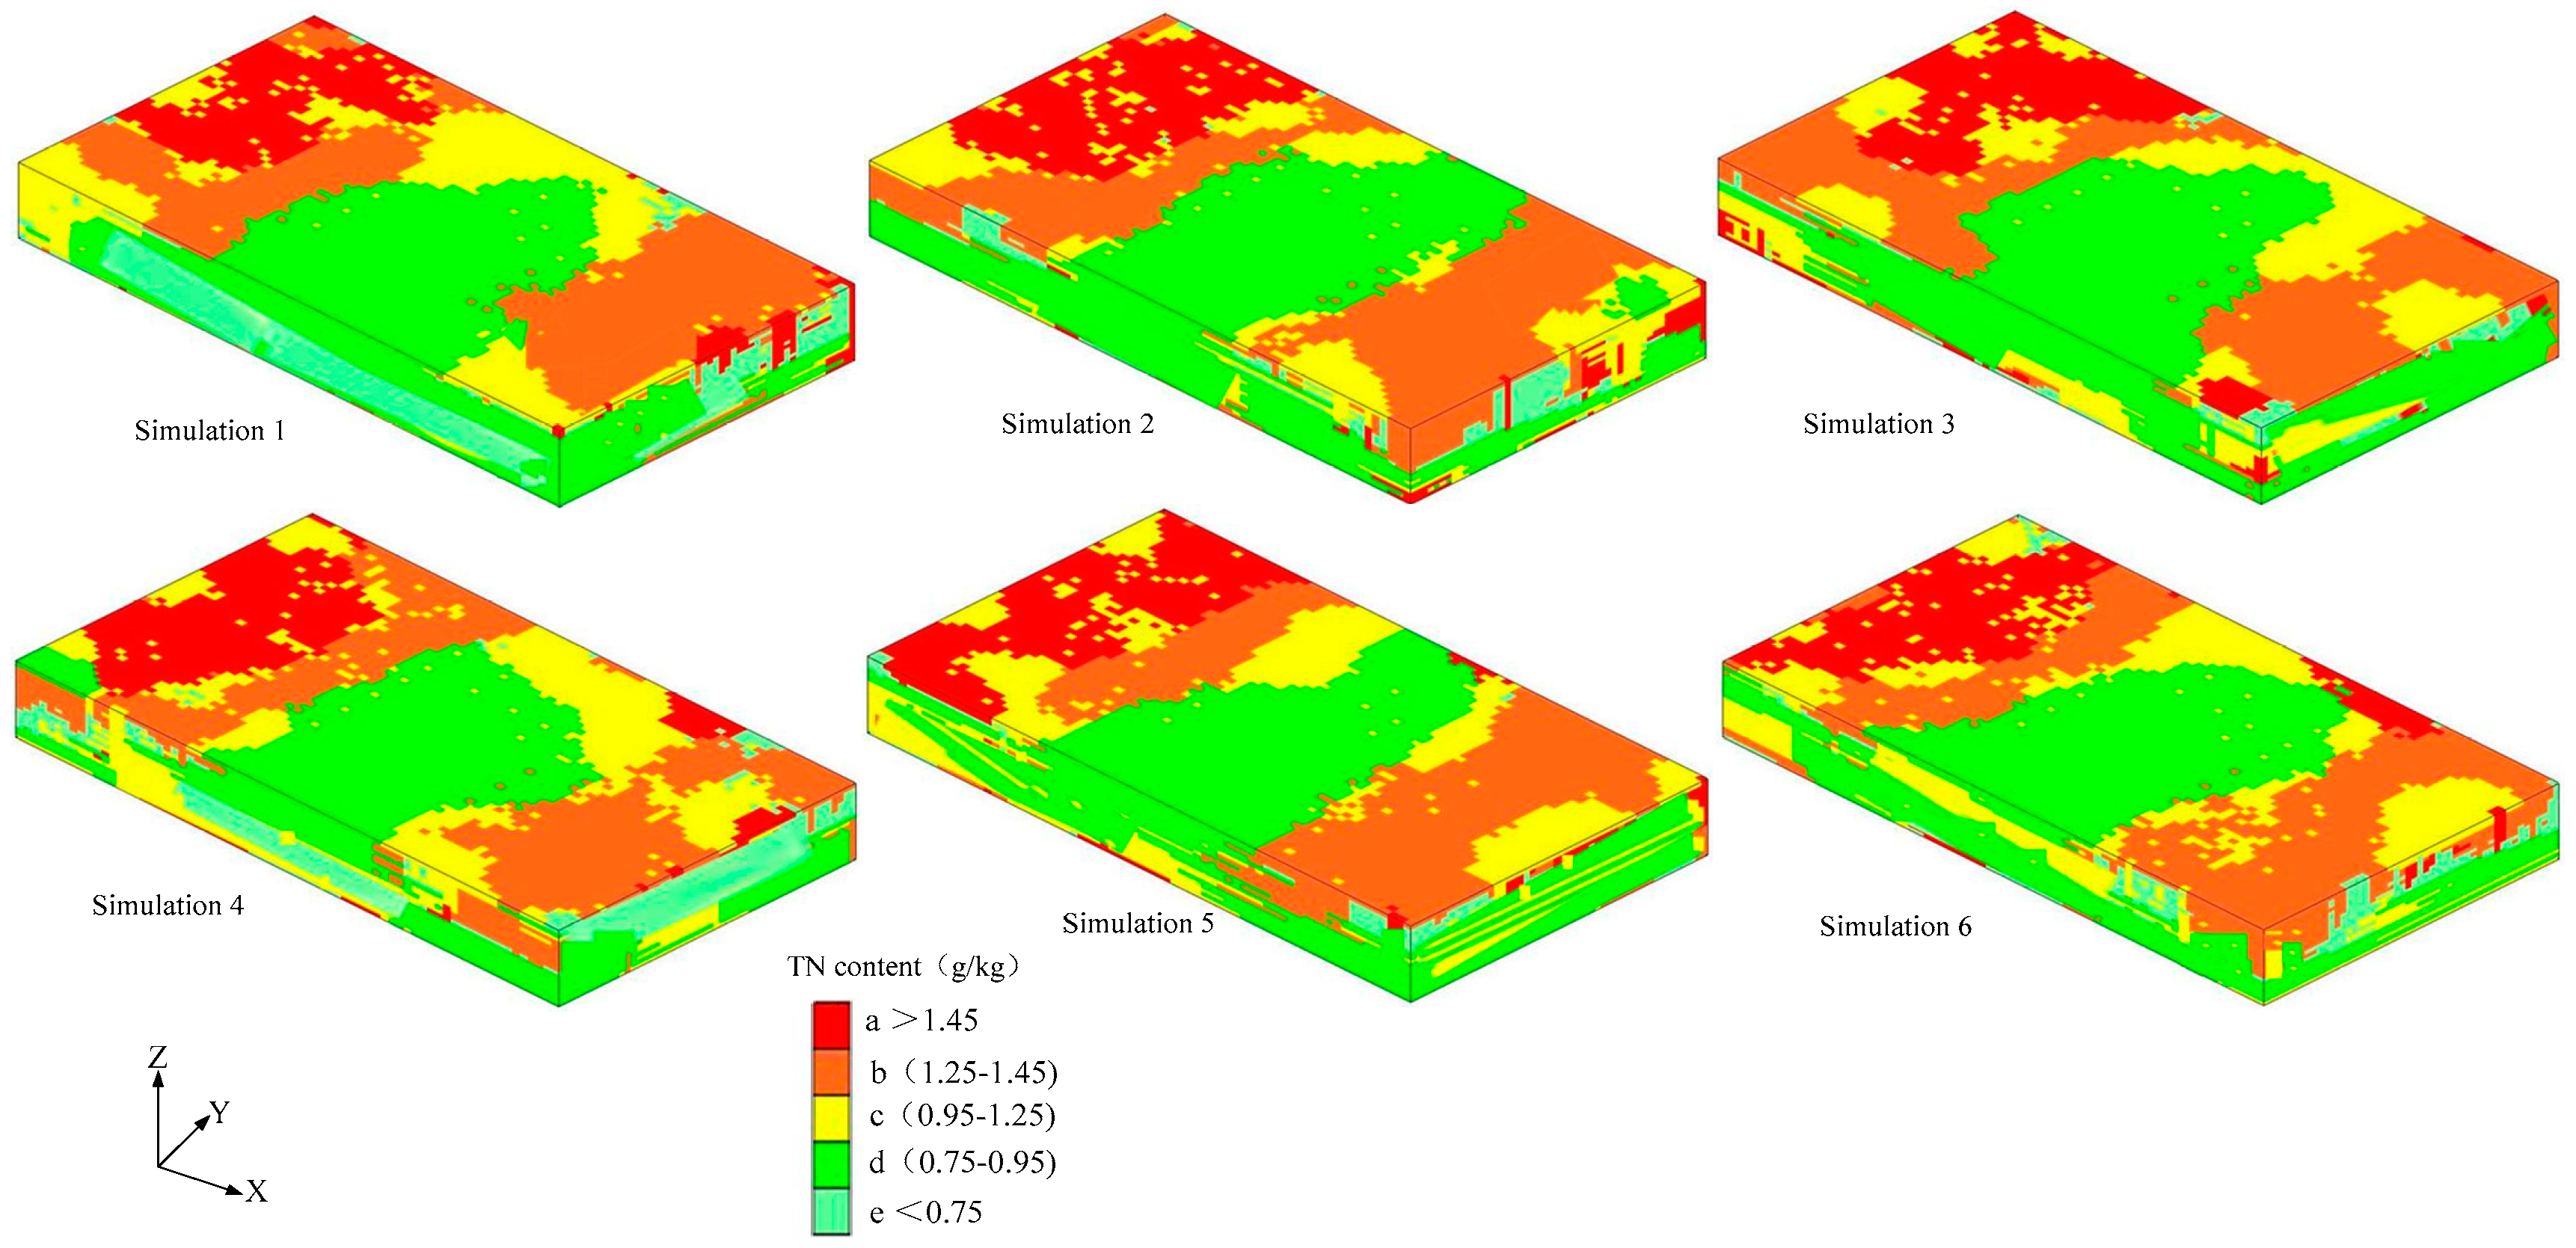
Figure 6.
Distribution of the soil total nitrogen content at different depths and slope positions.


Table 1.
Statistical characteristics of the soil total nitrogen content in different soil layers.
| Soil Properties | Soil Depth | Min | Max | Mean | SD | CV (%) | K-S (p) |
|---|---|---|---|---|---|---|---|
| 0–20 cm | 0.71 | 1.69 | 1.21 | 0.31 | 25.62 | 0.756 | |
| TN (g·kg−1) | 20–40 cm | 0.52 | 1.03 | 0.81 | 0.15 | 18.52 | 0.832 |
| 40–60 cm | 0.46 | 0.79 | 0.66 | 0.12 | 18.18 | 0.861 |
Table 2.
Correlation analysis of the total nitrogen content in different soil layers.
| Object | Soil Depth | Correlation Coefficient of Soil Total Nitrogen Content in Different Soil Layers | ||
|---|---|---|---|---|
| 0–20 cm | 20–40 cm | 40–60 cm | ||
| TN | 0–20 cm | 1 | ||
| 20–40 cm | 0.882 ** | 1 | ||
| 40–60 cm | 0.893 ** | 0.926 ** | 1 | |
Note: ** Significantly correlated at the 0.01 level.
Table 3.
Distribution ratio of the soil total nitrogen content and average length in the vertical direction.
Table 3.
Distribution ratio of the soil total nitrogen content and average length in the vertical direction.
| Parameter | a | b | c | d | e |
|---|---|---|---|---|---|
| Distribution ratio | 8.89% | 13.33% | 7.78% | 31.11% | 38.89% |
| Average length | 0.182 m | 0.236 m | 0.201 m | 0.422 m | 0.449 m |
Note: a represents a soil total nitrogen content greater than 1.45 g/kg; b represents a soil total nitrogen content between 1.25 and 1.75 g/kg; c represents a soil total nitrogen content between 0.95 and 1.25 g/kg; d represents a soil total nitrogen content between 0.75 and 0.95 g/kg; e represents a soil total nitrogen content less than 0.75 g/kg.
Table 4.
Descriptive statistics table of the total nitrogen content in different soil texture types.
Table 4.
Descriptive statistics table of the total nitrogen content in different soil texture types.
| Object | Category | Sample Points | Average Value (g/kg) |
|---|---|---|---|
| Soil texture | Clay | 536 | 1.06 |
| Sand | 364 | 0.73 |
Table 5.
Results of analysis of variance of the total nitrogen content in different soil texture types.
Table 5.
Results of analysis of variance of the total nitrogen content in different soil texture types.
| Object | Variance | Sum Square | Degrees Freedom | MSE | F Value | Salience |
|---|---|---|---|---|---|---|
| Soil texture | interblock | 1.265 | 3 | 0.422 | 15.63 | 0.000 |
| intra-class | 0.054 | 2 | 0.027 | |||
| sum | 1.319 | 5 |
Table 6.
Distribution of the total nitrogen content in topographic soils.
| Elevation | Sample Points | Total Nitrogen Content (g/kg) |
|---|---|---|
| High | 381 | 1.32 |
| Low | 519 | 1.08 |
Table 7.
Test results of analysis of variance of the total nitrogen content in relief terrain.
| Object | Variance | Sum Square | Degrees Freedom | MSE | F Value | Salience |
|---|---|---|---|---|---|---|
| Elevation | interblock | 126.32 | 48 | 2.632 | 1.808 | 0.210 |
| intra-class | 10.19 | 7 | 1.456 | |||
| sum | 136.32 | 55 |
Publisher’s Note: MDPI stays neutral with regard to jurisdictional claims in published maps and institutional affiliations. |
© 2022 by the authors. Licensee MDPI, Basel, Switzerland. This article is an open access article distributed under the terms and conditions of the Creative Commons Attribution (CC BY) license (https://creativecommons.org/licenses/by/4.0/).
Share and Cite
MDPI and ACS Style
Zhang, H.; Liu, W.; Zhang, Q.; Huang, X. Three-Dimensional Spatial Distribution and Influential Factors of Soil Total Nitrogen in a Coal Mining Subsidence Area. Sustainability 2022, 14, 7897. https://doi.org/10.3390/su14137897
AMA Style
Zhang H, Liu W, Zhang Q, Huang X. Three-Dimensional Spatial Distribution and Influential Factors of Soil Total Nitrogen in a Coal Mining Subsidence Area. Sustainability. 2022; 14(13):7897. https://doi.org/10.3390/su14137897
Chicago/Turabian StyleZhang, Huijuan, Wenkai Liu, Qiuxia Zhang, and Xiaodong Huang. 2022. "Three-Dimensional Spatial Distribution and Influential Factors of Soil Total Nitrogen in a Coal Mining Subsidence Area" Sustainability 14, no. 13: 7897. https://doi.org/10.3390/su14137897
Note that from the first issue of 2016, this journal uses article numbers instead of page numbers. See further details here.