Article

Origanum majorana L. Extract Attenuated Benign Prostatic Hyperplasia in Rat Model: Effect on Oxidative Stress, Apoptosis, and Proliferation

by
Dalia Mahmoud Abdelmonem Elsherbini
1,2,
Hailah M. Almohaimeed
3,
Mohamed El-Sherbiny
4,
Zuhair M. Mohammedsaleh
5,
Nehal M. Elsherbiny
6,7,
Sami A. Gabr
2 and
Hasnaa Ali Ebrahim
2,3,*
1
Department of Clinical Laboratory Sciences, College of Applied Medical Sciences, Jouf University, Sakaka 42421, Saudi Arabia
2
Department of Anatomy, Faculty of Medicine, Mansoura University, Mansoura 35516, Egypt
3
Department of Basic Medical Sciences, College of Medicine, Princess Nourah Bint Abdulrahman University, Riyadh 11671, Saudi Arabia
4
Department of Basic Medical Sciences, College of Medicine, AlMaarefa University, Riyadh 11597, Saudi Arabia
5
Department of Medical Laboratory Technology, Faculty of Applied Medical Sciences, University of Tabuk, Tabuk 71491, Saudi Arabia
6
Department of Pharmaceutical Chemistry, Faculty of Pharmacy, University of Tabuk, Tabuk 71491, Saudi Arabia
7
Department of Biochemistry, Faculty of Pharmacy, Mansoura University, Mansoura 35516, Egypt
*
Author to whom correspondence should be addressed.
Antioxidants 2022, 11(6), 1149; https://doi.org/10.3390/antiox11061149
Submission received: 3 April 2022 / Revised: 1 June 2022 / Accepted: 8 June 2022 / Published: 11 June 2022

Abstract

:
Benign prostatic hyperplasia (BPH) is a widespread androgenic illness influencing elderly men. It is distinguished by prostatic epithelial and stromal muscle cell proliferation. Inflammation, oxidative stress, and apoptosis have all been interrelated to the development of BPH. Marjoram (Origanum majorana L.) is a herb with reported antiproliferative, proapoptotic, and antioxidative properties, which have not yet been studied in relation to BPH. Consequently, in this work, an ethanolic extract of O. majorana was prepared in two doses (250 and 500 mg/kg/day) to be injected into castrated rats after induction of a testosterone-BPH model. Testosterone propionate (TP) was subcutaneously injected (0.5 mg/kg/day) for one week after castration to induce BPH. Forty adult Wistar male rats were randomly allocated into five groups: control, BPH model, high and low O. majorana doses (250, 500 mg/kg/day), and finasteride (FN) (0.8 mg/kg/day) as a positive control. Treatment was continued with drugs/normal saline for 28 days. Rat’s body and prostate were weighed, prostate index (PI) and % of prostate growth inhibition were calculated, serum dihydrotestosterone (DHT), prostatic content of superoxide dismutase (SOD), catalase (CAT), total antioxidant capacity (TAC), and malondialdehyde (MDA), DN damage, histopathological changes, immune expression of proliferating cell nuclear antigen (PCNA), caspase-3, α-SMA, and TGF-β1 were assessed. In addition, molecular quantitative PCR and ELISA analyses were performed to identify the expression of mRNAs and related proteins of both caspase-3 and TGF-β1 in prostate tissue from O. majorana-treated and untreated groups. Rats with BPH had significantly higher prostate weights and PI, higher DHT, DNA damage (8-hydroxyguanine, 8-OH-dG), and MDA levels with prominent PCNA, α-SMA, and TGF-β expression, but lower SOD, CAT, and TAC activity and caspase-3 expression. O. majorana (250 and 500 mg/kg/day)-treated groups revealed a decrease in prostate weights and PI, lower levels of DHT, suppressed oxidative stress, reduced tissue proliferation and fibrosis, and restored antioxidant and proapoptotic activity. Additionally, quantitative PCR and ELISA analysis showed that treatment with O. majorana significantly upregulated the expression of caspase-3 and downregulated the expression of TGF-β in prostate tissues of BPH rats. The data were confirmed by the immunohistological reactivity of these targeted markers in the prostate tissues. These effects were more significant with O. majorana 500 mg/mL/rat. In conclusion, the current study indicates the efficient use of O. majorana in the treatment of testosterone-induced BPH through its antiproliferative, proapoptotic, and antioxidative mechanisms.

1. Introduction

Benign prostatic hyperplasia (BPH) is a prevalent androgenic illness affecting elderly men. It is marked by epithelial and stromal muscle cell proliferation within the prostate, resulting in lower urinary tract manifestations [1,2]. Although numerous attempts have been made throughout the years, the pathophysiology of BPH has yet to be fully understood. BPH is caused by a combination of factors, including testicular hormones and age. Furthermore, the involvement of proliferation/apoptosis and oxidation/antioxidation pathways was documented in the progression of BPH and validated by several studies over the years [3,4,5]. For most patients, medication is still the primary line of treatment. Alpha-blockers and 5α-reductase inhibitors are the two routinely prescribed medications for BPH. Alpha-blockers, such as alfuzosin, doxazosin, tamsulosin, and terazosin, relax the prostate’s smooth muscle fibers, reducing the dynamic component of prostatic obstruction [6]. The use of α-reductase inhibitors (e.g., finasteride) as a medical therapy for BPH prevents testosterone conversion to dihydrotestosterone (DHT), lowers DHT levels, and suppresses hyperplastic growth of the prostate [7] with a 20–30% reduction in the prostate size [8,9]. However, finasteride-related side effects are frequently documented, such as gynecomastia, headaches, vertigo, chest infections and distress, decreased libido, erectile disturbance, and male infertility owing to low sperm production [10,11]. Such adverse effects limit the use of standard BPH medication and necessitate further research for alternative safe treatment.
Phytotherapeutics have recently received much attention as an efficient and safe treatment strategy for BPH patients, and many plants have shown anti-BPH effects [12]. Several traditional medicine prescriptions or herbs have been reported for their successful impact on BPH, such as Saw palmetto and Rubus coreanus [13], Zi-Shen Pill (ZSP), which consists of different medicinal plants [14], Curcuma longa [15], Scutellaria baicalensis [16], Yukmijihwang-tang [17], curcumin [18] and Cinnamomi cortex [19]. Marjoram (Origanum majorana L.) is a herb with fragrant leaves that is commonly used in flavoring and culinary applications [20,21]. Interestingly, diverse experimental models have proved their efficiency in many of the folklore therapeutic claims [20]. Moreover, it is a popular home cure for respiratory tract infections, cough, rheumatoid arthritis, cardiovascular illness, neurological disorders, epilepsy, sleeplessness, skin care, flatulence, and stomach illnesses [21,22,23]. Regarding chemical composition, O. majorana extract contains phenolic terpenoids (carvacrol, thymol), flavonoids (luteolin, diosmetin, apigenin), hydroquinone, tannins, phenolic glycosides (vitexin, thymonin, arbutin, methyl arbutin, orientin) and sitosterol [24]. O. majorana was considered to be generally safe by the Food and Drug Administration. In this context, alcoholic and aqueous extracts of Origanum majorana showed no toxic effects on the liver, kidney, and chromosomes when administrated to mice [25]. In addition, Seoudi et al. [26] reported no mortalities in rats following oral administration of O. majorana at doses up to 5 g/kg of body weight.
Numerous studies linked its apparent antioxidant activity to the elevated phenolic content [23]. Additionally, previous research work reported antiproliferative efficacy and robust proapoptotic benefits of O. majorana in various types of malignancies [24]. In this context, many studies found that O. majorana ameliorated human cancer cell lines’ growth, including human lymphoblastic leukemia cell lines, human hepatoma cell lines, in addition to experimentally induced fibrosarcoma, lung carcinoma, and hormone-dependent prostate carcinoma [24,27,28]. Previous reports also revealed the potent antiproliferative impact of O. majorana on colon cancer cells through triggering apoptosis with mitochondrial dysfunction [29,30,31].
The overall goal of this study is to investigate the mitigating effect of O. majorana extract on experimentally induced BPH. The antiproliferative, apoptotic, and antioxidative properties of O. majorana were compared to a standard medication, finasteride, using immunohistochemistry, ELISA, quantitative PCR, and biochemical measurements.

2. Materials and Methods

The G*Power program for Windows (version 3.1.9.7) was used to compute the sample size according to the procedures specified [32]. Following previous studies [5,33,34,35,36,37], we assumed that the means for five groups (vehicle, BPH, finasteride, O. majorana 250 and 500 mg/mL) would be (5.50, 10.17, 7.50, 23.82, and 5.63) for MDA, and (800.05, 567.06, 658.23, 115.20 and 991.462) for SOD. Considering the standard deviation (SD) within each group, 1.24 for MDA and 105.168 for SOD, effect size (f) would be 4.67 for MDA and 2.635 for SOD. According to these assumptions, sample sizes of MDA and SOD of 10 and 10, respectively, achieve 95% power to identify these effect sizes at an alpha level of 5%, with sample sizes of two per group in a one-way ANOVA design with five groups. Using the F-Test with a significance level of 0.05, the total sample of 10 achieves a power of 95%. For morphometric studies, we assumed eight rats per group.

2.1. Materials

O. majorana belongs to the family Lamiaceae and is popularly known as sweet marjoram. It was obtained as a whole plant from a marketplace in Egypt. To prepare an ethanolic extract of O. majorana, 25 g of O. majorana flowers were immersed in 150 mL of ethanol for 24 h before being re-immersed for another 24 h (2× extraction times). A rotary evaporator was used to concentrate the extracts and then dried in a lyophilizer (LABCONCO lyophilizer, shell, freeze system, Kansas city, MO, USA) at 37–40 °C, then kept in a desiccator until needed [38]. In distilled water, the dried extract was dissolved, and a final stock with a concentration of 250 and 500 mg/kg/day was prepared for further usage. The selection of doses was based on preliminary experiments and previous studies [36,38].
Finasteride and testosterone propionate (TP) were purchased from Sigma Aldrich; Merck KGaA (Darmstadt, Germany). SOD, CAT, MDA, DNA damage (8-hydroxyguanine, 8-OH-dG), total antioxidant capacity (TAC), testosterone, and DHT assay kits were purchased from Abcam (Cambridge, MA, USA).

Animals

Forty adult Wistar male rats aged 6–8 months, weighing 250–300 g, were used. Rats were housed in a clean facility at 25 °C with a relative humidity of 55% and under normal laboratory settings with a regular 12 h light/dark cycle. Rats were provided unrestricted access to normal laboratory feed and water. The rats, after one week of acclimatization, were assigned to experimental groups at random.

2.2. Methods

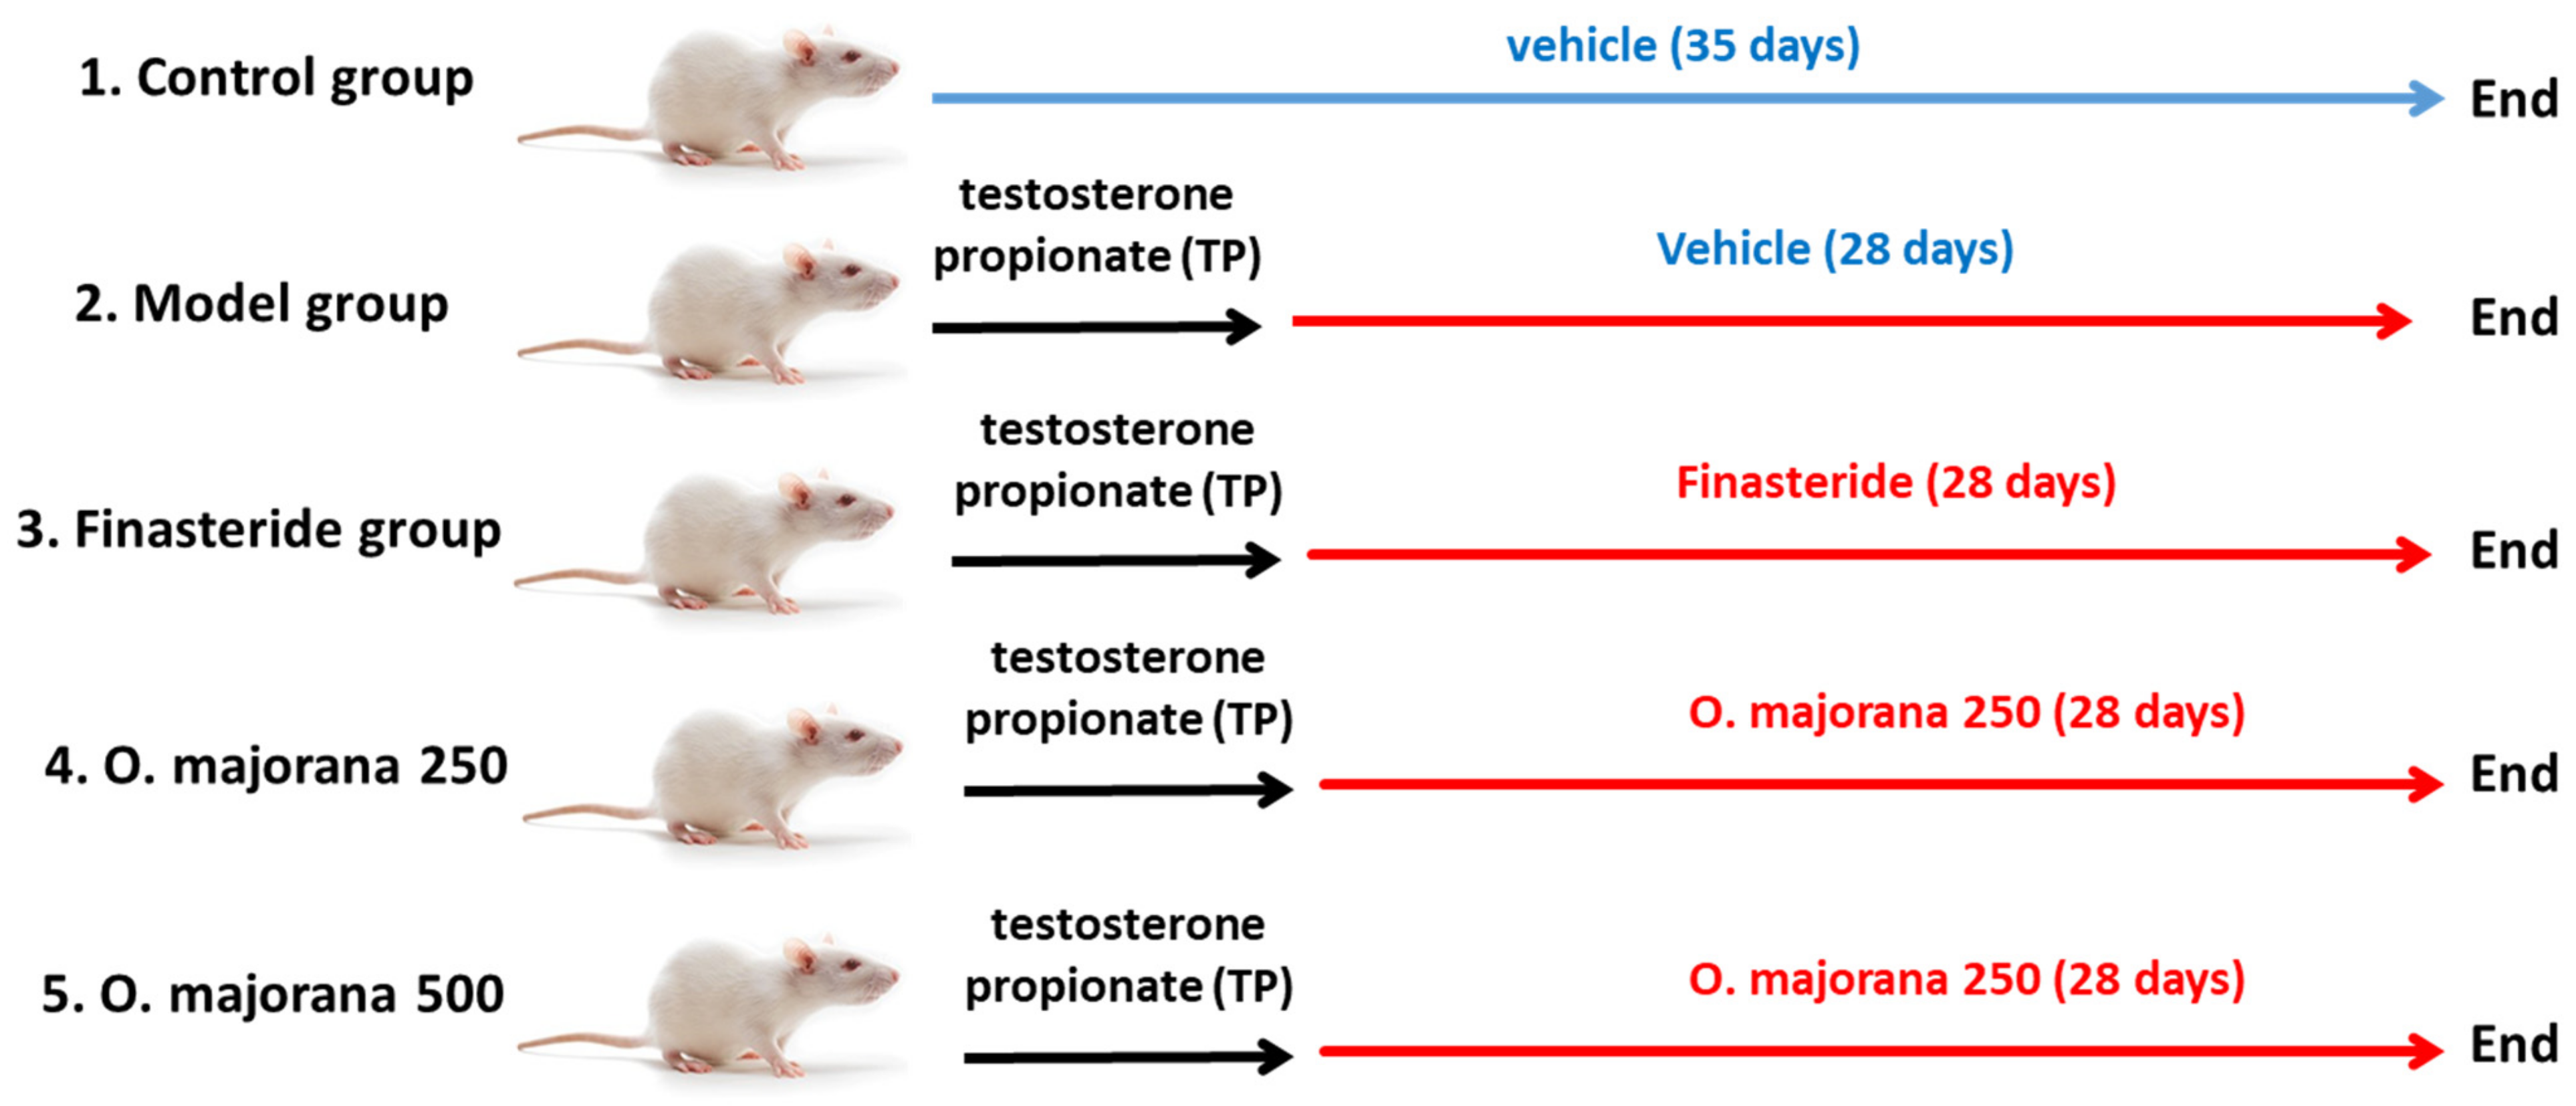
2.2.1. Testosterone Propionate-Induced Rat Model of BPH

Rats were allocated into 5 groups (n = 8) at random (Figure 1): control group (control/vehicle), non-treated rats injected intraperitoneally (i.p.) with the vehicle, while the other four groups were subjected to a well-sterile castration procedure to extract both testes after being anesthetized with phenobarbital injection (i.p., 50 mg/kg) to exclude the effect of intrinsic testosterone. All castrated rats received subcutaneous (S.C.) testosterone propionate (TP) (dissolved in corn oil) at 0.5 mg/kg daily following castration for one week. The BPH model was established, and the therapy was administrated within the 28 consecutive days of TP injection [39]. One group was assigned as the model group, and the other three were designated as treated groups; the Finasteride group (FN), in which rats received intragastric dissolved finasteride in ultrapure water (0.8 mg/kg/day) and were considered a positive control group; marjoram low dose group (O. majorana 250), rats were treated with intragastric (i.g.) marjoram extract (250 mg/kg/day) for 28 days; marjoram high dose group (O. majorana 500 mg/kg/day), rats were treated with intragastric (i.g.) of marjoram extract for 28 days. At the end of the experiment (29th day), blood samples (~6–8 mL) were withdrawn from rats under anesthesia (intravenous injection of 3% pentobarbital sodium at 39 mg/kg body weight, Sigma-Aldrich; Merck KGaA, Darmstadt, Germany, cat no. P3761). Rats were euthanized, and the prostate was excised through a median abdominal incision after exposing the bladder. Ventral (VP) and lateral (LP) lobes of harvested prostates were dissected based on their position relative to the urinary bladder. One-half of each lobe was fixed for 24 h in neutral 10% formalin at room temperature for histological and immunohistochemical processing, while for subsequent biochemical analysis, the remaining half was kept at −80 °C.
To test the safety of O. majorana extract, a group of normal rats received O. majorana 500 mg/kg/day for 35 days. Thereafter, animals were placed in metabolic cages to collect urine for assessment of protein (Spinreact, Barcelona, Spain), and blood was collected and centrifuged to separate the serum for assessment of kidney and liver function. Serum creatinine (Diamond Diagnostic Chemical Company, Budapest, Hungary), blood urea nitrogen (BUN, BIOMED Diagnostic, Cairo, Egypt), alanine aminotransferase (ALT, MAK052), and aspartate aminotransferase (AST, MAK055) were evaluated according to manufacturers’ instructions. Additionally, sections from the liver and kidneys were harvested and processed for the histopathological study of possible tissue alterations using Hematoxylin and Eosin staining. Results are shown as Supplementary Materials.

2.2.2. Body Weight and Prostate Weight

Rats were weighed at the start of the experiment, weekly, and at the end. Excised prostate from each rat was weighed to calculate the prostate index following the formula that was previously described by Akbari et al. [40].
Prostate   index = Prostate   weight Body   weight
Increased prostate weight is a significant marker of BPH as it reflects prostatic hyperplasia (epithelial and stromal), which is linked to prostate weight [17]. Changes in the prostate index upon comparing each group with vehicle and model groups distinguish the percentage of inhibition of disease progression with treatment [40].
Percentage   of   inhibition = 100     Treatment   group     Control   Vehicle Model   group     Control   Vehicle × 100

2.2.3. Hormonal Assessment

Collected blood samples were centrifuged for 15 min (2000× g, 4 °C) to extract serum, which was then stored at −80 °C. Serum testosterone and DHT levels were determined using an enzyme-linked immunosorbent assay (ELISA) according to the manufacturer’s protocol. Sample absorbance was measured at 450 nm using an Epoch Micro plate Spectrophotometer (BioTek Instruments, Inc., Winooski, VT, USA). The recorded values were in ng/mL [41].

2.2.4. Measurement of Oxidant-Antioxidant Status in Prostate Tissues

Homogenization of prostate tissues was performed using ice-cold phosphate-buffered saline (50 mM potassium phosphate pH 7.5). Cellular oxidant-antioxidant parameters, MDA, DNA damage (8-hydroxyguanine, 8-OH-dG), SOD and CAT activities, and cellular total antioxidant capacity (TAC) were identified in prostate tissues of control, O. majorana PBH-treated, and non-treated groups. Prostate MDA, lipid peroxidation marker, concentration was detected by spectrophotometer according to the manufacturer’s instructions, following the Satoh protocol [42]. The absorbance was determined at 532 nm, and butanol was used as a blank. MDA measurements were presented in nmol/g protein. 8-Hydroxyguanine (8-OH-dG) was measured as a DNA damage marker using Elisa kits (Abcam; Cambridge, MA, USA), and the results were obtained in nanograms per milliliter as previously reported [43]. In addition, the activity of both SOD and CAT antioxidant enzymes, as well as cellular TAC, were measured in prostate tissues as previously analyzed [33,44,45,46].

2.2.5. Assessment of Nrf2 and HO-1 in Prostate Tissues by ELISA

Nrf2 and HO-1 levels were quantified in both O. majorana-treated and non-treated prostate tissues by immunoassay analysis using an ELISA kit (cat. no. SU-B30429; Shanghai Yuchun Biotechnology, Shanghai, China) for Nrf2 and ELISA kit (cat. no: E-EL-R0488, Elabscience, Houston, TX 77079, USA) for the determination of HO-1, respectively. In this test, 50 mg of the tissue sample was homogenized using PBS buffer with PMSF as a serine inhibitor. Then, the homogenized tissue samples were centrifuged at 15,000 rpm, followed by the collection of the supernatant. To determine the level of the respective Nrf2 and HO-1 concentrations, the produced supernatant was added to each well of the ELISA plate and incubated with respective antibodies for Nrf2 and HO-1 for 60 min. Finally, the levels of the resultant Nrf2 and HO-1 concentrations were determined using an ELISA reader at 450 nm. Data were interpolated from the standard curves to calculate the amount of Nrf2 (pg/mg) and HO-1 (pg/mg), respectively.

2.2.6. Assessment of Caspase-3 and TGF-β1 in Prostate Tissues by ELISA

Both caspase-3 and TGF-β1 were identified in prostate tissues using commercially available ELISA kits (Millipore Corporation, Billerica, Santa Clara, MA, USA) for caspase-3 and (Aviscera Bioscience, CA, USA) for TGF-β1 and the results were obtained in nanograms per milliliter [43,47]. Each test was performed in triplicate.

2.2.7. Quantitative Real-Time PCR Analysis for Caspase-3 and TGF-β1 in Prostate Tissues

(a)
Isolation of total RNA and complementary DNA (cDNA) Synthesis
According to the manufacturer’s instructions, TRIzol reagent (Invitrogen, Bedford, MA, USA) was used to isolate the total RNA of cells 46. Then, reverse transcription with Oligo (dT) and M-MLV Reverse Transcriptase (Thermo Fisher Scientific, Bedford, MA, USA) was applied to obtain a purified RNA sample. Finally, real-time polymerase chain reaction (PCR) was applied by an ABI 7900HT system using SYBR® Premix (Takara, Dalian, China) to synthesize complementary DNA (cDNA) from purified RNA samples as mentioned previously in the literature. The procedures were performed according to the manufacturer’s instructions.
(b)
The real-time PCR analysis process
The expression of targeted mRNAs for caspase-3 and TGF-β1 in prostate tissues were identified by corresponding primers as shown in Table 1 in the thermal cycler process at different steps of heat conditions as follows: denaturation at 9 °C for 10 s, 45 cycles at 95 °C for 10 s, and 65 °C for 30 s [46]. The PCR products obtained were matched with glyceraldehyde-3-phosphate dehydrogenase (GAPDH) as the reference gene [48]. No nonspecific amplification was observed. The data were analyzed using the comparison Ct (2−ΔΔCt) method and were expressed as fold changes relative to the respective controls. Each sample was analyzed in triplicate [48].

2.2.8. Histopathological Examination

For the histological examination, 4 μm thick sections were prepared from prostate paraffin blocks after fixing the prostate tissue in 4% paraformaldehyde (Sigma-Aldrich). The sections were stained with (H&E) and Masson’s trichrome stain [49] and were photographed using a light microscope (BX-51; Olympus, Tokyo, Japan).

2.2.9. Immunohistochemical Staining Technique

Deparaffinized 4 μm sections were placed on coated slides and then treated for ten minutes at room temperature with hydrogen peroxide (0.3%/methanol) to stop the activity of endogenous peroxidase. Finally, sections were heated for ten minutes at 95 °C in 10 mM citrate buffer to induce antigen retrieval before being allowed to cool for 60 min.
Sections were incubated with the following primary antibodies for immunostaining: gamma H2Ax and Poly (ADP-ribose) polymerase 1 (PARP1), proliferating cell nuclear antigen (PCNA) [50], caspase-3, TGF-β1 [51], and alpha smooth muscle actin (α-SMA) [52] as presented in Table 2. Then, they were left in phosphate-buffered saline (PBS) at 4 °C overnight before adding the universal secondary anti-mouse IgGκ (sc-516102, Santa Cruz, CA, USA) or anti-rabbit IgG (sc-2357, Santa Cruz) for 30 min to localize the primary antibody binding followed by washing again with PBS. Finally, Diaminobenzidine (DAB) was added for four minutes to demonstrate peroxidase activity, followed by hematoxylin staining as counterstain [53]. Olympus® CX41 light microscope was used for examining the sections that have been photographed by its digital camera Olympus® SC100.

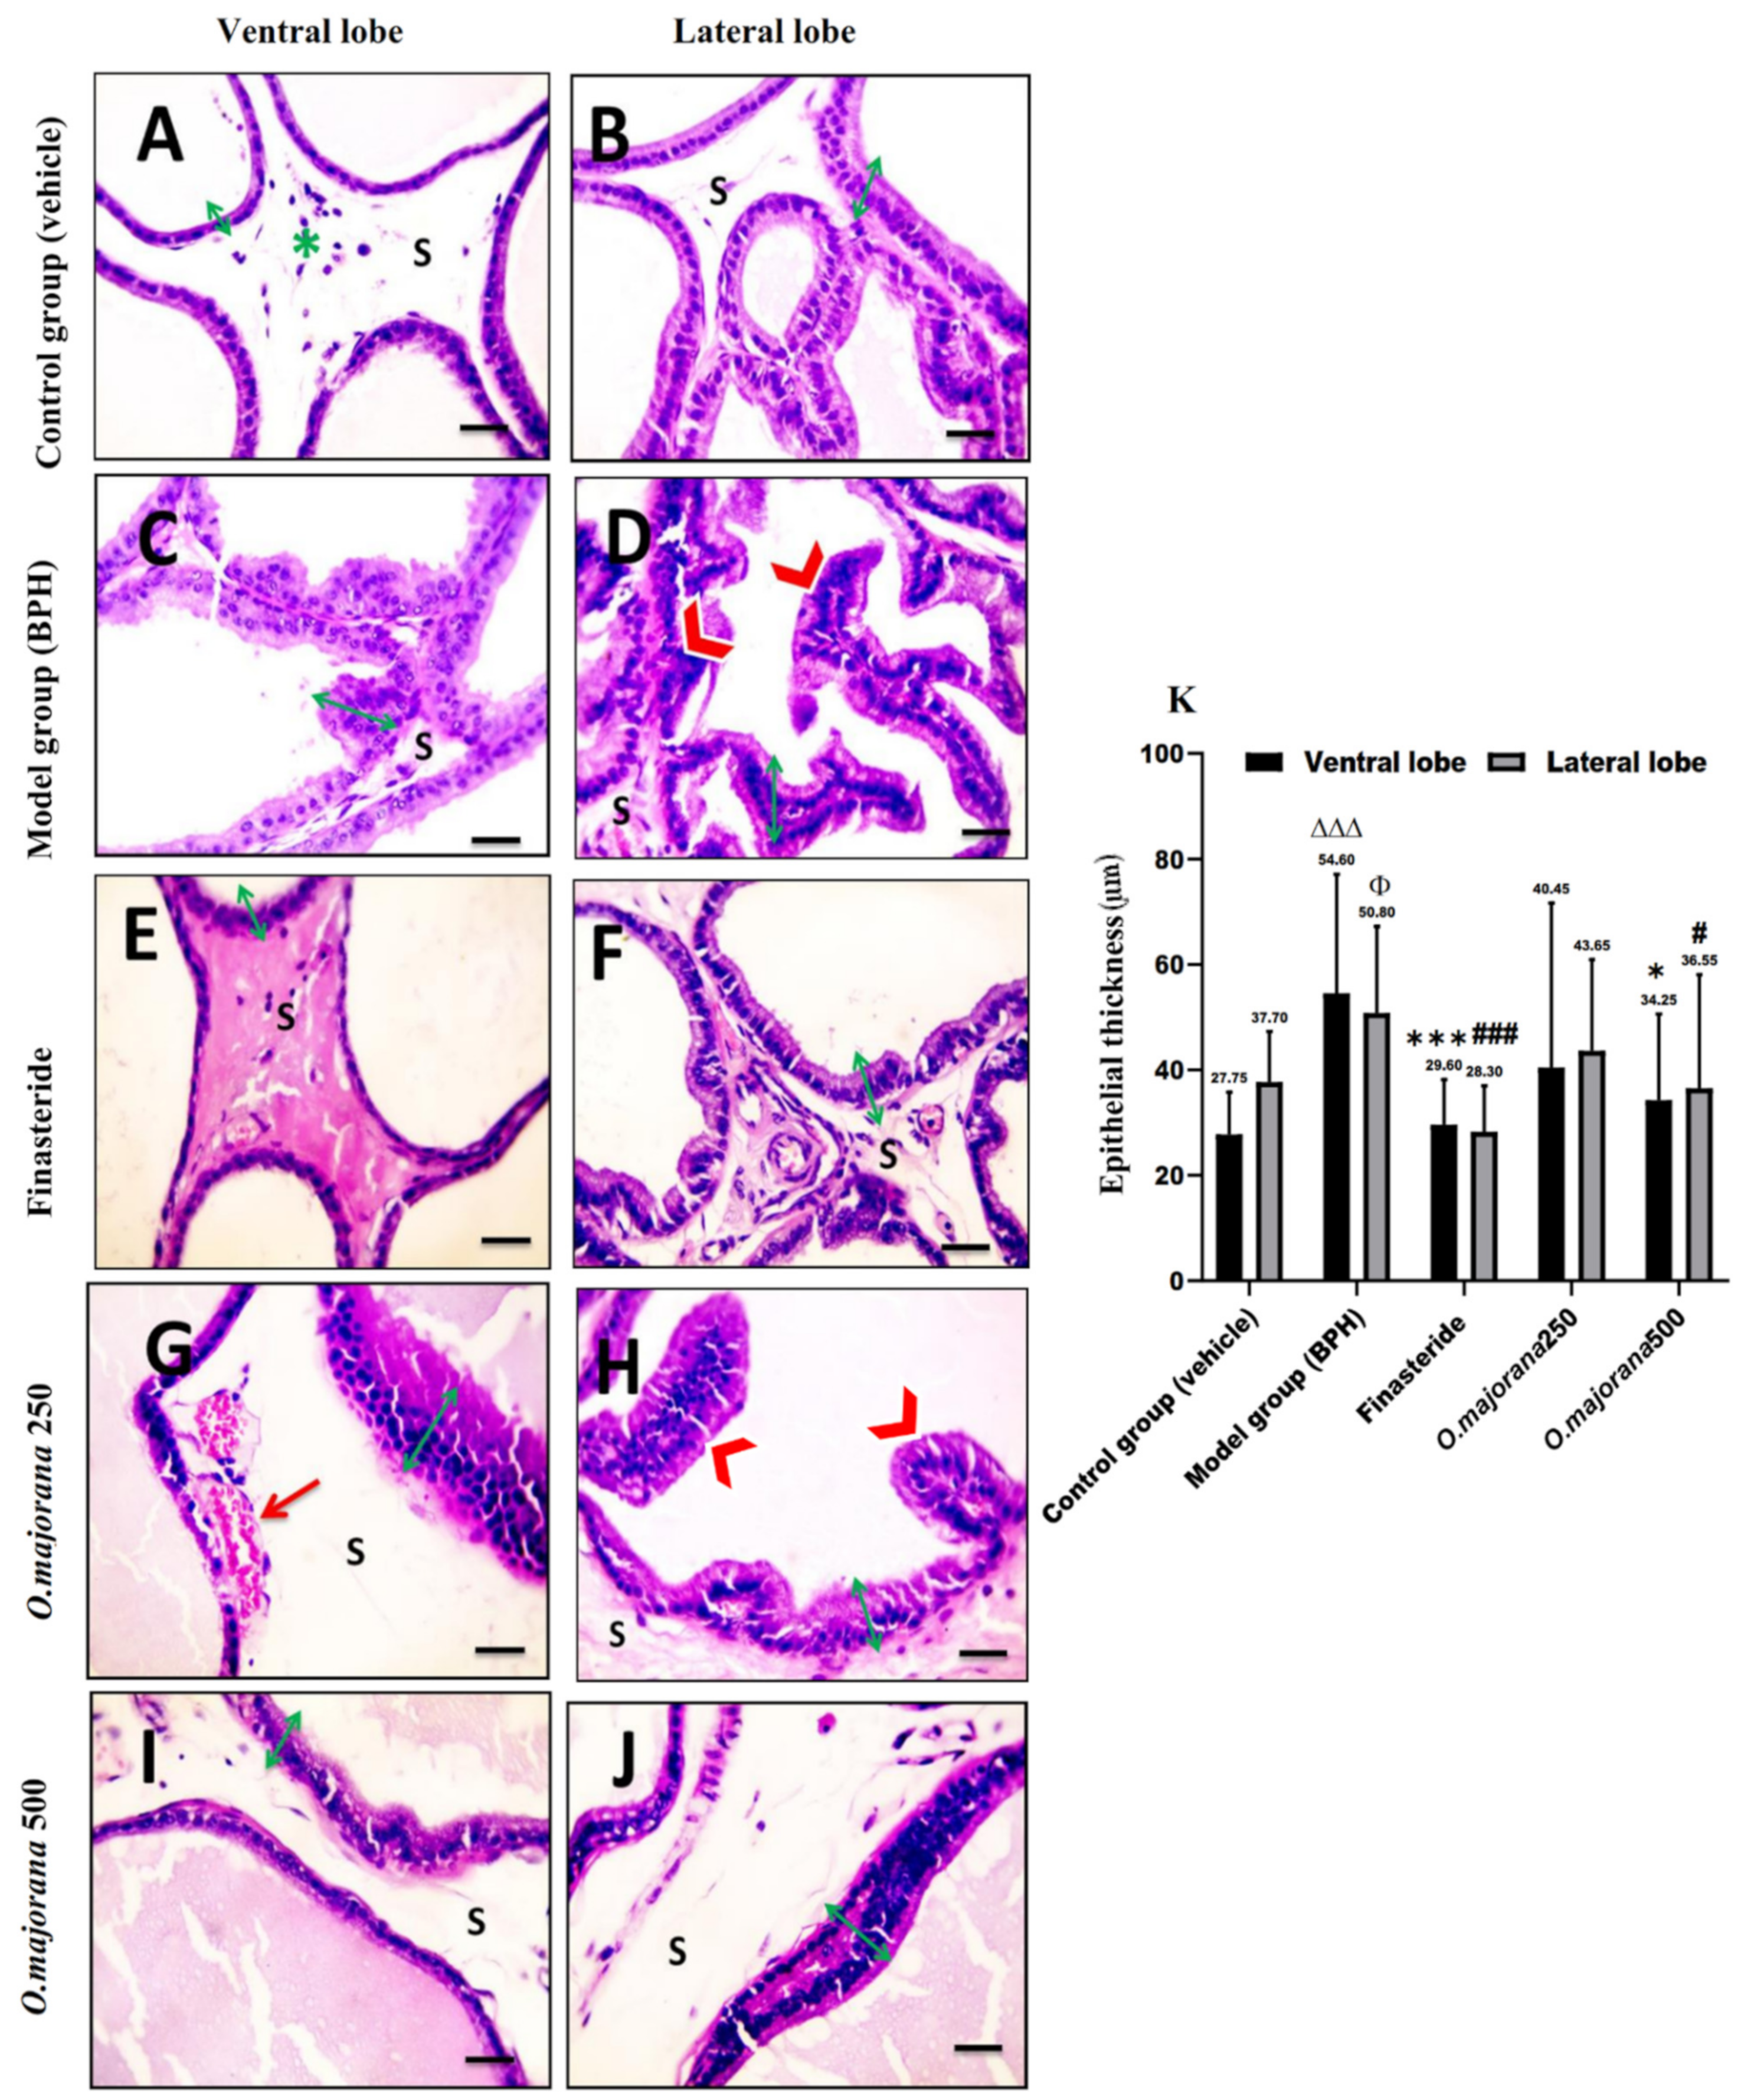
2.2.10. Morphometric Analysis

ImageJ® software win64 (Wayne Rasband NIH, Bethesda, MA, USA) [54] was applied to conduct morphometric measurements, including at least 5 sections per each prostatic lobe (ventral and lateral), and from each section, 5 different non-overlapping fields were examined (25 fields/prostatic lobe). Measurements were performed by one investigator blind to the work to avoid inter-observer errors. The following parameters were assessed:
(1)
In H&E-stained sections, the prostatic epithelial height (μm) was measured by manually drawing a line through the acinar epithelia at a magnification of ×400. The acinar luminal area (μm2) was measured by drawing a line around the luminar perimeter and calculating the acinar area at a magnification of ×100
(2)
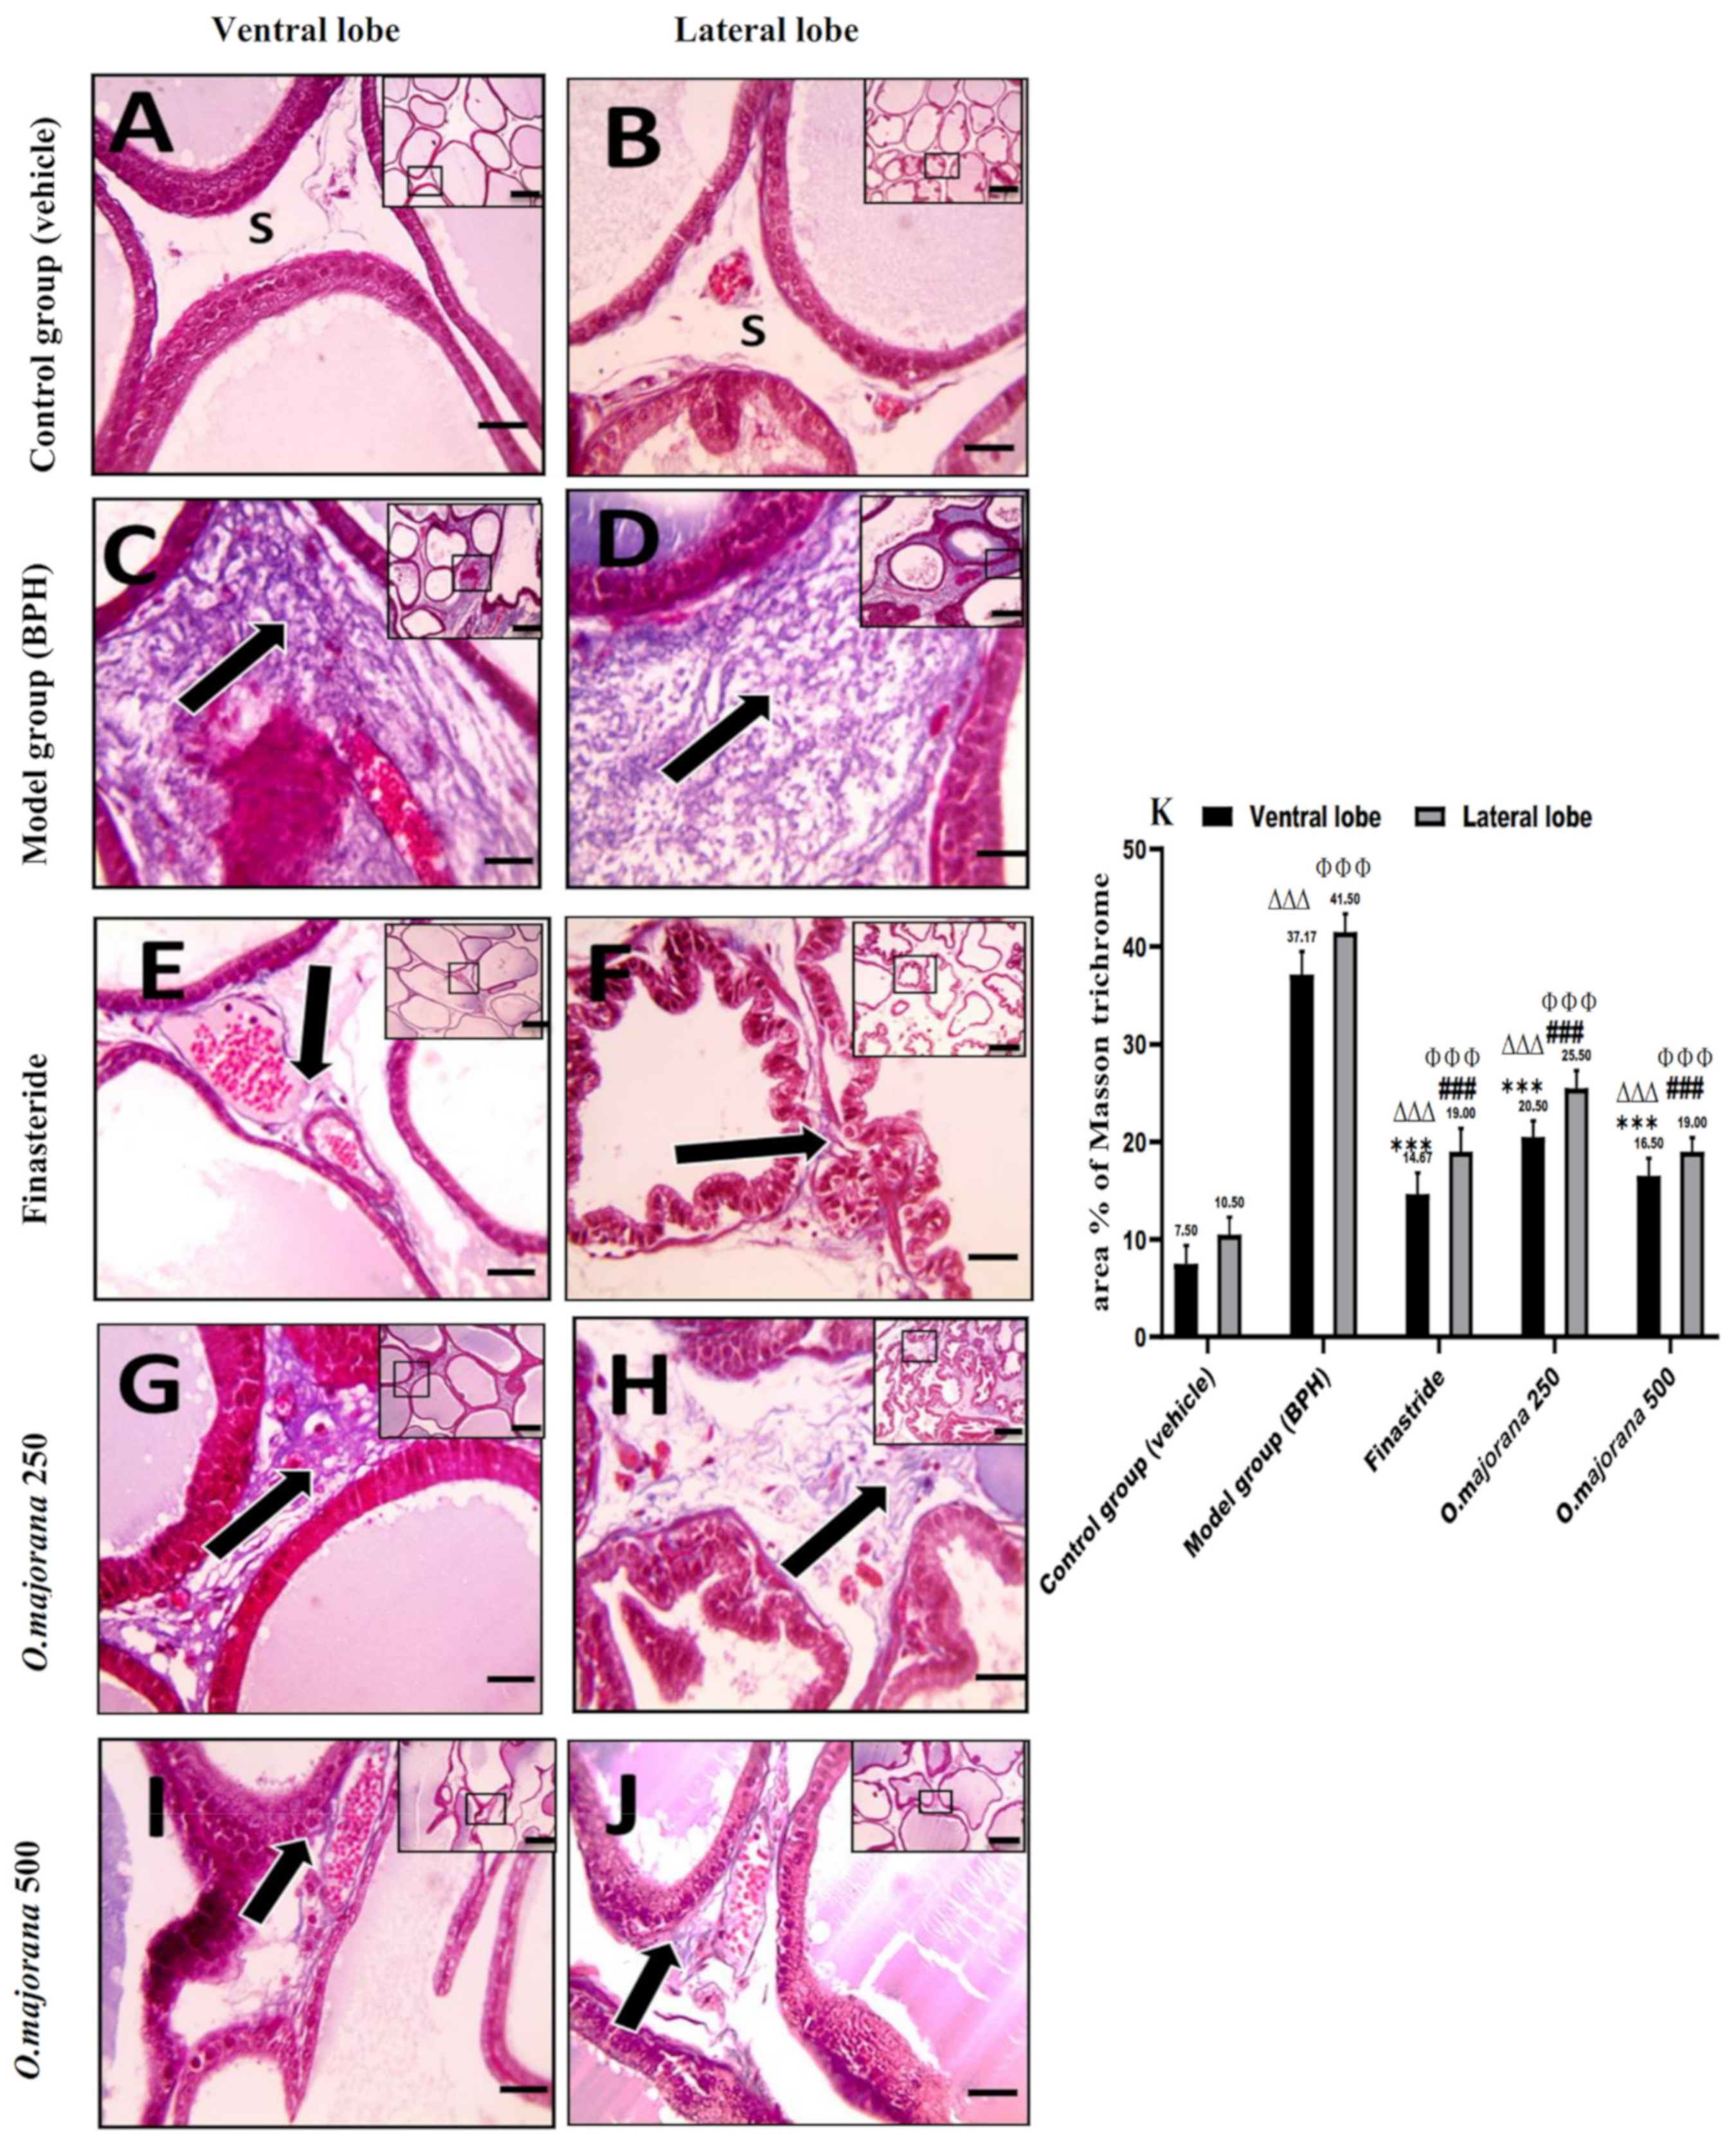
Mean area % of collagen fiber was determined in the Masson’s trichrome-stained sections at a magnification of ×100
(3)
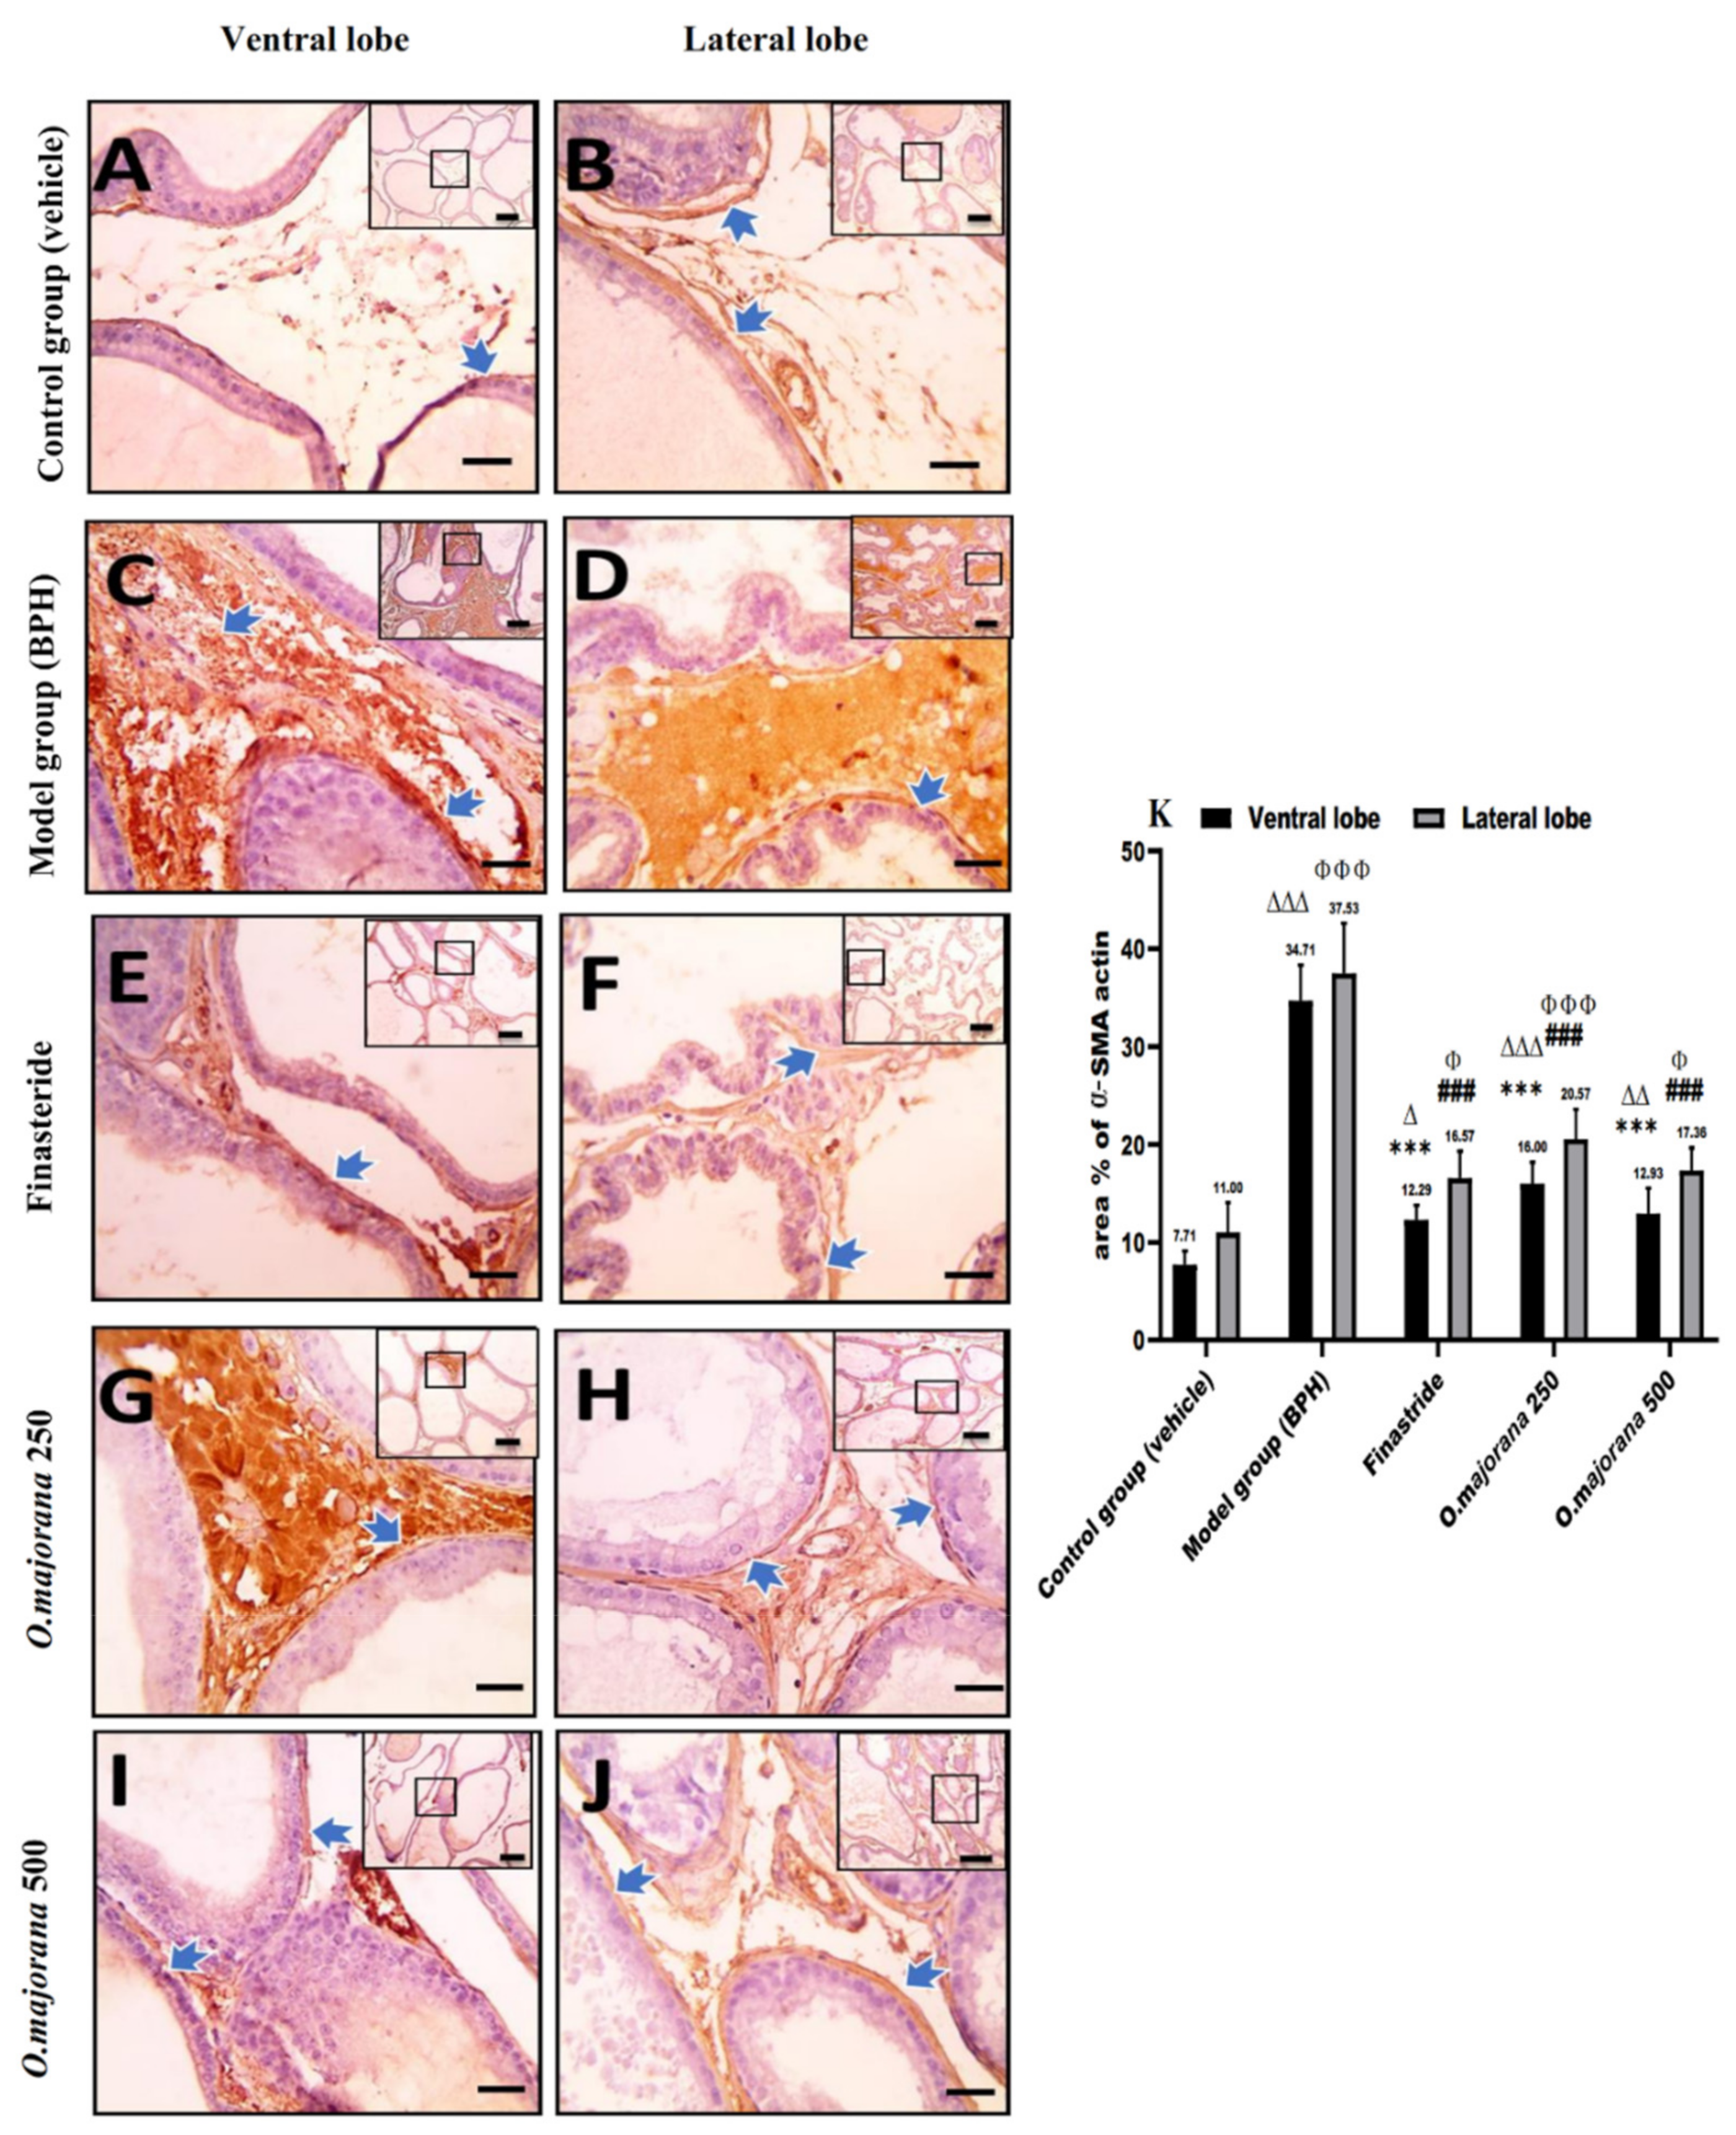
Mean area % of positive immunoreactivity for (α-SMA) and (TGF-B1) was measured at a magnification of ×400.
Proliferative and apoptotic indices: positive immunoreactive cells for PCNA and caspase-3 were detected using the QuPath program (0.1.2) [55] in the tissue section at a magnification of X100. This method was applied to serial sections stained with PCNA and caspase-3 with five random fields of 1.2 mm2 analyzed on each section. For immunohistochemistry quantitative assessment of γH2Ax and PARP1, the Allred score was used [56,57], presented with a scale of 0–8, and quantified using the QuPath program (0.1.2).

2.2.11. Statistical Analysis

Graphpad Prism, version 8, was used to analyze the data in this research. The independent samples t-test was used to compare the means of the two groups. A one-way analysis of variance (ANOVA) and Tukey’s post-hoc test were performed for multiple groups. The p-values for significance were set at p ˂ 0.05. The data were provided as a mean ± standard deviation (SD).

3. Results

3.1. Effect of O. majorana on the Rat’s Body Weight Gain and Prostate Weight

The BPH and O. majorana 250 groups gained less body weight than the finasteride and O. majorana 500 groups, which gained significantly more body weight than the control (vehicle) group. Considering that prostate weight is an essential indicator of BPH and that it is extremely difficult to obtain the initial prostate weight of rats during the experiment period, comparisons were made at the end of the study based on the weighed excised prostate in relation to the control (vehicle) group. When compared to the control/vehicle group, the BPH group had a significant increase in prostate weight (912.50 ± 85.39 mg) (Table 3). When compared to the BPH group, the finasteride and O. majorana 500 groups had a significant decrease in prostate weight (600.02 ± 81.64 and 637.50 ± 47.87 mg, respectively, p ˂ 0.05). The O. majorana 250 group had an insignificant reduction in prostate weight (812.50 ± 49.30 mg) relative to the BPH group. PI was significantly higher in the BPH group when compared with control or treated groups. The Finasteride group exhibited an evident decrease in PI, followed by O. majorana 500 groups and O. majorana 250 groups.
PI inhibition percentages with finasteride, O. majorana high dose (500), and O. majorana low dose (250) were 58.75%, 51.70%, and 18.80%, respectively, while PI inhibition percentages relative to the control group were 52.29%, 47.43%, and 15.03%, respectively (Table 3).

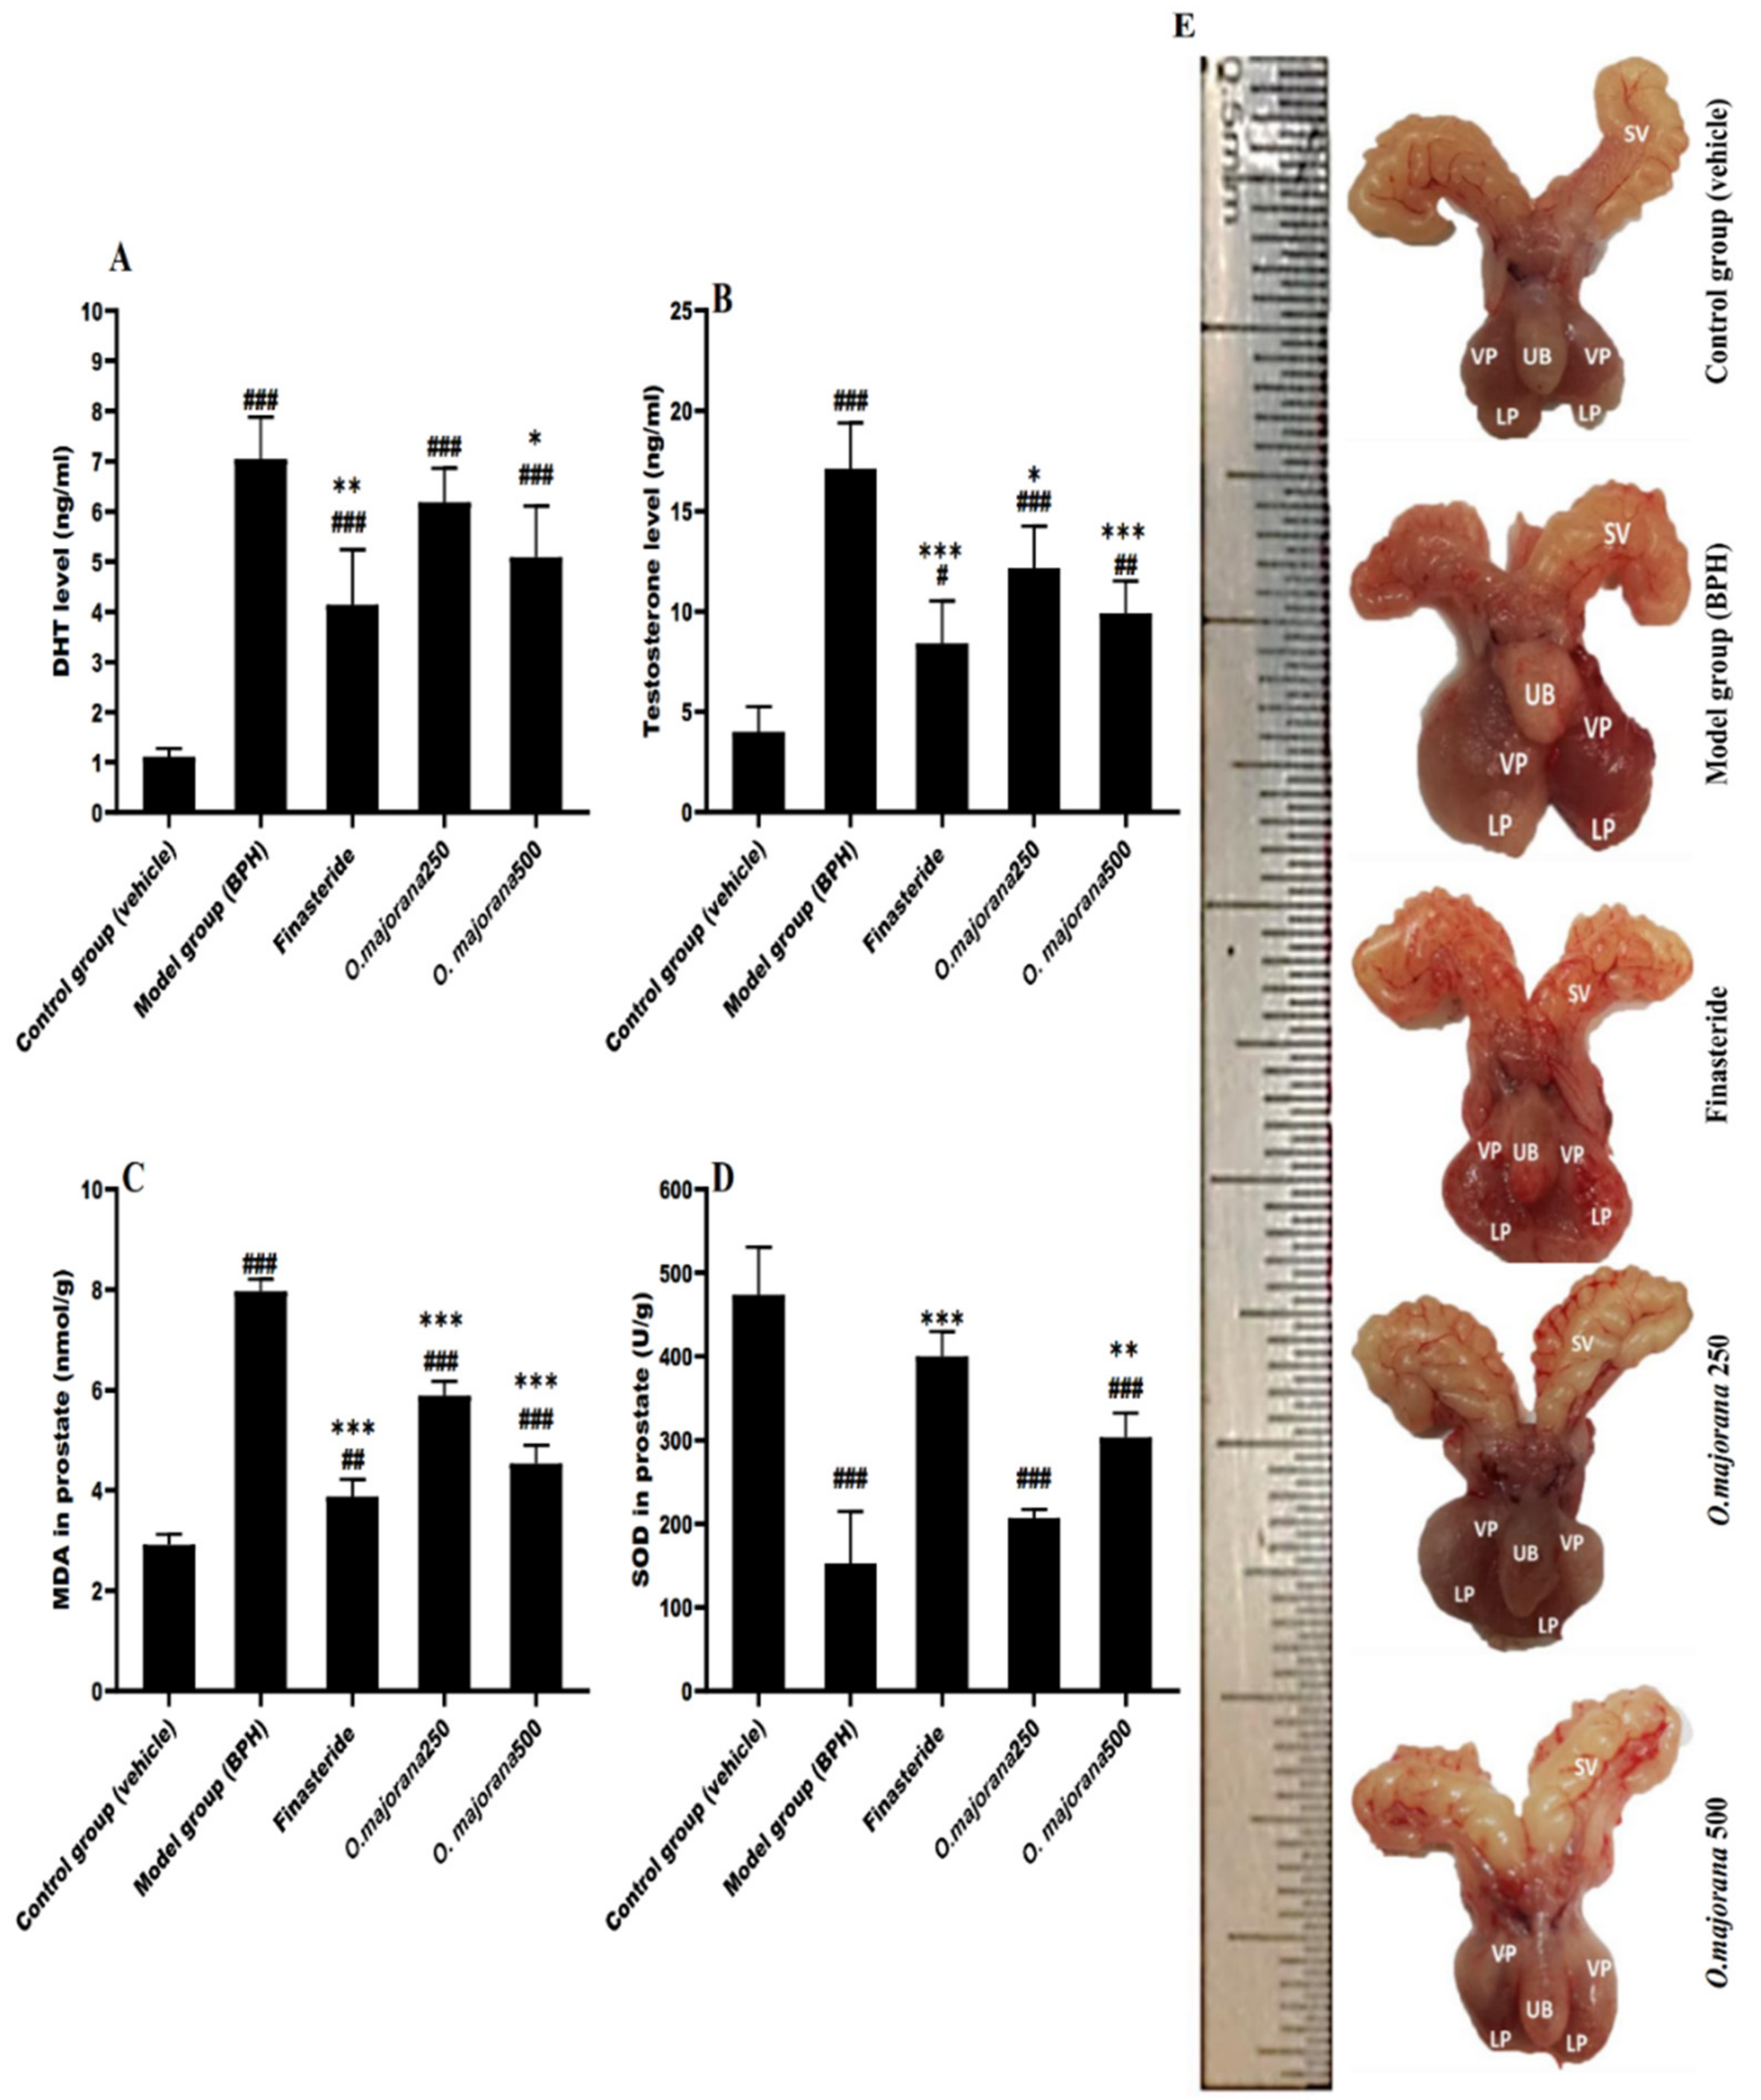
3.2. Effect of O. majorana on DHT and Testosterone Serum Levels

DHT and testosterone are involved in expediting prostate hyperplasia and show a vital role in prostatic growth. The primary prostatic androgen is DHT. Serum DHT and testosterone levels are depicted in Figure 2. When compared to the control/vehicle group, the model (BPH) group had a significant increase in ±rum DHT levels (7.05 ± 0.83 ng/mL versus 1.11 ± 0.17 ng/mL, p < 0.001, Figure 2A). A significantly lower serum DHT levels were observed in the finasteride-treated group (4.14 ± 1.09 ng/mL, p < 0.01) relative to the BPH group. Similarly, DHT levels were less in the O. majorana-treated groups (6.18 ± 0.68 ng/mL in O. majorana 250 group, p = 0.05, 5.09 ± 0.99 ng/mL in the O. majorana 500 group, (p < 0.05)) compared to the BPH group. The difference between the O. majorana 500 and the finasteride-treated groups was insignificant (p > 0.05).
The BPH group had significant higher testosterone levels (17.14 ± 2.26 ng/mL) relative to the control/vehicle group (4.02 ± 1.24 ng/mL; p < 0.001; Figure 2B), whereas the finasteride-treated group (8.40 ± 2.12 ng/mL) had significantly lower testosterone levels than the BPH group (p < 0.001). Moreover, a marked decrease in testosterone levels was detected in the O. majorana-treated groups (12.16 ± 2.11 ng/mL in the O. majorana 250 group, p < 0.05; 9.90 ± 1.63 ng/mL in the O. majorana 500 group, p < 0.001) compared to the BPH group. The difference between O. majorana 250 and O. majorana 500 groups relative to the finasteride-treated group was insignificant (p > 0.05).

3.3. Effect of O. majorana on Prostatic MDA and SOD Levels

When compared to the control/vehicle group, the BPH group had a significant increase in the prostate lipid peroxidation marker MDA (7.97 ± 0.24 nmol/g versus 2.91 ± 0.21 U/g, p < 0.001, Figure 2C), whereas the finasteride-treated group (3.88 ± 0.35 nmol/g) had significantly lower prostate MDA content than the BPH group (p < 0.001). When compared to the BPH group, the O. majorana-treated groups (5.89 ± 0.28 nmol/g in O. majorana 250 group, p < 0.001; 4.54 ± 0.36 nmol/g in the O. majorana 500 group, p < 0.001) had a significantly lower prostate MDA content. Furthermore, when compared to the O. majorana 500 group, the O. majorana 250 groups revealed a significant difference in prostate MDA content (p < 0.001), while the finasteride-treated group showed an irrelevant difference (p > 0.05).
In contrast, the BPH group had significantly lower activity in prostatic SOD relative to the control/vehicle group (152.2 ± 62.73 U/g versus 437.6 ± 57.51 U/g, p < 0.001; Figure 2D). The finasteride-treated group revealed significantly higher activity in prostatic SOD (400.3 ± 29.72 U/g, p < 0.001) relative to the BPH group. When compared to the model group, O. majorana-treated groups had higher prostatic SOD levels (206.8 ± 10.34 U/g in O. majorana 250 group, p = 0.05; 303.5 ± 29.10 U/g in the O. majorana 500 group, p < 0.01). Moreover, when compared to O. majorana 500 groups, the finasteride-treated group had a non-significant difference (p > 0.05), whereas O. majorana 250 groups exhibited a significant difference (p < 0.05).

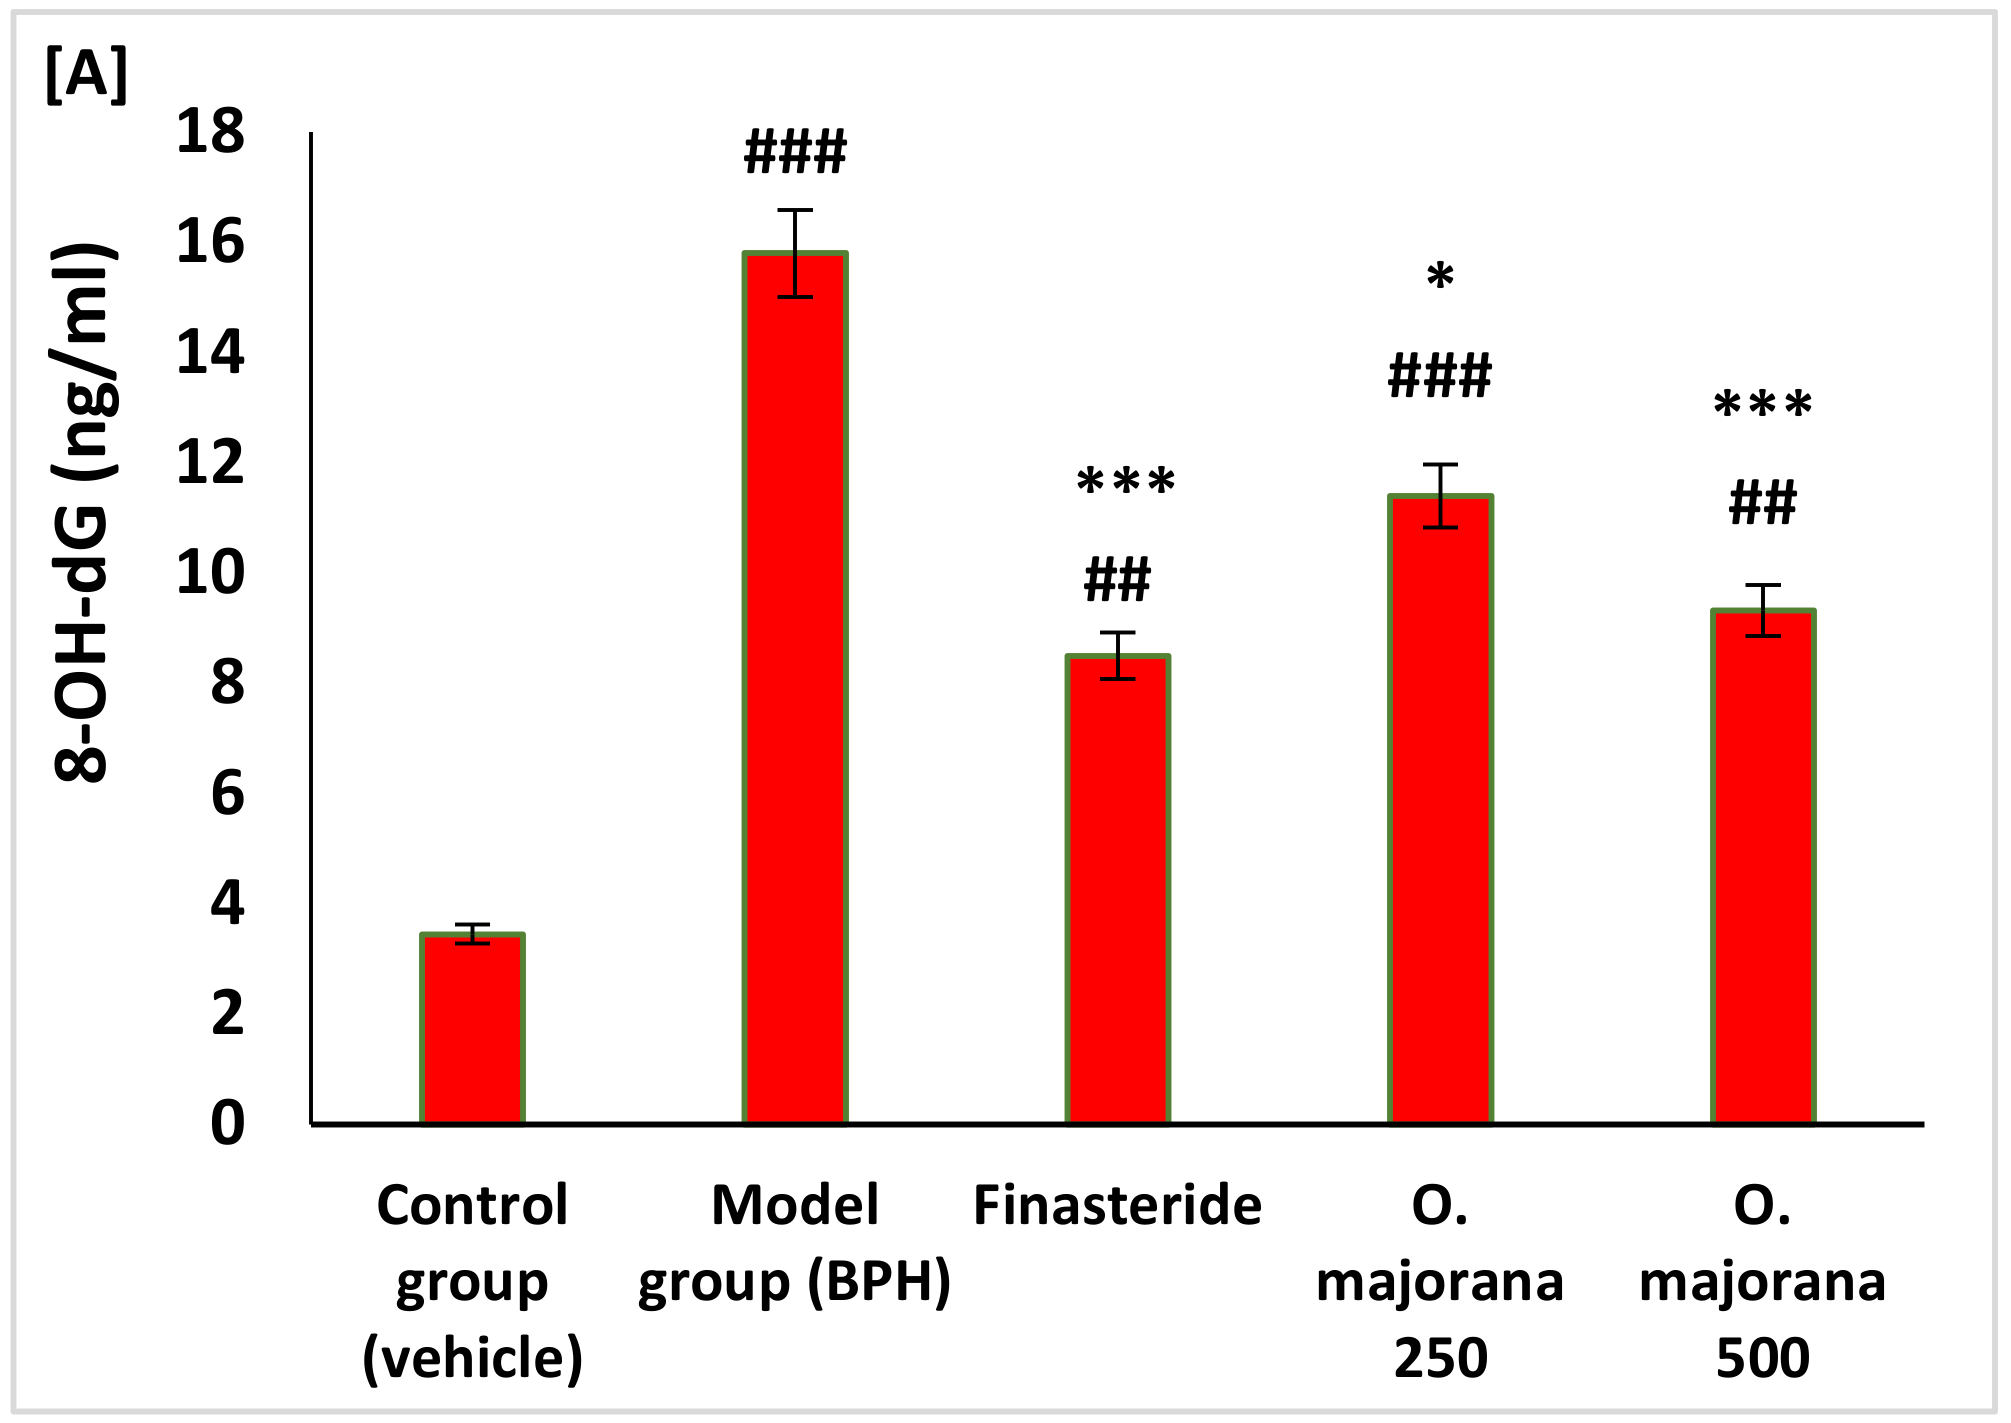
3.4. Effect of O. majorana on Prostate DNA Damage, CAT, and TAC

In rats of the BPH (model) group, there was a significant increase in the levels of cellular DNA damage as measured by the levels of 8-hydroxyguanine (8-OH-dG) (p < 0.001) and a significant (p < 0.001) reduction in the expression levels of both CAT (Figure 2B), and TAC (Figure 2C), respectively, compared to control rats. Whereas O. majorana-treated BPH groups showed a significant reduction in the cellular DNA damage marker (8-OH-dG) and significantly increased cellular antioxidant status measured by CAT and TAC compared to BPH (model) (Figure 3A–C).

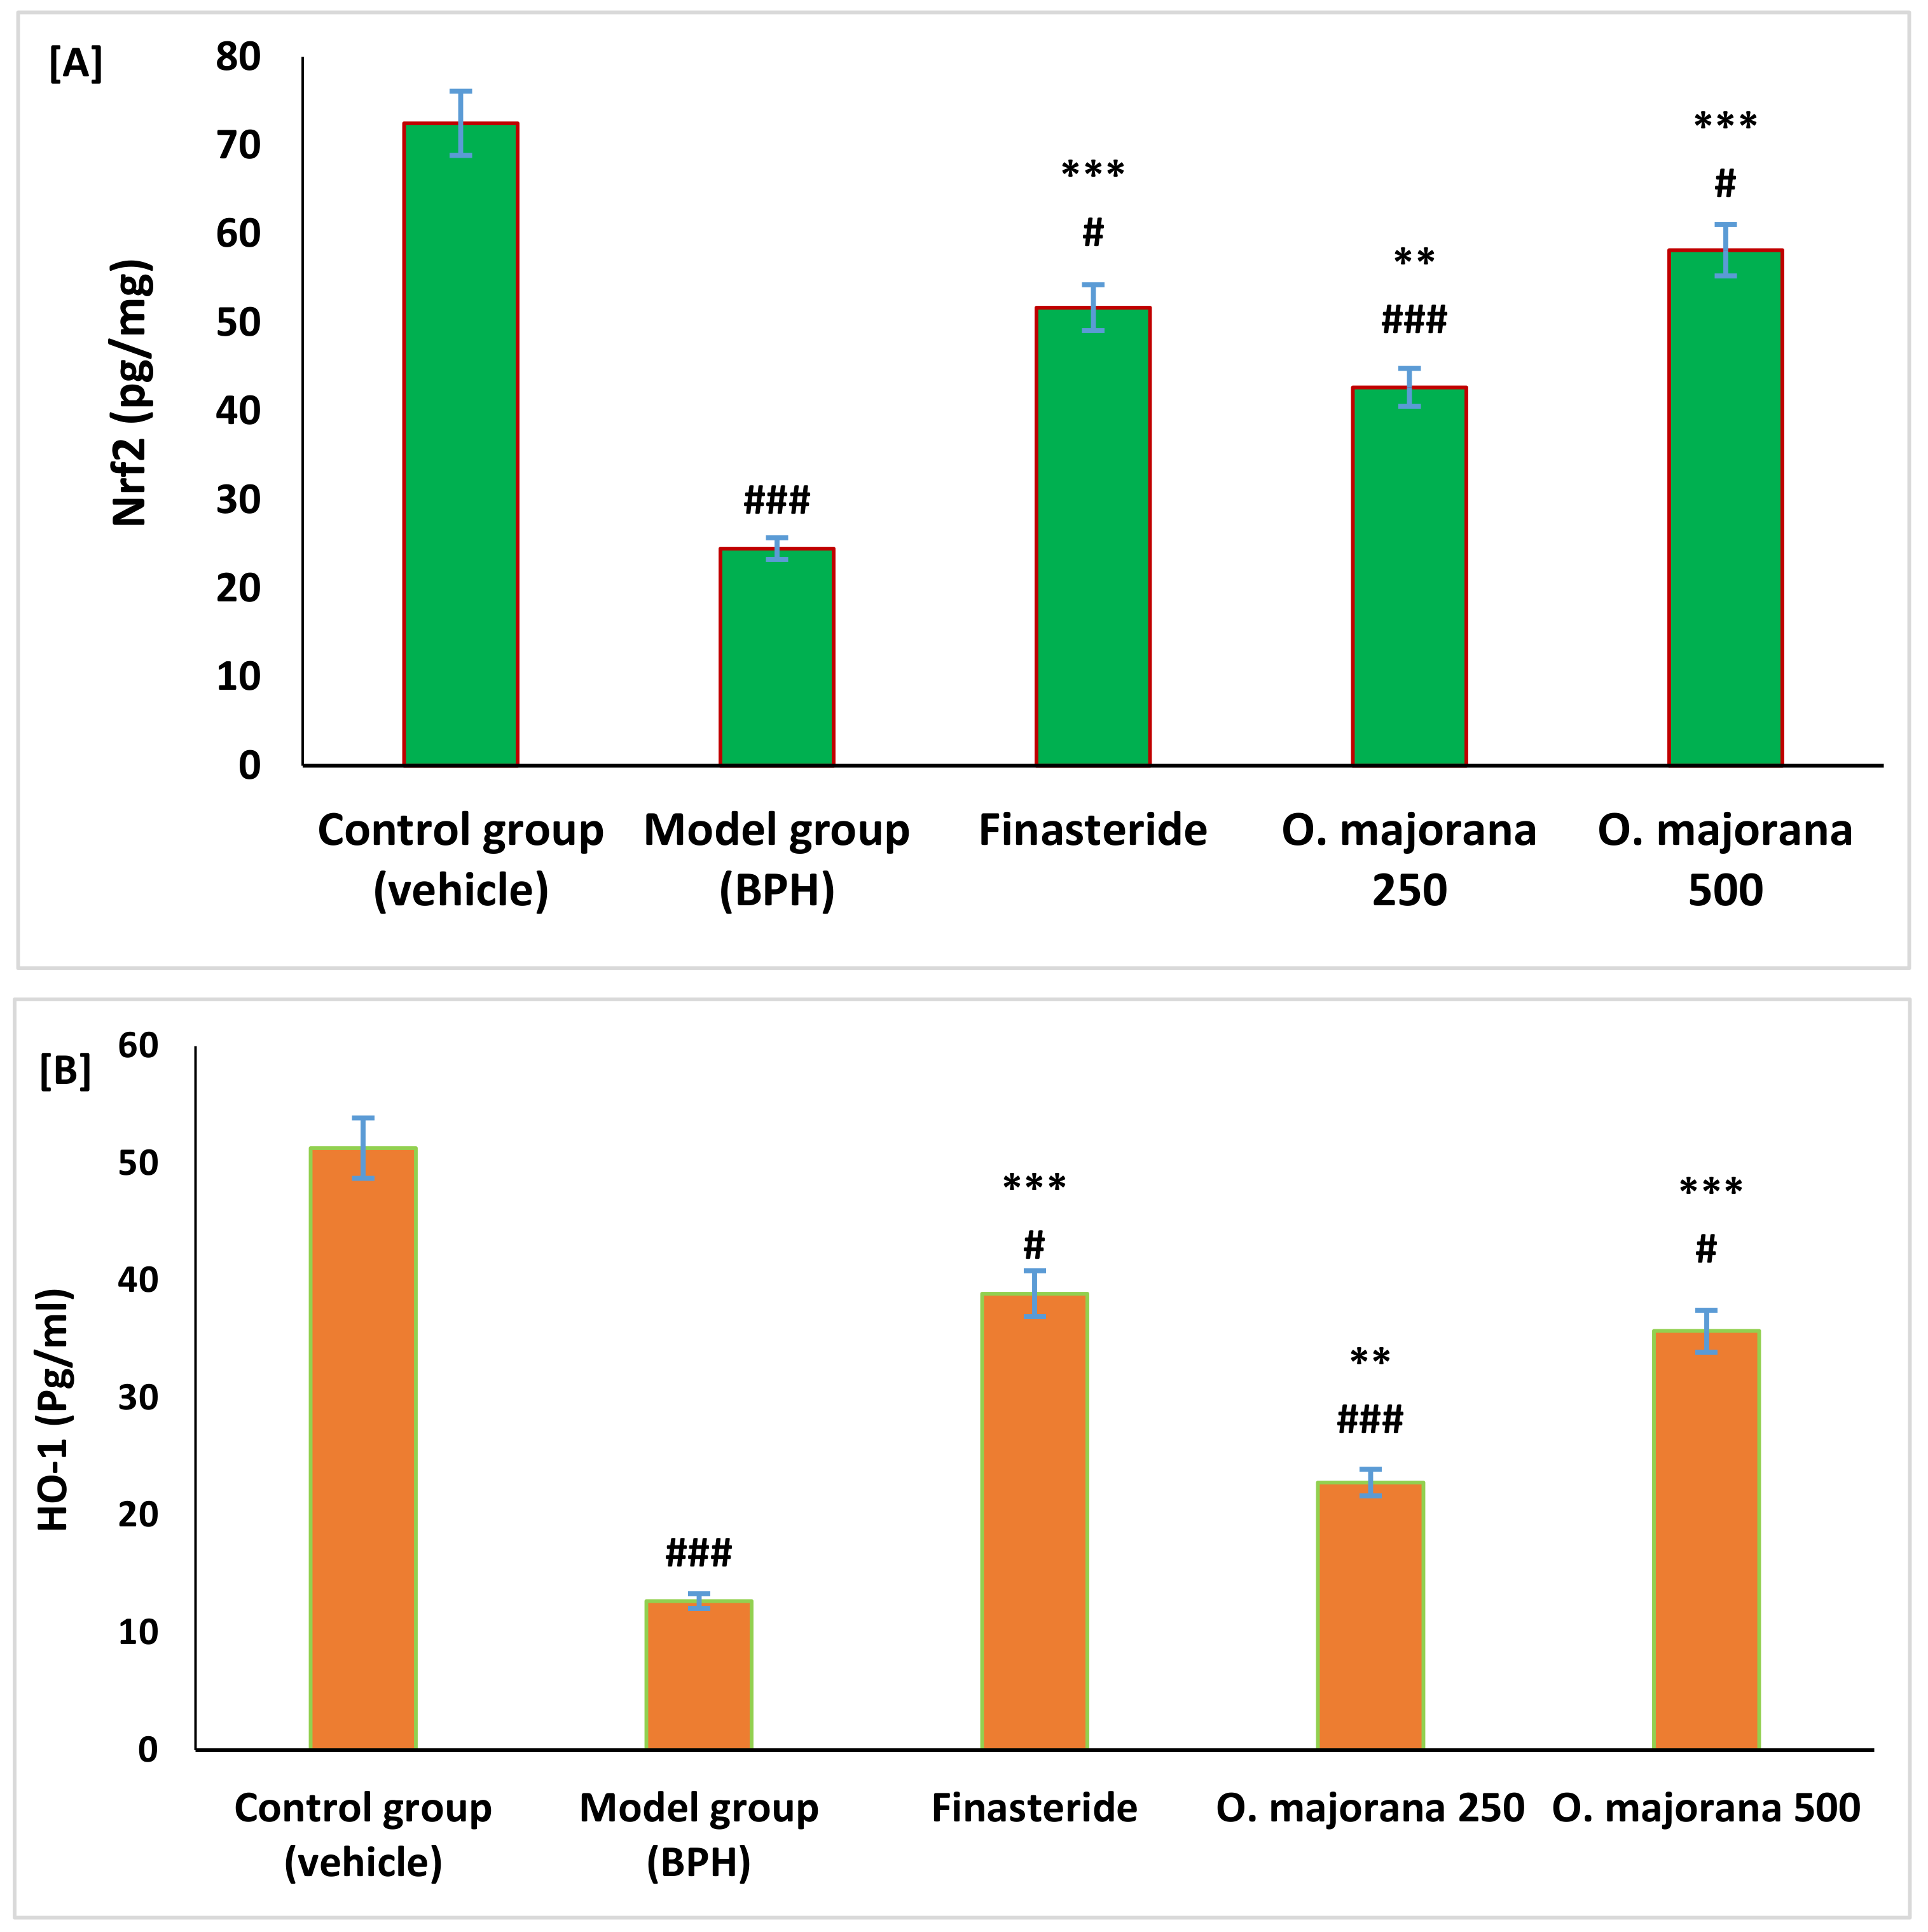
3.5. Effect of O. majorana on Nrf2 and HO-1 Levels in Prostate Tissue

Results showed that Nrf2 and HO-1 proteins were significantly reduced in rats with BPH compared to control rats (p < 0.01). However, BPH rats treated with O. majorana at doses of 250 and 500 mg/kg/day showed a significant increase in levels of protein of both Nrf2 and HO-1 antioxidant parameters compared to rats of both BPH and the finasteride groups as measured by ELISA immunoassay techniques (Figure 4A,B).

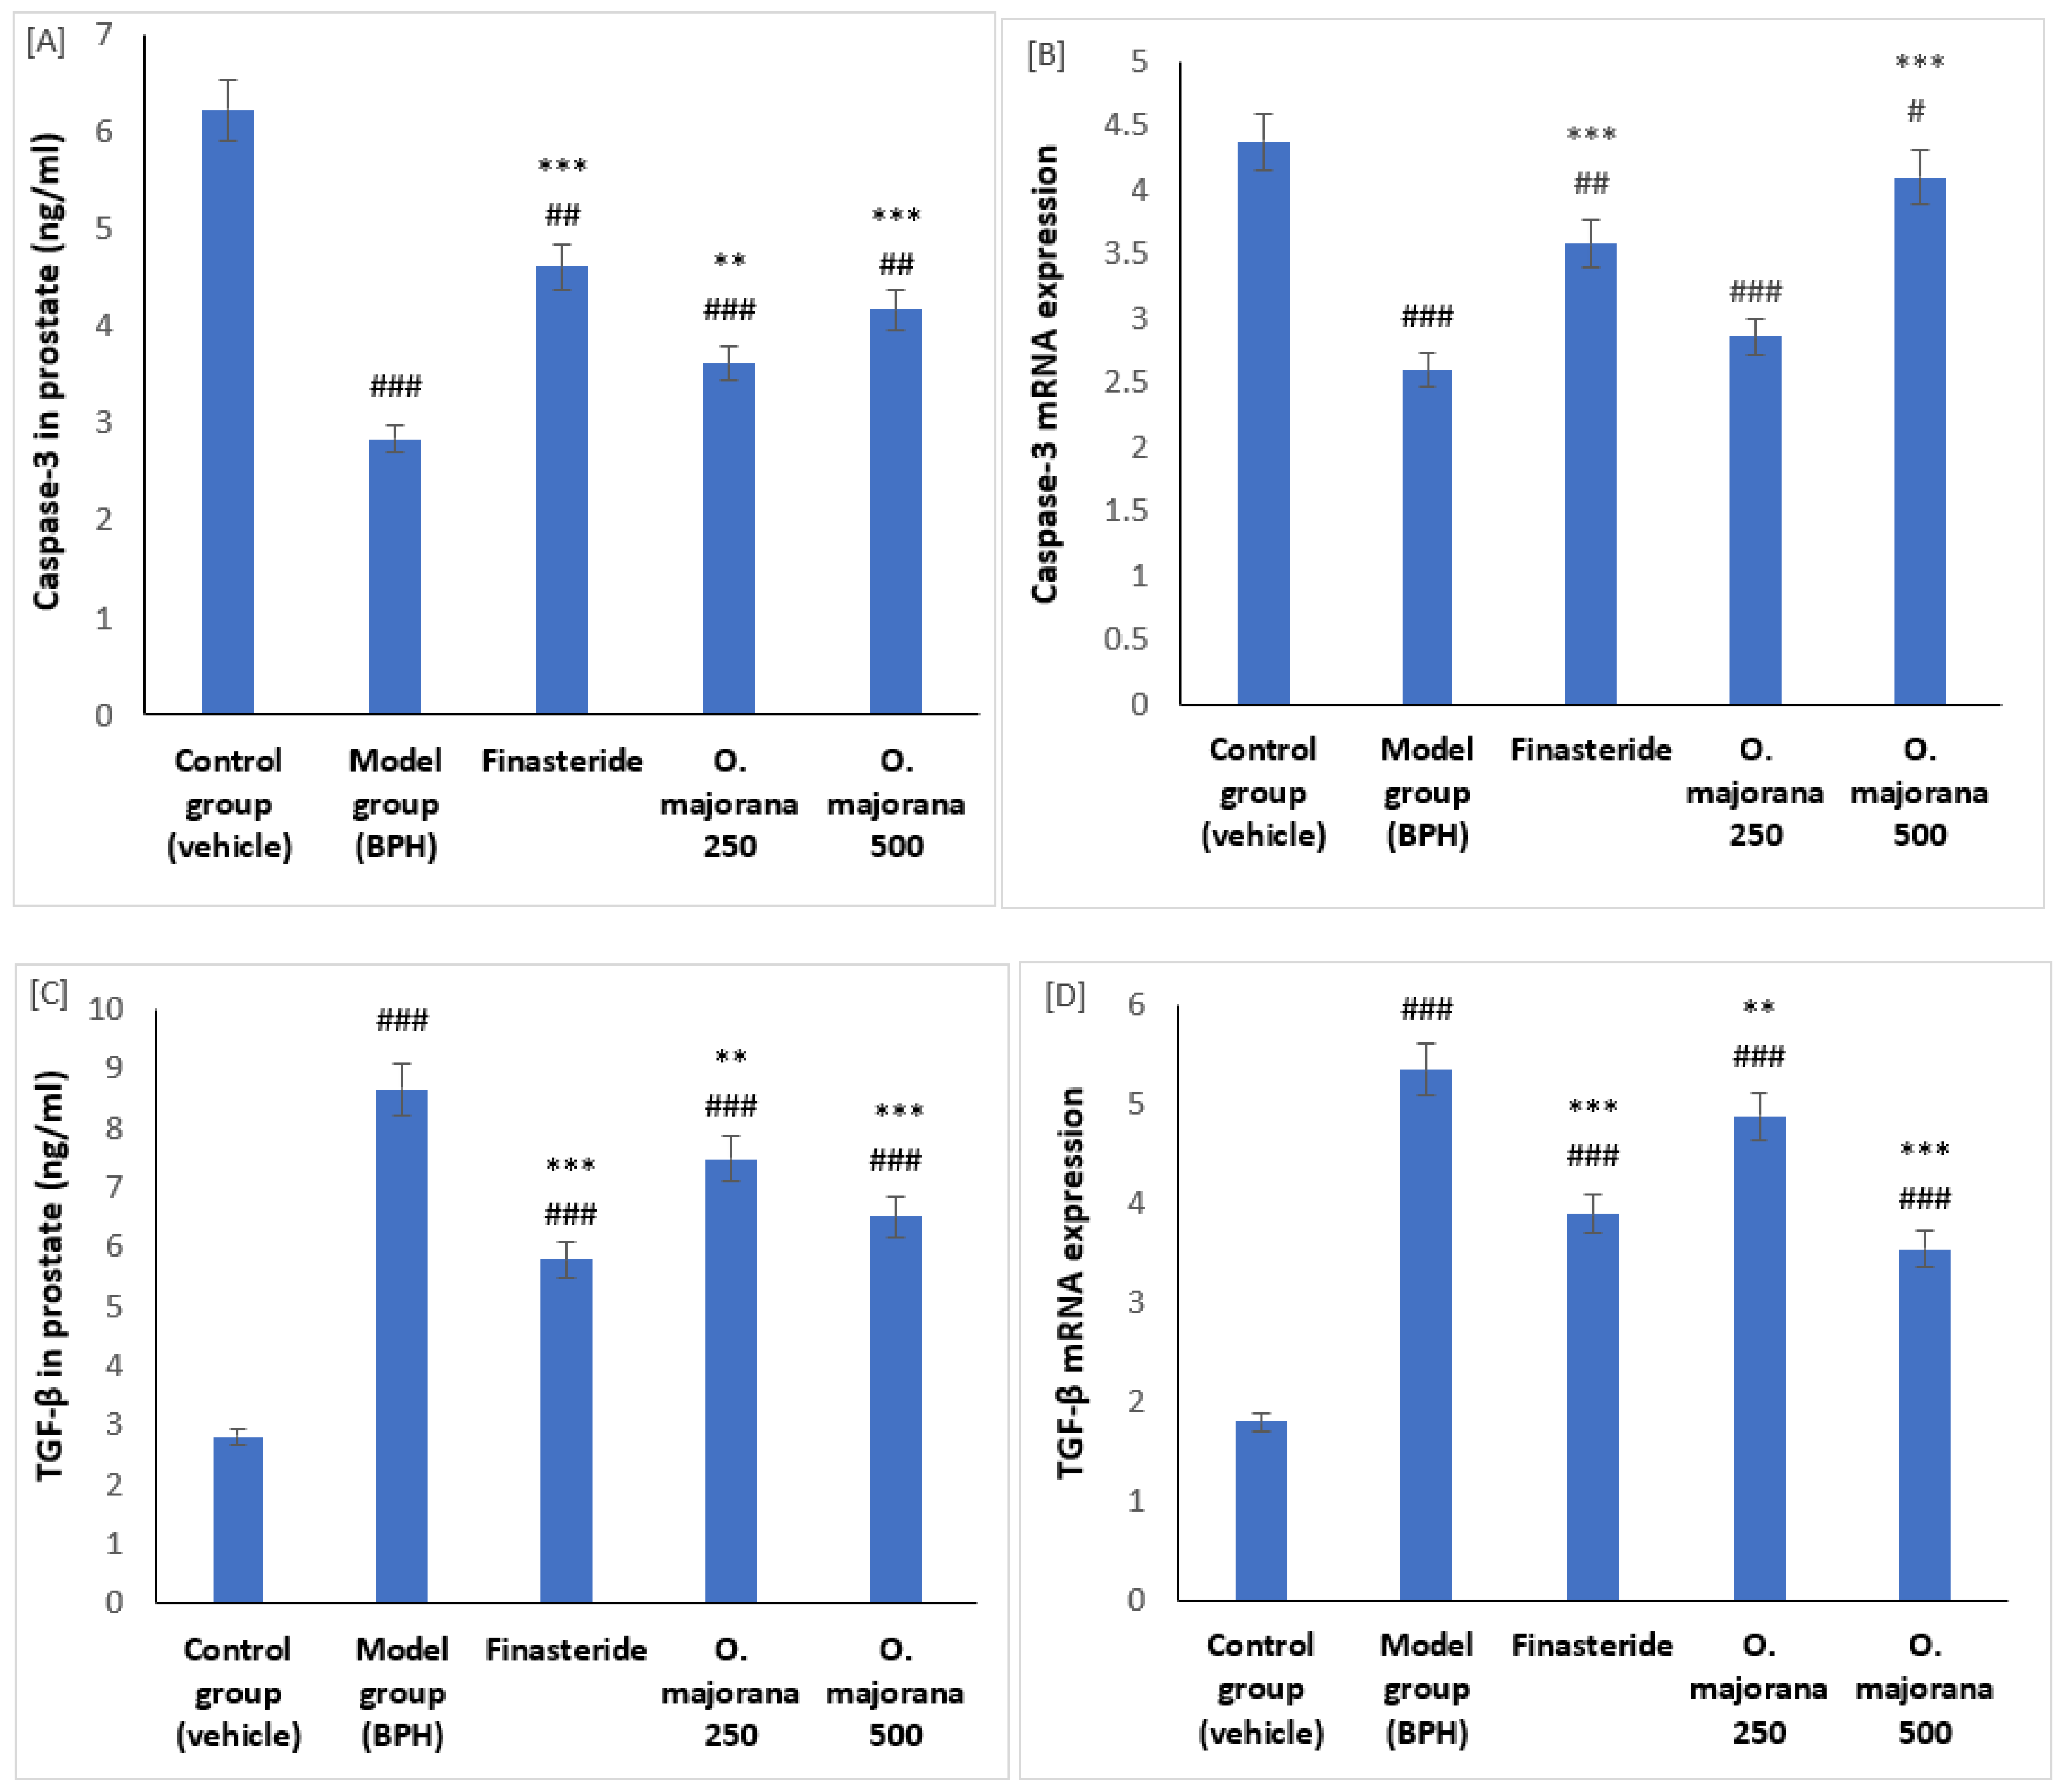
3.6. Effect of O. majorana on mRNAs and Proteins of Caspase-3 and TGF-β1 in Prostate Tissue

Results showed that both mRNA and protein levels of caspase-3 were significantly reduced in rats with BPH compared to control rats (p < 0.001). However, BPH rats treated with O. majorana at doses of 250 and 500 mg/kg/day showed a significant increase in levels of mRNA and protein of Caspase-3 compared to rats of both BPH and the finasteride groups as measured by quantitative PCR and ELISA immunoassay techniques (Figure 5A,B). In addition, mRNA and protein levels of TGF-β1 were identified in control, O. majorana BPH-treated, and non-treated rats. The BPH group showed a significant increase in the prostatic levels of TGF-β1 mRNA and protein compared to the control group (Figure 5C,D). When BPH rats were treated with O. majorana at doses of 250 and 500 mg/kg/day, a significant reduction in the quantitative expression of TGF-β1 mRNA and protein was identified compared to the BPH group (Figure 5C,D).

3.7. The Effect of O. majorana on Prostate Histological Structure

3.7.1. H&E Stain

The vehicle/control group revealed tight tubular prostatic glands with thin-walled acini containing pale eosinophilic secretions in ventral lobe regions (Figure 6A and Figure 7A). Lateral prostatic lobes acini were smaller than those of the ventral lobes with a more pronounced degree of folding alveoli and presented a light eosinophilic secretion (Figure 6B and Figure 7B). The acini in both lobes were surrounded by connective tissue stroma infiltrated with few inflammatory cells. The BPH/model group showed glandular hypertrophy with numerous acini, thick epithelial lining projecting into the acinar cavities as papillary fronds, nuclear stratification, and reduced size of the acinar lumen in both ventral (Figure 6C and Figure 7C) and lateral lobes acini (Figure 6D and Figure 7D). In the finasteride-treated group, ventral and lateral prostatic lobes showed reduced epithelial thickening and increased glandular luminal area (Figure 6E,F and Figure 7E,F) of most acini. The O. majorana 250 group showed non-remarkable histological difference compared to the BPH/model group, especially in lateral lobes with the presence of dilated blood vessels in the connective tissue stroma (Figure 6G,H and Figure 7G,H). However, the O. majorana 500 group revealed an evident increase in the acinar luminal area and reduction in the height of acinar epithelial lining with less polyp formation (Figure 6I,J and Figure 7I,J) in both ventral and lateral lobes.
Statistical analysis of acinar epithelial height (Figure 7K) showed significantly increased epithelial height in acini of ventral and lateral lobes in the BPH/model group relative to the control group. When compared to BPH (model group), the finasteride-treated group and O. majorana 500 group had significantly less acinar epithelial height in both ventral and lateral lobes (p < 0.001 and p < 0.05, respectively). The O. majorana 250 group showed an insignificant reduction in the acinar epithelial height relative to BPH/model group (p ≥ 0.05). The acinar luminal area of ventral and lateral lobes showed a significant reduction in BPH/model group (p < 0.001 and p < 0.05, respectively) relative to the control group (Figure 6K). When compared to the BPH/model group, the finasteride-treated group and O. majorana 500 group revealed significant widening of the acinar lumen in glands of both ventral and lateral lobes (p < 0.05), which was insignificant (p ≥ 0.05) with O. majorana 250 group.

3.7.2. Masson’s Trichrome Stain

Control group sections stained with Masson’s trichrome displayed normal CT stroma with few collagen fibers in the between acini of the ventral and lateral prostatic lobes (Figure 8A,B), whereas the collagen fiber content of CT stroma in the (BPH) group was significantly higher than (p < 0.001) the control group (Figure 8C,D,K). When compared to the (BPH) group, the finasteride and O. majorana 500-treated groups presented significantly (p < 0.001) less amounts of deposited collagen fibers between secretory acini (Figure 8I,J and Figure 8E,F,K). The O. majorana 250 group showed a non-significant increase in deposited stromal collagen fibers relative to the finasteride group (Figure 8G,H), which was significantly less than the (BPH) group (p < 0.001, Figure 8K).

3.8. α-SMA and TGF-B1 Expression in Prostate Lobes

3.8.1. α-SMA Immunostaining

Prostatic sections stained with anti-αSMA, a specific stromal myofibroblasts’ marker, exhibited positive expression in stromal cells around prostatic acini (Figure 9A,B). When compared to the control group, the (BPH) group expressed significantly higher α-SMA levels (p < 0.001, Figure 9K) around the acini of both ventral and lateral prostatic lobes (Figure 9C,D). Finasteride and O. majorana 500 groups showed a marked reduction in the α-SMA-positive brown stain observed in smooth muscles encircling the acini (Figure 9E,F,I,J) when compared with the BPH group. Similarly, the O. majorana 250 group (Figure 9G,H) showed a significant reduction in the α-SMA-positive brown stain when compared with the BPH group (p < 0.001; Figure 9K).

3.8.2. TGF-B1 Immunostaining

Immunostained prostatic sections with anti-TGF-B1 showed negative staining of the epithelial cells with mild staining of the interstitial tissue in the control group (Figure 10 A,B). Interstitial tissue and epithelial cells in the (BPH) group’s ventral and lateral prostatic lobes strongly expressed positive brown staining (Figure 10C,D), which was significant relative to the control group (p < 0.001, Figure 10K). Finasteride and O. majorana 500 groups’ sections (Figure 10E,F,I,J) showed a sporadic positive brown staining in acinar epithelial cells with mild positive brown staining of the interstitial tissue, which was significant (p < 0.001, Figure 10K) relative to the BPH group. Sections from the O. majorana 250 group displayed a moderately positive expression of anti-TGF-B1 in the interstitial tissue (Figure 10G,H), which was significantly less relative to the BPH group (p < 0.001, Figure 10K).

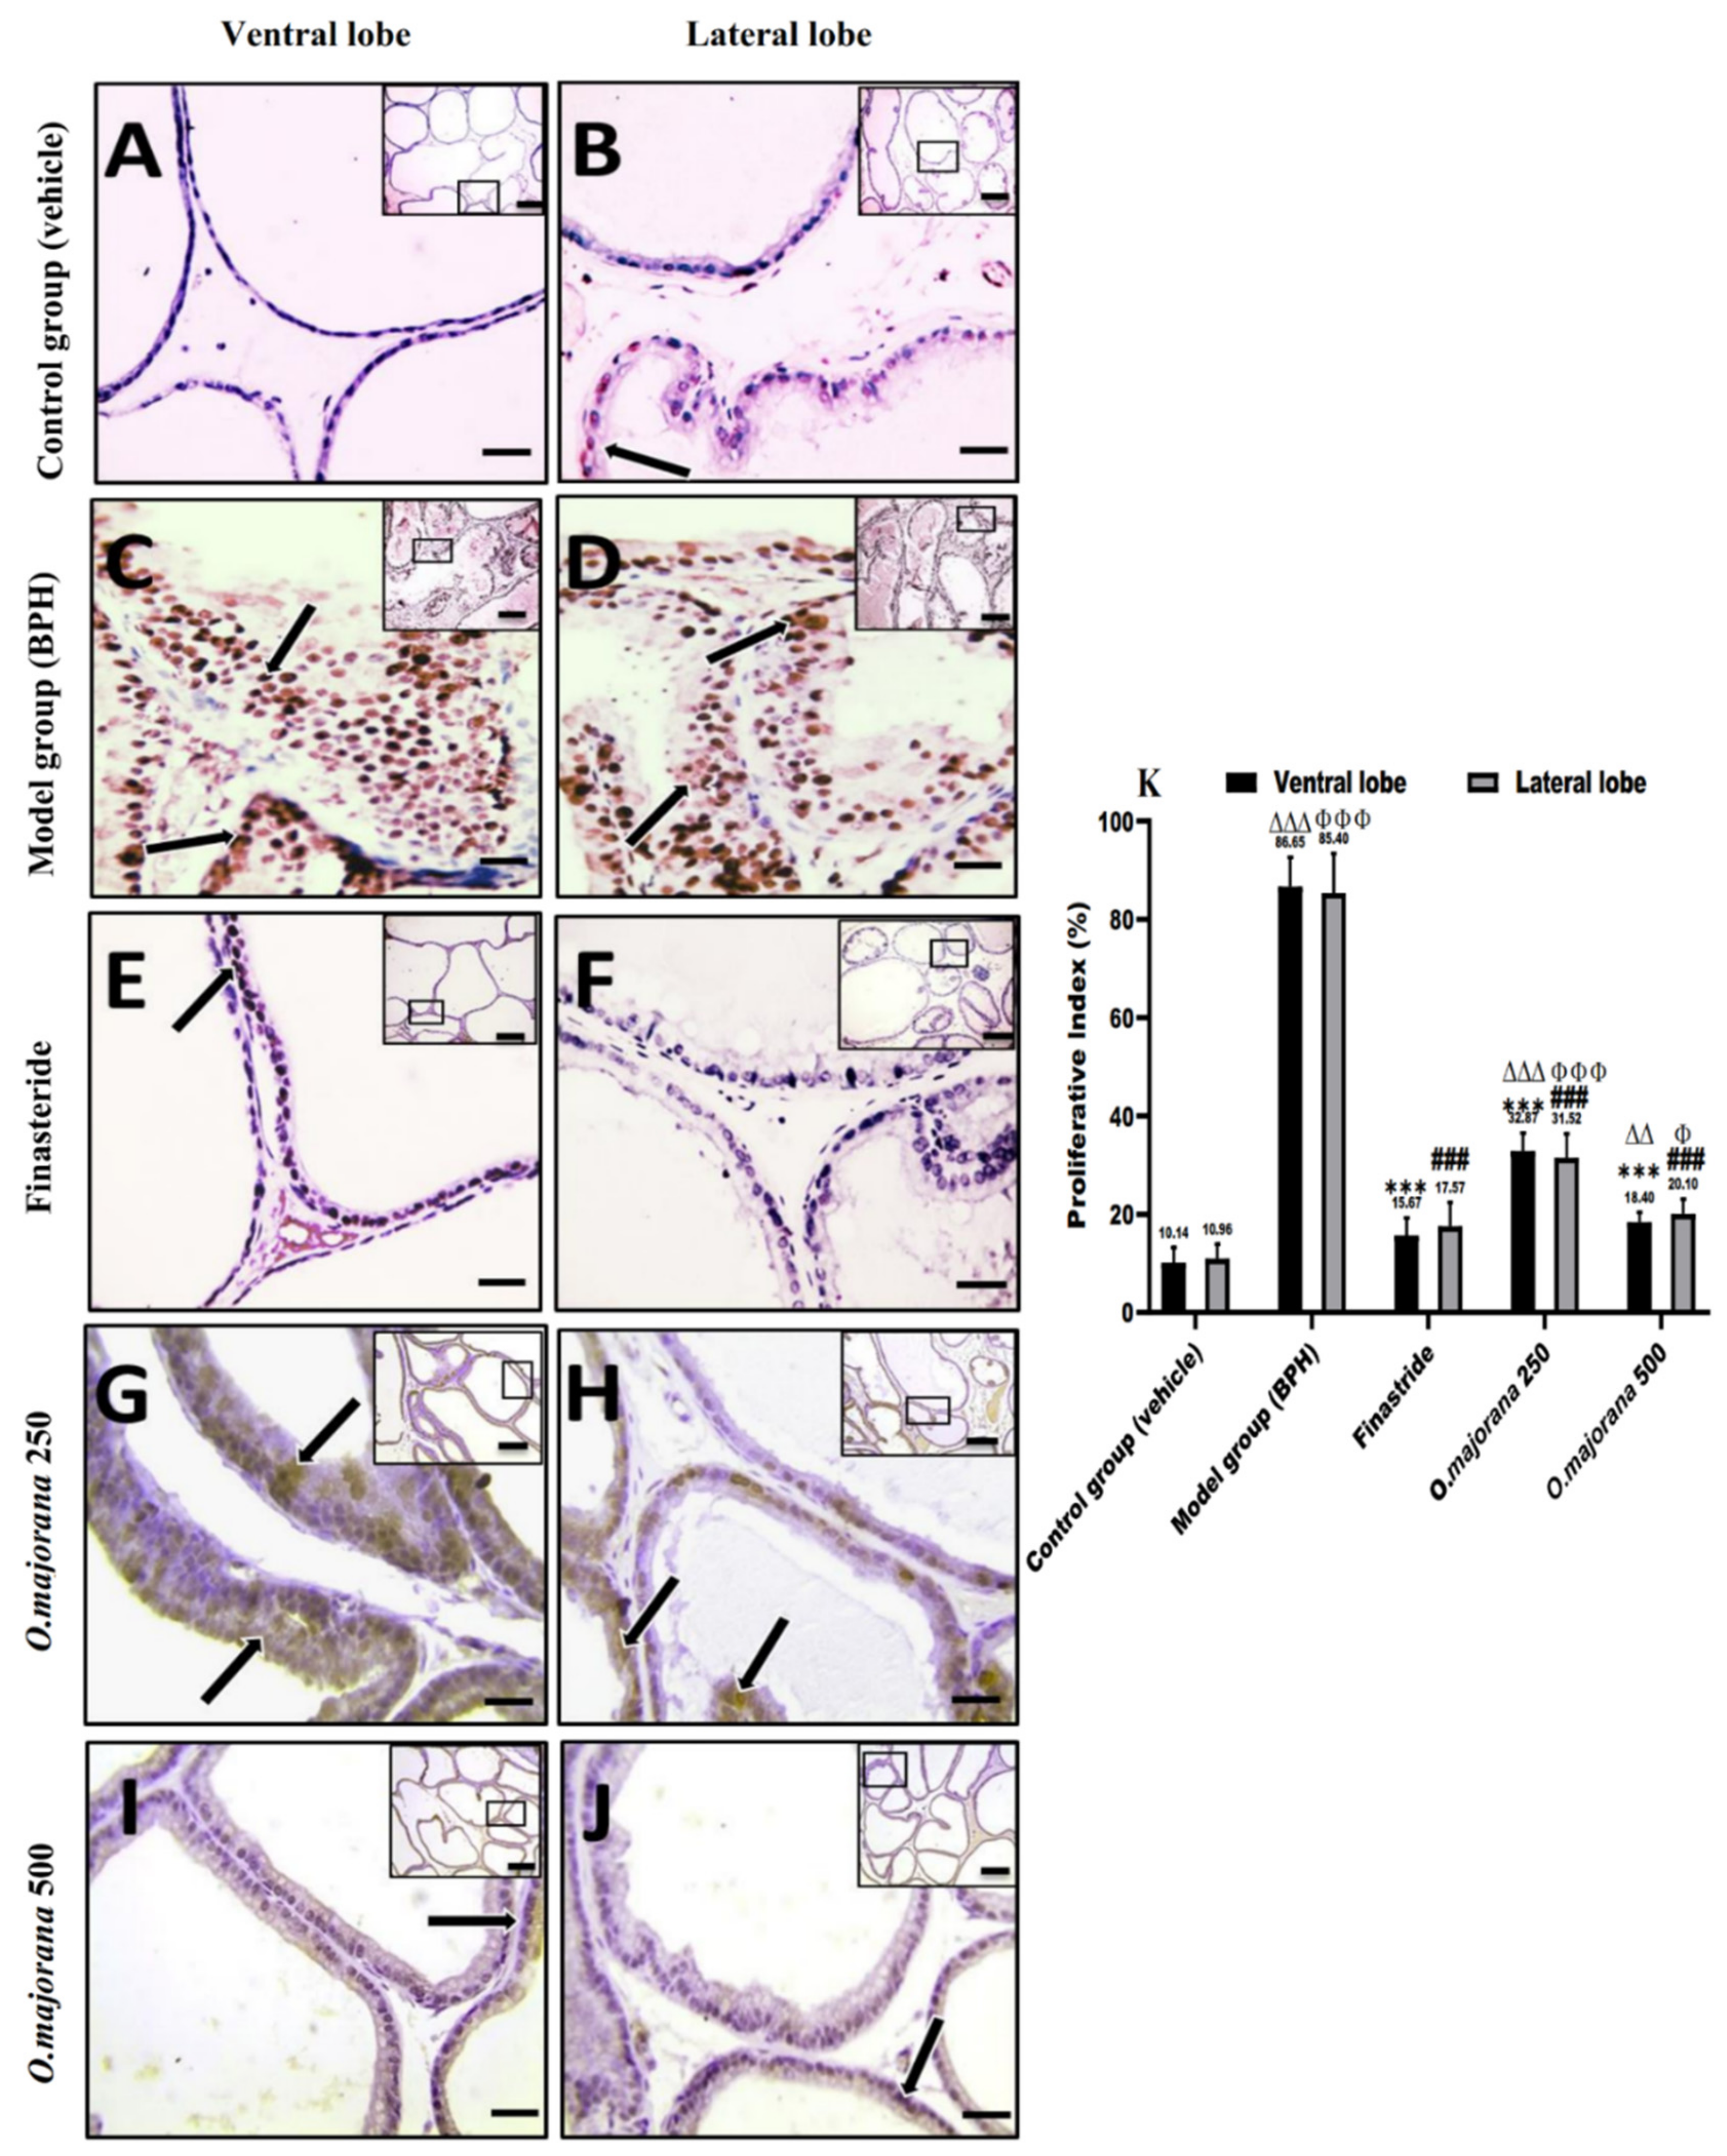
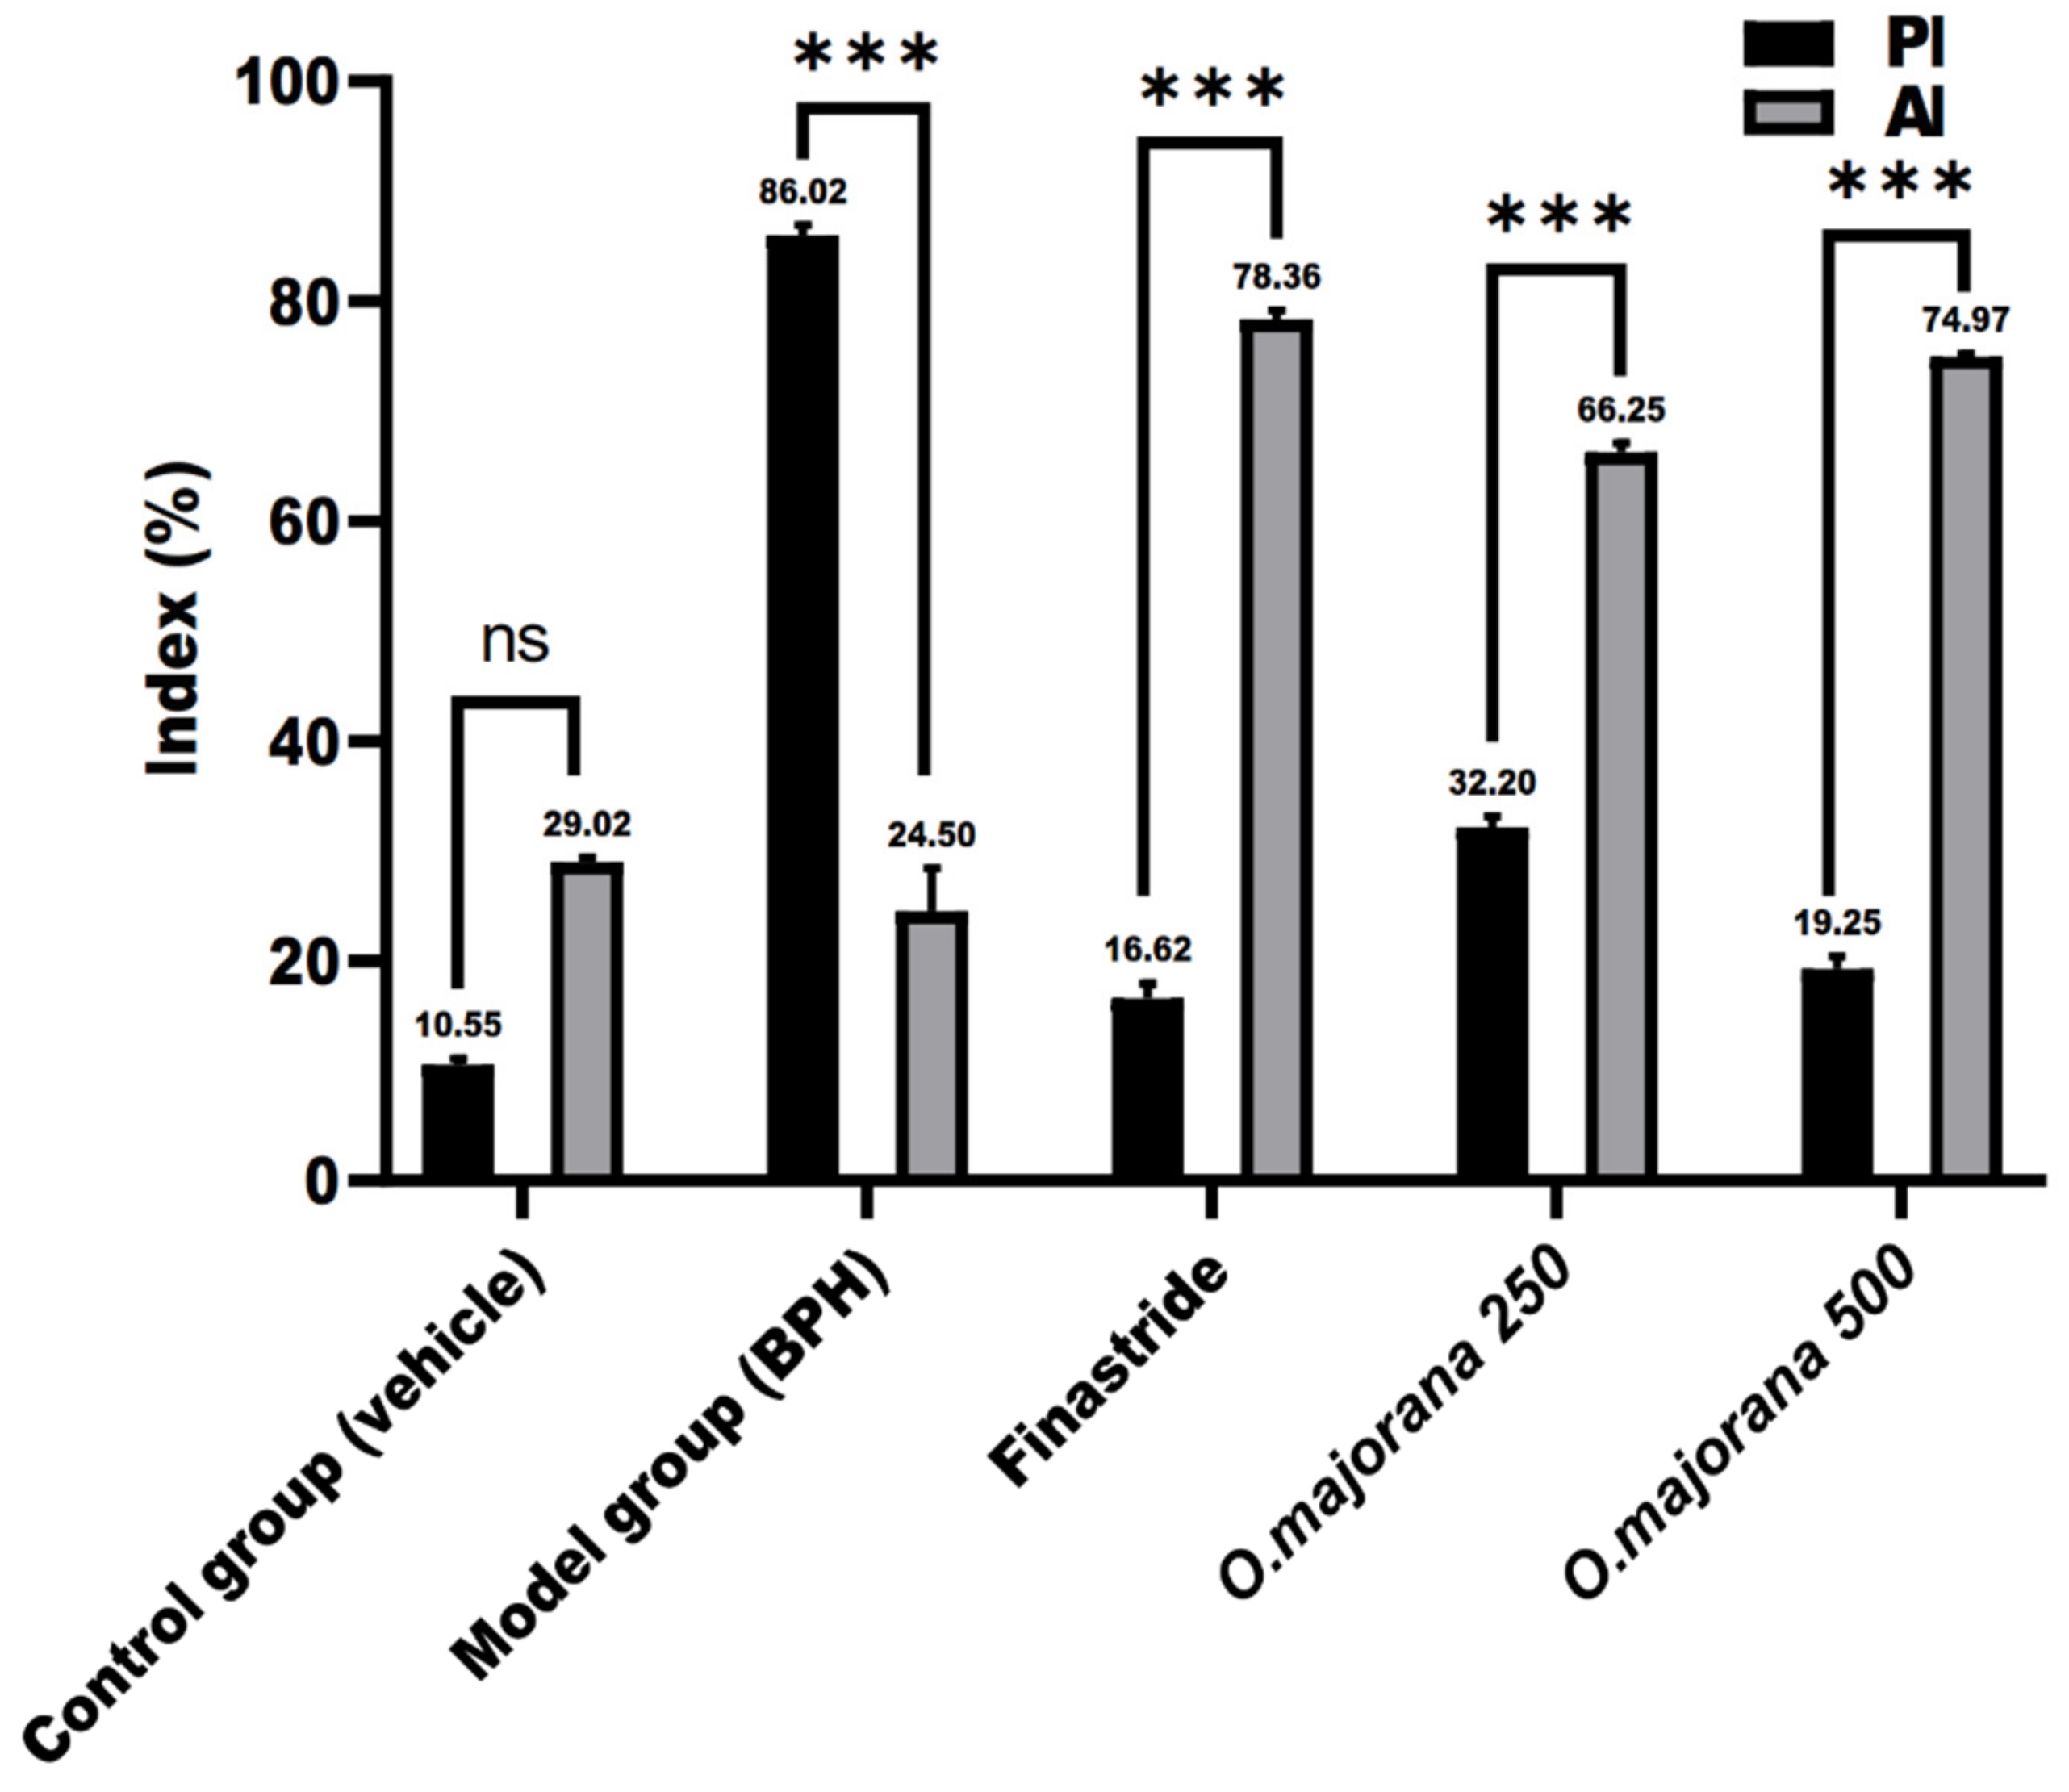
3.9. Apoptotic and Proliferative Indices

In normal and hyperplastic prostatic sections, proliferating cells (PCNA immunohistochemical identification) and apoptotic cells (caspase-3 immunohistochemical identification) were observed, with only a few stromal cells staining (Figure 11 and Figure 12).
Epithelial cells in the control group sections showed negative to mild nuclear staining, especially in the lateral lobe, and the mean proliferative index (PI) was 10.14 ± 3.04 and 10.96 ± 2.92 for ventral and lateral lobes, respectively (Figure 11A,B,K). Photomicrographs of the (BPH) group showed a strong positive brown expression in the epithelial cells’ nuclei of both ventral and lateral prostatic lobes (Figure 11C,D), which was significant (p < 0.001; Figure 11K) when compared to controls. The mild positive brown expression of PCNA in epithelial cells nuclei of finasteride and O. majorana 500 groups’ sections (Figure 11E,F,I,J) was significantly less relative to the BPH group (p < 0.001, Figure 11K). When compared to the BPH group, O. majorana 250 group sections (Figure 11G,H) displayed a significantly less positive nuclear expression of PCNA (p < 0.001, Figure 11K).
The control group exhibited moderate epithelial expression of caspase-3 in the ventral and lateral lobes, with mean apoptotic index (AI) values of 29.29 ± 3.32 and 28.75 ± 3.23, respectively (Figure 12A,B,K). Microscopic pictures of the (BPH) group (Figure 12C,D) showed sporadic positive brown cytoplasmic staining in epithelial cells compared with controls in both ventral and lateral prostatic lobes, which was significant (p < 0.01 and p < 0.001, respectively, Figure 12K). The positive brown cytoplasmic staining markedly increased in epithelial cells in the finasteride group and O. majorana 500 groups (Figure 12E,F,I,J, respectively) which was significant (p < 0.001; Figure 12K) relative to the BPH group. Positive brown cytoplasmic staining appears moderate in the O. majorana 250 group (Figure 12G,H), which was significant (p < 0.001, Figure 12K) when compared with the BPH group.
Considering the absence of significant variation between ventral and lateral prostatic lobes among the experiment groups, the proliferative index (PI) and the apoptotic index (AI) of prostatic sections of each experimental group were compared to other groups without lobe discrimination, as shown in Figure 13. The normal control group’s PI and AI (10.55 ± 0.57 and 29.02 ± 0.38, respectively) were insignificant (p = 0.15) with a mean difference (−18.47 ± 0.49). The BPH group had a significantly (p < 0.001) higher PI than AI (86.02 ± 0.88 and 24.50 ± 3.93, respectively), with a mean difference (61.52 ± 2.85). The mean difference between PI and AI in finasteride, O. majorana 250, and O. majorana 500 groups was (−61.74 ± 1.11, −34.05 ± 0.91, and −55.72 ± 0.87, respectively), which was significant (p < 0.001).

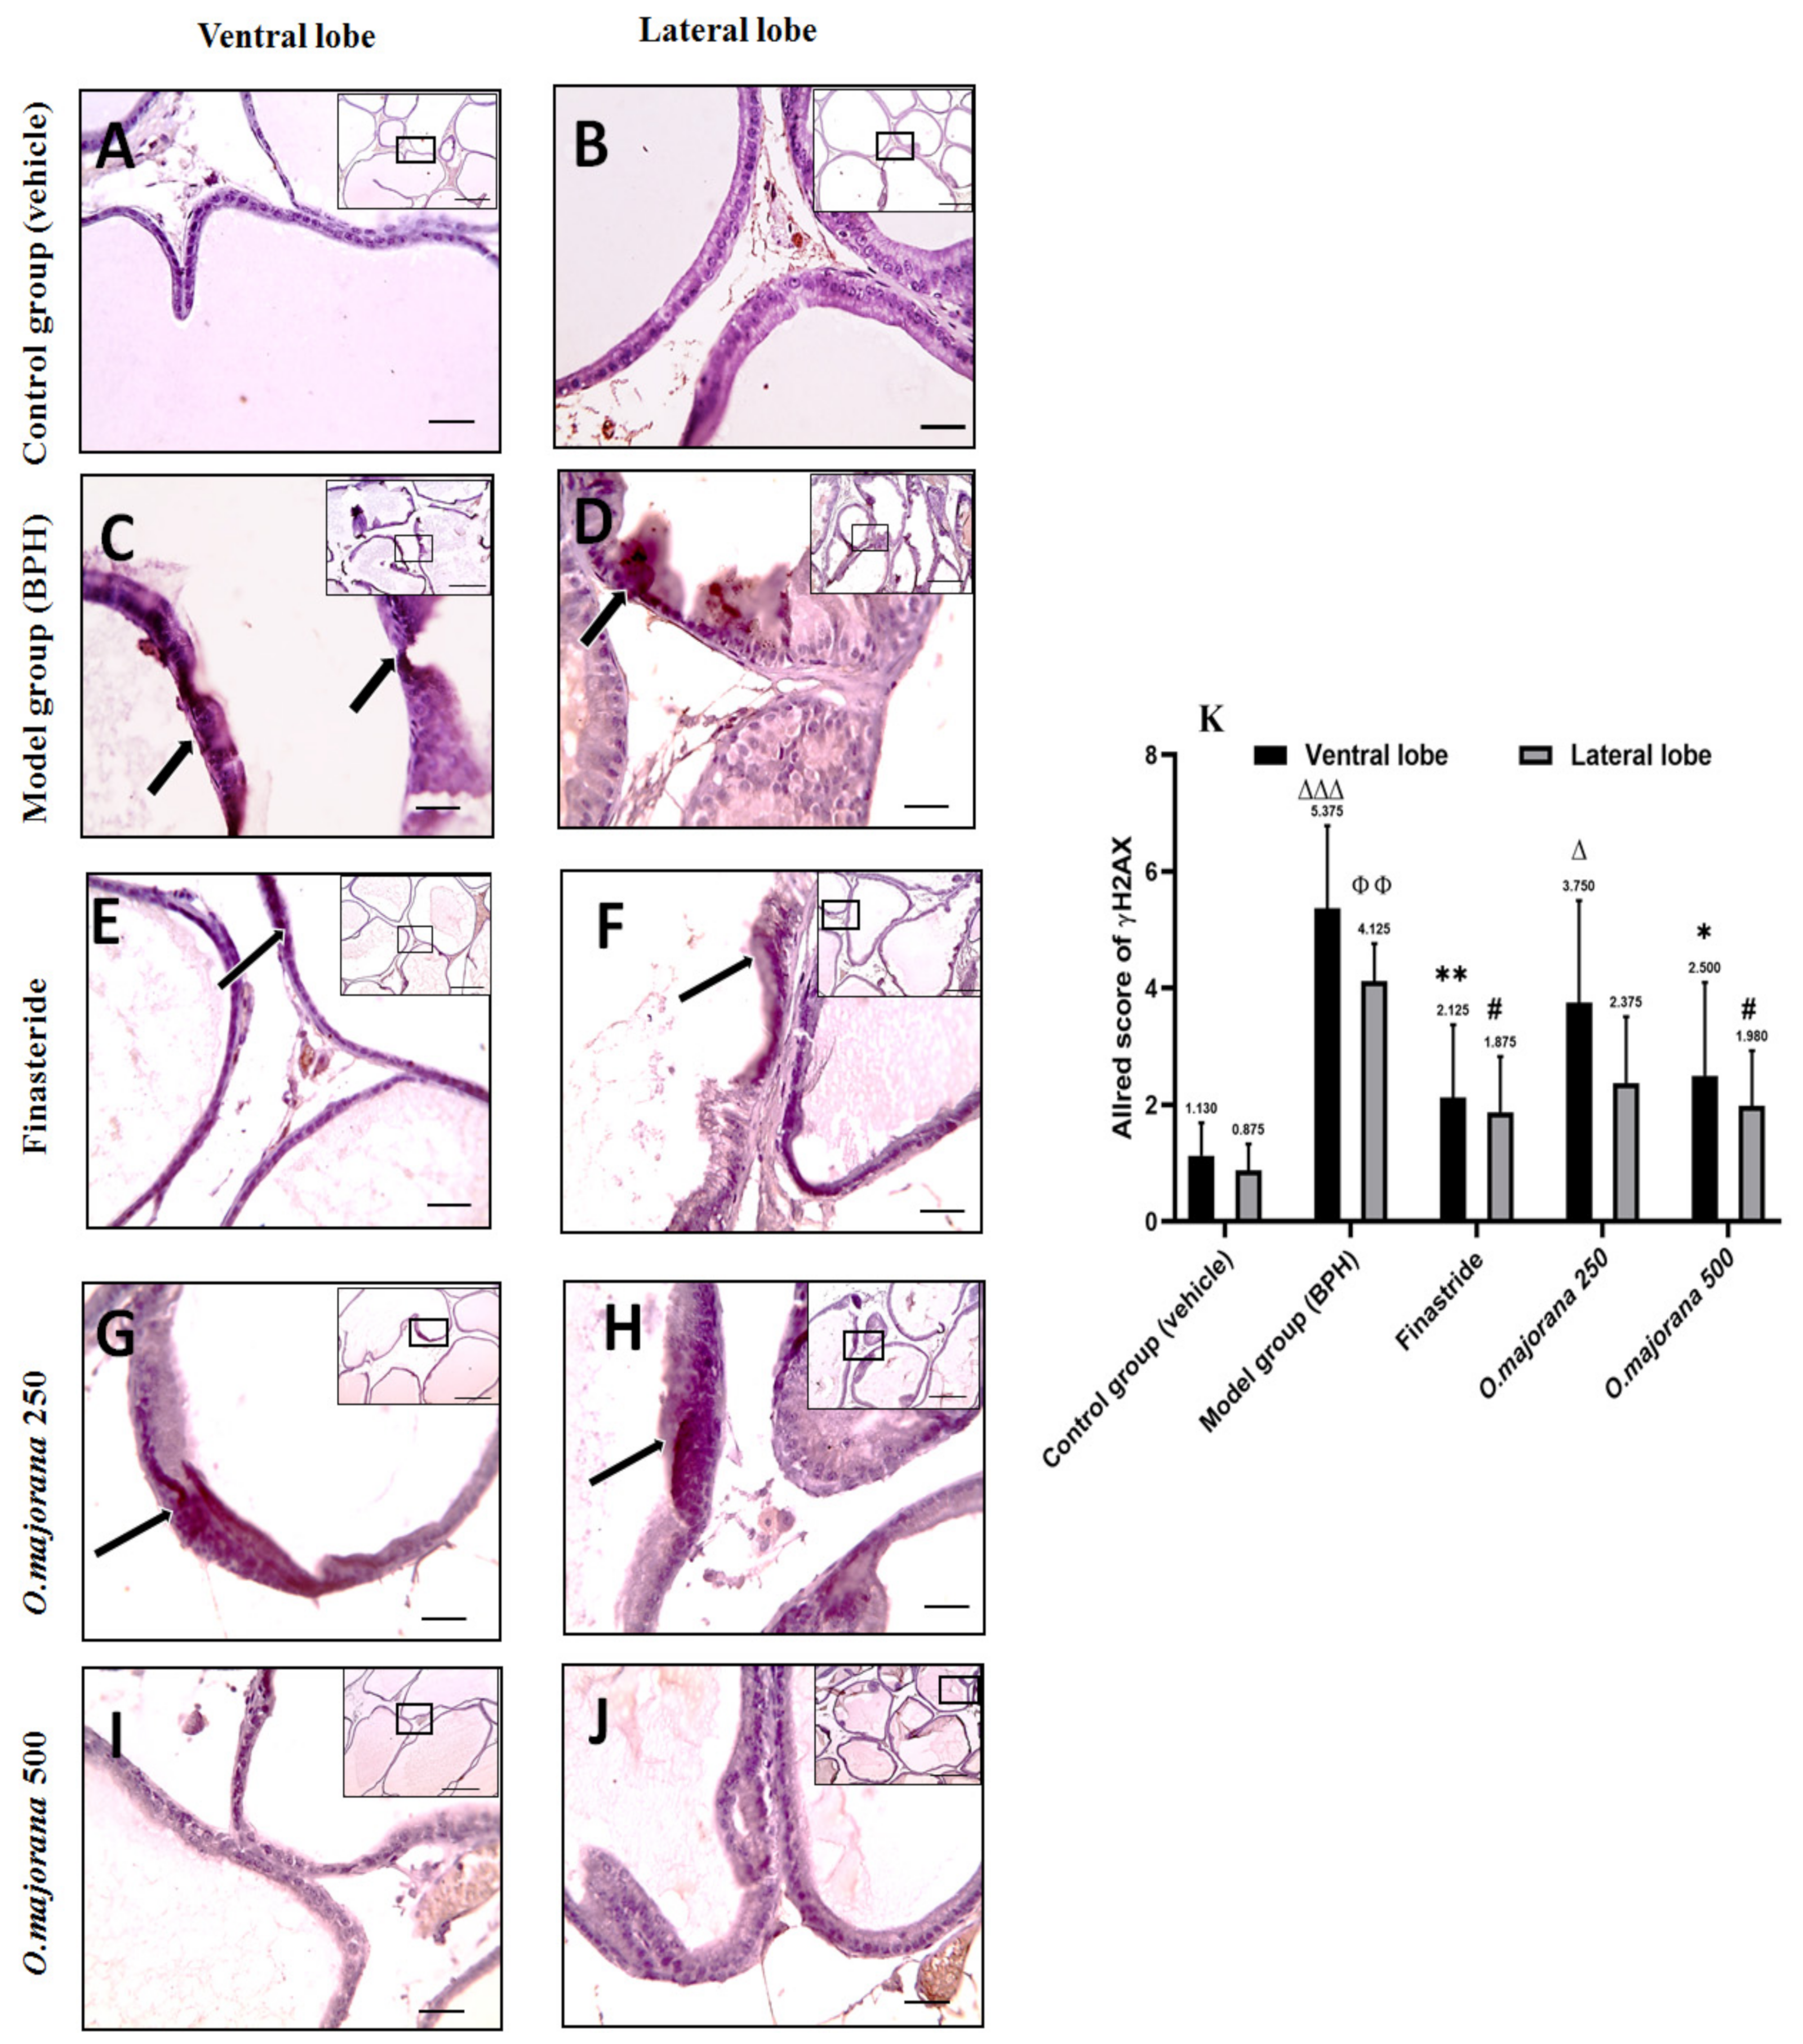
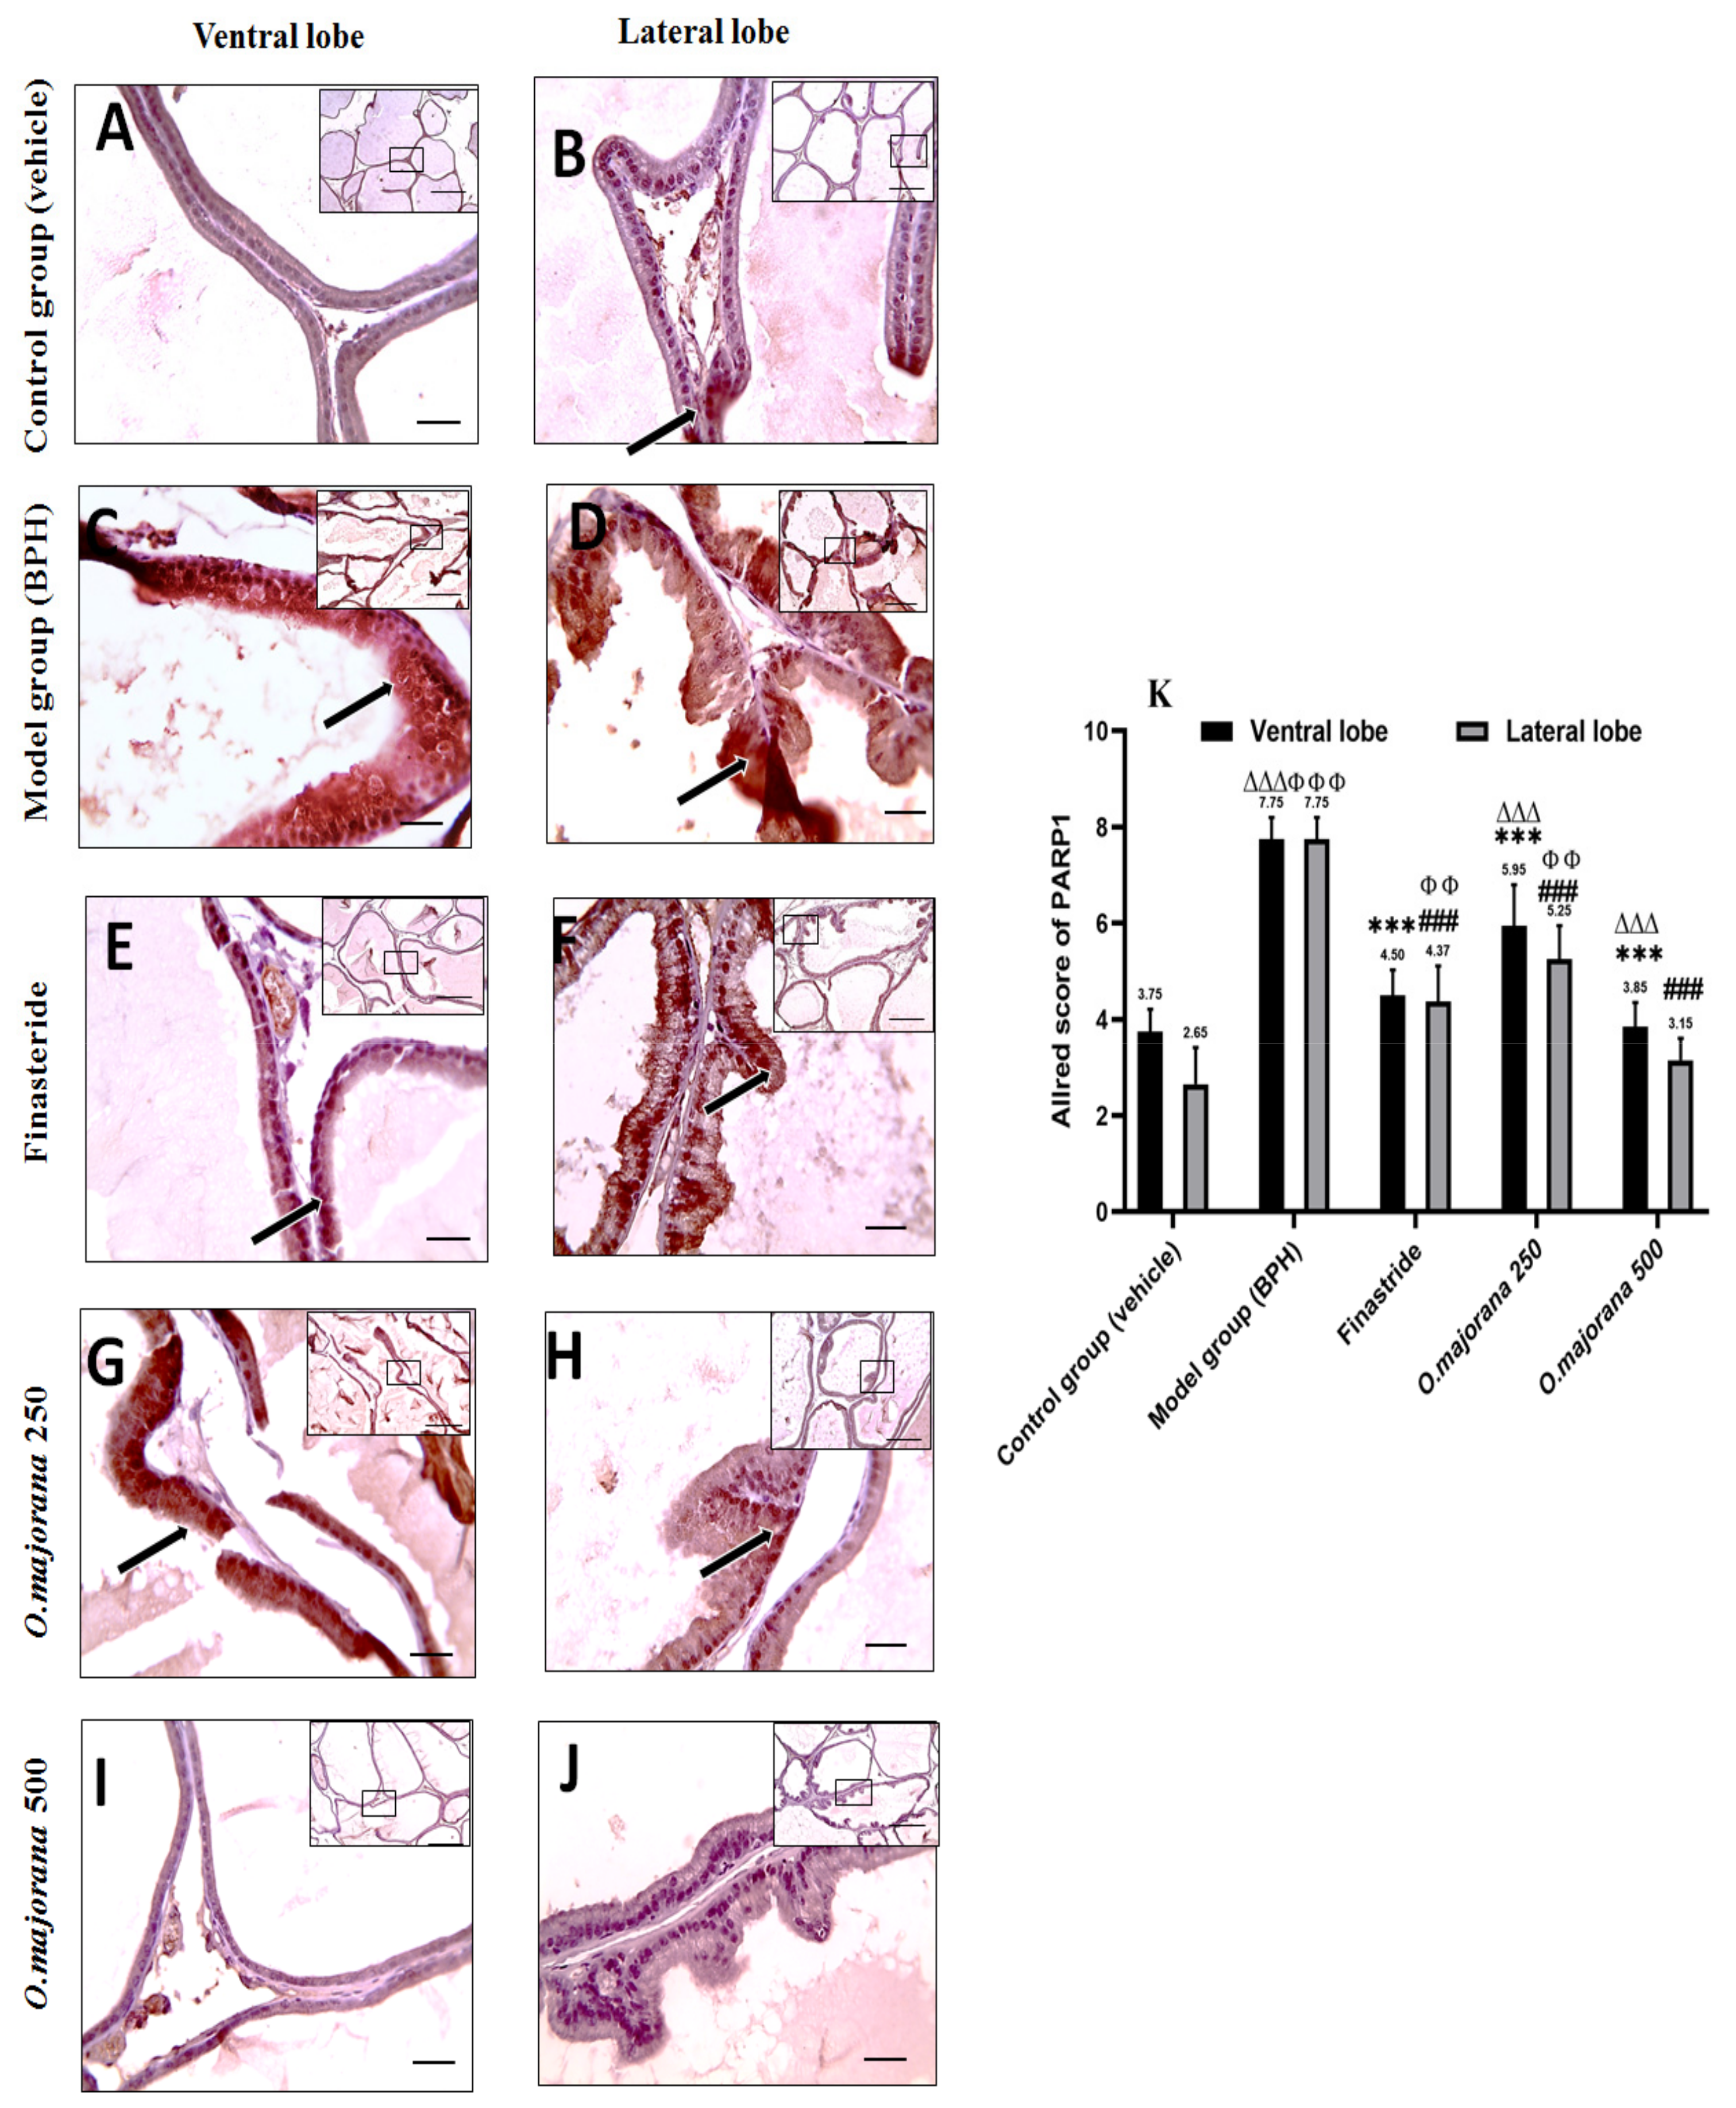
3.10. γ H2Ax and PARP1 Expression in Prostate Lobes

3.10.1. γ H2Ax Expression in Prostate Lobes

Epithelial cells in the control group sections showed negative staining, especially in the lateral lobe, and the Allred score was (1.13 ± 0.56, 0.88 ± 0.45) for ventral and lateral lobes, respectively (Figure 14A,B,K). Photomicrographs of the (BPH) group showed multifocal areas of positive brown cytoplasmic staining in epithelial cells in both ventral and lateral prostatic lobes (Figure 14C,D), with an Allred score (5.38 ± 1.41, 4.13 ± 0.64) that was significant (p < 0.001 and p < 0.01; Figure 14K) respectively when compared to controls. The mild positive brown cytoplasmic expression of γH2Ax in epithelial cells of finasteride and O. majorana 500 groups’ sections (Figure 14E,F,I,J) was significantly less relative to the BPH group (Figure 14K). When compared to the BPH group, O. majorana 250 group sections (Figure 14G,H) displayed moderate positive brown cytoplasmic staining in epithelial cells, especially in the ventral lobe with an Allred score (2.50 ± 1.60) (Figure 14K).

3.10.2. PARP1 Expression in Prostate Lobes

Epithelial cells in the control group sections showed mild positive staining, especially in the lateral lobe, and the Allred score was (3.75 ± 0.46, 2.65 ± 0.76) for ventral and lateral lobes, respectively (Figure 15A,B,K). Photomicrographs of the (BPH) group showed diffuse strong positive brown cytoplasmic staining in epithelial cells in both ventral and lateral prostatic lobes (Figure 15C,D), with an Allred score (7.75 ± 0.45) in both lobes that was significant (p < 0.001; Figure 15K) when compared to controls. The mild positive brown cytoplasmic expression of PARP1 in epithelial cells of O. majorana 500 groups’ sections (Figure 15I,J) was significantly less in both lobes relative to the BPH group (p < 0.001; Figure 15K). When compared to the BPH group, O. majorana 250 group sections (Figure 15G,H) displayed moderate positive brown cytoplasmic staining in epithelial cells, especially in the ventral lobe with an Allred score (5.95 ± 0.85) (Figure 15K).

4. Discussion

BPH is a progressive illness accompanied by benign prostate enlargement (BPE) and lower urinary obstruction symptoms [58]. Therapeutic approaches for BPH include surgical and medicinal; however, medicinal therapy showed incomplete effective cure for BPH [59] in addition to their adverse effects [60], and the surgical approach is frequently associated with multiple complications, particularly in older men [61]. In this study, we are shedding light on the antiproliferative, apoptotic, and antioxidative properties of O. majorana against BPH for the first time using TP-induced BPH rats after castration to mask the effect of endogenous hormones and evaluate its impact on the prostate through histological, immunohistochemical, and biochemical approaches. The results of the current study are summarized in Figure 16.
BPH was distinguished by histological examination as hyperplasia and desquamation of the acinar epithelial cell lining, inflammatory cell infiltration, and papillary projections, as well as elevated prostate weight and prostate index, which are consistent with previous findings [62]. Our findings supported our working hypothesis, demonstrating that O. majorana extract alleviated testosterone-induced BPH rats by lowering prostatic index, reducing serum DHT levels, reducing prostatic MDA content and DNA damage, elevating prostatic SOD content, mitigating the histopathological changes of BPH, increasing the apoptotic index while lowering the proliferative index, and reducing stromal markers, α-SMA, and TGF-B1 expression. The O. majorana 500-treated group outperformed the O. majorana 250-treated group. Furthermore, the findings reported in the O. majorana 500-treated groups were close to those gained with finasteride treatment.
The correlation between oxidative stress and BPH was previously reported with a significant reduction in serum and prostate antioxidant levels in BPH rats [5,33,58]. Previous studies reported the antioxidant activity of O. majorana against renal and hepatic injuries [36,37,63] and attributed this property to the effect of its secondary metabolites, particularly flavonoids, in preventing oxidative cell damage through their water-soluble effects [64], in addition to its inhibiting effect on the DPPH (2, 2-diphenyl-1-picrylhydrazyl) [38]. These reports are consistent with our data considering reduced prostatic MDA content and elevated prostatic SOD content with O. majorana. Increased oxidative stress is associated with marked DNA damage in BPH patients. Management of oxidative stress and DNA repair is suggested to be a useful strategy in disease therapy and prevention [65]. In the present study, increased immunostaining of γ-H2AX and PARP, as well as significant increase in tissue 8-OH-dG in the BPH group, reflected DNA damage. However, this situation was ameliorated by O. majorana treatment.
The Nrf2/HO-1 pathway has been widely studied with regard to its role in combating inflammation and fibrosis [66]. In BPH, Nrf2 and its target genes have been found to be deficient and insufficient for antioxidant response [67]. Nrf2 regulates the expression of key protective elements in BPH [68]. On the other hand, activation of Nrf2 blocks TGF-β signaling and suppresses inflammation, thereby restraining prostatic epithelial-mesenchymal transition in BPH [69]. Consistently, in this study, the antioxidative potency of O. majorana is associated with increased levels of Nrf2 and HO-1 in BPH rats treated with O. majorana at doses of 250 and 500 mg.
In addition, our data reported that O. majorana at respective doses of 250 and 500 mg/kg/day significantly reduced the cellular DNA damage and increased both catalase enzyme (CAT) and total antioxidant activity (TAC) in BPH rats, suggesting the antioxidant effect of O. majorana against cellular severity of BPH. The production of ROS cellular free radicals causes DNA base modifications such as a hydroxyl radical that can attack DNA to form 8-hydroxyguanine (8-OH-dG) [70,71,72,73,74], increasing the probability of prostate carcinogenesis [70,71,72,73,74].
Previous studies reported that O. majorana extracts have an antiproliferative impact on a variety of cancer cell lines [24,75,76,77,78,79,80] and illustrated actions achieved by its compounds, including: detained cell cycle, cell migration, angiogenesis inhibition, apoptosis, telomerase activity modulation, and ROS consequences, which end by suppression of malignant cell proliferation and invasion [81,82,83]. These reports are in agreement with our data, which showed a significant increase in AI concurrent with a reduction in the PI in the O. majorana 500-treated group, followed by the O. majorana 250-treated group.
The role of caspases in prostate regression following castration was previously proposed [84]. Moreover, Omezzine et al. [85] documented a relation between inhibited apoptotic cell death pathway by testosterone in the ventral prostate and reduced both caspase-3 and -6 mRNA production. A recent study also observed the exhibited induction of BPH together with reduced caspase activity [63]. The resistance to induce cellular apoptosis results in increased severity of BPH and might progress to prostate cancer. Thus, targeting apoptosis in BPH is of great importance. These findings are in accordance with the results of the present study that demonstrated O. majorana’s apoptotic effect, given that it reduces PCNA immunoreactivity while increasing caspase-3 mRNA, protein levels, and immunoreactivity.
Our data of reduced mean area% of collagen, α-SMA, and TGF-β1 immunoreactivity in the stroma of O. majorana-treated groups are consistent with lower PI and higher AI and align with the previously documented correlation between stromal hyperplasia and induced epithelial growth in the pathogenesis of BPH [86]. The immunolocalization results were further reinforced by results of TGF- β1 mRNA and protein levels. Myofibroblasts and their precursor fibrocyte overgrowth were found to directly and/or indirectly induce prostatic hyperplasia through a local mesenchymal epithelial interaction [87]. Previous research also linked the decrease in TGF-ß1 expression to inhibition of stromal extracellular matrix (ECM) deposition and hyperplastic prostatic growth [88,89]. TGF-β is a central mediator of fibrogenesis [90]. The cellular expression of TGF-β1 in large amounts in BPH prostate tissues was found to induce global changes in DNA methylation during the epithelial-to-mesenchymal transition state [48,91].

5. Conclusions

Collectively, our study based upon molecular PCR, biochemical, morphological, and immunohistochemical reactivity analysis significantly supports the efficiency of O. majorana extract, in a dose-dependent manner, as an adjuvant treatment for PBH. This was evidenced by downregulation of DHT, reduced PW and PI, elevated proapoptotic Caspase-3, SOD, CAT, and TAC levels and lowered proinflammatory TGF-β1, cellular DNA damage, and MDA, and regression of epithelial and stromal hyperplasia in experimental BPH rats through its antioxidative, antiproliferative, and proapoptotic properties. We suggest that O. majorana extract can establish a balance between proliferation and apoptosis in BPH.

Supplementary Materials

The following are available online at https://www.mdpi.com/article/10.3390/antiox11061149/s1, Figure S1: Effect of O. majorana (500 mg/kg/day) on kidney and liver function indices when administrated to the normal control group. Figure S2: Microscopic pictures of H&E-stained hepatic and renal sections from the control group and control treated with O. majorana 500 mg/kg/day.

Author Contributions

Conceptualization, D.M.A.E. and M.E.-S.; Data curation, D.M.A.E. and H.M.A.; Formal analysis, D.M.A.E., M.E.-S., Z.M.M. and S.A.G.; Funding acquisition, M.E.-S.; Investigation, D.M.A.E., Z.M.M., N.M.E., S.A.G. and H.A.E.; Methodology, D.M.A.E., S.A.G. and H.A.E.; Project administration, D.M.A.E.; Resources, D.M.A.E., H.M.A. and H.A.E.; Software, H.M.A., N.M.E., S.A.G. and H.A.E.; Supervision, D.M.A.E., M.E.-S. and H.A.E.; Validation, H.M.A., M.E.-S., Z.M.M., N.M.E., S.A.G. and H.A.E.; Visualization, M.E.-S., N.M.E. and S.A.G.; Writing—original draft, D.M.A.E., M.E.-S., N.M.E., S.A.G. and H.A.E.; Writing—review and editing, D.M.A.E., M.E.-S., Z.M.M., N.M.E., S.A.G. and H.A.E. All authors have read and agreed to the published version of the manuscript.

Funding

The authors deeply acknowledge the Researchers Supporting program (TUMA-Project-2021-3), AlMaarefa University, Riyadh, Saudi Arabia, for supporting steps of this work.

Institutional Review Board Statement

The research design applied in our study meets Animal Research: Reporting of In Vivo Experiments (ARRIVE) guidelines. All the experimental procedures were carried out according to Guidelines for the Care and Use of Laboratory Animals established by the National Institutes of Health of the United States (NIH) publication (no. 85-23, 1996) and according to the Animal Care and Use Committee at the Faculty of Medicine, Mansoura, Egypt. The protocol of the study was approved by the Mansoura Medical Research Ethics Committee (approval no. R. 21.06.1352).

Informed Consent Statement

Not applicable.

Data Availability Statement

Data is contained within the article.

Conflicts of Interest

The authors declare no conflict of interest.

References

  1. Gacci, M.; Corona, G.; Salvi, M.; Vignozzi, L.; McVary, K.T.; Kaplan, S.A.; Roehrborn, C.G.; Serni, S.; Mirone, V.; Carini, M.; et al. A systematic review and meta-analysis on the use of phosphodiesterase 5 inhibitors alone or in combination with α-blockers for lower urinary tract symptoms due to benign prostatic hyperplasia. Eur. Urol. 2012, 61, 994–1003. [Google Scholar] [CrossRef] [PubMed]
  2. El-Sherbiny, M.; El-Shafey, M.; El-Din El-Agawy, M.S.; Mohamed, A.S.; Eisa, N.H.; Elsherbiny, N.M. Diacerein ameliorates testosterone-induced benign prostatic hyperplasia in rats: Effect on oxidative stress, inflammation and apoptosis. Int. Immunopharmacol. 2021, 100, 108082. [Google Scholar] [CrossRef] [PubMed]
  3. Atawia, R.T.; Tadros, M.G.; Khalifa, A.E.; Mosli, H.A.; Abdel-Naim, A.B. Role of the phytoestrogenic, pro-apoptotic and anti-oxidative properties of silymarin in inhibiting experimental benign prostatic hyperplasia in rats. Toxicol. Lett. 2013, 219, 160–169. [Google Scholar] [CrossRef] [PubMed]
  4. Xu, D.-H.; Wang, L.-H.; Mei, X.-T.; Li, B.-J.; Lv, J.-L.; Xu, S.-B. Protective effects of seahorse extracts in a rat castration and testosterone-induced benign prostatic hyperplasia model and mouse oligospermatism model. Environ. Toxicol. Pharmacol. 2014, 37, 679–688. [Google Scholar] [CrossRef]
  5. Cai, H.; Zhang, G.; Yan, Z.; Shang, X. The effect of Xialiqi capsule on testosterone-induced benign prostatic hyperplasia in rats. Evid. Based Complement. Alternat. Med. 2018, 2018, 5367814. [Google Scholar] [CrossRef]
  6. Yuan, J.; Liu, Y.; Yang, Z.; Qin, X.; Yang, K.; Mao, C. The efficacy and safety of alpha-1 blockers for benign prostatic hyperplasia: An overview of 15 systematic reviews. Curr. Med. Res. Opin. 2013, 29, 279–287. [Google Scholar] [CrossRef]
  7. Gormley, G.J.; Stoner, E.; Bruskewitz, R.C.; Imperato-McGinley, J.; Walsh, P.C.; McConnell, J.D.; Andriole, G.L.; Geller, J.; Bracken, B.R.; Tenover, J.S.; et al. The effect of finasteride in men with benign prostatic hyperplasia. N. Engl. J. Med. 1992, 327, 1185–1191. [Google Scholar] [CrossRef]
  8. Lowe, F.C.; McConnell, J.D.; Hudson, P.B.; Romas, N.A.; Boake, R.; Lieber, M.; Elhilali, M.; Geller, J.; Imperto-McGinely, J.; Andriole, G.L.; et al. Long-term 6-year experience with finasteride in patients with benign prostatic hyperplasia. Urology 2003, 61, 791–796. [Google Scholar] [CrossRef]
  9. Lecce, L.; Lam, Y.T.; Lindsay, L.A.; Yuen, S.C.; Simpson, P.J.; Handelsman, D.J.; Ng, M.K. Aging impairs VEGF-mediated, androgen-dependent regulation of angiogenesis. Mol. Endocrinol. 2014, 28, 1487–1501. [Google Scholar] [CrossRef]
  10. Uygur, M.; Gür, E.; Arik, A.; Altuǧ, U.; Erol, D. Erectile dysfunction following treatments of benign prostatic hyperplasia: A prospective study. Andrologia 1998, 30, 5–10. [Google Scholar] [CrossRef]
  11. Chiba, K.; Yamaguchi, K.; Li, F.; Ando, M.; Fujisawa, M. Finasteride-associated male infertility. Fertil. Steril. 2011, 95, 1786.e9–1786.e11. [Google Scholar] [CrossRef]
  12. Sharma, M.; Chadha, R.; Dhingra, N. Phytotherapeutic agents for benign prostatic hyperplasia: An overview. Mini Rev. Med. Chem. 2017, 17, 1346–1363. [Google Scholar] [CrossRef]
  13. Kim, S.-D.; Lee, B.-H.; Sohn, D.-W.; Cho, Y.-H.; Lee, S.-M.; Kim, J.-O.; Kim, S.W. The effect of herbal formulation KH-305 mainly consisted of Rubus coreanus on benign prostatic hyperplasia-induced rat. Korean J. Pharmacogn. 2008, 39, 80–85. [Google Scholar]
  14. Sun, H.; Li, T.-J.; Sun, L.-N.; Qiu, Y.; Huang, B.-B.; Yi, B.; Chen, W.S. Inhibitory effect of traditional Chinese medicine Zi-Shen pill on benign prostatic hyperplasia in rats. J. Ethnopharmacol. 2008, 115, 203–208. [Google Scholar] [CrossRef]
  15. Lee, S.-H.; Ahn, Y.-M.; Ahn, S.-Y.; Kim, Y.-O.; Lee, B.-C. The antihyperplastic effect of oral Curcuma longa ingestion in a rat model of benign prostatic hyperplasia. Korean J. Intern. Med. 2009, 30, 355–364. [Google Scholar]
  16. Kim, J.-S.; Han, Y.-H.; Kim, Y.-S. The effects of Scutellaria baicalensis on experimental rat model of benign prostatic hyperplasia. Korean J. Intern. Med. 2009, 30, 327–337. [Google Scholar]
  17. Shin, I.S.; Lee, M.Y.; Ha, H.K.; Seo, C.S.; Shin, H.-K. Inhibitory effect of Yukmijihwang-tang, a traditional herbal formula against testosterone-induced benign prostatic hyperplasia in rats. BMC Complement. Altern. Med. 2012, 12, 48. [Google Scholar] [CrossRef]
  18. Kim, S.K.; Seok, H.; Park, H.J.; Jeon, H.S.; Kang, S.W.; Lee, B.-C.; Yi, J.; Song, S.Y.; Lee, S.H.; Kim, Y.O.; et al. Inhibitory effect of curcumin on testosterone induced benign prostatic hyperplasia rat model. BMC Complement. Altern. Med. 2015, 15, 380. [Google Scholar] [CrossRef]
  19. Choi, H.-M.; Jung, Y.; Park, J.; Kim, H.-L.; Youn, D.-H.; Kang, J.; Jeong, M.Y.; Lee, J.H.; Yang, W.M.; Lee, S.G.; et al. Cinnamomi cortex (Cinnamomum verum) suppresses testosterone-induced benign prostatic hyperplasia by regulating 5α-reductase. Sci. Rep. 2016, 6, 31906. [Google Scholar] [CrossRef]
  20. Busatta, C.; Vidal, R.; Popiolski, A.; Mossi, A.; Dariva, C.; Rodrigues, M.; Corazza, F.C.; Corazza, M.L.; Vladimir Oliveira, J.; Cansian, R.L. Application of Origanum majorana L. essential oil as an antimicrobial agent in sausage. Food Microbiol. 2008, 25, 207–211. [Google Scholar] [CrossRef]
  21. El-Meligy, R.M.; Awaad, A.S.; Soliman, G.A.; Kenawy, S.A.; Alqasoumi, S.I. Prophylactic and curative anti-ulcerogenic activity and the possible mechanisms of action of some desert plants. Saudi Pharm. J. 2017, 25, 387–396. [Google Scholar] [CrossRef]
  22. Soliman, M.M.; Nassan, M.A.; Ismail, T.A. Origanum majoranum extract modulates gene expression, hepatic and renal changes in a rat model of type 2 diabetes. Iran. J. Pharm. Res. IJPR 2016, 15, 45. [Google Scholar] [PubMed]
  23. Yazdanparast, R.; Shahriyary, L. Comparative effects of Artemisia dracunculus, Satureja hortensis and Origanum majorana on inhibition of blood platelet adhesion, aggregation and secretion. Vasc. Pharmacol. 2008, 48, 32–37. [Google Scholar] [CrossRef]
  24. Abdel-Massih, R.M.; Fares, R.; Bazzi, S.; El-Chami, N.; Baydoun, E. The apoptotic and anti-proliferative activity of Origanum majorana extracts on human leukemic cell line. Leuk. Res. 2010, 34, 1052–1056. [Google Scholar] [CrossRef]
  25. El-Ashmawy, I.M.; El-Nahas, A.F.; Salama, O.M. Protective effect of volatile oil, alcoholic and aqueous extracts of Origanum majorana on lead acetate toxicity in mice. Basic Clin. Pharmacol. Toxicol. 2005, 97, 238–243. [Google Scholar] [CrossRef] [PubMed]
  26. Seoudi, D.M.; Medhat, A.M.; Hewedi, I.H.; Osman, S.A.; Mohamed, M.K.; Arbid, M.S. Evaluation of the anti-inflammatory, analgesic, and anti-pyretic effects of Origanum majorana ethanolic extract in experimental animals. J. Radiat. Res. Appl. Sci. 2009, 2, 513–534. [Google Scholar]
  27. Refaie, A.A.E.-R.; Ramadan, A.; Mossa, A.-T.H. Oxidative damage and nephrotoxicity induced by prallethrin in rat and the protective effect of Origanum majorana essential oil. Asian Pac. J. Trop. Med. 2014, 7, S506–S513. [Google Scholar] [CrossRef]
  28. Ennaji, H.; Chahid, D.; Aitssi, S.; Badou, A.; Khlil, N.; Ibenmoussa, S. Phytochemicals screening, cytotoxicity and antioxidant activity of the Origanum majorana growing in Casablanca, Morocco. Open Biol. Sci. J. 2020, 5, 053–059. [Google Scholar]
  29. Jaganathan, S.K.; Supriyanto, E.; Mandal, M. Events associated with apoptotic effect of p-coumaric acid in HCT-15 colon cancer cells. World J. Gastroenterol. WJG 2013, 19, 7726. [Google Scholar] [CrossRef] [PubMed]
  30. Chaves, R.d.S.B.; Martins, R.L.; Rodrigues, A.B.L.; de Menezes Rabelo, É.; Farias, A.L.F.; Araújo, C.M.d.C.V.; Almeida, S.S. Larvicidal evaluation of the Origanum majorana L. essential oil against the larvae of the Aedes aegypti mosquito. bioRxiv 2019. [Google Scholar] [CrossRef]
  31. Nyati, K.K.; Prasad, K.N.; Rizwan, A.; Verma, A.; Paliwal, V.K.; Pradhan, S. Lymphocyte transformation test detects a response to Campylobacter jejuni antigens in patients with Guillain-Barré syndrome. Med. Microbiol. Immunol. 2010, 199, 109–116. [Google Scholar] [CrossRef]
  32. Charan, J.; Kantharia, N. How to calculate sample size in animal studies? J. Pharmacol. Pharmacother. 2013, 4, 303. [Google Scholar] [CrossRef]
  33. Kim, K.S.; Yang, H.Y.; Chang, S.C.; Kim, Y.M.; Lee, K.Y.; Lee, B.M.; Kim, H.S. Potential repositioning of GV1001 as a therapeutic agent for testosterone-induced benign prostatic hyperplasia. Int. J. Mol. Med. 2018, 42, 2260–2268. [Google Scholar] [CrossRef]
  34. Choi, B.R.; Kim, H.K.; Soni, K.K.; Karna, K.K.; Lee, S.W.; So, I.; Park, J.K. Additive effect of oral LDD175 to tamsulosin and finasteride in a benign prostate hyperplasia rat model. Drug Des. Devel. Ther. 2018, 12, 1855. [Google Scholar] [CrossRef]
  35. Abdel-Naim, A.B.; Neamatallah, T.; Eid, B.G.; Esmat, A.; Alamoudi, A.J.; El-Aziz, A.; Ashour, O.M. 2-methoxyestradiol attenuates testosterone-induced benign prostate hyperplasia in rats through inhibition of HIF-1α/TGF-β/Smad2 axis. Oxid. Med. Cell. Longev. 2018, 2018, 4389484. [Google Scholar] [CrossRef]
  36. Soliman, A.M.; Desouky, S.; Marzouk, M.; Sayed, A.A. Origanum majorana attenuates nephrotoxicity of cisplatin anticancer drug through ameliorating oxidative stress. Nutrients 2016, 8, 264. [Google Scholar] [CrossRef]
  37. Abdelsalam, H.M.; Diab, A.A.; Zahra, M.H.; Eldehamy, S.; Hendawy, B.A. Therapeutic effects of Origanum majorana and propolis against nephrotoxicity induced by adenine. Biol. Eng. Med. 2019, 4, 1–9. [Google Scholar] [CrossRef]
  38. Desouky, S.; Marzouk, M.; Soliman, A.M.; Sayed, A.A. Modulatory effect of Origanum majorana extract against cisplatin-induced dyslipidemia in rats. Int. J. Curr. Res. Life Sci. 2015, 4, 228–234. [Google Scholar]
  39. Yang, X.; Yuan, L.; Xiong, C.; Yin, C.; Ruan, J. Abacopteris penangiana exerts testosterone-induced benign prostatic hyperplasia protective effect through regulating inflammatory responses, reducing oxidative stress and anti-proliferative. J. Ethnopharmacol. 2014, 157, 105–113. [Google Scholar] [CrossRef]
  40. Akbari, F.; Azadbakht, M.; Megha, K.; Dashti, A.; Vahedi, L.; Nejad, A.B.; Zahra, M.; Abdi Sarkami, S.; Sadati, M. Evaluation of Juniperus communis L. seed extract on benign prostatic hyperplasia induced in male Wistar rats. Afr. J. Urol. 2021, 27, 48. [Google Scholar] [CrossRef]
  41. An, Y.J.; Lee, J.Y.; Kim, Y.; Jun, W.; Lee, Y.-H. Cranberry powder attenuates benign prostatic hyperplasia in rats. J. Med. Food 2020, 23, 1296–1302. [Google Scholar] [CrossRef]
  42. Khoubnasabjafari, M.; Ansarin, K.; Jouyban, A. Critical review of malondialdehyde analysis in biological samples. Curr. Pharm. Anal. 2016, 12, 4–17. [Google Scholar] [CrossRef]
  43. Kosova, F.; Temeltaş, G.; Arı, Z.; Lekili, M. Possible relations between oxidative damage and apoptosis in benign prostate hyperplasia and prostate cancer patients. Tumor Biol. 2014, 35, 4295–4299. [Google Scholar] [CrossRef]
  44. Erel, O. A novel automated method to measure total antioxidant response against potent free radical reactions. Clin. Biochem. 2004, 37, 112–119. [Google Scholar] [CrossRef] [PubMed]
  45. Aebi, H. Catalase. In Methods of Enzymatic Analysis; Elsevier: Amsterdam, The Netherlands, 1974; pp. 673–684. [Google Scholar]
  46. Sun, Y.; Oberley, L.W.; Li, Y. A simple method for clinical assay of superoxide dismutase. Clin. Chem. 1988, 34, 497–500. [Google Scholar] [CrossRef] [PubMed]
  47. Al-Trad, B.; Aljabali, A.; Al Zoubi, M.; Shehab, M.; Omari, S. Effect of gold nanoparticles treatment on the testosterone-induced benign prostatic hyperplasia in rats. Int. J. Nanomed. 2019, 14, 3145. [Google Scholar] [CrossRef] [PubMed]
  48. Xu, H.; Chen, Y.; Chen, Q.; Xu, H.; Wang, Y.; Yu, J.; Zhou, J.; Wang, X.; Xu, B. DNMT1 regulates IL-6-and TGF-β1-induced epithelial mesenchymal transition in prostate epithelial cells. Eur. J. Histochem. EJH 2017, 61, 2775. [Google Scholar] [CrossRef]
  49. Bancroft, J.D.; Gamble, M. Theory and Practice of Histological Techniques, 7th ed.; Elsevier Health Sciences: Amsterdam, The Netherlands, 2008. [Google Scholar]
  50. Zhong, W.; Peng, J.; Wu, D.; Han, Z.; Bi, X.; Dai, Q. Ki-67 and PCNA expression in prostate cancer and benign prostatic hyperplasia. Clin. Investig. Med. 2008, 31, E8–E15. [Google Scholar] [CrossRef]
  51. Shariat, S.F.; Ashfaq, R.; Roehrborn, C.G.; Slawin, K.M.; Lotan, Y. Expression of survivin and apoptotic biomarkers in benign prostatic hyperplasia. J. Urol. 2005, 174, 2046–2050. [Google Scholar] [CrossRef]
  52. Zheng, C.; Luo, Y.; Chen, Y.; Chen, D.; Shao, C.; Huang, D.; Zhu, J.; Mao, X.; Li, L.; Sun, Z. Oral exposure of sulpiride promotes the proliferation of brown-Norway rat prostates. Exp. Ther. Med. 2020, 19, 2551–2562. [Google Scholar] [CrossRef]
  53. Ramos-Vara, J.; Miller, M. When tissue antigens and antibodies get along: Revisiting the technical aspects of immunohistochemistry—The red, brown, and blue technique. Vet. Pathol. 2014, 51, 42–87. [Google Scholar] [CrossRef]
  54. Schindelin, J.; Rueden, C.T.; Hiner, M.C.; Eliceiri, K.W. The ImageJ ecosystem: An open platform for biomedical image analysis. Mol. Reprod. Dev. 2015, 82, 518–529. [Google Scholar] [CrossRef]
  55. Bankhead, P.; Loughrey, M.B.; Fernández, J.A.; Dombrowski, Y.; McArt, D.G.; Dunne, P.D.; McQuaid, S.; Gray, R.T.; Murray, L.J.; Coleman, H.G. QuPath: Open source software for digital pathology image analysis. Sci. Rep. 2017, 7, 16878. [Google Scholar] [CrossRef]
  56. Fedchenko, N.; Reifenrath, J. Different approaches for interpretation and reporting of immunohistochemistry analysis results in the bone tissue—A review. Diagn. Pathol. 2014, 9, 221. [Google Scholar] [CrossRef]
  57. Iqbal, B.M.; Buch, A. Hormone receptor (ER, PR, HER2/neu) status and proliferation index marker (Ki-67) in breast cancers: Their onco-pathological correlation, shortcomings and future trends. Med. J. Dr DY Patil Univ. 2016, 9, 674. [Google Scholar] [CrossRef]
  58. Wu, X.; Gu, Y.; Li, L. The anti-hyperplasia, anti-oxidative and anti-inflammatory properties of Qing Ye Dan and swertiamarin in testosterone-induced benign prostatic hyperplasia in rats. Toxicol. Lett. 2017, 265, 9–16. [Google Scholar] [CrossRef]
  59. Jung, Y.; Park, J.; Kim, H.-L.; Youn, D.-H.; Kang, J.; Lim, S.; Jeong, M.Y.; Sethi, G.; Park, S.J.; Ahn, K.S. Vanillic acid attenuates testosterone-induced benign prostatic hyperplasia in rats and inhibits proliferation of prostatic epithelial cells. Oncotarget 2017, 8, 87194. [Google Scholar] [CrossRef]
  60. La Torre, A.; Giupponi, G.; Duffy, D.; Conca, A.; Cai, T.; Scardigli, A. Sexual dysfunction related to drugs: A critical review. Part V: α-blocker and 5-ARI drugs. Pharmacopsychiatry 2016, 49, 3–13. [Google Scholar] [CrossRef]
  61. Garg, G.; Singh, D.; Saraf, S.; Saraf, S. Management of benign prostate hyperplasia: An overview of α-adrenergic antagonist. Biol. Pharm. Bull. 2006, 29, 1554–1558. [Google Scholar] [CrossRef]
  62. El-Ashmawy, N.E.; Khedr, E.G.; El-Bahrawy, H.A.; Helmy, N.N. Modulatory effect of silymarin on apoptosis in testosterone-induced benign prostatic hyperplasia in rats. J. Clin. Oncol. 2020, 26, 1947–1956. [Google Scholar] [CrossRef]
  63. Gheitasi, I.; Motaghi, N.; Sadeghi, H.; Sadeghi, H.; Moslemi, Z.; Eftekhari, M.; Shakerinasab, N.; Doustimotlagh, A.H. Antioxidant and anti-inflammatory effects of Origanum majorana L. methanolic extract on bile duct ligation in male rats. Evid. Based Complement. Alternat. Med. 2021, 2021, 9927196. [Google Scholar] [CrossRef] [PubMed]
  64. Veličković, D.T.; Nikolova, M.T.; Ivancheva, S.V.; Stojanović, J.B.; Veljković, V.B. Extraction of flavonoids from garden (Salvia officinalis L.) and glutinous (Salvia glutinosa L.) sage by ultrasonic and classical maceration. J. Serb. Chem. Soc. 2007, 72, 73–80. [Google Scholar] [CrossRef]
  65. Ahmad, M.; Suhail, N.; Mansoor, T.; Banu, N.; Ahmad, S. Evaluation of oxidative stress and DNA damage in benign prostatic hyperplasia patients and comparison with controls. Indian J. Clin. Biochem. 2012, 27, 385–388. [Google Scholar] [CrossRef] [PubMed]
  66. Younis, N.N.; Elsherbiny, N.M.; Shaheen, M.A.; Elseweidy, M.M. Modulation of NADPH oxidase and Nrf2/HO-1 pathway by vanillin in cisplatin-induced nephrotoxicity in rats. J. Pharm. Pharmacol. 2020, 72, 1546–1555. [Google Scholar] [CrossRef]
  67. Eid, B.G.; Abdel-Naim, A.B. Piceatannol attenuates testosterone-induced benign prostatic hyperplasia in rats by modulation of Nrf2/HO-1/NFκB axis. Front. Pharmacol. 2020, 11, 2219. [Google Scholar] [CrossRef]
  68. D’Amico, R.; Genovese, T.; Cordaro, M.; Siracusa, R.; Gugliandolo, E.; Peritore, A.F.; Interdonato, L.; Crupi, R.; Cuzzocrea, S.; Di Paola, R.; et al. Palmitoylethanolamide/baicalein regulates the androgen receptor signaling and NF-κB/Nrf2 pathways in benign prostatic hyperplasia. Antioxidants 2021, 10, 1014. [Google Scholar] [CrossRef]
  69. Chen, Y.; Xu, H.; Liu, C.; Gu, M.; Chen, Q.; Zhan, M.; Wang, Z. Therapeutic effects of 25-hydroxyvitamin D on the pathological process of benign prostatic hyperplasia: An in vitro evidence. Dis. Markers 2021, 2021, 4029470. [Google Scholar] [CrossRef]
  70. Cadet, J.; Douki, T.; Gasparutto, D.; Ravanat, J.-L. Oxidative damage to DNA: Formation, measurement and biochemical features. Mutat. Res. Fundam. Mol. Mech. Mutagen. 2003, 531, 5–23. [Google Scholar] [CrossRef]
  71. Wang, J.; Yi, J. Cancer cell killing via ROS: To increase or decrease, that is the question. Cancer Biol. Ther. 2008, 7, 1875–1884. [Google Scholar] [CrossRef]
  72. Trachootham, D.; Zhou, Y.; Zhang, H.; Demizu, Y.; Chen, Z.; Pelicano, H.; Chiao, P.J.; Achanta, G.; Arlinghaus, R.B.; Liu, J.; et al. Selective killing of oncogenically transformed cells through a ROS-mediated mechanism by β-phenylethyl isothiocyanate. Cancer Cell. 2006, 10, 241–252. [Google Scholar] [CrossRef]
  73. Stadtman, E.R.; Berlett, B.S. Reactive oxygen-mediated protein oxidation in aging and disease. Drug Metab. Rev. 1998, 30, 225–243. [Google Scholar] [CrossRef]
  74. Na, H.K.; Oliynyk, S. Effects of physical activity on cancer prevention. Ann. N. Y. Acad. Sci. 2011, 1229, 176–183. [Google Scholar] [CrossRef]
  75. Al Dhaheri, Y.; Eid, A.; AbuQamar, S.; Attoub, S.; Khasawneh, M.; Aiche, G.; Hisaindee, S.; Iratni, R. Mitotic arrest and apoptosis in breast cancer cells induced by Origanum majorana extract: Upregulation of TNF-α and downregulation of survivin and mutant p53. PLoS ONE 2013, 8, e56649. [Google Scholar]
  76. Rao, S.; Timsina, B.; Nadumane, V.K. Evaluation of the anticancer potentials of Origanum marjorana on fibrosarcoma (HT-1080) cell line. Asian Pac. J. Trop. Dis. 2014, 4, S389–S394. [Google Scholar] [CrossRef]
  77. Hajlaoui, H.; Mighri, H.; Aouni, M.; Gharsallah, N.; Kadri, A. Chemical composition and in vitro evaluation of antioxidant, antimicrobial, cytotoxicity and anti-acetylcholinesterase properties of Tunisian Origanum majorana L. essential oil. Microb. Pathog. 2016, 95, 86–94. [Google Scholar] [CrossRef]
  78. García-Risco, M.R.; Mouhid, L.; Salas-Pérez, L.; López-Padilla, A.; Santoyo, S.; Jaime, L.; Ramírez de Molina, A.; Reglero, G.; Fornari, T. Biological activities of Asteraceae (Achillea millefolium and Calendula officinalis) and Lamiaceae (Melissa officinalis and Origanum majorana) plant extracts. Plant Foods Hum. Nutr. 2017, 72, 96–102. [Google Scholar] [CrossRef]
  79. Makrane, H.; El Messaoudi, M.; Melhaoui, A.; El Mzibri, M.; Benbacer, L.; Aziz, M. Cytotoxicity of the aqueous extract and organic fractions from Origanum majorana on human breast cell line MDA-MB-231 and human colon cell line HT-29. Adv. Pharmacol. Sci. 2018, 2018, 3297193. [Google Scholar] [CrossRef]
  80. Benhalilou, N.; Alsamri, H.; Alneyadi, A.; Athamneh, K.; Alrashedi, A.; Altamimi, N.; Al Dhaheri, Y.; Eid, A.H.; Iratni, R. Origanum majorana ethanolic extract promotes colorectal cancer cell death by triggering abortive autophagy and activation of the extrinsic apoptotic pathway. Front. Oncol. 2019, 9, 795. [Google Scholar] [CrossRef]
  81. Pakdemirli, A.; Karaca, C.; Sever, T.; Daşkin, E.; Leblebici, A.; Yiğitbaşi, T.; Başbinar, Y. Carvacrol alters soluble factors in HCT-116 and HT-29 cell lines. Turk. J. Med. Sci. 2020, 50, 271–276. [Google Scholar]
  82. Elbe, H.; Yigitturk, G.; Cavusoglu, T.; Baygar, T.; Ozgul Onal, M.; Ozturk, F. Comparison of ultrastructural changes and the anticarcinogenic effects of thymol and carvacrol on ovarian cancer cells: Which is more effective? Ultrastruct. Pathol. 2020, 44, 193–202. [Google Scholar] [CrossRef]
  83. Bouyahya, A.; Belmehdi, O.; Benjouad, A.; El Hassani, R.A.; Amzazi, S.; Dakka, N.; Bakri, Y. Pharmacological properties and mechanism insights of Moroccan anticancer medicinal plants: What are the next steps? Ind. Crops Prod. 2020, 147, 112198. [Google Scholar] [CrossRef]
  84. Marti, A.; Jaggi, R.; Vallan, C.; Ritter, P.M.; Baltzer, A.; Srinivasan, A.; Dharmarajan, A.M.; Friis, R.R. Physiological apoptosis in hormone-dependent tissues: Involvement of caspases. Cell Death Differ. 1999, 6, 1190–1200. [Google Scholar] [CrossRef] [PubMed]
  85. Omezzine, A.; Mauduit, C.; Tabone, E.; Nabli, N.; Bouslama, A.; Benahmed, M. Caspase-3 and-6 expression and activation are targeted by hormone action in the rat ventral prostate during the apoptotic cell death process. Biol. Reprod. 2003, 69, 752–760. [Google Scholar] [CrossRef] [PubMed]
  86. Culig, Z.; Hobisch, A.; Cronauer, M.V.; Radmayr, C.; Hittmair, A.; Zhang, J.; Thurnher, M.; Bartsch, G.; Klocker, H. Regulation of prostatic growth and function by peptide growth factors. Prostate 1996, 28, 392–405. [Google Scholar] [CrossRef]
  87. Tuxhorn, J.A.; Ayala, G.E.; Smith, M.J.; Smith, V.C.; Dang, T.D.; Rowley, D.R. Reactive stroma in human prostate cancer: Induction of myofibroblast phenotype and extracellular matrix remodeling. Clin. Cancer Res. 2002, 8, 2912–2923. [Google Scholar]
  88. Rick, F.G.; Schally, A.V.; Block, N.L.; Halmos, G.; Perez, R.; Fernandez, J.B.; Vidaurre, I.; Szalontay, L. LHRH antagonist Cetrorelix reduces prostate size and gene expression of proinflammatory cytokines and growth factors in a rat model of benign prostatic hyperplasia. Prostate 2011, 71, 736–747. [Google Scholar] [CrossRef]
  89. Lai, K.-P.; Huang, C.-K.; Fang, L.-Y.; Izumi, K.; Lo, C.-W.; Wood, R.; Kindblom, J.; Yeh, S.; Chang, C. Targeting stromal androgen receptor suppresses prolactin-driven benign prostatic hyperplasia (BPH). Mol. Endocrinol. 2013, 27, 1617–1631. [Google Scholar] [CrossRef]
  90. Said, E.; Zaitone, S.A.; Eldosoky, M.; Elsherbiny, N.M. Nifuroxazide, a STAT3 inhibitor, mitigates inflammatory burden and protects against diabetes-induced nephropathy in rats. Chem. Biol. Interact. 2018, 281, 111–120. [Google Scholar] [CrossRef]
  91. Cardenas, H.; Vieth, E.; Lee, J.; Segar, M.; Liu, Y.; Nephew, K.P.; Matei, D. TGF-β induces global changes in DNA methylation during the epithelial-to-mesenchymal transition in ovarian cancer cells. Epigenetics 2014, 9, 1461–1472. [Google Scholar] [CrossRef]
Figure 1. Flow chart of animal groups.
Antioxidants 11 01149 g001
Figure 2. (AE): Effect of O. majorana on serum hormone levels, MDA and SOD concentrations in prostatic tissue and morphological changes: (A) DHT serum level. (B) Testosterone serum level. (C) MDA concentration in prostatic tissue. (D) SOD concentration in prostatic tissue. Data are expressed as means ± SD (n = 8). ### p < 0.001, ## p < 0.01 and # p < 0.05 vs. control, *** p < 0.001, ** p < 0.01 and * p < 0.05 vs. BPH (model) group. (E) displays the variations in size of the prostate among the five groups: seminal vesicle (SV), urinary bladder (UB), ventral lobe (VP), and lateral lobe (LP).
Antioxidants 11 01149 g002
Figure 3. (AC): Effect of O. majorana on cellular DNA damage (8-hydroxyguanine, 8-OH-dG), catalase (CAT) activity and total antioxidant capacity (TAC) in prostatic tissue: (A) cellular 8-OH-dG. (B) CAT tissue level. (C) TAC concentration in prostatic tissue. Data are expressed as means ± SD (n = 8). ### p < 0.001, ## p < 0.01 and # p < 0.05 vs. control, *** p < 0.001, ** p < 0.01 and * p < 0.01 vs. BPH (model) group.
Antioxidants 11 01149 g003aAntioxidants 11 01149 g003b
Figure 4. (A,B): Effect of O. majorana on protein of Nrf2 (A) and HO-1 (B) in prostatic tissue. Data are expressed as means ± SD (n = 8). ### p < 0.001 and # p < 0.05 vs. control, *** p < 0.001 and ** p < 0.01 vs. BPH (model) group.
Antioxidants 11 01149 g004
Figure 5. (AD): Effect of O. majorana on mRNA and protein of Caspase-3 (A,B) and TGF-β1 (C,D) in prostatic tissue: (A) quantitative PCR of Caspase-3 mRNA, (B) ELISA of Caspase-3 (C) quantitative PCR of TGF-β1 mRNA, and (D) ELISA of TGF-β1 in prostatic tissue. Data are expressed as means ± SD (n = 8). ### p < 0.001, ## p < 0.01 and # p < 0.05 vs. control, *** p < 0.001 and ** p < 0.01 vs. BPH (model) group.
Antioxidants 11 01149 g005
Figure 6. (AK): Histological changes in prostate lobes (H&E-stained sections): Acinar luminal area. Microscopic pictures representing sections of comparable regions in ventral and lateral lobes of the control group (A,B), (BPH) group (C,D), finasteride group (E,F), O. majorana 250 group (G,H), and O. majorana 500 group (I,J). Connective tissue stroma (S) between the secretory acini, inflammatory cells infiltration (green asterisk), acinar folding (red arrowheads), dilated blood vessels (red arrows), and bidirectional arrows represent the acinar luminal area. Magnification, ×100. Scale bar, 100 μm. (K) A graph showing the acinar luminal area. Data are expressed as mean ± SD (n = 8). * p < 0.05 versus BPH (model) group and ∆∆ p < 0.01 vs. control for ventral lobe, # p < 0.05 vs. BPH (model) group and Φ p < 0.05 vs. control for lateral lobe.
Antioxidants 11 01149 g006
Figure 7. (AK): Histological changes in prostate lobes (H&E-stained sections): Epithelial height of the prostatic tissue. Microscopic pictures representing sections of comparable regions in ventral and lateral lobes of the control group (A,B), (BPH) group (C,D), finasteride group (E,F), O. majorana 250 group (G,H), and O. majorana 500 group (I,J). Connective tissue stroma (S) between the secretory acini, inflammatory cells infiltration (green asterisk), acinar folding and epithelial thickening (red arrowheads), dilated blood vessels (red arrows), and green arrows represent the prostatic epithelium height. Magnification, ×400. Scale bar, 50 μm. (K) A graph presenting the epithelial thickening. Data are expressed as mean ± SD (n = 8). * p < 0.05, *** p < 0.001 vs. BPH (model) group and ∆∆∆ p < 0.001 versus control for ventral lobe, # p < 0.05, ### p < 0.001 vs. BPH (model) group and Φ p < 0.05 versus control for lateral lobe.
Antioxidants 11 01149 g007
Figure 8. (AK): Histological changes in prostate lobes (Masson’s trichrome-stained sections): Microscopic pictures representing sections of comparable regions in ventral and lateral lobes of the control group (A,B), (BPH) group (C,D), finasteride group (E,F), O. majorana 250 group (G,H), and O. majorana 500 group (I,J). CT stroma between the acini (S) and collagen fibers deposition (black arrows). X: 100 bar 100 μm (low magnification) and X: 400 bar 50 μm (high magnification). (K) A graph showing collagen fiber means area percentage in the experimental groups. Data are expressed as mean ± SD (n = 8). *** p < 0.001 vs. BPH (model) group and ∆∆∆ p < 0.001 versus control for ventral lobe, ### p < 0.001 vs. BPH (model) group and ΦΦΦ p < 0.001 versus control for lateral lobe.
Antioxidants 11 01149 g008
Figure 9. (AK): Histological changes in prostate lobes (immunostained prostate sections against α-SMA actin): Microscopic pictures sections of comparable regions in ventral and lateral lobes of the control group (A,B), (BPH) group (C,D), finasteride group (E,F), O. majorana 250 group (G,H), and O. majorana 500 group (I,J). Blue arrows indicate positive staining. Immunohistochemistry (IHC) counterstained with Mayer’s hematoxylin. Low magnification X: 100 bar 100 μm and high magnification X: 400 bar 50 μm. (K) A graph showing the mean area % of actin in the experimental groups. Data are expressed as mean ± SD (n = 8). *** p < 0.001 versus BPH (model) group and p < 0.05, ∆∆ p < 0.01 ∆∆∆ p < 0.001 versus control for ventral lobe, ### p < 0.001 versus BPH (model) group and Φ p < 0.05, ΦΦΦ p < 0.001 versus control for lateral lobe.
Antioxidants 11 01149 g009
Figure 10. (AK): Histological changes in prostate lobes (immunostained prostate sections against (TGF-B1)): Microscopic pictures representing sections of comparable regions in ventral and lateral lobes of the control group (A,B), (BPH) group (C,D), finasteride group (E,F), O. majorana 250 group (G,H), and O. majorana 500 group (I,J). Blue asterisk points to positive interstitial stroma, and black arrows demonstrate positive epithelial immunoreactivity. IHC counterstained with Mayer’s hematoxylin. X: 100 bar 100 μm (low magnification) and X: 400 bar 50 μm (high magnification). (K) A graph showing mean area % of actin in the studied groups. Data are expressed as mean ± SD (n = 8). ** p < 0.01 versus BPH (model) group and p < 0.05, ∆∆ p < 0.01 ∆∆∆ p < 0.001 versus control for ventral lobe, ## p < 0.01versus BPH (model) group and ΦΦ p < 0.01, ΦΦΦ p < 0.001 versus control for lateral lobe.
Antioxidants 11 01149 g010
Figure 11. (AK): Histological changes in prostate lobes (immunostained prostate sections against (PCNA)): Microscopic pictures representing sections of comparable regions in ventral and lateral lobes of the control group (A,B), (BPH) group (C,D), finasteride group (E,F), O. majorana 250 group (G,H), and O. majorana 500 group (I,J). Black arrows demonstrate positive epithelial immunoreactivity. IHC counterstained with Mayer’s hematoxylin. X: 100 bar 100 μm (low magnification) and X: 400 bar 50 μm (high magnification). (K) A graph showing the proliferative index. Data represent the mean percentage of cells that showed positive immunoreactivity ± SD (n = 8). *** p < 0.001 vs. BPH (model) group and ∆∆ p < 0.01, ∆∆∆ p < 0.001 vs. control for ventral lobe, ### p < 0.001 vs. BPH (model) group and Φ p < 0.05, ΦΦΦ p < 0.001 vs. control for lateral lobe.
Antioxidants 11 01149 g011
Figure 12. (AK): Histological changes in prostate lobes (immunostained prostate sections against (caspase-3)): Microscopic pictures representing sections of comparable regions in ventral and lateral lobes of the control group (A,B), (BPH) group (C,D), finasteride group (E,F), O. majorana 250 group (G,H), and O. majorana 500 group (I,J). Black arrows demonstrate positive epithelial immunoreactivity. IHC counterstained with Mayer’s hematoxylin. X: 100 bar 100 μm (low magnification) and X: 400 bar 50 μm (high magnification). (K) A graph showing the apoptotic index. Values represent the mean percentage of cells that showed positive immunoreactivity ± SD (n = 8). *** p < 0.001 vs. BPH (model) group and ∆∆ p < 0.01, ∆∆∆ p < 0.001 vs. control for ventral lobe, ### p < 0.001 vs. BPH (model) group and ΦΦΦ p < 0.001 vs. control for lateral lobe.
Antioxidants 11 01149 g012
Figure 13. A graph showing the proliferative index (PI) and apoptotic index (AI) in the experimental groups. Values represent the mean percentage of cells that showed positive immunoreactivity ± SD (n = 8). *** p < 0.001 of PI versus AI in individual groups. ns = non-significant.
Antioxidants 11 01149 g013
Figure 14. (AK): Histological changes in prostate lobes (immunostained prostate sections against (γH2Ax): Microscopic pictures representing sections of comparable regions in ventral and lateral lobes of the control group (A,B), (BPH) group (C,D), finasteride group (E,F), O. majorana 250 group (G,H) and O. majorana 500 group (I,J). Black arrows demonstrate positive epithelial immunoreactivity. IHC counterstained with Mayer’s hematoxylin. X: 100 bar 100 μm (low magnification) and X: 400 bar 50 μm (high magnification). (K) A graph showing the Allred scoring system. Values are expressed as mean ± SD (n = 8). 0–1 (negative), 2–3 (mild), 4–6 (moderate) and 7–8 (strong). * p < 0.05, ** p < 0.01 vs. BPH (model) group and p < 0.05, ∆∆∆ p < 0.001 vs. control for ventral lobe, # p < 0.05 vs. BPH (model) group and ΦΦ p < 0.01 vs. control for lateral lobe.
Antioxidants 11 01149 g014
Figure 15. (AK): Histological changes in prostate lobes (immunostained prostate sections against (PARP1)): Microscopic pictures representing sections of comparable regions in ventral and lateral lobes of the control group (A,B), (BPH) group (C,D), finasteride group (E,F), O. majorana 250 group (G,H) and O. majorana 500 group (I,J). Black arrows demonstrate positive epithelial immunoreactivity. IHC counterstained with Mayer’s hematoxylin. X: 100 bar 100 μm (low magnification) and X: 400 bar 50 μm (high magnification). (K) A graph showing the Allred scoring system. Values are expressed as mean ± SD (n = 8). 0–1 (negative), 2–3 (mild), 4–6 (moderate) and 7–8 (strong). *** p < 0.001 vs. BPH (model) group and ∆∆∆ p < 0.001, vs. control for ventral lobe, ### p < 0.001 vs. BPH (model) group and ΦΦ p < 0.01, ΦΦΦ p < 0.001 vs. control for lateral lobe.
Antioxidants 11 01149 g015
Figure 16. Graphical abstract.
Antioxidants 11 01149 g016
Table 1. List of primers sequences used in real-time PCR analysis.
GenePrimer Sequences
GAPDHFor 5′- CCTCTGACTTCAACAGCGAC-3
Rev 5′-TCCTCTTGTG CTCTTGCTGG-3′
Caspase-3For 5′-GGTATTGAGACAGACAGTGG-3′
Rev 5′-CATGGGATCTGTTTCTTTGC-3′
TGF-β1For 5′-CAATTCCTGGCGATACCTCAG-3″
Rev 5′-GCACAACTCCGGTGACATCAA-3
Table 2. Antibody specifics and functions.
Primary AntibodyFunctionManufacturer (Cat. No.)Host SpeciesDilution
γH2AXA marker for DNA double-strand breaksphospho-S139, Abclonal, Wuhan, China, AP0099)Rabbit polyclonal1:100
PARPSensor of DNA damageAbclonal, Wuhan, China, A0942Rabbit polyclonal1:100
PCNACell proliferation markerSanta Cruz Biotechnology, Inc., Santa Cruz, CA, USA (Sc-56)Mouse monoclonal1:100
Caspase-3Proapoptotic markerAbcam (ab184787)Rabbit monoclonal1:100
TGF-β1Apoptosis, marker for
Fibrogenesis. extracellular
matrix formation, and morphogenesis
Santa Cruz Biotechnology, Inc. (SC-130348)Mouse monoclonal1:100
α-SMAMarker for smooth muscle fibers surrounding the
acini
Biolegend
(MMS-466S)
Rabbit polyclonal1:100
Table 3. Rats’ body weight and prostate parameters.
GroupsGain in Body Weight (g)Prostate Weight (mg)% Inhibition
Prostate Weight
Prostate Index × 10−3% Inhibition
Prostate
Index
Control group(vehicle)38.25 ± 4.65380.59 ± 13.58 a-1.14 ± 0.02 a-
Model group (BPH)21.00 ± 3.16 *912.50 ± 85.39 b-2.85 ± 0.26 b-
Finasteride 12.25 ± 2.85 *600.02 ± 81.64 c58.751.95 ± 0.28 c52.29
O. majorana 25020.00 ± 1.63 *812.50 ± 49.30 b,d18.802.59 ± 0.44 b,d15.03
O. majorana 50015.75 ± 8.42 *637.50 ± 47.87 c,e51.702.04 ± 0.16 c,e47.43
The values are described as mean ± SD (n = 8 animals/group). * p < 0.05 vs. control. Different letters in a column represent the statistical difference (p < 0.05).
Publisher’s Note: MDPI stays neutral with regard to jurisdictional claims in published maps and institutional affiliations.

