
Assessment of Virtual Reality among University Professors: Influence of the Digital Generation


Abstract
:
1. Introduction
2. Materials and Methods
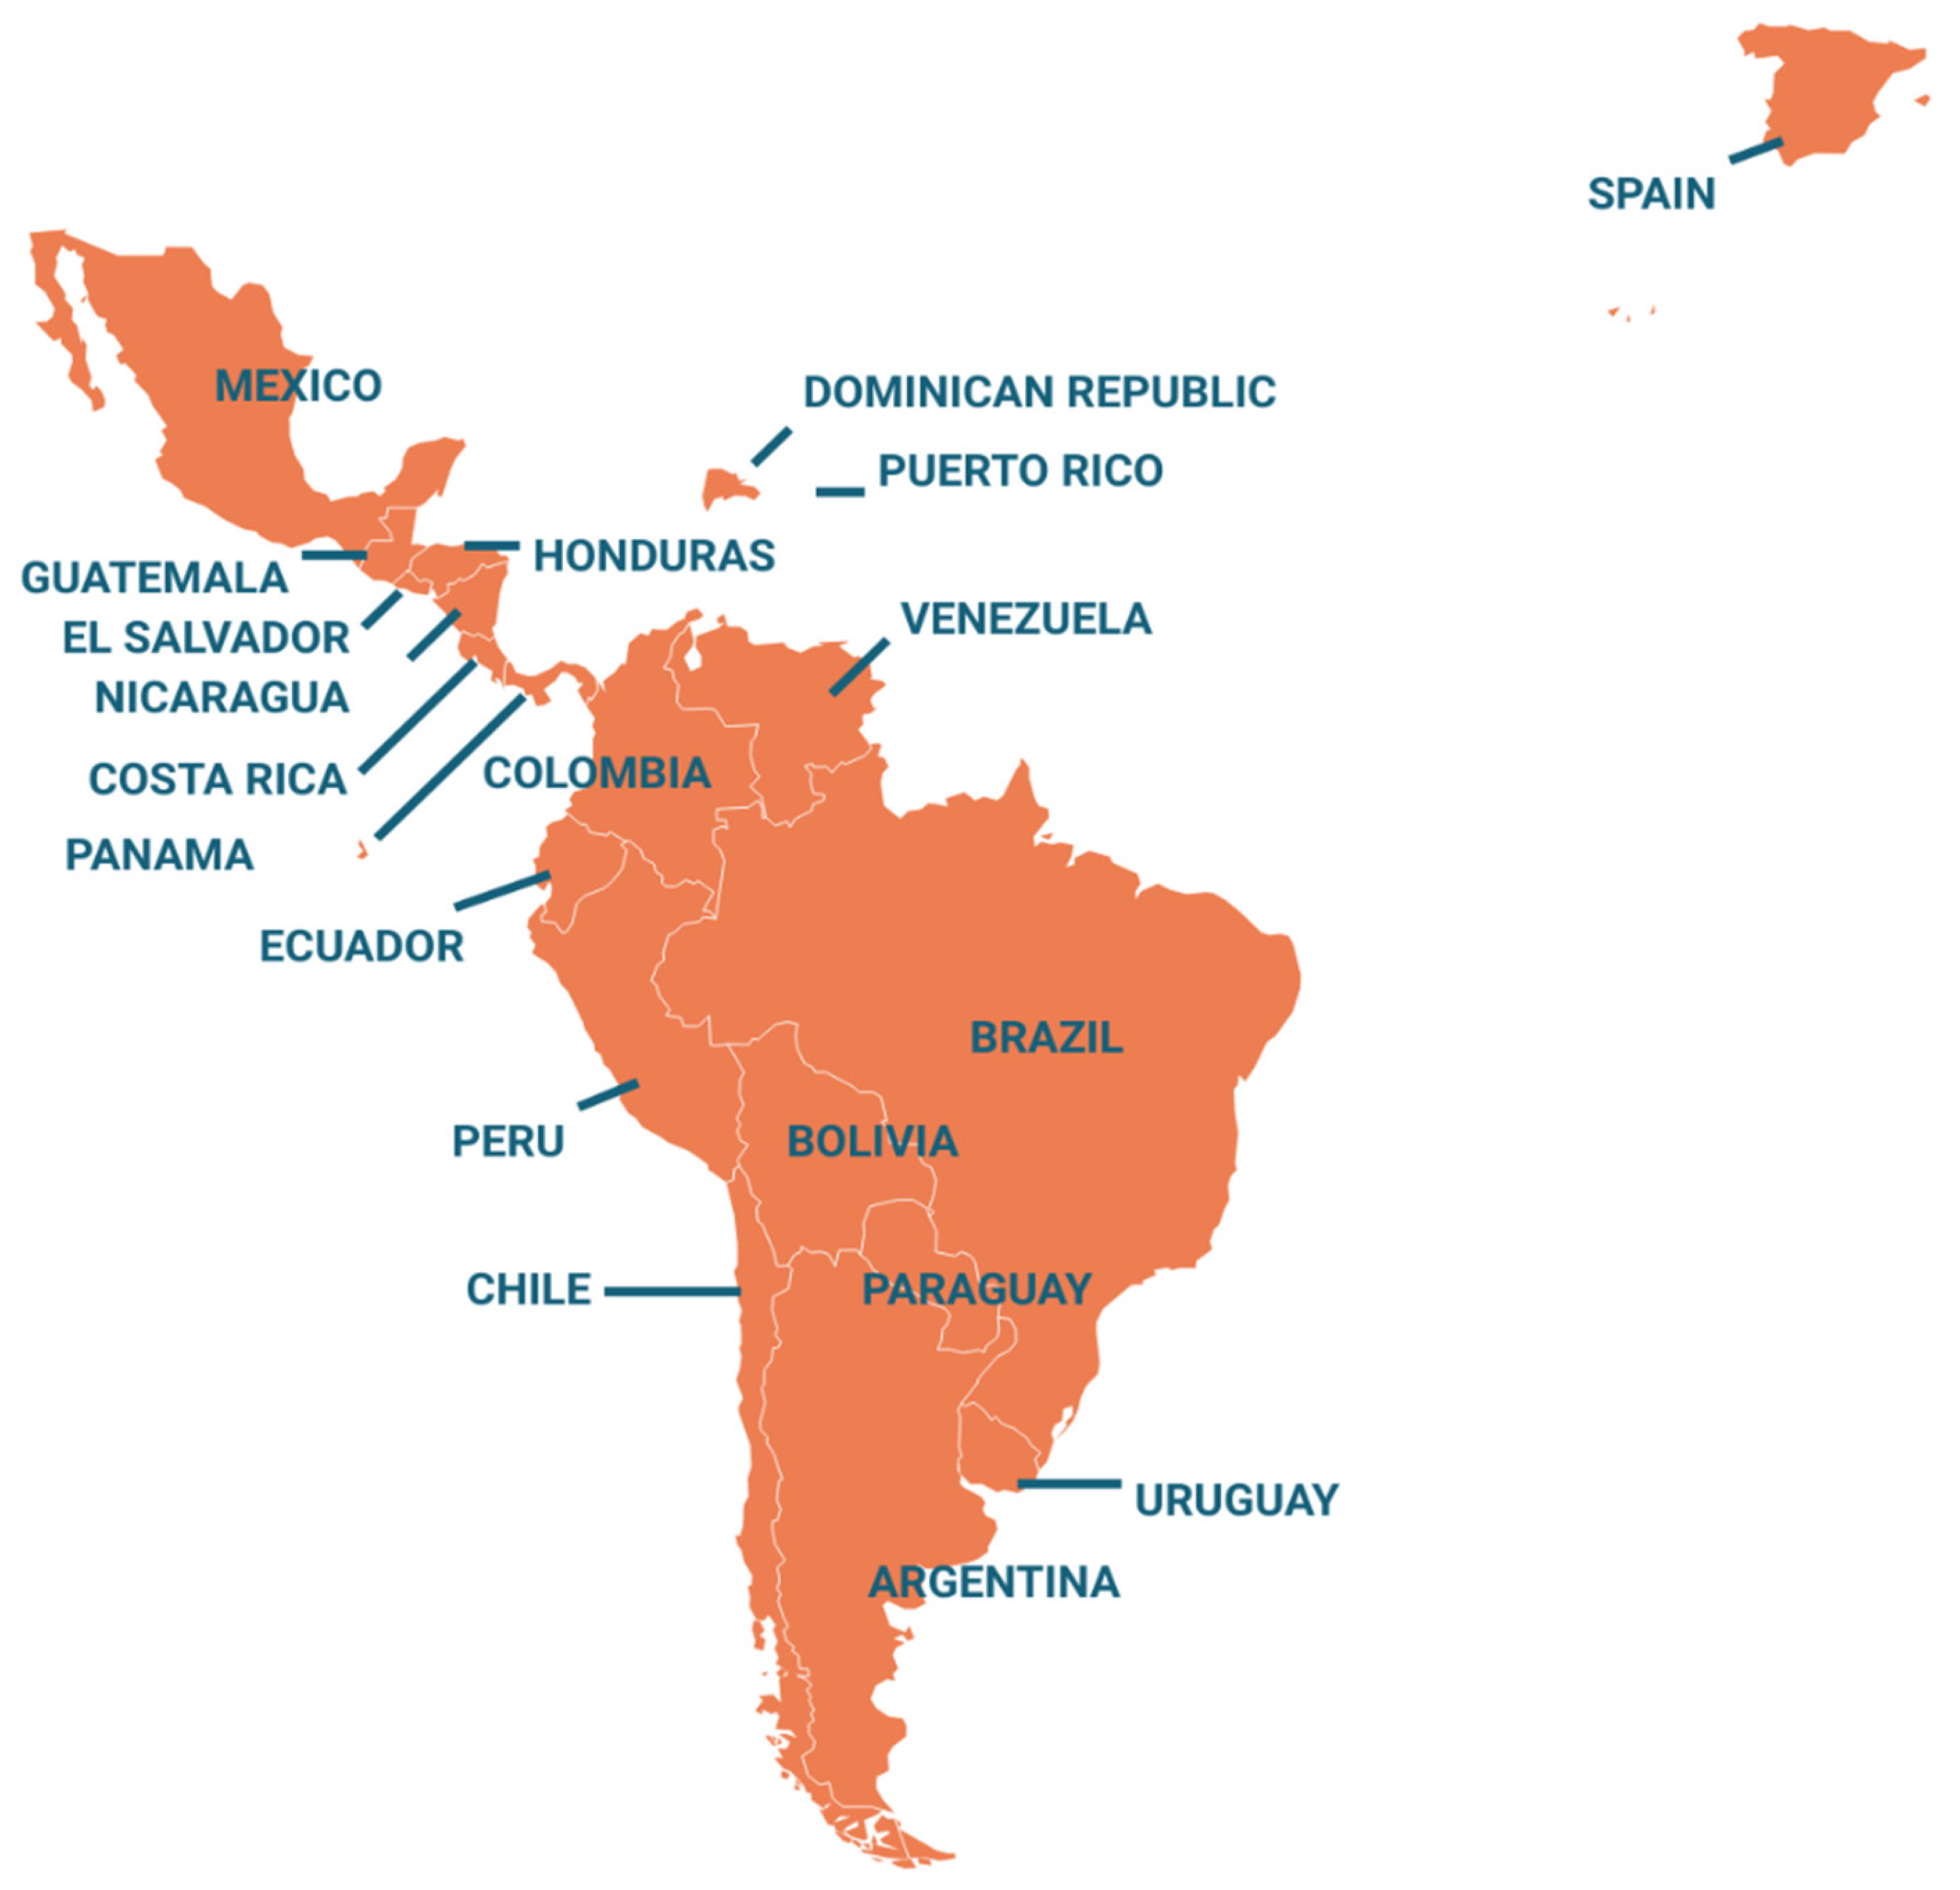
2.1. Participants
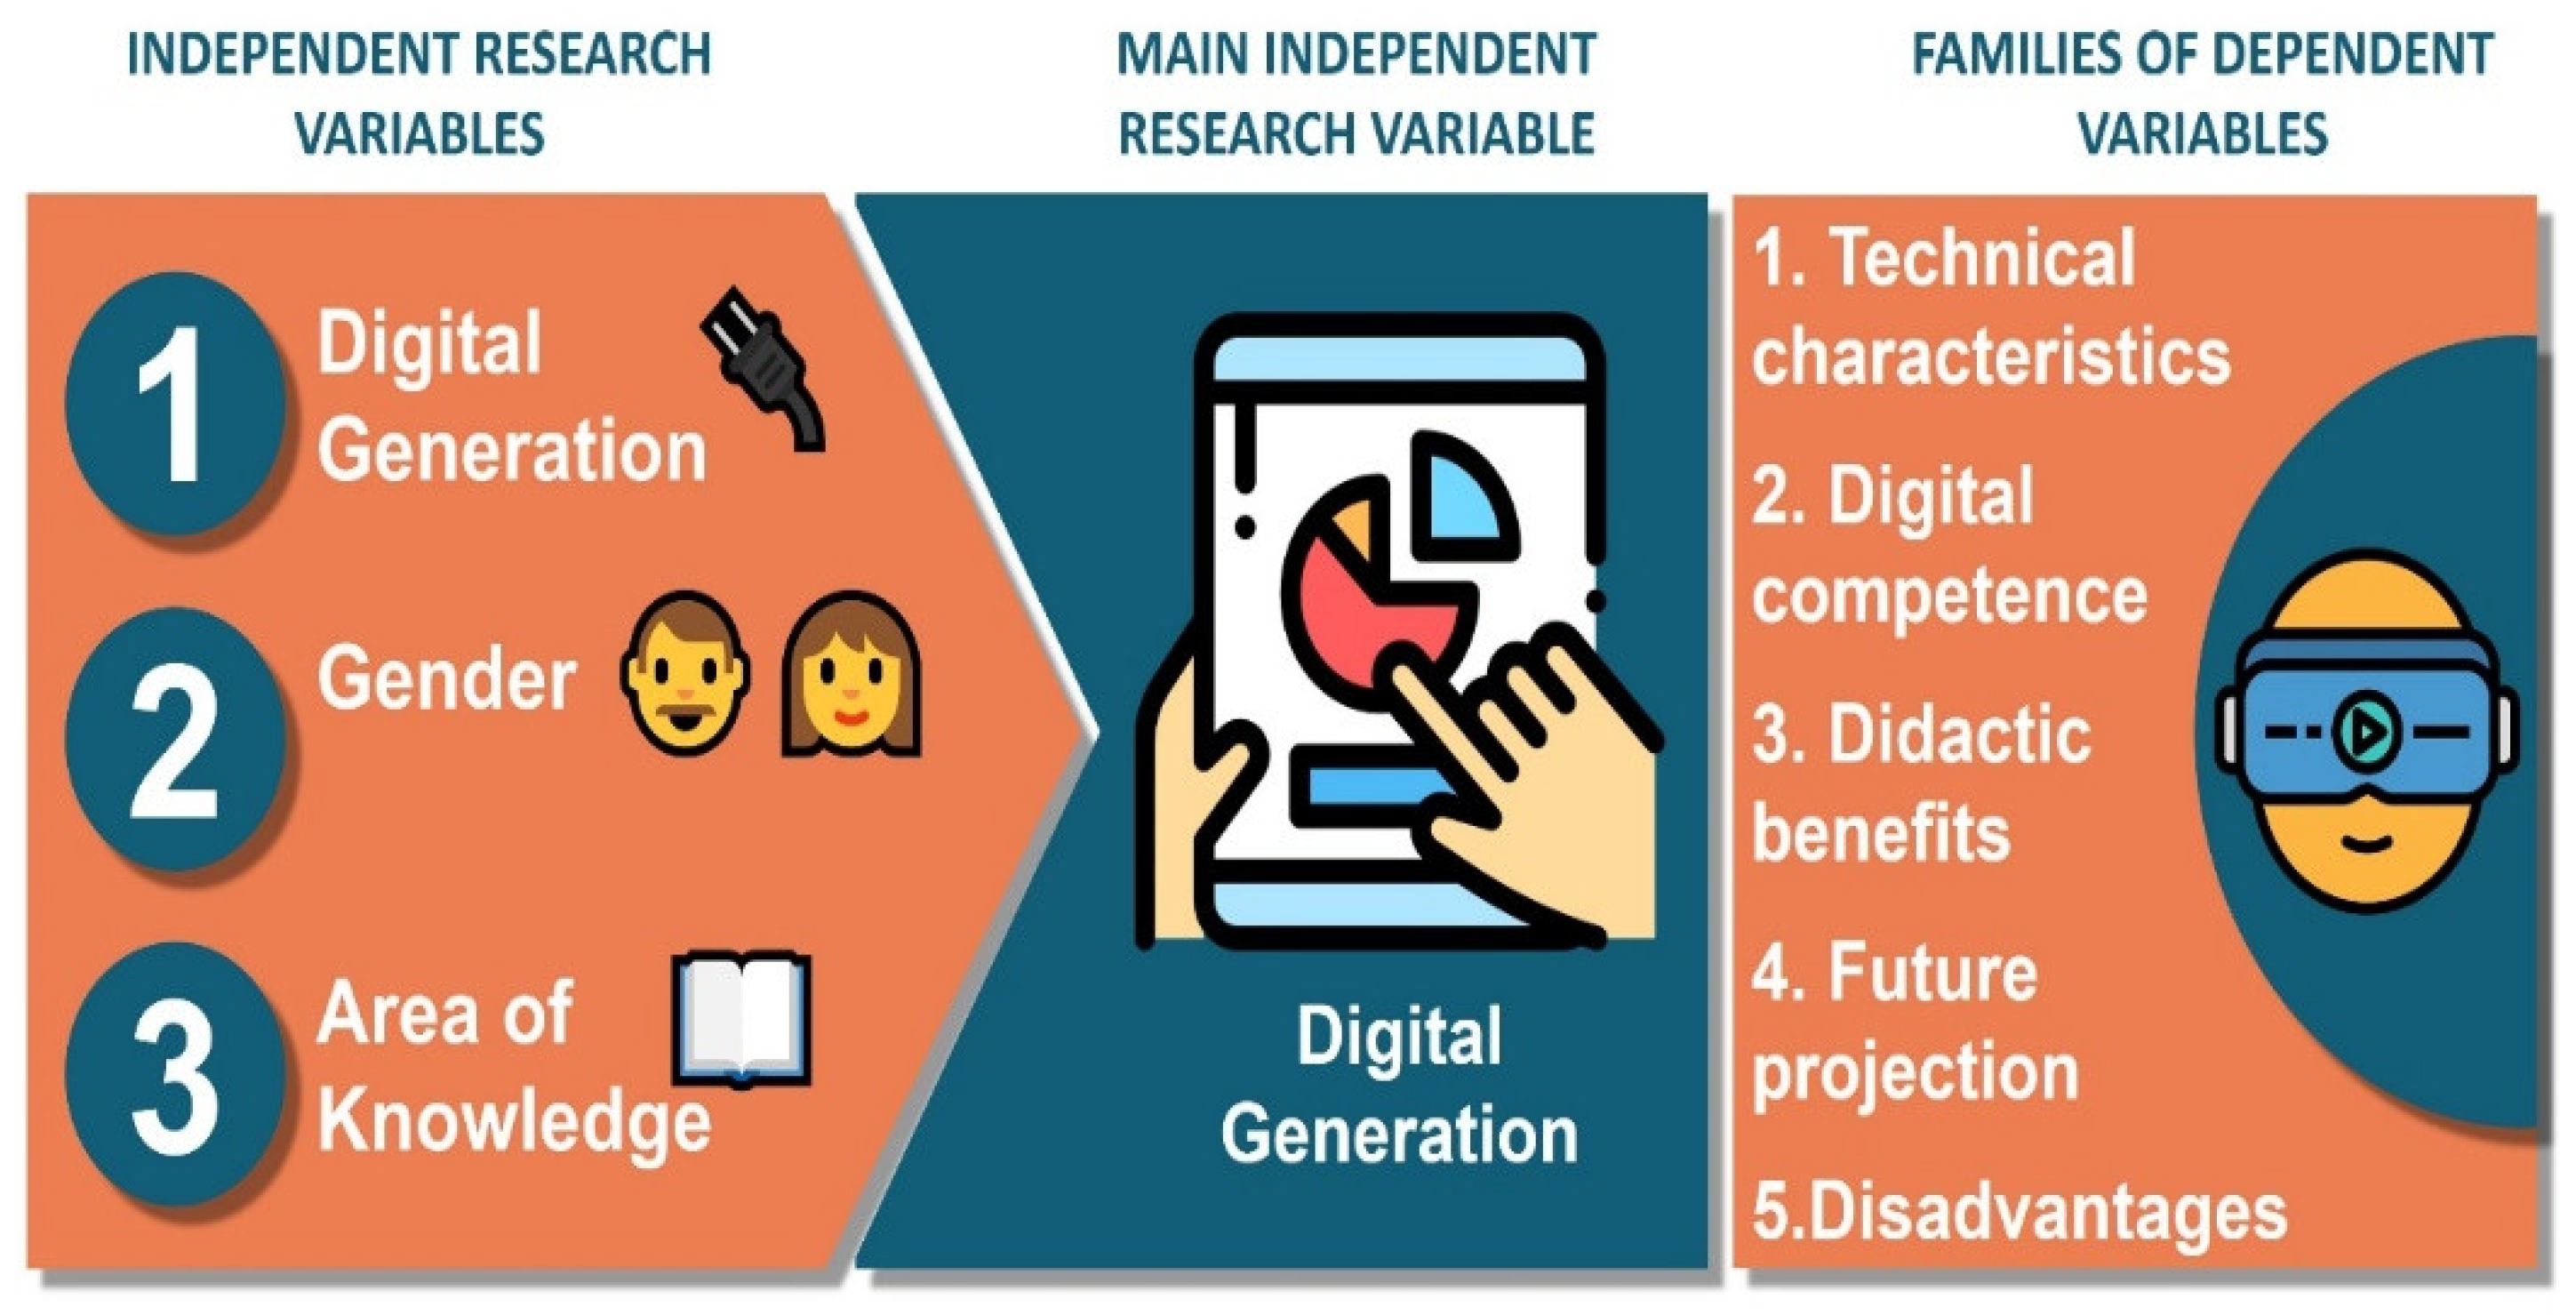
2.2. Objectives and Variables
2.3. Instrument
2.4. Procedure
3. Results
3.1. Distribution of Participants According to the Independent Variables
3.2. Validation of the Survey
3.3. Analysis of the Answers
4. Discussion
5. Conclusions
Author Contributions
Funding
Institutional Review Board Statement
Informed Consent Statement
Data Availability Statement
Conflicts of Interest
References
- Dixon, S. A history of virtual reality in performance. Int. J. Perform. Arts Digit. Media 2006, 2, 23–54. [Google Scholar] [CrossRef]
- Guttentag, D.A. Virtual reality: Applications and implications for tourism. Tour. Manag. 2010, 31, 637–651. [Google Scholar] [CrossRef]
- Kavanagh, S.; Luxton-Reilly, A.; Wuensche, B.; Plimmer, B. A systematic review of virtual reality in education. Themes Sci. Technol. Educ. 2017, 10, 85–119. [Google Scholar]
- Kamari, A.; Paari, A.; Torvund, H.Ø. BIM-Enabled virtual reality (VR) for sustainability life cycle and cost assessment. Sustainability 2021, 13, 249. [Google Scholar] [CrossRef]
- Rizzo, A.A.; Schultheis, M.; Kerns, K.A.; Mateer, C. Analysis of assets for virtual reality applications in neuropsychology. Neuropsychol. Rehabil. 2004, 14, 207–239. [Google Scholar] [CrossRef]
- Camp, J.J.; Cameron, B.M.; Blezek, D.; Robb, R.A. Virtual reality in medicine and biology. Future Gener. Comput. Syst. 1998, 14, 91–108. [Google Scholar] [CrossRef]
- Guillén, V.; Baños, R.M.; Botella, C. Users’ opinion about a virtual reality system as an adjunct to psychological treatment for stress-related disorders: A quantitative and qualitative mixed-methods study. Front. Psychol. 2018, 9, 1038. [Google Scholar] [CrossRef]
- Safikhani, S.; Keller, S.; Schweiger, G.; Pirker, J. Immersive virtual reality for extending the potential of building information modeling in architecture, engineering, and construction sector: Systematic review. Int. J. Digit. Earth 2022, 15, 503–526. [Google Scholar] [CrossRef]
- Grau, O. Virtual Art: From Illusion to Immersion; Massachusetts Institute of Technology: Cambridge, MA, USA, 2003. [Google Scholar]
- Zhang, H. Head-mounted display-based intuitive virtual reality training system for the mining industry. Int. J. Min. Sci. Technol. 2017, 27, 717–722. [Google Scholar] [CrossRef]
- Grabowski, A.; Jankowski, J. Virtual reality-based pilot training for underground coal miners. Saf. Sci. 2015, 72, 310–314. [Google Scholar] [CrossRef]
- Van Dongen, K.W.; van der Wal, W.A.; Rinkes, I.H.M.B.; Schijven, M.P.; Broeders, I.A.M.J. Virtual reality training for endoscopic surgery: Voluntary or obligatory? Surg. Endosc. 2008, 22, 664–667. [Google Scholar] [CrossRef]
- Vaughan, N.; Dubey, V.N.; Wainwright, T.W.; Middleton, R.G. Does virtual-reality training on orthopaedic simulators improve performance in the operating room? In Proceedings of the Science and Information Conference (SAI), London, UK, 28–30 July 2015; pp. 51–54. [Google Scholar] [CrossRef]
- Extremera, J.; Vergara, D.; Dávila, L.P.; Rubio, M.P. Virtual and augmented reality environments to learn the fundamentals of crystallography. Crystals 2020, 10, 456. [Google Scholar] [CrossRef]
- Luo, H.; Li, G.; Feng, Q.; Yang, Y.; Zuo, M. Virtual reality in K-12 and higher education: A systematic review of the literature from 2000 to 2019. J. Comput. Assist. Learn. 2021, 37, 887–901. [Google Scholar] [CrossRef]
- Chien, S.Y.; Hwang, G.J.; Jong, M.S.Y. Effects of peer assessment within the context of spherical video-based virtual reality on EFL students’ English-Speaking performance and learning perceptions. Comput. Educ. 2020, 149, 103751. [Google Scholar] [CrossRef]
- Domingo, J.R.; Bradley, E.G. Education student perceptions of virtual reality as a learning tool. J. Educ. Technol. Syst. 2018, 46, 329–342. [Google Scholar] [CrossRef]
- Hagge, P. Student perceptions of semester-long in-class virtual reality: Effectively using “Google Earth VR” in a higher education classroom. J. Geogr. High. Educ. 2021, 45, 342–360. [Google Scholar] [CrossRef]
- Zackoff, M.W.; Real, F.J.; Cruse, B.; Davis, D.; Klein, M. Medical student perspectives on the use of immersive virtual reality for clinical assessment training. Acad. Pediatrics 2019, 19, 849–851. [Google Scholar] [CrossRef]
- Udeozor, C.; Toyoda, R.; Russo-Abegão, F.; Glassey, J. Perceptions of the use of virtual reality games for chemical engineering education and professional training. High. Educ. Pedagog. 2021, 6, 175–194. [Google Scholar] [CrossRef]
- Sukotjo, C.; Schreiber, S.; Li, J.; Zhang, M.; Chia-Chun Yuan, J.; Santoso, M. Development and student perception of virtual reality for implant surgery. Educ. Sci. 2021, 11, 176. [Google Scholar] [CrossRef]
- Baxter, G.; Hainey, T. Student perceptions of virtual reality use in higher education. J. Appl. Res. High. Educ. 2020, 12, 413–424. [Google Scholar] [CrossRef]
- Ben-Gal, G.; Weiss, E.I.; Gafni, N.; Ziv, A. Preliminary assessment of faculty and student perception of a haptic virtual reality simulator for training dental manual dexterity. J. Dent. Educ. 2011, 75, 496–504. [Google Scholar] [CrossRef]
- Chen, K.H. Teachers’ perceptions of exploiting immersive virtual field trips for learning in primary education. J. Res. Technol. Educ. 2021. [Google Scholar] [CrossRef]
- Vergara, D.; Antón-Sancho, A.; Extremera, J.; Fernández-Arias, P. Assessment of virtual reality as a didactic resource in higher education. Sustainability 2021, 13, 12730. [Google Scholar] [CrossRef]
- Vergara, D.; Antón-Sancho, A.; Dávila, L.P.; Fernández-Arias, P. Virtual reality as a didactic resource from the perspective of engineering teachers. Comput. Appl. Eng. Educ. 2022, 1, 1–16. [Google Scholar] [CrossRef]
- Huang, W.; Roscoe, R.D. Head-mounted display-based virtual reality systems in engineering education: A review of recent research. Comput. Appl. Eng. Educ. 2021, 29, 1420–1435. [Google Scholar] [CrossRef]
- Matome, T.J.; Jantjies, M. Student perceptions of virtual reality in higher education. In Balancing the Tension between Digital Technologies and Learning Sciences; Cognition and Exploratory Learning in the Digital Age; Ifenthaler, D., Sampson, D.G., Isaías, P., Eds.; Springer: Cham, Switzerland, 2021. [Google Scholar] [CrossRef]
- Antón-Sancho, Á.; Vergara, D.; Fernández-Arias, P. Self-assessment of soft skills of university teachers from countries with a low level of digital competence. Electronics 2021, 10, 2532. [Google Scholar] [CrossRef]
- Fernández-Arias, P.; Antón-Sancho, Á.; Vergara, D.; Barrientos, A. Soft skills of American university teachers: Self-concept. Sustainability 2021, 13, 12397. [Google Scholar] [CrossRef]
- Pettersson, F. On the issues of digital competence in educational contexts—A review of literature. Educ. Inf. Technol. 2018, 23, 1005–1021. [Google Scholar] [CrossRef]
- Zhao, Y.; Pinto, A.M.; Sánchez, M.C. Digital competence in higher education research: A systematic literature review. Comput. Educ. 2021, 168, 104212. [Google Scholar] [CrossRef]
- Vergara-Rodríguez, D.; Antón-Sancho, Á.; Fernández-Arias, P. Variables influencing professors’ adaptation to digital learning environments during the COVID-19 pandemic. Int. J. Environ. Res. Public Health 2022, 19, 3732. [Google Scholar] [CrossRef]
- Prensky, M. Digital natives, digital immigrants, part 1. Horizon 2001, 9, 3–6. [Google Scholar] [CrossRef]
- Prensky, M. Digital natives, digital immigrants, part 2: Do they really think differently? Horizon 2001, 9, 3–16. [Google Scholar] [CrossRef]
- Creighton, T.B. Digital natives, digital immigrants, digital learners: An international empirical integrative review of the literature. Ed. Leadersh. Rev. 2018, 19, 132–140. [Google Scholar]
- Nevin, A.D.; Shieman, S. Technological tethering, digital natives, and challenges in the work–family interface. Soc. Q. 2021, 62, 60–86. [Google Scholar] [CrossRef]
- Atadil, H.A.; Erdem, M.; Green, A.J.; Crinson, D. Digital natives in the hospitality workforce: An exploratory study on mobile dependency. J. Hosp. Mark. Manag. 2021, 30, 785–798. [Google Scholar] [CrossRef]
- Guntara, Y.; Utami, I.S. Measuring the classification of digital natives use digital natives assessment scale: The implementation on pre-service physics teachers in Banten-Indonesia and its implications. J. Penelit. Pengemb. Pendidik. Fis. 2021, 7, 161–168. [Google Scholar] [CrossRef]
- Kennedy, G.E.; Judd, T.S.; Churchward, A.; Gray, K.; Krause, K.L. First year students’ experiences with technology: Are they really digital natives? Australas. J. Educ. Technol. 2008, 24, 108–122. [Google Scholar] [CrossRef]
- Kemp, A.; Palmer, E.; Strelan, P. A taxonomy of factors affecting attitudes towards educational technologies for use with technology acceptance models. Br. J. Educ. Technol. 2019, 50, 2394–2413. [Google Scholar] [CrossRef]
- Zambianchi, M.; Carelli, M.G. Positive attitudes towards technologies and facets of well-being in older adults. J. Appl. Gerontol. 2018, 37, 371–388. [Google Scholar] [CrossRef]
- Fristedt, S.; Svärdh, S.; Löfqvist, C.; Schmidt, S.M.; Iwarsson, S. “Am I representative (of my age)? No, I’m not”—Attitudes to technologies and technology development differ but unite individuals across rather than within generations. PLoS ONE 2021, 16, e0250425. [Google Scholar] [CrossRef]
- Fortunati, L.; Taipale, S.; De-Luca, F. Digital generations, but not as we know them. Convergence 2019, 25, 95–112. [Google Scholar] [CrossRef]
- Margaryan, A.; Littlejohn, A.; Vojt, G. Are digital natives a myth or reality? University students’ use of digital technologies. Comp. Educ. 2011, 56, 429–440. [Google Scholar] [CrossRef]
- Romero-Tena, R.; Barragán-Sánchez, R.; Llorente-Cejudo, C.; Palacios-Rodríguez, A. The challenge of initial training for early childhood teachers. A cross sectional study of their digital competences. Sustainability 2020, 12, 4782. [Google Scholar] [CrossRef]
- Elphick, M. The impact of embedded iPad use on student perceptions of their digital capabilities. Educ. Sci. 2018, 8, 102. [Google Scholar] [CrossRef]
- Wyss, C.; Degonda, A.; Bührer, W.; Furrer, F. The impact of student characteristics for working with AR technologies in higher education—Findings from an exploratory study with Microsoft HoloLens. Information 2022, 13, 112. [Google Scholar] [CrossRef]
- Lei, J. Digital natives as preservice teachers: What technology preparation is needed? J. Comput. Teach. Educ. 2009, 25, 87–97. Available online: https://eric.ed.gov/?id=EJ835233 (accessed on 12 May 2022).
- Belda-Medina, J.; Calvo-Ferrer, J.R. Preservice teachers’ knowledge and attitudes toward digital-game-based language learning. Educ. Sci. 2022, 12, 182. [Google Scholar] [CrossRef]
- Gutiérrez, I.; Serrano, J.L. Evaluation and development of digital competence in future primary school teachers at the university of Murcia. J. New Approaches Educ. Res. 2016, 5, 51–56. [Google Scholar] [CrossRef]
- UNESCO Institute for Statistics. International Standard Classification of Education ISCED 2011; UNESCO-UIS: Montreal, QC, Canada, 2012; Available online: http://uis.unesco.org/sites/default/files/documents/international-standard-classification-of-education-isced-2011-en.pdf (accessed on 11 May 2022).
- Schmitt, T.A. Current methodological considerations in exploratory and confirmatory factor analysis. J. Psychoeduc. Assess. 2011, 29, 304–321. [Google Scholar] [CrossRef]
- Streiner, D.L. Starting at the beginning: An introduction to coefficient alpha and internal consistency. J. Personal. Assess. 2003, 80, 99–103. [Google Scholar] [CrossRef]
- Al-Farsi, G.; Bin-Mohd-Yusof, A.; Binti-Fauzi, W.J.; Bin-Rusli, M.E.; Malik, S.I.; Tawafak, R.M.; Mathew, R.; Jabbar, J. The practicality of virtual reality applications in education: Limitations and recommendations. J. Hunan Univ. Nat. Sci. 2021, 48, 142–155. [Google Scholar]
- Guillén-Gámez, F.D.; Mayorga-Fernández, M.J. Quantitative-comparative research on digital competence in students, graduates and professors of faculty education: An analysis with ANOVA. Educ. Inf. Technol. 2020, 25, 4157–4174. [Google Scholar] [CrossRef]
- Zhao, Y.; Pinto Llorente, A.M.; Sánchez Gómez, M.C. An empirical study of students and teaching staff’s digital competence in western China: Based on a case study of Gansu Agricultural University. In Proceedings of the 7th International Conference on Technological Ecosystems for Enhancing Multiculturality (TEEM’19), Leon, Spain, 16–18 October 2019; Association for Computing Machinery: New York, NY, USA, 2019; pp. 1012–1019. [Google Scholar] [CrossRef]
- Núñez-Canal, M.; Obesso, M.M.; Pérez-Rivero, C.A. New challenges in higher education: A study of the digital competence of educators in Covid times. Technol. Forecast. Soc. Chang. 2022, 174, 121270. [Google Scholar] [CrossRef]
- Santos, C.; Pedro, N.; Mattar, J. Digital competence of higher education professors: Analysis of academic and institutional factors. Obra Digit. 2021, 21, 69–92. [Google Scholar] [CrossRef]
- Maderick, J.A.; Zhang, S.; Hartley, K.; Marchand, G. Preservice teachers and self-assessing digital competence. J. Educ. Comput. Res. 2016, 54, 326–351. [Google Scholar] [CrossRef]
- Castaneda, L.M.; Bindman, S.W.; Divanji, R.A. Don’t forget to assess: How teachers check for new and deeper learning when integrating virtual reality in the classroom. J. Res. Technol. Educ. 2021. [Google Scholar] [CrossRef]
- Lamb, R.; Etopio, E.A. Virtual reality: A tool for preservice science teachers to put theory into practice. J. Sci. Educ. Technol. 2020, 29, 573–585. [Google Scholar] [CrossRef]
- Basantes-Andrade, A.; Cabezas-González, M.; Casillas-Martín, S. Digital competences relationship between gender and generation of university professors. Int. J. Adv. Sci. Engin. Inform. Technol. 2020, 10, 205–211. Available online: https://knowledgesociety.usal.es/system/files/10806-23237-1-PB%20%285%29.pdf (accessed on 20 March 2022). [CrossRef]
- Kinci, T.; Strach, P. Born digital: Is there going to be a new culture of digital natives? J. Glob. Sch. Mark. Sci. 2021, 31, 30–48. [Google Scholar] [CrossRef]
- Wang, S.K.; Hsu, H.Y.; Campbell, T.; Coster, D.C.; Longhurst, M. An investigation of middle school science teachers and students use of technology inside and outside of classrooms: Considering whether digital natives are more technology savvy than their teachers. Educ. Technol. Res. Dev. 2014, 62, 637–662. [Google Scholar] [CrossRef]
- Orlando, J.; Attard, C. Digital natives come of age: The reality of today’s early career teachers using mobile devices to teach mathematics. Math. Ed. Res. J. 2016, 28, 107–121. [Google Scholar] [CrossRef]
- Guillén-Gámez, F.D.; Cabero-Almenara, J.; Llorente-Cejudo, C.; Palacios-Rodríguez, A. Differential analysis of the years of experience of higher education teachers, their digital competence and use of digital resources: Comparative research methods. Technol. Knowl. Learn. 2021. [Google Scholar] [CrossRef]
- Guillén-Gámez, F.D.; Mayorga-Fernández, M.J.; Bravo-Agapito, J.; Escribano-Ortiz, D. Analysis of teachers’ pedagogical digital competence: Identification of factors predicting their acquisition. Technol. Knowl. Learn. 2021, 26, 481–498. [Google Scholar] [CrossRef]
- Hong, J.C.; Hwang, M.Y.; Tai, K.H.; Tsai, C.R. Effects of gender and age on learning spatial concepts from a virtual reality game. In Proceedings of the 2018 IEEE International Conference on Teaching, Assessment, and Learning for Engineering (TALE), Wollongong, NSW, Australia, 4–7 December 2018; pp. 1206–1207. [Google Scholar] [CrossRef]
- Abich IV, J.; Parker, J.; Murphy, J.S.; Eudy, M. A review of the evidence for training effectiveness with virtual reality technology. Virtual Real. 2021, 25, 919–933. [Google Scholar] [CrossRef]
- Vergara, D.; Extremera, J.; Rubio, M.P.; Dávila, L.P. The proliferation of virtual laboratories in educational fields. ADCAIJ Adv. Distrib. Comput. Artif. Intell. J. 2020, 9, 85–97. [Google Scholar] [CrossRef]
- Vergara, D.; Fernández-Arias, P.; Extremera, J.; Dávila, L.P.; Rubio, M.P. Educational trends post COVID-19 in engineering: Virtual laboratories. Mater. Today Proc. 2022, 49, 155–160. [Google Scholar] [CrossRef] [PubMed]
- Mirauda, D.; Capece, N.; Erra, U. StreamflowVL: A virtual fieldwork laboratory that supports traditional hydraulics engineering learning. Appl. Sci. 2019, 9, 4972. [Google Scholar] [CrossRef]
- Mahdi, H.; Al-Dera, A.S. The impact of teachers’ age, gender and experience on the use of Information and Communication Technology in EFL teaching. Engl. Lang. Teach. 2013, 6, 57. [Google Scholar] [CrossRef]
- Sanchez-Sepulveda, M.V.; Torres-Kompen, R.; Fonseca, D.; Franquesa-Sanchez, J. Methodologies of learning served by virtual reality: A case study in urban interventions. Appl. Sci. 2019, 9, 5161. [Google Scholar] [CrossRef]
- Fonseca, D.; Sanchez-Sepúlveda, M.; Necchi, S.; Peña, E.; Marti, N.; Villagrasa, S.; Redondo, E.; Franquesa, J.; Navarro, I. What is happening in the process of engaging architectural students and teachers for including virtual and interactive systems in the projects developments? In Proceedings of the Eighth International Conference on Technological Ecosystems for Enhancing Multiculturality (TEEM’20), Salamanca, Spain, 21–23 October 2020; Association for Computing Machinery: New York, NY, USA, 2020; pp. 775–783. [Google Scholar] [CrossRef]
- Dayarathna, V.L.; Karam, S.; Jaradat, R.; Hamilton, M.A.; Nagahi, M.; Joshi, S.; Ma, J.; Ashour, O.; Driouche, B. Assessment of the efficacy and effectiveness of virtual reality teaching module: A gender-based comparison. Int. J. Eng. Educ. 2020, 36, 1938–1955. [Google Scholar]
- Friedman, E.J. The reality of virtual reality: The internet and gender equality advocacy in Latin America. Lat. Am. Politics Soc. 2005, 47, 1–34. [Google Scholar] [CrossRef]
- Marks, B.; Thomas, J. Adoption of virtual reality technology in higher education: An evaluation of five teaching semesters in a purpose-designed laboratory. Educ. Inf. Technol. 2022, 27, 1287–1305. [Google Scholar] [CrossRef] [PubMed]


| Family of Variables | Question Number | Dependent Variable |
|---|---|---|
| Assessment of the following technical aspects of VR | Question 1 | Interaction |
| Question 2 | User experience | |
| Question 3 | Usability | |
| Question 4 | 3D design | |
| Question 5 | Degree of immersion | |
| Question 6 | Realism | |
| Self-concept on the following dimensions of the competence on the use of VR | Question 7 | Digital competence |
| Question 8 | Training received on VR | |
| Question 9 | VR knowledge | |
| Assessment of the following didactic aspects of VR | Question 10 | Academic performance |
| Question 11 | Student motivation | |
| Question 12 | Course progress | |
| VR future forecast | Question 13 | Immersive Virtual Reality (IVR) |
| Question 14 | Non-Immersive Virtual Reality (NIVR) | |
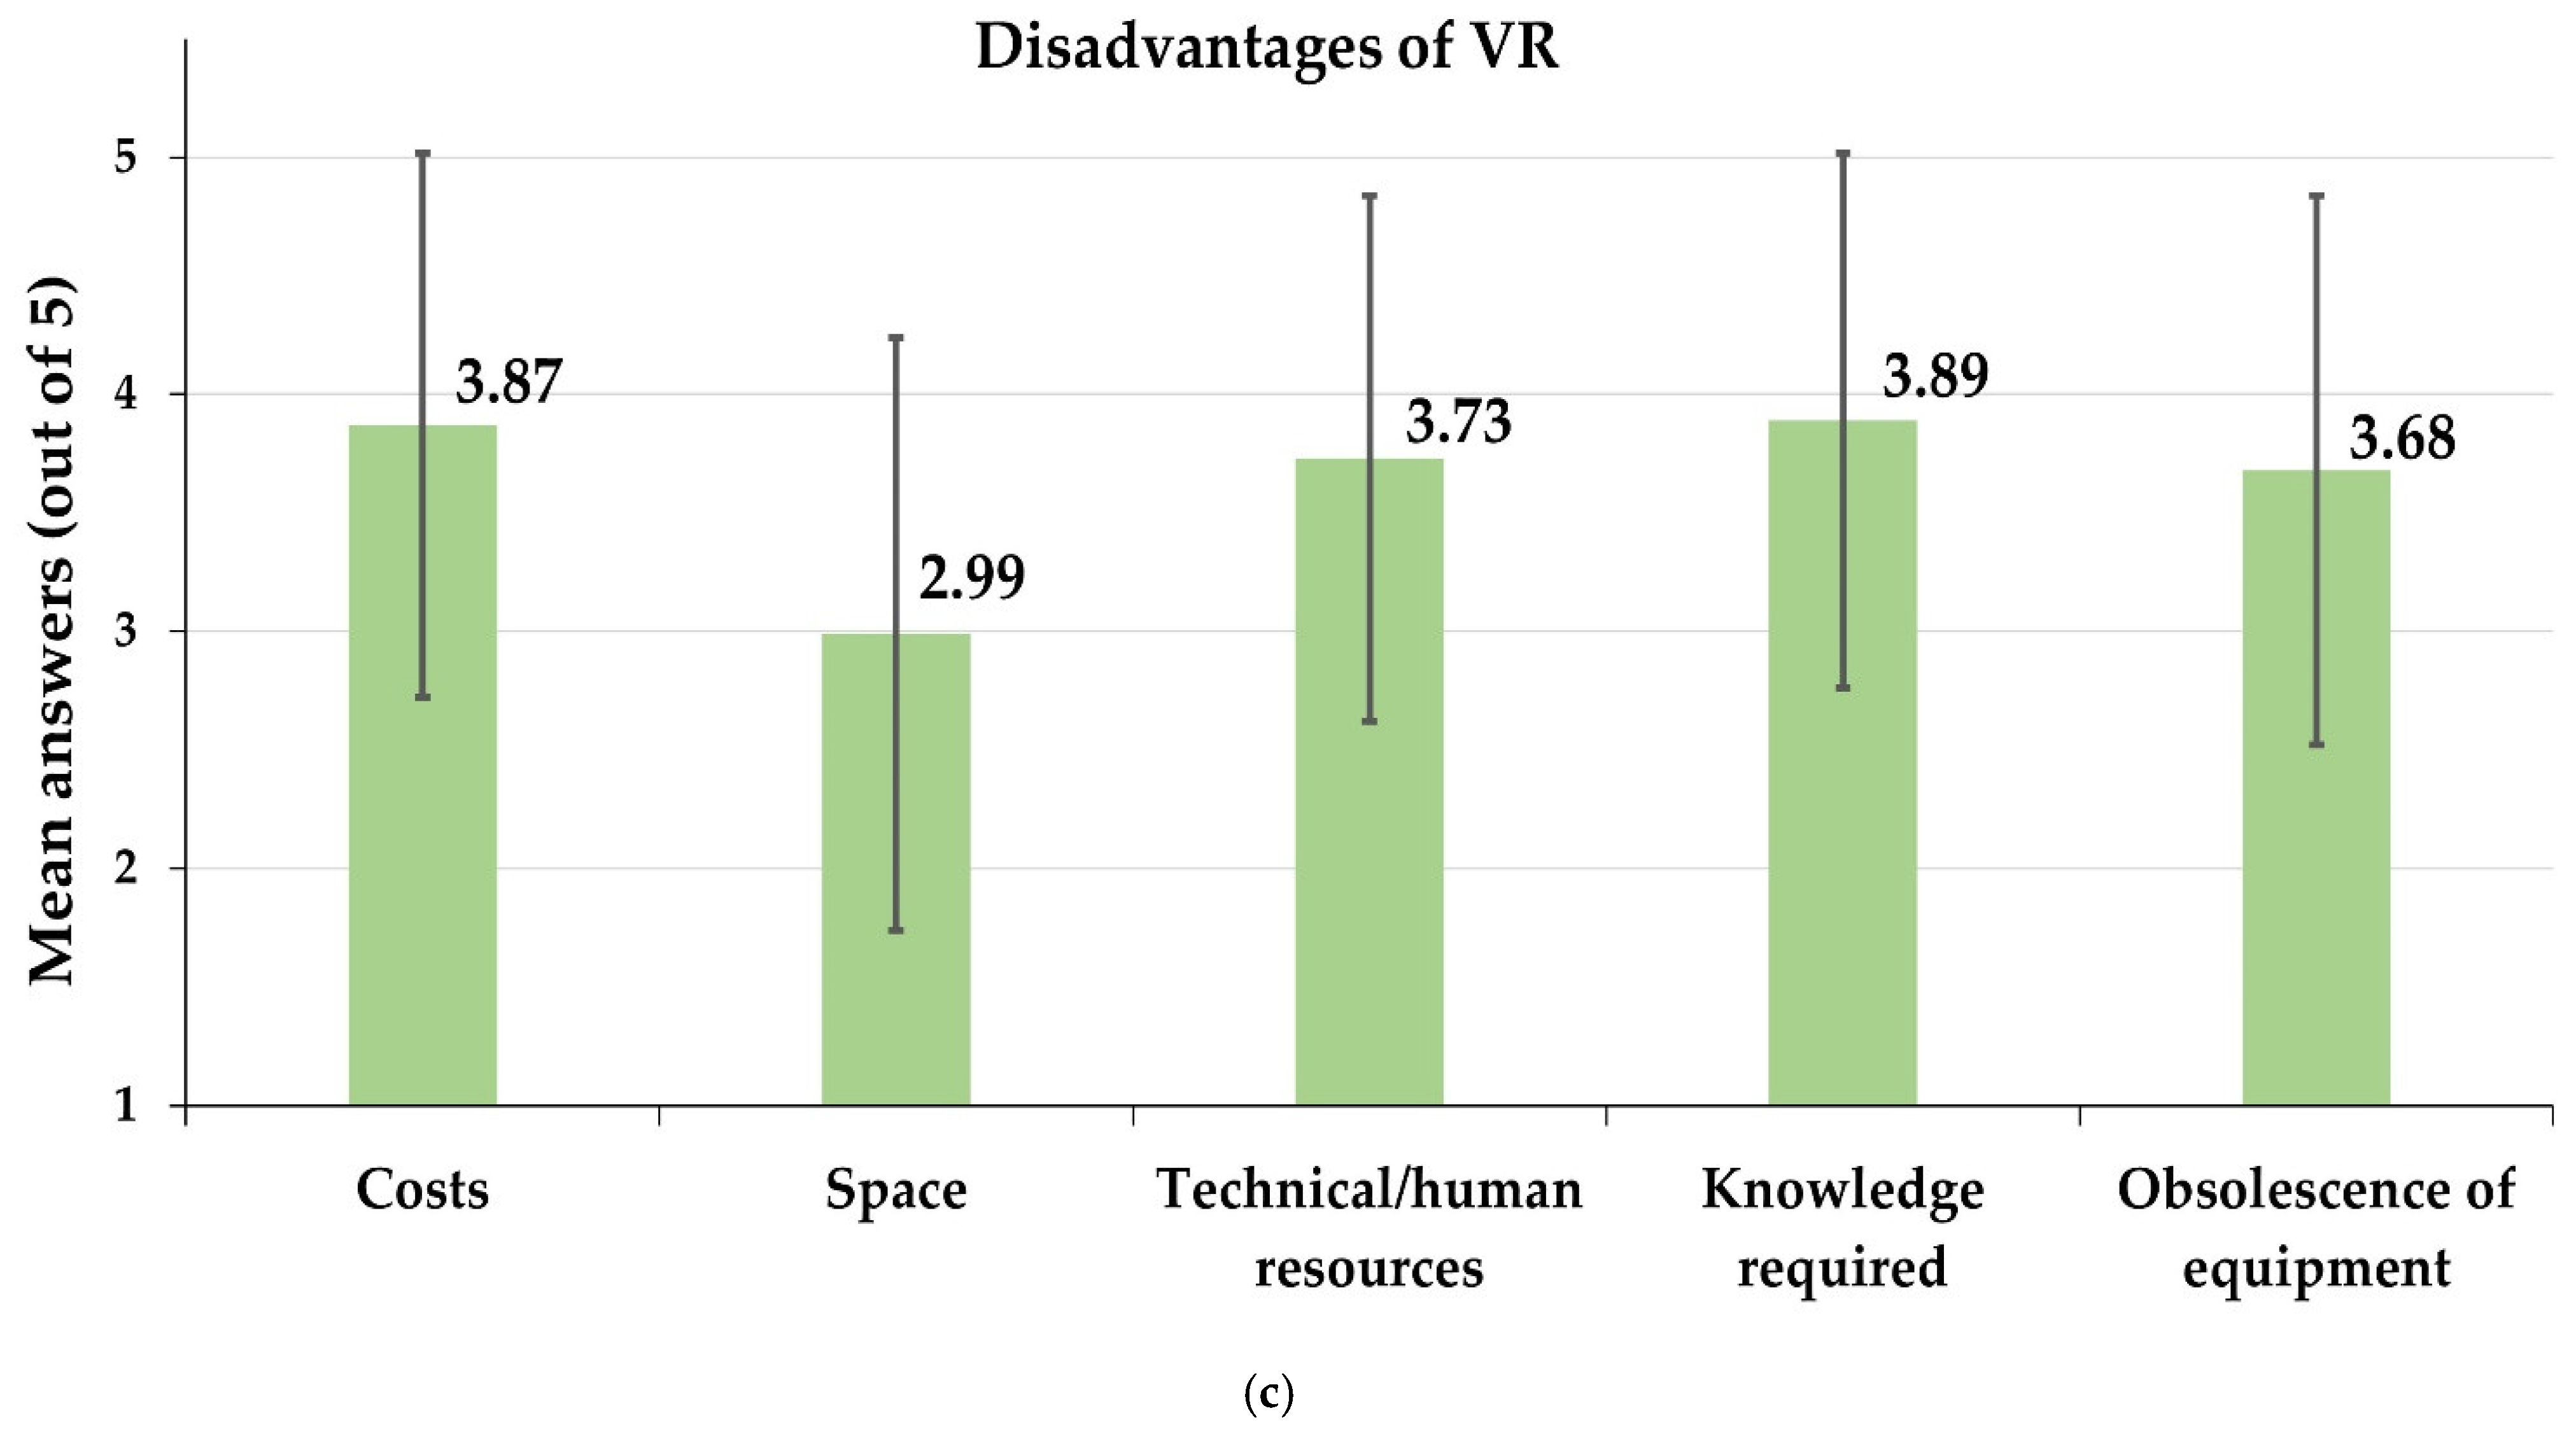
| Disadvantages of VR | Question 15 | Costs |
| Question 16 | Space required | |
| Question 17 | Scarcity of resources | |
| Question 18 | Lack of knowledge of the professor | |
| Question 19 | Technological obsolescence |
| Immigrants (%) | Natives (%) | Pearson’s Chi-Square | Pearson’s p-Value | Fisher’s p-Value | ||
|---|---|---|---|---|---|---|
| Gender | Males | 62.2 | 37.6 | 11.865 | 0.0006 * | 0.0006 * |
| Females | 57.0 | 43.0 | ||||
| Area of knowledge | Scientific-technical | 60.9 | 39.1 | 4.9120 | 0.0267 * | 0.0277 * |
| Humanistic-social | 57.6 | 42.4 |
| Question | Factor 1. Technical Aspects of VR | Factor 2. Competence on VR | Factor 3. Didactic Aspects of VR | Factor 4. VR Future Forecast | Factor 5. Disadvantages of VR |
|---|---|---|---|---|---|
| Q. 1 | 0.729 | ||||
| Q. 2 | 0.612 | ||||
| Q. 3 | 0.644 | ||||
| Q. 4 | 0.804 | ||||
| Q. 5 | 0.640 | ||||
| Q. 6 | 0.733 | ||||
| Q. 7 | 0.849 | ||||
| Q. 8 | 0.776 | ||||
| Q. 9 | 0.605 | ||||
| Q. 10 | 0.714 | ||||
| Q. 11 | 0.779 | ||||
| Q. 12 | 0.796 | ||||
| Q. 13 | 0.793 | ||||
| Q. 14 | 0.740 | ||||
| Q. 15 | 0.620 | ||||
| Q. 16 | 0.763 | ||||
| Q. 17 | 0.819 | ||||
| Q. 18 | 0.679 | ||||
| Q. 19 | 0.614 |
| Factor 1 Technical Aspects | Factor 2 Competence | Factor 3 Didactic Aspects | Factor 4 Future | Factor 5 Disadvantages | |
|---|---|---|---|---|---|
| Proportion Variance | 0.277 | 0.112 | 0.098 | 0.086 | 0.069 |
| Cumulative Variance | 0.277 | 0.389 | 0.487 | 0.573 | 0.642 |
| Technical | Competence | Didactic | Future | Disadvantages | Global | |
|---|---|---|---|---|---|---|
| Technical | 1 | 0.1097 | 0.2965 | 0.2918 | 0.1807 | 0.8261 |
| Competence | 1 | 0.0834 | 0.0611 | 0.0263 | 0.5872 | |
| Didactic | 1 | 0.3146 | 0.0077 | 0.7936 | ||
| Future | 1 | 0.1611 | 0.6820 | |||
| Disadvantages | 1 | 0.7078 | ||||
| Global | 1 |
| Subscale | Cronbach’s Alpha | CR | AVE |
|---|---|---|---|
| Technical aspects of VR | 0.8842 | 0.8709 | 0.6310 |
| Competence on VR | 0.7590 | 0.7511 | 0.5417 |
| Didactic aspects of VR | 0.8655 | 0.8525 | 0.6184 |
| VR future forecast | 0.8048 | 0.7937 | 0.5972 |
| Disadvantages of VR | 0.8015 | 0.7918 | 0.5926 |
| Mean Values | Standard Deviations | |
|---|---|---|
| Technical aspects of VR | 4.12 | 0.94 |
| Competence on VR | 2.74 | 1.18 |
| Didactic aspects of VR | 4.23 | 0.83 |
| VR future forecast | 3.78 | 1.00 |
| Disadvantages of VR | 3.63 | 1.21 |
| Digital Immigrants | Digital Natives | t | p-Value | |
|---|---|---|---|---|
| Technical aspects of VR | 4.10 | 4.16 | 4.4131 | 0.0357 * |
| Competence on VR | 2.70 | 2.80 | 3.8829 | 0.0422 * |
| Didactic aspects of VR | 4.21 | 4.26 | 4.8417 | 0.0175 * |
| VR future forecast | 3.79 | 3.78 | 0.0062 | 0.9370 |
| Disadvantages of VR | 3.57 | 3.72 | 12.128 | 0.0005 * |
| Digital Immigrants | Digital Natives | Levene’s F | p-Value | |
|---|---|---|---|---|
| Technical aspects of VR | 0.94 | 0.92 | 4.4020 | 0.0360 * |
| Competence on VR | 1.15 | 1.21 | 1.3561 | 0.2444 |
| Didactic aspects of VR | 0.85 | 0.80 | 0.7919 | 0.3736 |
| VR future forecast | 1.04 | 0.95 | 4.3148 | 0.0379 * |
| Disadvantages of VR | 1.24 | 1.15 | 8.9765 | 0.0028 * |
| Males | Females | MANOVA | p-Value | |||
|---|---|---|---|---|---|---|
| Immigrants | Natives | Immigrants | Natives | |||
| Technical aspects of VR | 4.06 | 4.20 | 4.13 | 4.12 | 6.5722 | 0.0104 * |
| Competence on VR | 2.75 | 2.81 | 2.65 | 2.78 | 0.5149 | 0.4731 |
| Didactic aspects of VR | 4.19 | 4.31 | 4.22 | 4.22 | 2.4789 | 0.1156 |
| VR future forecast | 3.85 | 3.82 | 3.72 | 3.75 | 4.8102 | 0.0311 * |
| Disadvantages of VR | 3.54 | 3.75 | 3.59 | 3.69 | 1.6029 | 0.2056 |
| Scientific-Technical | Humanistic-Social | MANOVA | p-Value | |||
|---|---|---|---|---|---|---|
| Immigrants | Natives | Immigrants | Natives | |||
| Technical aspects of VR | 4.12 | 4.15 | 4.06 | 4.17 | 6.0228 | 0.0155 * |
| Competence on VR | 2.66 | 2.79 | 2.75 | 2.80 | 6.5873 | 0.0136 * |
| Didactic aspects of VR | 4.24 | 4.29 | 4.16 | 4.22 | 4.5114 | 0.0371 * |
| VR future forecast | 3.83 | 3.77 | 3.73 | 3.79 | 0.8752 | 0.3497 |
| Disadvantages of VR | 3.58 | 3.61 | 3.56 | 3.84 | 7.7943 | 0.0053 * |
Publisher’s Note: MDPI stays neutral with regard to jurisdictional claims in published maps and institutional affiliations. |
© 2022 by the authors. Licensee MDPI, Basel, Switzerland. This article is an open access article distributed under the terms and conditions of the Creative Commons Attribution (CC BY) license (https://creativecommons.org/licenses/by/4.0/).
Share and Cite
Antón-Sancho, Á.; Fernández-Arias, P.; Vergara, D. Assessment of Virtual Reality among University Professors: Influence of the Digital Generation. Computers 2022, 11, 92. https://doi.org/10.3390/computers11060092
Antón-Sancho Á, Fernández-Arias P, Vergara D. Assessment of Virtual Reality among University Professors: Influence of the Digital Generation. Computers. 2022; 11(6):92. https://doi.org/10.3390/computers11060092
Chicago/Turabian StyleAntón-Sancho, Álvaro, Pablo Fernández-Arias, and Diego Vergara. 2022. "Assessment of Virtual Reality among University Professors: Influence of the Digital Generation" Computers 11, no. 6: 92. https://doi.org/10.3390/computers11060092
APA StyleAntón-Sancho, Á., Fernández-Arias, P., & Vergara, D. (2022). Assessment of Virtual Reality among University Professors: Influence of the Digital Generation. Computers, 11(6), 92. https://doi.org/10.3390/computers11060092