Next Article in Journal
Medikamenten-freisetzende Ballonkatheter (Drug-Eluting Balloons) in der Behandlung der Koronaren Herzkrankheit
Previous Article in Journal
Natural History of Aortic Stenosis
 
 
Cardiovascular Medicine is published by MDPI from Volume 28 Issue 1 (2025). Previous articles were published by another publisher in Open Access under a CC-BY (or CC-BY-NC-ND) licence, and they are hosted by MDPI on mdpi.com as a courtesy and upon agreement with Editores Medicorum Helveticorum (EMH).
Article

Noninvasive Hemodynamic Monitoring by Transthoracic Impedance Cardiography During Different Ventricular Activation Sequences in CRT Patients

by
David Altmann
,
Beat Schaer
,
Robert Blank
,
Raban Jeger
,
Christian Sticherling
and
Stefan Osswald
*
Division of Cardiology, University of Basel Hospital, 4031 Basel, Switzerland
*
Author to whom correspondence should be addressed.
Cardiovasc. Med. 2010, 13(6), 208; https://doi.org/10.4414/cvm.2010.01506
Submission received: 30 March 2010 / Revised: 30 April 2010 / Accepted: 30 May 2010 / Published: 30 June 2010

Abstract

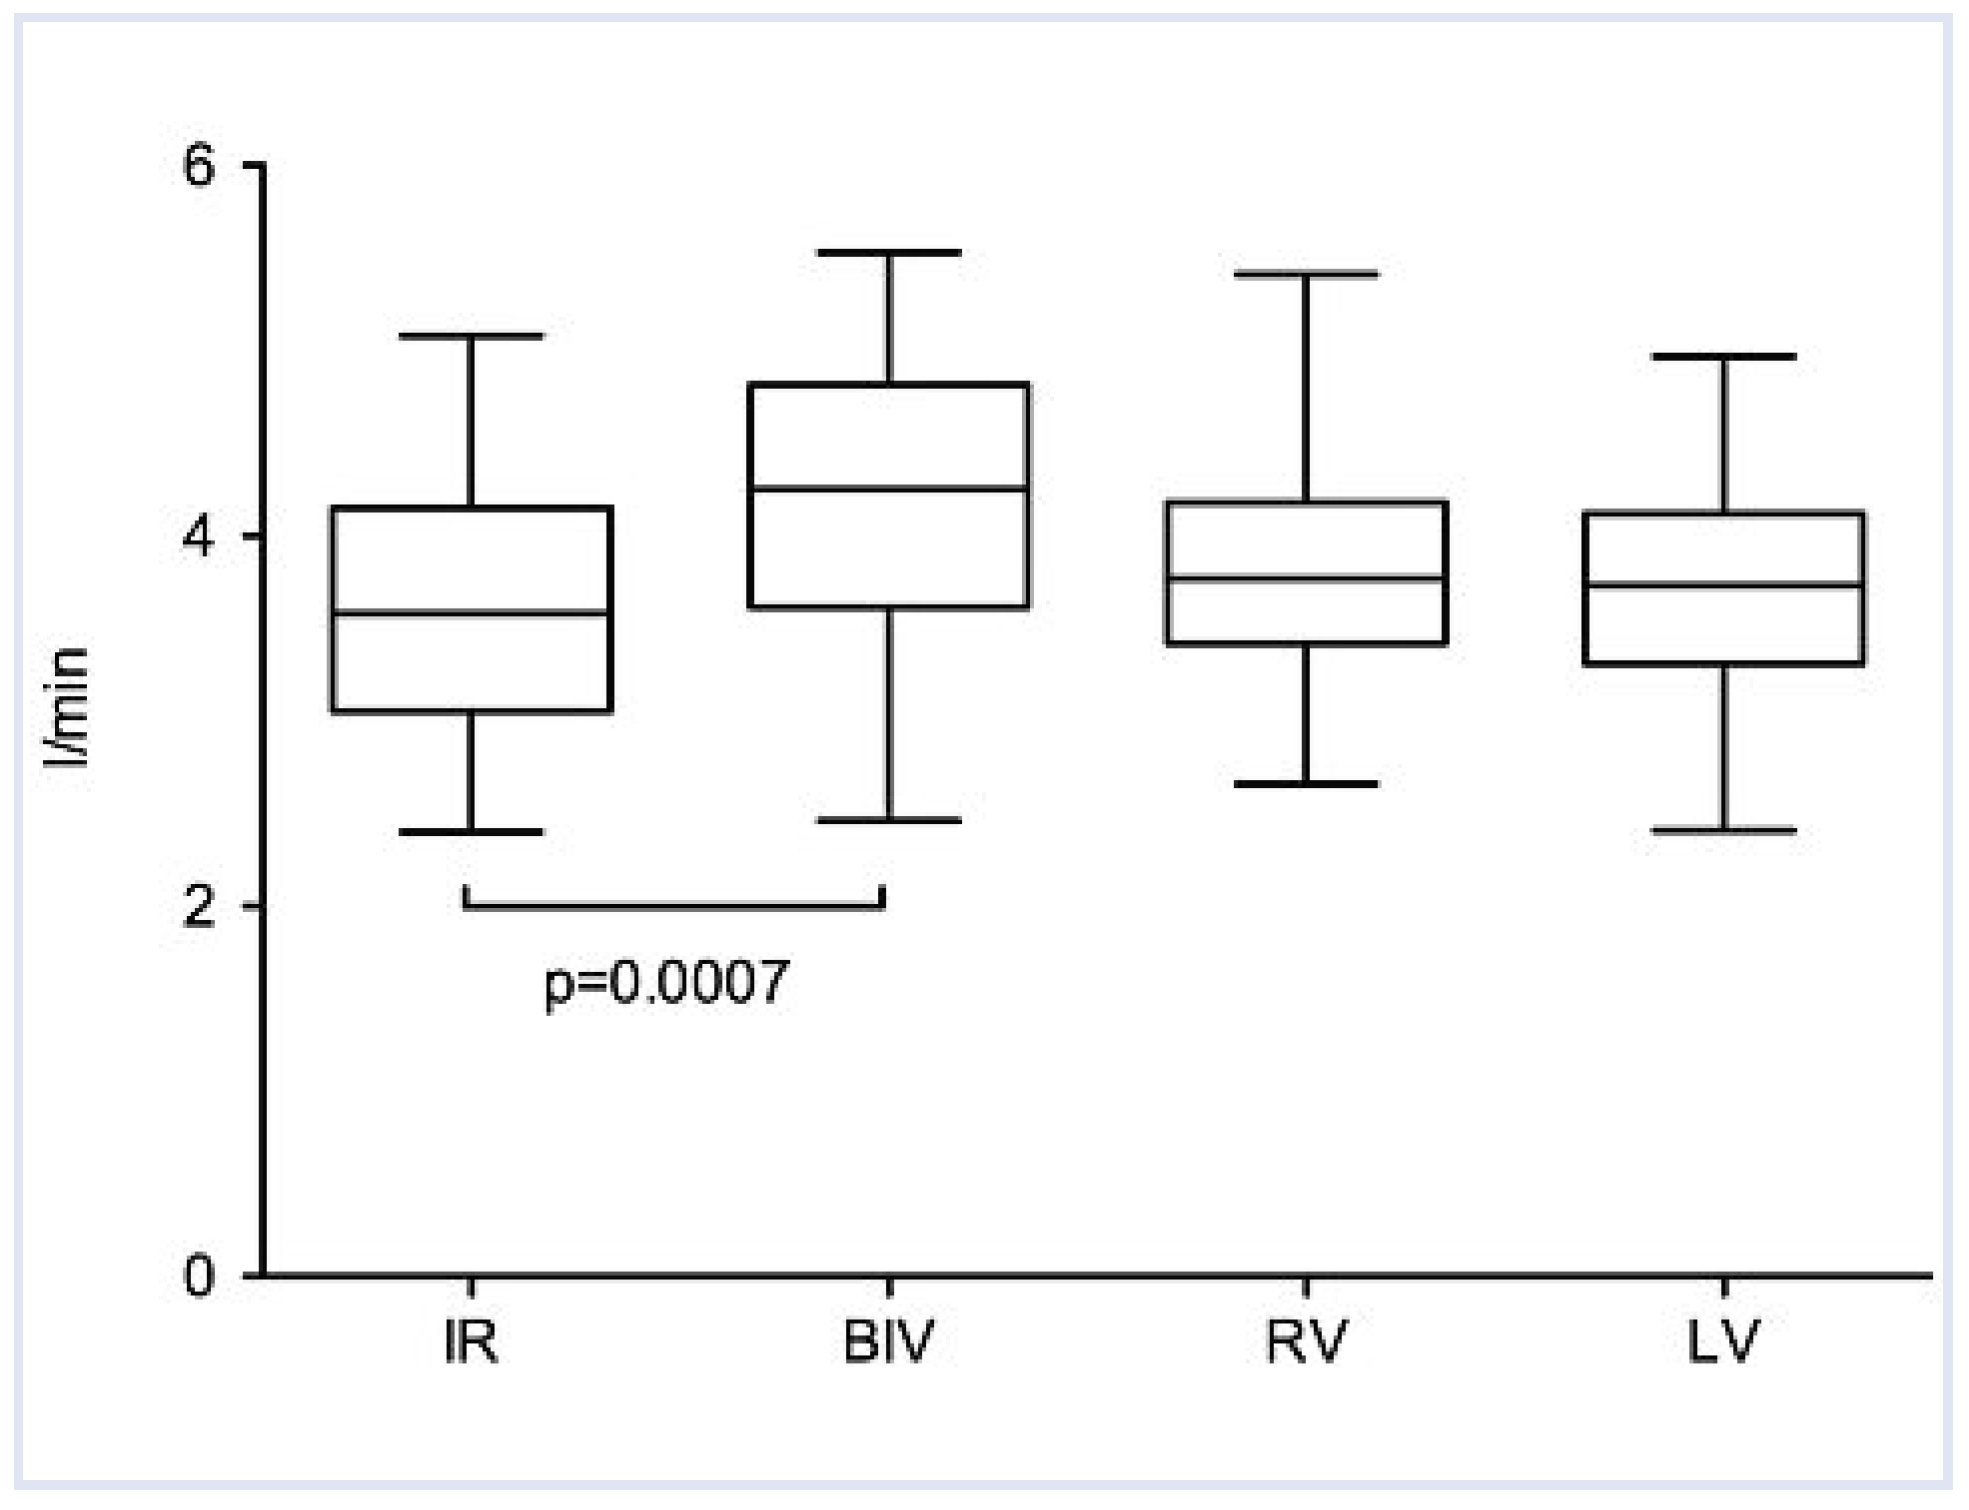
Background: Echocardiography-based programming of conduction delays in cardiac resynchronisation therapy is complex and time-consuming. Impedance cardiography (ICG) may be an alternative method. However, it is unknown whether ICG is sensitive enough to detect haemodynamic changes due to different pacing-induced ventricular activation modes. The aim of this study was to determine the ability of ICG to measure haemodynamic changes during different ventricular pacing modes in patients with a cardiac resynchronisation therapy (CRT). Methods: 18 patients were evaluated. Stroke volume (SV), cardiac output (CO) and total peripheral resistance (TPR) were measured by means of ICG. Continuous blood pressure (cBP) was recorded with the vascular unloading technique. Haemodynamic measurements of 10-min-sampling periods, taken in the supine position, were compared during biventricular (BIV), right (RV) and left ventricular (LV) pacing and intrinsic rhythm (IR). Results: One patient was excluded from the analysis (serious haemodynamic deterioration during IR). The age of the study population was 67 ± 10 years (94% male) with a LV ejection fraction of 26 ± 6%. The majority had left-bundle-branch block (82%). Compared to IR, BIV increased SV (58 ± 11 vs. 67 ± 12 mL; p = 0.0007), CO (3.6 ± 0.7 vs. 4.2 ± 0.8 l/min; p = 0.0007) and reduced TPR (1975 ± 410 vs. 1694 ± 390 dyn*s/cm5). cBP remained unchanged during different ventricular pacing modes. Conclusions: ICG is able to detect intraindividual changes of haemodynamic parameters induced by different pacing modes. However, its sensitivity to detect haemodynamic changes through conduction delay variations, as performed for device optimisation, remains unclear.

Introduction

Cardiac resynchronisation therapy (CRT) in patients with advanced heart failure and left bundle branch block improves left ventricular function and reduces clinical symptoms, rate of hospitalisations and overall mortality in a subset of patients with left ventricular systolic dysfunction [1,2]. Since CRT has become an established adjunctive treatment for heart failure patients, device performance has improved constantly, allowing not only for restoration of left ventricular synchrony through simultaneous left and right ventricular pacing but also for individualised modification of both atrioventricular (AV) and interventricular (VV) pacing intervals. In a prospectively conducted study, individualised AV delay programming using echocardiography has been shown to improve NYHA class, left ventricular ejection fraction (LVEF) and quality of life compared to an AV delay of 120 ms [3]. Individualised optimisation of biventricular stimulation timing has attracted interest to reduce the substantial proportion of CRT non-responders (20 to 30%) despite meeting appropriate implantation criteria [4]. At present, different noninvasive approaches have been chosen to optimise AV and VV intervals during routine follow-up management. In daily practice, device adaptation is performed mainly by echocardiography, and different approaches using Doppler echocardiography parameters, tissue imaging techniques and 3-dimensional echocardiography have been evaluated. However, although widely used, echocardiography-based device optimisation is time consuming, and is not always reproducible [5].
Impedance cardiography (ICG) as another noninvasive technique for haemodynamic assessment has been described for decades. Recently ICG has been investigated to optimise AV and VV intervals in CRT recipients [6,7]. However, the reported results remain questionable with regard to the achieved amount of measured haemodynamic improvement. In this study we sought to determine if ICG is sensitive enough to detect haemodynamic changes during different ventricular activation patterns such as intrinsic rhythm, right-, left- and biventricular pacing.

Patients and Methods

Patient Population

Eighteen patients with congestive heart failure treated with CRT were evaluated one month after optimisation of the AV and VV interval with Doppler echocardiography, as it is routinely performed at our department. Indication for CRT was in line with international guidelines [8]. Right ventricular lead was positioned in the right ventricular apex in all patients and left ventricular lead in a lateral or postero-lateral cardiac vein. All patients were on optimal medical therapy and had a stable NYHA classification at the time of, and for at least one month before, study inclusion.

Impedance Cardiography

ICG is based on the assumption that the thorax can be modelled as a homogeneous electrical conductor filled with blood. Volume changes in the cardiovascular system produce impedance variations across the thorax. Surface electrodes constantly deliver a low amplitude high frequency current and measure variations in transthoracic impedance to this current flow [9]. ICG was performed with the use of a commercially available device (Task Force Monitor Systems, CNSystems, Austria). This device combines continuous blood pressure (cBP) measurement, using the vascular unloading method at the finger [10], and beat-to-beat stroke volume (SV) measurements with ICG. Variations of thoracic electric impedance were assessed through band surface electrodes placed at both sides of the lower thorax and at the neck base as described previously [11]. In order to avoid artefacts during data acquisition, telemetry between the CRT device and the programmer was disconnected and ICG measurements were stopped when switching between the pacing modes. Since cBP measured on the small arteries of the fingers is not representative for systemic blood pressure, values obtained by the ICG device via two-fingers cuffs are automatically corrected to oscillometric BP values obtained at the contra lateral brachial artery. This is done without any interruptions of cBP measurement by readjustment of the set point. Hence, impedance cardiography provides real time noninvasive beatto-beat monitoring of stroke volume, blood pressure and total peripheral resistance. For determination of the R-R interval, a 2-channel ECG is included and allows real time calculation of heart rate (heart rate in beats per minute). In addition, a 12-channel ECG was obtained at each pacing mode to assess QRS duration. We used suction electrodes, which were placed in a consistent way at each pacing mode and were removed after ECG acquisition between each pacing mode.

Haemodynamic Assessment

Measurements were performed in random order during biventricular pacing (BIV), isolated right (RV) and left (LV) ventricular pacing and intrinsic rhythm (IR), all in the VDD mode with a lower rate limit of 40 bpm. As optimisation of AV and VV conduction delays had been performed by echocardiography in all patients previously, the programmed AV and VV intervals in BIV pacing were thought to represent the optimal pacing mode. For reproducibility of measurements, patients were in the supine position 10 min before measurements were started and during the whole measurement period. Data acquisition was performed during 10 min periods with each pacing mode. The following haemodynamic parameters were analysed: SV as assessed by ICG, cardiac output (CO) calculated as SV*heart rate (HR), total peripheral resistance (TPR) as mean BP/CO, HR as 1/(R–R) and cBP as described above.

Statistical Analysis

Categorical data are presented as numbers (percentages) and continuous data as mean ± standard deviation.
Wilcoxon signed rank sum test was used to compare continuous variables where appropriate. P values were two-sided and were considered statistically significant if <0.05. Calculations were performed after averaging measurements from the 10 min data acquisition during paced and intrinsic rhythm. Statistical calculations were performed using the statistical package Prism 5.0 for Mac OS.

Results

Patient Characteristics

18 patients were included and one patient was excluded from the analysis because measurements had to be stopped when serious haemodynamic deterioration during IR occurred. In another patient, cBP monitoring was not possible because cuffs could not be fixed on the patient fingers due to severe joint disease. Therefore data on blood pressure and the derived calculated TPR were not available for analysis in this patient. The age of the study population was 67 ± 10 years. All but one were male and the majority had left bundle branch block (82%) with a QRS duration during IR of 173 ± 28 ms. Baseline characteristics are presented in Table 1.

Haemodynamic Measurements and QRS Width During Different Pacing Modes Compared to Intrinsic Rhythm

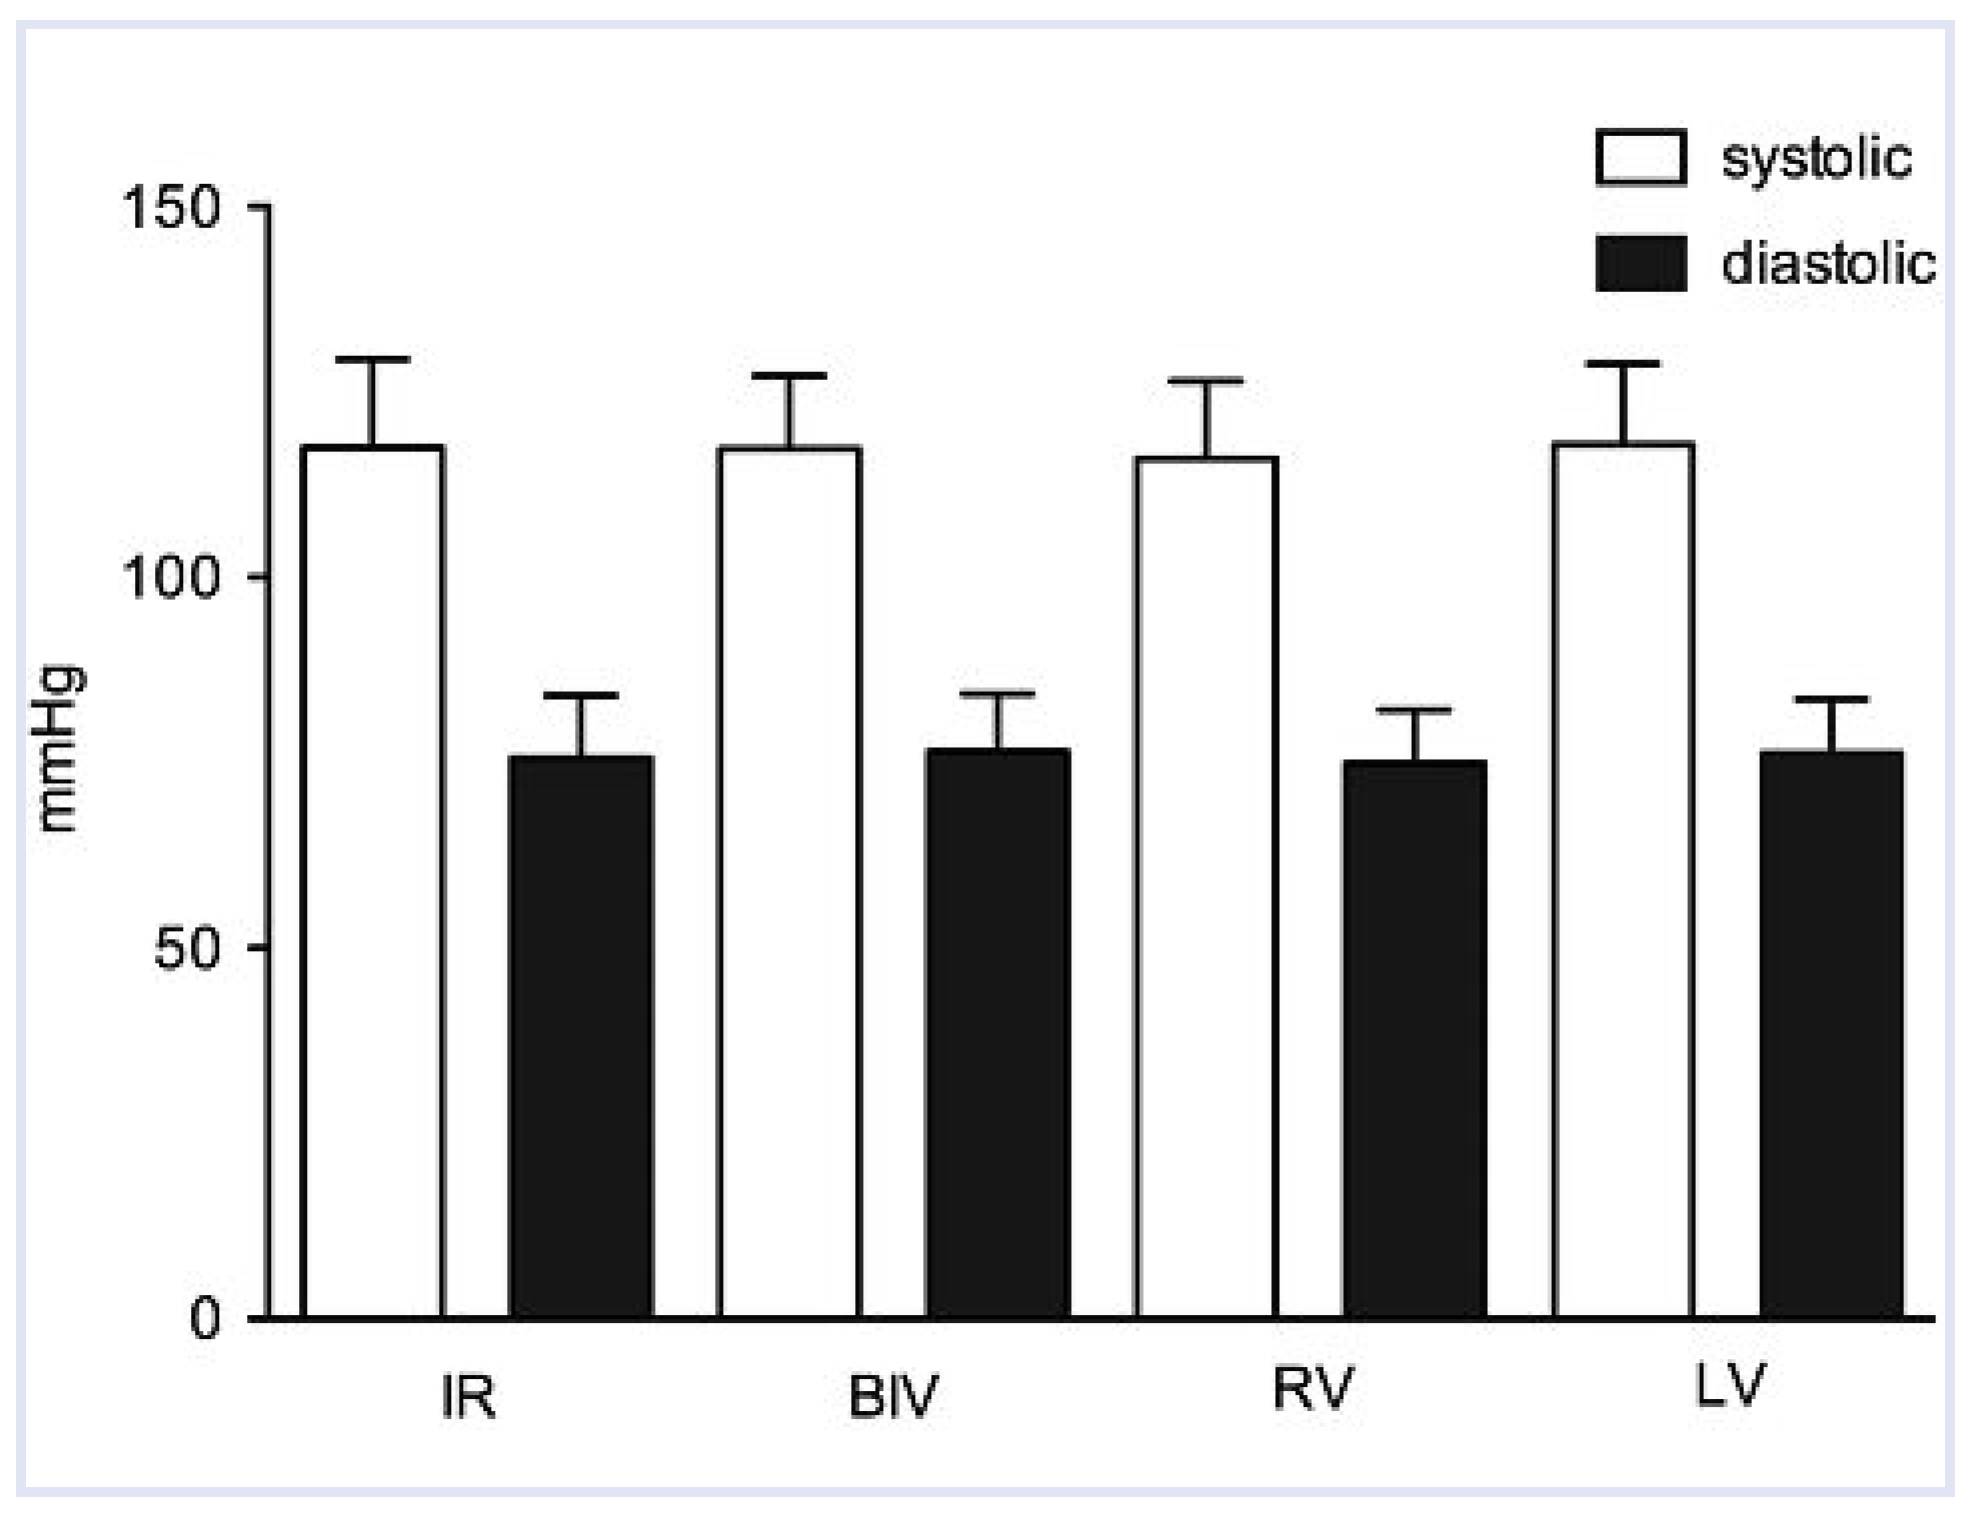
Haemodynamic values obtained by ICG during different ventricular pacing modes and IR are presented as population-based mean values in Table 2 and in Table 3 as intraindividual changes of CO and TPR. Compared with IR, both SV and CO improved significantly during BIV (Figure 1 and Figure 2). SV also significantly increased during RV, although to a lesser extent compared to BIV. cBP measurements remained unchanged during the different pacing modes (Figure 3), whereas TPR significantly decreased during BIV and RV (Figure 4).
Compared to IR, QRS duration increased during RV, while BIV led to a decrease in QRS width, which was not significant (Table 2).

Discussion

In the present study, ICG detected variations in haemodynamic parameters, induced by different ventricular activation patterns through CRT devices, in heart failure patients. A significant improvement of SV and CO was observed during BIV when compared to IR.

Value of ICG for Noninvasive Haemodynamic Monitoring

ICG has already been described as a noninvasive clinical tool to monitor cardiac function [12]. Early studies comparing ICG derived haemodynamic parameters to those of invasive measurements, such as the Fick equation or thermodilution, revealed conflicting data. However, several studies demonstrated that ICG is accurate in stable heart failure patients when it is compared to invasive methods [13,14]. Differences in patient populations, the lack of uniformity of device use and different statistical methods could account for the divergent results [11]. The accuracy of ICG, especially in presence of tachycardia arrhythmias due to valvular regurgitation [15], very low CO [16], unstable cardiac condition or early after cardiac surgery [17] has been questioned. Another advantage has been made by introducing surface band electrodes. Traditionally, used ring electrodes, which are wrapped around the body or the use of several spot electrodes, which are placed close together have some disadvantages compared to surface band electrodes. Ring electrodes, for example, tend to slip or lose contact with the skin while the patient is moving or hamper the patient’s breathing. With the use of spot electrodes, which create a point-like contact to the skin, it is less reliable and reproducible to create a homogeneous field in the thorax. The surface band electrodes used in the present study cover a large area of the skin creating a homogeneous field within the thorax, without the need to move the patient while applying them and show better reproducibility compared to previously used band or spot electrodes. In a comparative study in 16 heart failure patients, the ICG monitor used in the present study showed a close correlation to the gold standard of CO measurement by thermodilution [18].

Comparison with Previous Studies Comparing Haemodynamics During BIV Pacing

The value of ICG has been investigated with respect to optimising biventricular stimulation timing in CRT patients. Braun et al. compared the ability of echocardiography and ICG for optimisation of the AV interval in CRT patients based on CO measurements [6]. The mean increase of CO assessed by ICG from the worst to the optimal AV interval was +38%, whereas changes in CO assessed with echocardiography were significantly lower (+17%). Of note, that study population investigated and the current population were similar with regard to age, baseline QRS duration, assignment of cardiomyopathies and functional capacity (NYHA classification), but mean LVEF-assessed before CRT implantation was lower compared to our study population (21 ± 7 vs. 26 ± 6%). Another study investigated ICG-based CO measurements at intrinsic rhythm and at different AV and VV delays, shortly after implantation of a CRT device using a standard pacing protocol [7]. At first, the VV interval was optimised (LV preexcitation –60 to +60 in steps of 20 ms) at a fixed AV interval of 120 ms, followed by optimisation of the AV interval (80 to 140 ms in steps of 20 ms) at simultaneous biventricular pacing. Finally the device was set to whichever combination of AV and VV intervals produced the highest CO. Compared to IR, CO was increased by 22% during simultaneous BIV (VV = 0 ms) and a fixed AV interval, and was further increased by 11% at optimised VV and AV intervals, thus there was an increase of CO of 33% during optimised biventricular pacing. The proportion of patients with nonischaemic cardiomyopathy in our study was considerably higher compared to the study by Braun et al. (80 vs. 29%) [6]. However, compared to the above discussed results, different ventricular activation patterns resulted in much smaller haemodynamic changes in our study, although we think that changing the ventricular activation pattern (no pacing vs optimised biventricular pacing) should result in greater haemodynamic changes compared to haemodynamic changes that occur during variation of AV or VV conduction delays. However, differences in baseline characteristics, in the sample size of the study population and in the measurement protocols as well as the point of time when measurements were performed ([6]: 1 month, [7]: 3 to 5 days after CRT implantation) might explain the different results.
Right ventricular apical pacing during conventional permanent cardiac pacing has been shown to have adverse haemodynamic effects, which might be due to the induced ventricular dyssynchrony. However, RV pacing significantly improved SV compared to IR in our study, whereas LV pacing did not and in some individuals RV pacing was equal to or better than BIV (Table 3, patients 2, 3, 5, 9, 10, 11, 15, 16). Comparing RV to LV pacing we found no overall statistical difference in SV or CO, but individual haemodynamic improvements during RV pacing were seen in some patients (Table 3, patients 3, 6, 10). The DAVID trial for example has shown higher mortality and worsening of heart failure during permanent DDDR pacing at 70 /min compared to VVI backup pacing at 40/min. The population consisted of patients with an indication for an ICD but no indication for permanent pacing and a LVEF of ≤40% [19]. Another trial compared BIV to RV in patients with a depressed LVEF ≤40% and a standard pacing indication, and found that BIV was superior to RV with regards to LV function, exercise capacity and quality of life after 3 months [20]. RV pacing has also been found to decrease LVEF in patients with normal LVEF and in patients after AV node ablation for atrial fibrillation with rapid ventricular conduction [21,22].
However, we reported on short-term measurements in patients with chronic biventricular pacing in whom CRT had been switched off acutely. This and the chronology of the pacing mode (BIV > RV > LV > IR), even though equal in all patients, might have influenced our measurements.

Limitations

As it was not the aim of our study to compare ICG measurements to echocardiography, we do not know how large the haemodynamic changes would have been if measured. The sample size was small and could have influenced outcome. Mitral valve regurgitation is often present in dilated hearts, although CRT has been shown to reduce mitral regurgitation. However, ICG has been reported to be inaccurate in the presence of valvular regurgitation. Therefore we cannot exclude inaccurate haemodynamic measurements in our patients, since we were not aware of the degree of mitral regurgitation at the time of haemodynamic measurements with ICG. The use of ECG equipment next to the ICG measurement unit might have had an influence on measurements by increasing parallel resistance. As each measurement was performed only once we do not know whether our measurements would be reproducible.

Conclusions

The main finding of our study was that in heart failure patients with CRT devices, ICG is able to detect intraindividual changes of haemodynamic parameters induced by different pacing modes. However, based on the small changes observed during dramatic changes in ventricular activation patterns (CRT “on”/“off”), it remains questionable whether ICG is sensitive enough to detect subtle changes incurred by variations of the AV and VV interval during a CRT optimisation procedure. Therefore, the value of ICG for optimisation of CRT devices remains questionable.

Funding

The study was supported by grants from the Swiss National Science Foundation.

Conflicts of Interest

The authors have no conflicts of interest to declare.

Abbreviations

AVatrioventricular
BIVbiventricular pacing
cBPcontinous blood pressure
CRTcardiac resynchronisation therapy
HRheart rate
ICGimpedance cardiography
IRintrinsic rhythm
LVleft ventricular pacing
LVEFleft ventricular ejection fraction
RVright ventricular pacing
SVstroke volume
TPRtotal peripheral resistance
VVinterventricular

References

  1. Cazeau S, Leclercq C, Lavergne T, Walker S, Varma C, Linde C; et al. Effects of multisite biventricular pacing in patients with heart failure and intraventricular conduction delay. N Engl J Med. 2001, 344, 873–880. [CrossRef]
  2. Bakker PF, Meijburg HW, de Vries JW, Mower MM, ThomasAC, Hull ML; et al. Biventricular pacing in end-stage heart failure improves functional capacity and left ventricular function. J Interv Card Electrophysiol. 2000, 4, 395–404. [CrossRef]
  3. Sawhney NS, WaggonerAD, Garhwal S, Chawla MK, Osborn J, Faddis MN. Randomized prospective trial of atrioventricular delay programming for cardiac resynchronization therapy. Heart Rhythm. 2004, 1, 562–567. [CrossRef] [PubMed]
  4. Birnie DH, Tang AS. The problem of non-response to cardiac resynchronization therapy. Curr Opin Cardiol. 2006, 21, 20–26. [CrossRef]
  5. Chung ES, LeonAR, Tavazzi L, Sun JP, Nihoyannopoulos P, Merlino J et al. Results of the Predictors of Response to CRT (PROSPECT) trial. Circulation. 2008, 117, 2608–2616. [CrossRef]
  6. Braun MU, Schnabel A, Rauwolf T, Schulze M, Strasser RH. Impedance cardiography as a noninvasive technique for atrioventricular interval optimization in cardiac resynchronization therapy. J Interv Card Electrophysiol. 2005, 13, 223–229. [CrossRef]
  7. Heinroth KM, Elster M, Nuding S, Schlegel F, Christoph A, Carter J et al. Impedance cardiography: A useful and reliable tool in optimization of cardiac resynchronization devices. Europace. 2007, 9, 744–750. [CrossRef]
  8. Dickstein K, Cohen-Solal A, Filippatos G, McMurray JJ, Ponikowski P, Poole-Wilson PA; et al. ESC Guidelines for the diagnosis and treatment of acute and chronic heart failure 2008: The Task Force for the Diagnosis and Treatment ofAcute and Chronic Heart Failure 2008 of the European Society of Cardiology. Developed in collaboration with the Heart FailureAssociation of the ESC (HFA) and endorsed by the European Society of Intensive Care Medicine (ESICM). Eur Heart J. 2008, 29, 2388–2442.
  9. Tang WH, Tong W. Measuring impedance in congestive heart failure: Current options and clinical applications. Am Heart J. 2009, 157, 402–411. [CrossRef] [PubMed]
  10. Fortin J, Marte W, Grullenberger R, Hacker A, Habenbacher W, Heller A; et al. Continuous non-invasive blood pressure monitoring using concentrically interlocking control loops. Comput Biol Med. 2006, 36, 941–957. [CrossRef] [PubMed]
  11. Rosenberg P, Yancy CW. Noninvasive assessment of hemodynamics: An emphasis on bioimpedance cardiography. Curr Opin Cardiol. 2000, 15, 151–155. [CrossRef] [PubMed]
  12. Lababidi Z, Ehmke DA, Durnin RE, Leaverton PE, Lauer RM. The first derivative thoracic impedance cardiogram. Circulation. 1970, 41, 651–658. [CrossRef] [PubMed]
  13. Drazner MH, Thompson B, Rosenberg PB, Kaiser PA, Boehrer JD, Baldwin BJ; et al. Comparison of impedance cardiography with invasive hemodynamic measurements in patients with heart failure secondary to ischemic or nonischemic cardiomyopathy. Am J Cardiol. 2002, 89, 993–995. [CrossRef] [PubMed]
  14. Belardinelli R, Ciampani N, Costantini C, Blandini A, Purcaro A. Comparison of impedance cardiography with thermodilution and direct Fick methods for noninvasive measurement of stroke volume and cardiac output during incremental exercise in patients with ischemic cardiomyopathy. Am J Cardiol. 1996, 77, 1293–1301.
  15. Schieken RM, Patel MR, Falsetti HL, Lauer RM. Effect of mitral valvular regurgitation on transthoracic impedance cardiogram. Br Heart J. 1981, 45, 166–172. [CrossRef]
  16. Hubbard WN, Fish DR, McBrien DJ. The use of impedance cardiography in heart failure. Int J Cardiol. 1986, 12, 71–79. [CrossRef]
  17. Raaijmakers E, Faes TJ, Scholten RJ, Goovaerts HG, Heethaar RM. A meta-analysis of three decades of validating thoracic impedance cardiography. Crit Care Med. 1999, 27, 1203–1213. [CrossRef]
  18. Fortin J, Habenbacher W, HellerA, HackerA, Grullenberger R, Innerhofer J et al. Non-invasive beat-to-beat cardiac output monitoring by an improved method of transthoracic bioimpedance measurement. Comput Biol Med. 2006, 36, 1185–1203. [CrossRef]
  19. Wilkoff BL, Cook JR, EpsteinAE, Greene HL, HallstromAP, Hsia H; et al. Dual-chamber pacing or ventricular backup pacing in patients with an implantable defibrillator: The Dual Chamber and VVI Implantable Defibrillator (DAVID) Trial. JAMA. 2002, 288, 3115–3123. [CrossRef]
  20. Kindermann M, Hennen B, Jung J, Geisel J, Bohm M, Frohlig G. Biventricular versus conventional right ventricular stimulation for patients with standard pacing indication and left ventricular dysfunction: The Homburg Biventricular Pacing Evaluation (HOBIPACE). J Am Coll Cardiol. 2006, 47, 1927–1937.
  21. Nahlawi M, Waligora M, Spies SM, Bonow RO, KadishAH, Goldberger JJ. Left ventricular function during and after right ventricular pacing. J Am Coll Cardiol. 2004, 44, 1883–1888. [CrossRef] [PubMed]
  22. Tops LF, Schalij MJ, Holman ER, van Erven L, van der Wall EE, Bax JJ. Right ventricular pacing can induce ventricular dyssynchrony in patients with atrial fibrillation after atrioventricular node ablation. J Am Coll Cardiol. 2006, 48, 1642–1648. [CrossRef] [PubMed]
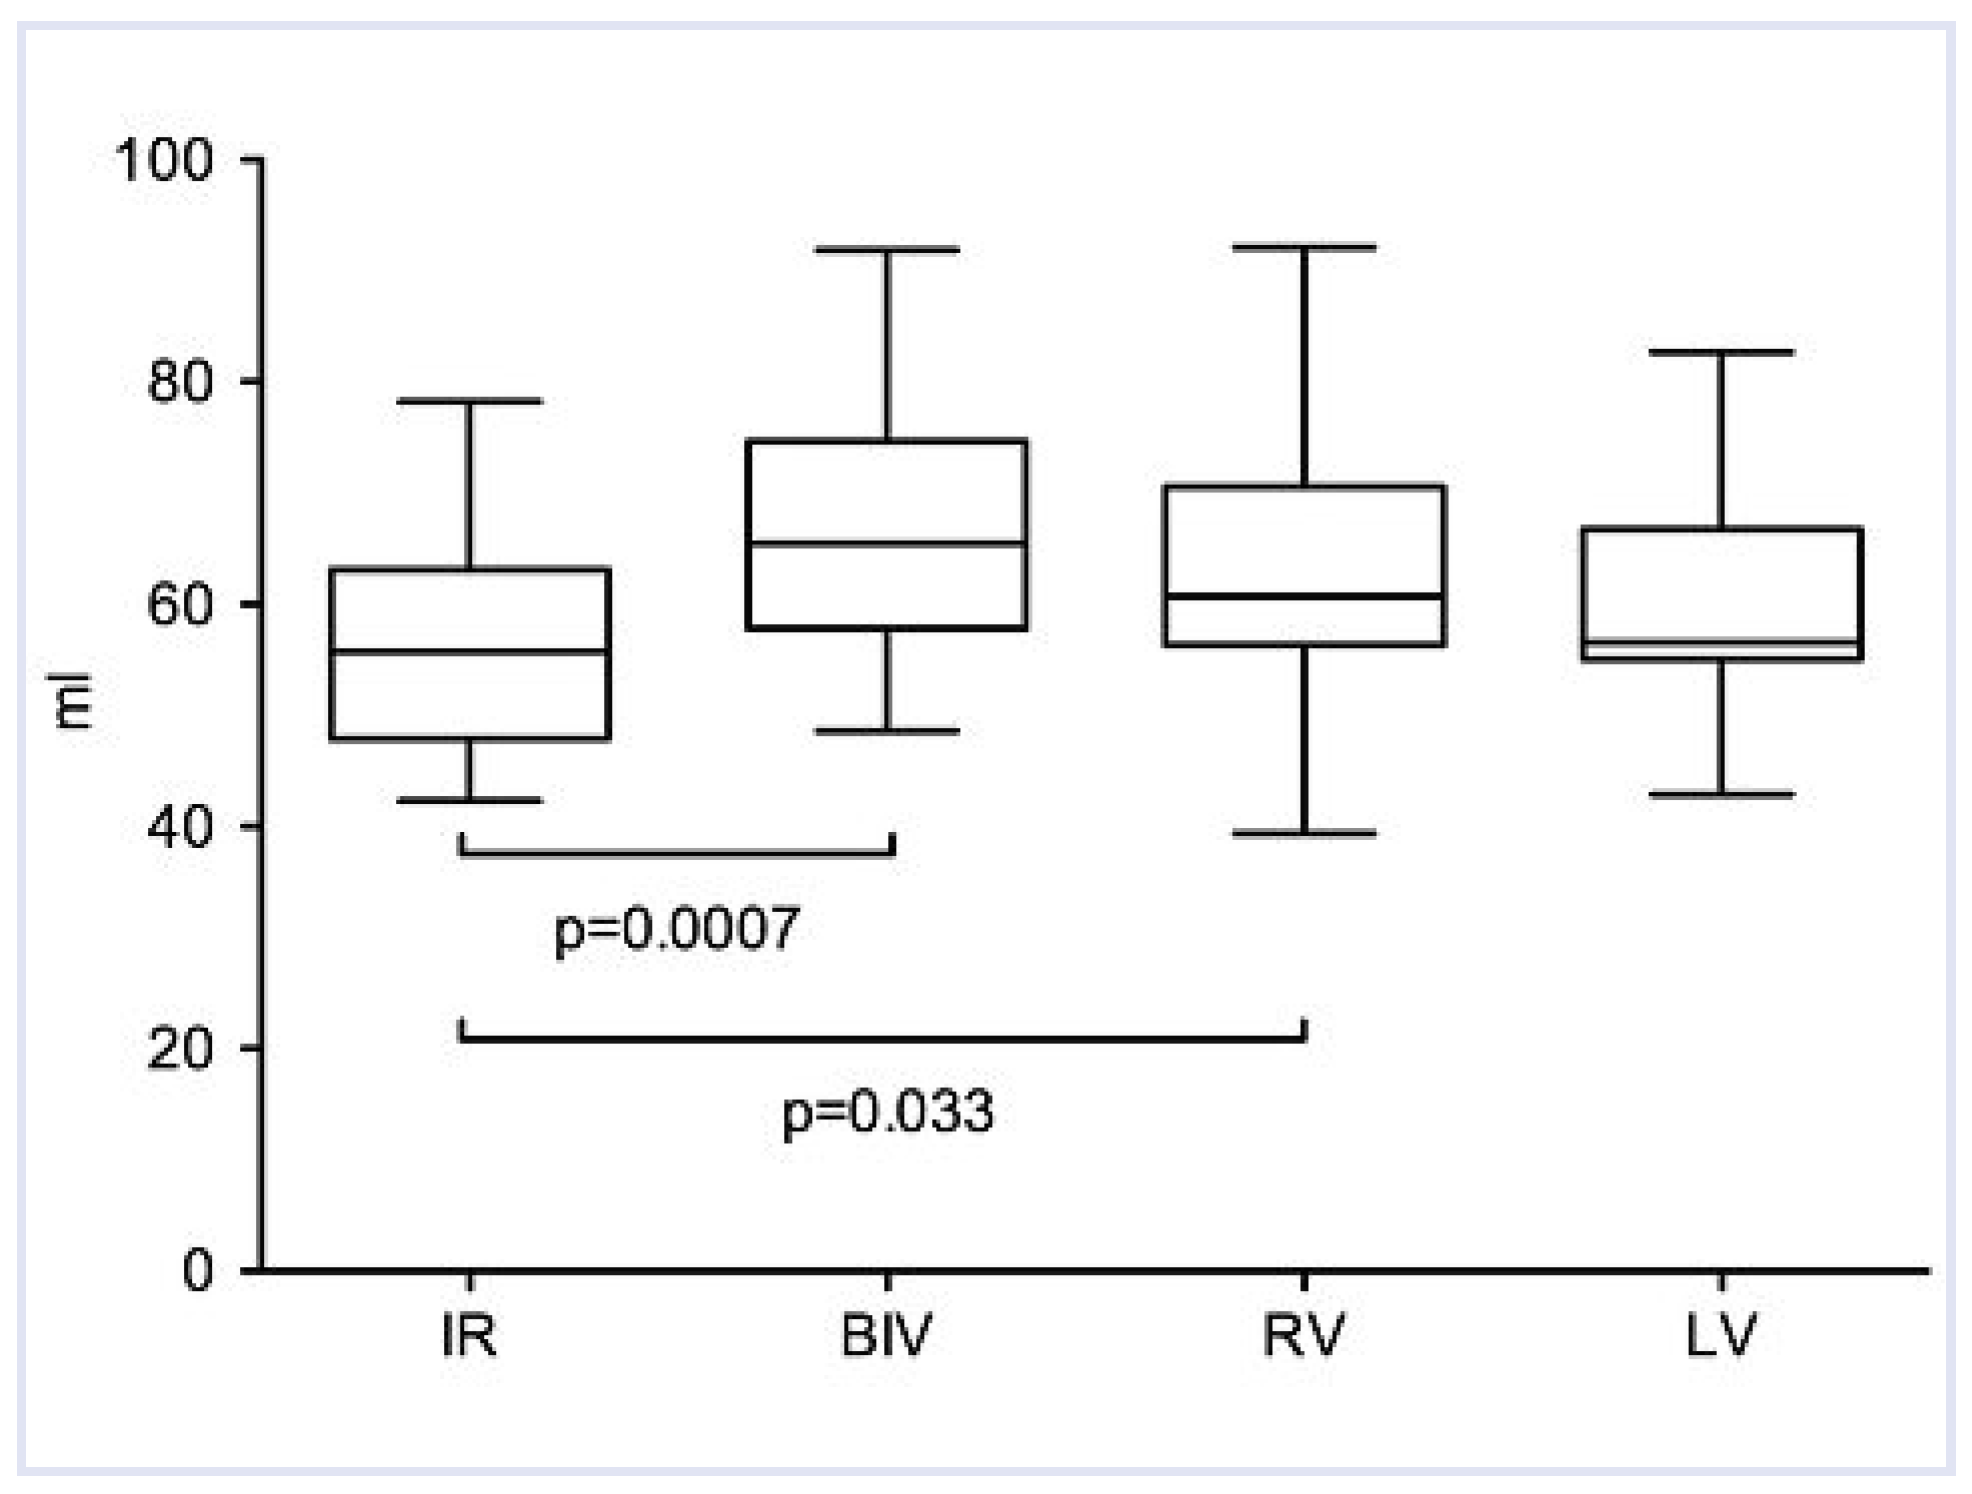
Figure 1. Stroke volume during intrinsic rhythm, biventricular, right and left ventricular pacing. Box plots (25th and 75th percentile, horizontal line indicates median value) and whiskers (minimum to maximum). Compared to IR, BIV and RV significantly improved stroke volume.
Cardiovascmed 13 00208 g001
Figure 2. Cardiac output during intrinsic rhythm, biventricular, right and left ventricular pacing. Box plots (25th and 75th percentile, horizontal line indicates median value) and whiskers (minimum to maximum). Cardiac output significantly improved during BIV when compared to IR.
Cardiovascmed 13 00208 g002
Figure 3. Blood pressure during intrinsic rhythm, biventricular, right and left ventricular pacing. Data are mean with standard deviation. Despite significant improvement in stroke volume and cardiac output during BIV compared to IR blood pressure remained unchanged at whatever pacing mode.
Cardiovascmed 13 00208 g003
Figure 4. Total peripheral resistance during intrinsic rhythm, biventricular, right and left ventricular pacing. Box plots (25th and 75th percentile, horizontal line indicates median value) and whiskers (minimum to maximum). Total peripheral resistance was significantly reduced during BIV despite significant increase in stroke volume and cardiac output.
Cardiovascmed 13 00208 g004
Table 1. Baseline characteristics of the study population, n = 17.
Variable
Age (yrs)67 ± 10
Male16 (94%)
Body Mass Index (kg/m2)29 ± 5
Left bundle branch block14 (82%)
QRS duration (ms)173 ± 28
NYHA II/III6/11
Left ventricular ejection fraction (%)26 ± 6
Ischaemic cardiomyopathy12 (71%)
Data are numbers (percentage) or mean ± standard deviation. NYHA = New York Heart Association functional classification before CRT.
Table 2. QRS duration and haemodynamic values during different ventricular activation modes.
IR vs. BIV IR vs. RV IR vs. LV
VariableIRBIVΔ (%)pRVΔ (%)pLVΔ (%)p
QRS duration (ms)173 ± 28165 ± 24–50.25210 ± 37210.0006187 ± 3080.15
Stroke volume (ml)58 ± 1167 ± 12160.000762 ± 1370.0360 ± 1130.13
Cardiac output (l/min)3.6 ± 0.74.2 ± 0.8170.00073.8 ± 0.660.13.7 ± 0.630.21
TPR (dyn*s/cm5)1975 ± 4101694 ± 390–140.00071783 ± 328–100.0091868 ± 318–50.14
Systolic BP (mm Hg)118 ± 12117 ± 10–10.86116 ± 10–20.29118 ± 1100.68
Diastolic BP (mm Hg)76 ± 877 ± 810.7875 ± 5–10.7876 ± 700.56
Heart rate (bpm)64 ± 1063 ± 10–21.063 ± 10–21.063 ± 10–20.52
Data are mean ± standard deviation.
Table 3. Intraindividual changes of cardiac output and total peripheral resistance during different ventricular activation modes and the CRT responder status.
Patient Variable IR BIV RV LV Responder
1Cardiac output3.7 ± 1.14.2 ± 1.03.4 ± 0.34.2 ± 2.5no
Total peripheral resistance1821 ± 3501700 ± 2631949 ± 1991834 ± 464
2Cardiac output2.5 ± 0.23.4 ± 0.43.3 ± 0.63.1 ± 0.3yes
Total peripheral resistance2889 ± 2812046 ± 2192209 ± 2402380 ± 205
3Cardiac output4.4 ± 0.55.1 ± 1.95.1 ± 2.14.2 ± 0.6yes
Total peripheral resistance1457 ± 1461464 ± 4921249 ± 2931526 ± 166
4Cardiac output3.7 ± 0.54.5 ± 0.53.8 ± 0.14.1 ± 1.0no
Total peripheral resistance3303 ± 4102626 ± 1773084 ± 2043131 ± 436
5Cardiac output3.6 ± 1.03.6 ± 0.63.6 ± 0.63.4 ± 0.6yes
Total peripheral resistance2003 ± 3821874 ± 3141863 ± 2921990 ± 350
6Cardiac output3.5 ± 0.23.6 ± 0.64.0 ± 0.23.1 ± 0.3yes
Total peripheral resistance1871 ± 1081840 ± 2581480 ± 1602046 ± 207
7Cardiac output3.3 ± 0.54.3 ± 0.53.9 ± 0.53.7 ± 0.4yes
Total peripheral resistance1946 ± 2241588 ± 1301727 ± 1781804 ± 142
8Cardiac output2.8 ± 0.43.8 ± 0.13.5 ± 0.23.4 ± 0.1yes
Total peripheral resistancen/an/an/an/a
9Cardiac output2.4 ± 0.12.5 ± 0.22.7 ± 0.82.4 ± 0.2yes
Total peripheral resistance2394 ± 2752249 ± 2912393 ± 3542331 ± 245
10Cardiac output5.1 ± 2.15.5 ± 0.35.4 ± 1.14.4 ± 0.3yes
Total peripheral resistance1809 ± 9361215 ± 821291 ± 2941509 ± 76
11Cardiac output3.1 ± 0.43.3 ± 0.23.8 ± 0.23.4 ± 0.2yes
Total peripheral resistance2023 ± 2531998 ± 1011702 ± 871891 ± 110
12Cardiac output4.1 ± 0.93.8 ± 0.33.4 ± 0.43.7 ± 0.2no
Total peripheral resistance1502 ± 2621799 ± 1501814 ± 1471724 ± 95
13Cardiac output3.6 ± 0.13.9 ± 0.33.4 ± 0.43.9 ± 0.1yes
Total peripheral resistance2250 ± 1952279 ± 1372146 ± 1401898 ± 121
14Cardiac output3.6 ± 0.14.7 ± 0.44.0 ± 0.84.0 ± 0.3no
Total peripheral resistance1755 ± 1681323 ± 1021516 ± 1171654 ± 134
15Cardiac output3.2 ± 0.33.2 ± 0.33.7 ± 0.43.8 ± 0.6yes
Total peripheral resistance2562 ± 2232562 ± 2232250 ± 2832300 ± 317
16Cardiac output2.3 ± 0.84.3 ± 0.24.4 ± 0.54.3 ± 0.7no
Total peripheral resistance1746 ± 3971655 ± 901576 ± 571641 ± 234
17Cardiac output4.2 ± 0.44.9 ± 0.54.6 ± 0.54.3 ± 0.5yes
Total peripheral resistance1740 ± 2021479 ± 1911537 ± 1681612 ± 216
Data are mean ± standard deviation. Cardiac output = ml/min; total peripheral resistance = dyn*sec/cm5. Responders to CRT were defined when they experienced an improvement of at least one NYHA class.