Abstract
The main challenge for land use efficiency is population growth. Using a coupling coordination model and the Sustainable Development Goal 11.3.1 (Land Consumption Rate to Population Growth Rate, LCRPGR), the present study unravels the evolution of land use types and efficiency of land use in the Economic Community of West African States (ECOWAS) from 2003 to 2019. We interpreted the temporal land use types based on the long-time series Moderate Resolution Imaging Spectroradiometer (MCD12Q1-V6) land use images in 2003, 2007, 2011, 2015, and 2019. The World Bank data on population and socioeconomics were used to support the investigation on the coupled link. Our results showed that from 2003 to 2019, the total area of agricultural land decreased by −1.4%, while the built-up area expanded by 25.80%. Globally, the LCRPGR was 0.82, of which Cabo-Verdi and Niger had the highest (1.69) and lowest index (0.58), respectively. Correspondingly, the coupled coordination model indicated an overall value of 6.81, in which the highest and lowest value occurred in Liberia (29.78) and Niger (0.31), respectively. Furthermore, a rapidly growing population had become one of the most important factors causing inefficient land use in the study area. In summary, the ECOWAS was confronted with a lack of management to improve land use efficiency. Thus, future land use policies should pay more attention to balancing the coupled relationship between urban expansion and socio-economic interests.
1. Introduction
In recent years, a significant amount of research has investigated land use policy questions [1,2]. Among various questions, how to coordinate population growth, urban expansion, and agricultural production has raised huge concerns worldwide. Agricultural land and built-up areas depend on land availability. Otherwise, the pressure from the population on space that tends to increase due to migration and suburbanization of urban suburbs causes changes in land use and conversion of productive agricultural land [3]. Therefore, population growth can directly affect agricultural production patterns, especially the evolution of agricultural land use. The food gap, primarily driven by population growth and changing diets, has emphasized this situation [4]. In other words, these two factors can affect the dynamic evolution of land use, agricultural land in particular. In that setting, population growth, agricultural production patterns, and land use may go hand in hand but could also be appreciated in different ways in different countries. For example, the government of Russia [5] and Australia [6], etc. implemented a new approach to technical, economic, and agricultural development policies to assure food security and protect agricultural land. This new agricultural production method may result in inefficient land use in correlation with population growth. In this context, farmland is generally manifested by a transfer from one land use type to another or a deterioration in soil quality [7]. For instance, in 2019, Dániel Fróna et al. noted that approximately 66% of agricultural land is currently used for livestock farming in the European Union [8]. Since the implementation of the United Nations (UN) Sustainable Development in 2015, much research has been carried out on the relationship between sustainable land use and socio-economic development [9,10]. The land consumption rate expresses this relationship. It is the rate at which urbanized land or land occupied by a city/urban area changes (usually over one year) [11]. In West African countries, agriculture and land use policies are also based on the same values as the UN Sustainable Development Goals (SDG). Indeed, the SDG, in point 11, seeks to make cities inclusive, safe, resilient, and sustainable. Hence, understanding the ratio of land consumption is a significant challenge for feeding a growing population. This context is because land policies, which involve balancing various social, economic, and environmental factors, are a challenging task required worldwide, including in the African continent [12].
Land use change has been recognized as an important indicator of socio-economic transition and its inter-logics [13]. Another study found that urbanization, as a socio-economic component, is critical in promoting land transition [14]. According to a prior study, 35% of the terrestrial ecosystem was transformed into agricultural land [15]. In another scenario, built up areas increased approximately by 50% in Barranquilla (Colombia) from 1985 to 2017 [16]. Moreover, agricultural land increased by 14.53% in Senegal, with a dynamic index of 1.45 from 2009 to 2018 [17]. Similarly, growing intensive land use practices have become essential in determining global sustainable development since the end of the 21st century [18]. In general, this scenario is intrinsically related to a growing population. Indeed, Africa’s population exceeded one billion people in 2009, and the continent’s population is projected to grow to 2.2 billion people by 2050 [19]. Besides population growth and urbanization, the African continent has confronted land use policies. For instance, Senegal considered the land use management law outdated [20]. In the other case, land access and the rules governing them have become progressively contested in Mali, Burkina Faso, and Niger [21]. Therefore, the land consumption rate will become even more intense due to population growth and other factors. Furthermore, between 2000 and 2030, worldwide urban land cover is predicted to increase by more than 200%, while global urban population growth is expected to reach around 70% [22]. In summary, land sources on the planet will undoubtedly become progressively scarce due to various factors. Thus, the African countries must adopt new policies and restructure land relations [23].
By the middle of the 21st century, the world’s population will reach 9.1 billion [24]. At the same time, numerous questions remain about the agriculture sector’s ability to meet the demands for food, feed, and fuel of an expanding population on time while also maintaining the production system and the environment [25]. Furthermore, the competition for the limited agricultural land increases due to the growing demand on national and international markets for food, fodder, raw material, and biomass for industrial and energy use [26]. With the spread of COVID-19, the unprecedented health, economic, and social crises threaten lives and livelihoods, making it more challenging to achieve sustainable development goals [27], especially in rural areas. Prior studies have highlighted that the growth of the rural population has brought more significant pressure on land and natural resources and contributed to land fragmentation [24], like in West African coastal countries. Urban and rural population mobility changes in production methods and disturbances in ecological functions have induced tension between people and land and increased spatial heterogeneity, coupled with intensified resource and environmental constraints, which has seriously affected the sustainable use of land and space [28]. Thus, it is abundantly clear that the world needs to improve land use efficiency to achieve sustainable development. However, efficient and sustainable land use is challenging, particularly on agricultural land. Within this framework of good management of natural resources, the policy of the Sustainable Development Goals emerges and becomes a more sophisticated political system to promote sustainable land use.
The fundamental goal of the third edition of the book “African Aspirations for 2063” was for the African continent to become prosperous through inclusive economic growth and long-term development. Consequently, Africa’s main target was to promote modern agriculture for increased production and value addition to contribute to the farmer’s prosperity and ensure food security [29]. Recalling that agenda 2063 aims to achieve socio-economic and political transformation through the optimum use of natural resources, geographic information becomes instructive [30]. At this stage, socio-economic development, land use management, and urban control growth go hand in hand. Therefore, sustainable urban development was a priority for developing countries, particularly West African countries. This situation is why the African Land Forum (ALF) attested that good land governance is critical in achieving agenda 2063 [31]. This background shows that the lack of coordination between population growth and land use policy could negatively impact land use types. Moreover, the rate of cultivation land area decreased due to increased industrial land use, and there was a remarkable trend of city sprawl to urban and peri-urban agricultural areas [32]. The West African subregion is a developing continent, and the weak land use policy can significantly impact agricultural production, consequently impacting the farm Global Domestic Production (GDP). Because employment opportunities are limited in Africa, there are significantly more pressures on the land than in any other region [33]. As a basis, land use policy should consider natural and human factors.
Given this, sustainable land use management is seen as one of the most effective strategies for combating the threat of various forms of land degradation [34]. Local governments may, for example, try to minimize housing density by raising lot size, but this may increase land consumption, leading to further sprawl and negative effects on natural resources [35]. Incorporating the valuation of these services into land use management mechanisms, for example, could be a helpful method for balancing the nexus’ objectives [36]. Therefore, improving and implementing new land reform in developing countries like West Africa may become the new pivot for accomplishing land use sustainability. Hence, significant knowledge gaps regarding land use dynamic evolution and its drivers should be further investigated to realize sustainable land use.
Thus, the theory of literature is required and advantageous in most scientific research in understanding phenomena behavior. As an outcome of the study, numerous gaps in insights concerning the relationship between the triple-types of factors of land use change, population growth, and socio-economic development have been discovered. In addition to this shortcoming, the policy promoting efficient land use has been poorly implemented. Previous research has focused separately on land use change [37] and urbanization trends [38]. These various studies are most often limited to a local scale.
Due to the low socio-economic growth of ECOWAS countries [39], existing studies rarely include socio-economic development issues. However, several studies have shown that the socio-economic development processes in West Africa are getting better [40]. Given the lack of understanding, it is important to focus on this under the sustainable development goal. Therefore, this work has extended the scope of research into the behavior of land use change in a new context. Another contribution of this study was that it provided new knowledge about the dynamic evolution of the built-up area and growing populations, simultaneously. In other words, this research can assess if the evolution of built-up areas is solely due to population growth or includes other factors. Looking ahead, the study’s findings may support restructuring or adjusting ECOWAS’ land use policy to the new context, where the challenge of efficient land use is critical. This context is why this investigation is vital for the West Africa sub-region.
Therefore, a good opportunity for land use practices information was launched because there was a lack of study on evaluating the indicator 11.3.1 in the West African sub-region. As a result, the overarching purpose is to unravel the evolution of land use types and efficiency in the Economic Community of West African States (ECOWAS) from 2003 to 2019. Our specific objectives were to (1) reveal the land use type’s evolution, (2) assess the level of Land Consumption Rate to the Population Growth Rate (LCRPGR) over time, and (3) reveal the correlation link between population growth and built-up areas. The previous objective was essential because population growth and built-up areas are considered the basis of land use efficiency studies, providing more knowledge about land use characteristics over time.
2. Study Area
There are several sub-regional organizations on the African continent. Each organization is determined by its geographical, economic, and historical characteristics. In West Africa, the sub-regional organization is the Economic Community of West African States (ECOWAS). As shown in Figure 1, the 15 countries make up the community. The ECOWAS’ mission is to promote economic integration in all economic activities, particularly the industry, transport, telecommunications, energy, agriculture, natural resources, commerce, monetary and financial questions, and social and cultural matters [41]. Table 1 shows the main characteristics of ECOWAS in 2019 according to World Bank data.
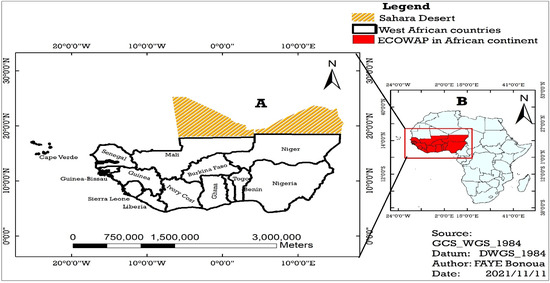
Figure 1.
The geographical location of the study area: (A) represents the localization of the study area with 15 countries; (B) represents the African continent’s study area.

Table 1.
Socioeconomic statistical characteristics of the study area for 2019 (World Bank, 2021).
In the West African subregion, ECOWAS came into being by endorsing the treaty in Lagos on 28 May 1975 [41]. The West African subregion has a land area of 5,032,970 km2. It is between the latitudinal zone of West Africa and stretches across five latitudinal zones of 5° each, namely zones 0–5° N, 5–10° N, 10–15° N, 15–20° N, and 20–25° N [42]. West Africa is a region covering the entire western part of sub-Saharan Africa. It includes approximately the coastal countries north of the Gulf of Guinea to the Senegal river, the countries covered by the Niger river basin, and the countries of the Sahelian hinterland [43]. Specifically, it is bordered to the West and South by the Atlantic ocean. The Niger river is generally considered the West African region’s northern border (Tombouctou in Mali) (Figure 1).
West African countries have several climatic diversities. The dry season period starts in October and extends to March of the following year, while the wet season period begins in April and ends in September [44]. Agriculture in the ECOWAS region is situated in a complex environment where several parameters interact. The elements of climate (including temperature, rainfall, etc.) and ecological factors largely determine agricultural production conditions [38,39] In addition, the irregularity of these climatic parameters can negatively affect land use, particularly agricultural land.
In the North, Senegal belongs to the biome of a dry tropical climate. The environment of the dry tropical zone, also called the Sudanese zone, is marked by relatively high rainfall, with rainfall of 600–1200 mm, and the presence of two seasons, dry and wet. The dry season is long: it lasts more than six months and tends to lengthen as moving away from the equator [45]. In Ivory Coast, nearly 41% of the country belongs to the Guinean-Congolian zone, the tropical forest zone with the highest annual rainfall. The entire zone is home to some 8000 species, 80% of which are endemic [46]. Seasonal precipitation accumulations over the Sahel have recovered but do not reach the levels of the period preceding the drought episodes of the 1970s and 1980s [47].
Much previous literature considered agriculture the main driving factor of economic growth in West Africa [29,30] Agriculture employs 60–65% of the region’s population, contributes 35 to 60% of regional GDP, and produces 15.3% of exported goods and services [48]. The World Bank reported that agriculture activities are more economically dominated in this region than anywhere around the world, such as in China (9.46%), the Euro area (1.58%), sub-Saharan Africa (18.01%), and the United States (1.08%). For instance, agriculture represents the primary employment sector in Senegal, with about 70% of the working population [49]. It contributed approximately 15.01% in 2018 of added value (% of GDP) according to World Bank data in 2020. Since most rural households in Africa need to earn a living and feed their families through accessing land [50], inefficient land use management practices and policies can induce a few problems in the future. The dynamic of land use systems is complex in the African continent.
The extreme increase in land sales and land leases in developing countries illustrates that the global competition for scarce land resources has gained a new dimension [26]. For instance, in the Thies region (Senegal), urban growth was an average of 7.94% between 2009 to 2019 [17]. Furthermore, it is worth noting that in Africa, particularly in the Sahel, after the rainy periods of the 1960s, many researchers noted anomalies of rain in the early 1970s [51]. The consequences of this rainfall deterioration were reflected in Senegal by the degradation of natural environments, with drought leading to the degradation of the plant cover, the soils being subjected to erosion and runoff, and the accentuation of acidification and salinization [52]. In addition, the factors of low annual rainfall, frequent dry spells, and the rainy season shortening affect the vegetative cycle of crops [44]. In northern regions, severe droughts appear to be the most significant risk in estimated aggregate losses to crops and livestock [6]. Thus, the combined effect of rainfall, land surface temperature, and solar radiation explain approximately 40% of the variation in cropland productivity over West Africa [53]. Drought is a recurring phenomenon in the coastal zone of Senegal, and its hazards affect the economies of the predominantly agricultural population [54]. This situation underlines that the evolution of agricultural land and climate are closely linked. For this reason, access to land is one of the projects in ECOWAS that is highly engaged. Implementing the African Union’s declaration on land issues and challenges at regional/national levels is imperative for prosperity and advancing the Sustainable Development Goals in Africa [31].
3. Materials and Methods
3.1. Data Sources
This study consisted of spatial, socio-economic, and agricultural data covering the periods from 2003 to 2019, which were derived from multiple databases. Table 2 below shows the characteristics of these data.
Table 2.
Data sources information.
3.2. Methodology
Spatial data used in this study were obtained from NASA LPDAAC Collections- Modis Land Cover—MCD12Q1V6 (Earth Explorer USGS) with a resolution of 250 m. Given the study area’s size, 13 LULC types were reclassified after collecting the data. Before processing, all 13 raster images were merged into a single raster in ArcGIS. The Sahara Desert occupies the most northern part of West Africa and extends from the Atlantic ocean in the West to the Red Sea in the East and from the Mediterranean Sea in the North to the Sahel (Arabic for ‘shore’) region in the south and covers 10 countries, including Mali and Niger [55]. A desert is a barren land scarce of biodiversity and unconducive for most living organisms [56]. In other words, there is almost no human activity; that is why, in this study, a part of the Sahara Desert has been removed to better appreciate the land use characteristics in the sub-region (Figure 1).
All land use images were resampled to the same resolution of 50 m [57]. The layers were re-projected according to the reference projection system of the study area, which is the World Geodetic System (WGS)_1984_Complex_UTM_Zone_28N (EPSG:31028). In addition, the strips were cut according to the size of the study area. This resampling method allowed us to obtain expected results between the processed images. After this geometric correction, unsupervised classification was applied to interpret the land use/land cover (LULC) used in this study. Thus, the International Geosphere-Biosphere Program (IGBP) Type one land cover scheme identifies 17 land cover classes (0–16), which include 11 natural vegetation classes, three advanced and mosaicked land classes, and three non-vegetated land classes (https://yceo.yale.edu/modis-land-cover-product-mcd12q1 accessed on 15 November 2021). According to the above methodology and the classification system of Anderson JR et al. in 1976 [58], the land use types are reclassified into six (6) categories: agricultural land, grassland, built up area, ecological land, water bodies, and barren land. These land use types are presented in Table 3. Then, five temporal remotely sensed images were selected to detect land use types’ evolution concerning spatial analysis. All five images were used to examine the area of land use transition. Following converting the raster to a vector, we used the ArcGIS platform to annually identify the spatial extent for the six land use types: agricultural land, grassland, built-up area, ecological land, water bodies, and barren land.
Table 3.
Classification method of land use types.
Based on the United Nations Sustainable Development Program, we developed the ratio of Land Consumption Rate to the Population Growth Rate (LCRPGR) to measure the coupled relationship between population growth and the global built area. This methodology investigated the expansion of global built-up areas in West African countries. In addition, the degree of linkage coordination was determined using World Bank data on the evolution’s population and remote sensing data, particularly the built-up land area, to better understand the relationship between population growth and built-up areas.
3.2.1. Characteristics of Land Use Types Evolution
Calculation of the Evolution Speed
The evolution speed of land use change was expressed to measure the intensity and rapidity of land use transition per year in a given area. To a certain extent, this method positively affects the evolutionary pattern of land use in the study area [38]. Furthermore, transformation speed refers to the rate at which specific land use changes over time in a space [59]. The following equation was used in this study to show the rate of change (increase or decrease) of a type of land use over time.
where V was the evolution speed of land use types during the study period, Sa was the land area at the beginning of the study period, Sb was the land area at the end of the study period, and T was the time interval of the study years [59].
Calculation of the Amplitude of Evolution
The amplitude of land use evolution was mainly characterized by the value of change in the quantitative pattern of a land use type, for instance, the share of the land area of a land use type in the total land area of the study area.
where U is the amplitude of the evolution for a given land use type, and Sa and Sb are the land areas of land use types at the beginning and end of the study, respectively. S is the total land area of the study area [60].
3.2.2. The Ratio of the Land Consumption Rate to the Population Growth Rate (LCRPGR)
LCRPGR was entrusted to quantify sustainable land use in the face of built-up area’s expansion pressures, population, and economy. LCR was defined as a measure of the percentage of the current global built-up area that was newly developed in a given spatial unit over some time. Land consumption includes (a) the expansion of built-up areas that can be directly measured; (b) the absolute extent of land that is subject to exploitation by agriculture, forestry, or other economic activities; and (c) the over-intensive exploitation of land used for agriculture and forestry. LCRPGR can be expressed as:
where, ln = Natural logarithm; Urbt+n = built up area at the final year (t + n); Urbt = built up area at the initial year (t); Popt+n= Total population at the final year (t + n); Popt = total population at the initial year (t)l and n = Number of years between the two-time intervals [61]. The results are classified into high, moderate, low, moderate low, and very low.
3.2.3. Coupling Coordination Model
The degree of coupling describes the interaction between systems or elements, whereas the degree of the coupling coordination model describes the design trend from disorder to order. The model’s expression is as follows:
In the formula above, C was the value of the degree of coupling; f(x) and f(y) were the total evaluation scores of the two-systems population growth and built up area, respectively; T was the comprehensive evaluation index of the development of the two systems [14]; α and β are the undetermined coefficients (0.5) [62]; D was the coupling coordination index. According to the analysis, the results of the coupling coordination model are classified into high, moderate, low coupling, moderate uncoupling, and severe uncoupling. However, given the high values, all results are simplified to the 100th.
4. Results
4.1. Analysis of the Land Use Evolution
Land use types varied greatly over space and time in this study area. Figure 2 and Table 4 show that land use has experienced several fluctuations over time. First, the spatial distribution was dominated by grassland, which represented 40.14% at the beginning and 41.86% at the end, followed by ecological land with 24.19% in 2003 and 23.33% in 2019. These two land use types represented 64.83% of the total area. Secondly, the study highlighted the predominance of barren and agricultural land. With 18.15% in 2003, and 17.40% in 2019, barren land represented the third land use type. It was followed by agricultural land with 16.12% and 15.90% in 2003 and 2019, respectively. These two types alone accounted for about 33.37% of the total area. Finally, water bodies and the built-up areas occupied the least area. Specifically, water bodies recorded 1.06% in 2003 and 1.08% in 2019, while built-up areas recorded 0.34% in 2003 against 0.43% in 2019. These last two land use types represented 1.45% of the total area.

Figure 2.
The situation of main land use categories in 2003 (a), 2007 (b), 2011 (c), 2015 (d), and 2019 (e).
Table 4.
The statistics of the land use types in the years 2003, 2007, 2011, 2015, and 2019 (km2).
However, there are two significant findings worth mentioning. Built-up areas, grassland, and water bodies increased by 25.80%, 4.31%, and 2.02% during the study period, respectively. Conversely, ecological and agricultural land experienced a decline of around −3.58% and −1.40%, respectively. In the same sense, barren land decreased about –4.12%.
In Figure 3, P1–P4 represent 2003–2007, 2007–2011, 2011–2015, and 2015–2019, respectively. Thus, there are two main trends: the increase in built-up area and grassland, on the one hand, and a decrease in ecological and agricultural land, on the other.

Figure 3.
(P1–P4) show the speed and amplitude of land use types for 2003–2007, 2007–2011, 2011–2015, and 2015–2019, respectively. F represents the study area in 2003–2019, in which EC: ecological land; GL: grassland; WB: water bodies; AL: agricultural land, BUA: built-up area; BL: barren land.
With an average speed of 1.18%, the results of Figure 3 show that the speed of the built-up area evolution was high over the entire period. Only one period was lower than the series average of the four periods studied, with 0.92%. In addition, it recorded an average of 3.55% for the amplitude. As for grassland, it recorded an average speed of 0.21% and an amplitude of order 69.15%. Although the grassland speed was slow, it recorded a relatively high amplitude. Its amplitude remained the highest over the entire period and higher than other land use types.
Agricultural land experienced an average decrease of about −0.06%. However, over the period of 2011–2015, this average reached about 1.07%. It should also be noted that the amplitude of the agricultural land was therefore moderated with an average of about −9.01% over the study period. As far as ecological land was concerned, it recorded an average speed in terms of a decrease of the order −0.18%. The amplitude remained critical of the order −34.64%. Other types of utilization have relatively slow negative and positive speeds. For amplitude, this situation remains the same. These changes in land use types also had light shed onto them by the World Bank data. Agricultural land (% of total land area) was recorded by 45.46% and 44.18% for 2003–2007 and 2007–2011, respectively, and 46.22% over the study period. The investigation also found that the situation was the same for arable land, representing 17.83% for 2007–2011 and 19.3% over the period.
4.2. Analysis of the Ratio of the Land Consumption Rate to the Population Growth Rate (LCRPGR)
Figure 4 shows that the LCRPGR differs from one country to another and differs from one period to another. The results indicated that the LCR and PGR experienced fairly significant fluctuations during the study period. The LCR went from 0.2136 from 2003–2007 to 0.2092 over 2015–2019, a difference of 0.0044. Similarly, the PGR increased from 0.2226 to 0.2227 over the same period for a difference of 0.0001, increasing to 1,076,3347 inhabitants between the two periods. Therefore, the series average showed that the PGR (0.096) was higher than the LCR (0.079). Comprehensively, the overall analysis of land use efficiency showed that the population was growing faster than land use in ECOWAS.

Figure 4.
(a–d) shows the consumption land rate to population urban growth rate (LCRPGR) in 2003–2007, 2007–2011, 2011–2015, and 2015–2019, respectively, and (e) shows the study period of 2003–2019.
With an average value of 0.818 over the study period, the LCRPGR highlights the relationship between population growth and space occupancy. Over the study period, the population in the sub-region increased by an order of 135,765,506 inhabitants in 16 years. However, the inter-period results note an evolution of 0.0195 between 2003–2007 and 2015–2019. Overall, the LCR, PGR, and LCRPGR evolved slowly, as ratios had not reached one (1) overall in the periods considered in the study.
This overall analysis of LCRPGR hides a few disparities. Indeed, Figure 4 highlights a clear difference between the countries. Indeed, of the 15 countries analyzed, three (3) countries recorded an LCRPGR index greater than 1. Cabo Verde (1.69), Liberia (1.10), and Guinea Bissau (with 1.04) recorded this result. These three countries surpass Nigeria, considered the most populous country. It had an LCRPGR of an order of 0.884 between 2003 and 2019. The countries such as Senegal (0.709), Mali (0.711), and Burkina Fasso (0.708) recorded low, moderate scores. In contrast, Niger recorded the lowest LCRPGR score, with 0.576 over the study period. In summary, of the 15 regions analyzed, three (3) had a high upper LCRPGR. On the other hand, three (3) countries were considered moderate, three (3) of them were low, five (5) were middle–low, and one (1) was very low with regards to LCRPGR.
4.3. Degree of Coupling Coordination between Global Built-Up Area and Population Growth
Figure 5 shows that the analysis of the degree coupling model between the built-up area and population growth is complex. The inter-period results showed different results. Over the period of 2003–2007, countries such as Liberia (1.20), Guinea Bissau (1.07), and Nigeria (0.73) recorded high linkage patterns but with a relatively small decrease. The Cabo Verdi, which recorded a high LCRPGR over the same period, had a coupling degree of almost zero. Thus, Liberia was the exception during this period and showed high results for coupling coordination and the LCRPGR. However, countries such as Niger (0.01%), Mali (0.10), Burkina Fasso (0.03%), and Senegal (0.07) recorded weak coupling between 2003 to 2007. In addition, the intermediate countries recorded a record of moderate coupling. For instance, we noted that Togo had a value of 0.18, Gambia had 0.32, and Benin had 0.40 from 2011 to 2015. Overall, the inter-period analyses over five years shows that the results were between 0.0001 in Cabo Verdi from 2003 to 2007 and 1.20 in Liberia from 2007 to 2011. On the other hand, over the 2003–2019 study period, the results were between 0.31 in Niger and 29.78 in Liberia over 16 years. Liberia was followed by countries such as Nigeria at 10.36, Benin at 7.66, and Ghana at 6.95.
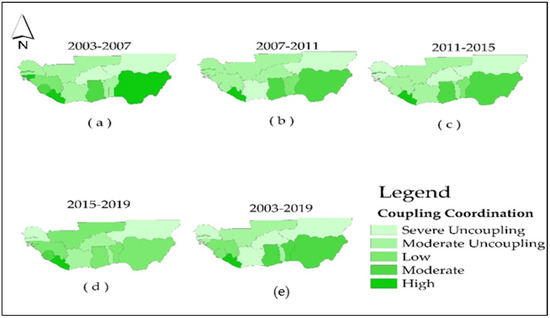
Figure 5.
(a–d) shows the coupling coordination between population growth and the built-up area in 2003–2007, 2007–2011, 2011–2015, and 2015–2019, respectively, and (e) shows the study period of 2003–2019.
The link between the built-up area and population growth analyses at the regional level was relatively varied. The results show that the rate of population change may have been high, but the ratio of the built-up area increase remained low. Niger was a perfect illustration of this. Over the study period, it recorded a rate of evolution of the order of 84.30% of its population for only 2.82% of built-up area growth. In this context, built-up areas were not correlated with the evolution of the population. However, we also note that both ratios were high. This situation implies that there was a perfect correlation between the two variables. This situation was the case in Liberia. With a rate of change of 60.46% of the population and 66.45% of the built-up area evolution, it recorded a coupling rate of 29.78 over the 16 years studied. Overall, these two cases provide reasonably detailed information that the issues of efficient land use in the subregion may depend on population growth and other related factors.
5. Discussion
5.1. Relationship between Population Growth and Land Use
Population growth has effects on land use over time. Land use change can also have a significant impact on population change, according to another study [63]. In 2003, the population density in the West African sub-region was 49.9 inhabitants/km2, compared to 76.87 habitats/km2 in 2019. Over 16 years, a difference of 26.97% was observed. The population increased by 54% during the same period, while the built-up area increased by 25.80%.
These statistics illustrate that population growth has exceeded the built-up area by more than double. Thus, it is clear that the population of West Africa is growing faster than the built-up area. On the other hand, some other study indicates that the situation is the opposite in those other world regions. For instance, urban expansion is more rapid than population growth in China [64], Japan [65], and India [66]. In this perspective, Maksym Polyakov and Daowei Zhang conclude that land is being converted to developed use at a greater rate than the population increase [67]. Under this situation, rapid population growth brings ECOWAS challenges.
Understanding the driving forces behind the change and the speed of land use changes is crucial to managing land use better [68]. In this study, the average expansion speed of the built-up area represented 1.62%. This result was similar to that observed in the groundnut basin in Senegal, with 1.45% between 2009 and 2018 [17]. In this case, the built-up area extension was identical in West Africa. Nevertheless, this somehow shows that built up areas are occupying more land to the detriment of other land use types, such as agricultural land or ecological land. According to World Bank data, the population in urban areas was superior to one million (% of the total population), representing 17.20% from 2003 to 2007 and 16.80% from 2015 to 2019. Consequently, population growth in the cities led to the increased built-up area. This situation can threaten other land use types, like agricultural land.
Ideally, an accepted ratio of land consumption to population growth rate should equal one (1) [61,62] regarding urban expansion. However, this study considered a global built-up area. In another work, it did not limit its investigation to the cities. Hence, over the study period, the LCRPGR represented an average of about 0.818. This result implies that in developing countries, land use management remains confronted with significant constraints. This situation is because an often-overlooked dimension of this urban transformation is the growth of small towns and medium-sized cities [38]. The emerging small towns are correlated with the migration factor [69]. As a result of this dispersion, it is challenging to implement effective land policies, resulting in a lack of knowledge about the land use system. As a consequence, a broad assessment of land use becomes undertaken. Therefore, an LCRPGR equal to one or near may be perceived as ineffective, whereas this study was a global analysis.
Additionally, urban density must be considered a key concept in describing a city’s urban spatial structure [69], particularly in the global built-up area. From then on, attaining more knowledge about population density can enhance land information and manage land efficiency. Built-up areas and population density can also build indicators, aggregated measures of one or more variables supporting policy making [70]. This context implies that controlling the density can result in masterful socioeconomics development. Indeed, the area ratio between built-up areas and populations was 0.606 m2 per capita in 2003. This ratio was estimated at approximately 0.495 m2 in 2019. Thus, the built area occupied per person seems to be reduced. In reality, the part of the area was not decreasing. The evolution of the population was faster than the expansion of the built-up area. The number of people per area increased during the study period. Under this situation, managing density of the population and efficient land use on a global scale must go hand to hand.
Moreover, this situation is still one of the significant struggles for African cities. A rapid growing population in urban areas without efficient land use management may lead to a lack of appropriate housing and other problems, such as unregulated housing. In other ways, population mobility is an important factor in determining the intensity of land use in urban areas. From this, practical land use may benefit the population’s well-being in urban areas. Therefore, effective urban land management seems essential to achieving the overarching goals of environmental sustainability, economic growth, and social inclusion [71]. We noted that today, land use efficiency is more concerned with rapid development regions, particularly urban areas. Hence, land use changes and population growth are linked to the space occupied over time. The proportion that each individual can occupy is only subjective. This dimension being too complex makes sustainable land use management difficult. In the study area, the evolution of the urban population was about 21.7% between 2003 and 2019. This development far exceeds the United States, which recorded 3.61%. This situation highlights the difficulties that can undermine the foundations of land use efficiency. Because a solid and rapid population migration makes it difficult to plan the occupation of space and induces a random and inefficient consumption of land, this shows that the links between land use and population growth are complex and unpredictable. Accordingly, more sustainable land use policies are required [72] to protect other land use types like ecological land, which decreased by −3.58% during the study period.
5.2. The Relationship between Socioeconomic Development and Land Use
The level of socio-economic development is seen as one of the differences between the least developed and developed countries. Industrialization is often one of the underpinning factors of a country’s level of development [73], and by extension, it shapes the growth of cities and agglomerations. Thus, according to basic urban economics, the equilibrium land use types are essentially determined by land rents [63]. Therefore, industrialization is the backbone of the processes of economic development. Nevertheless, since the post-colonial era, agriculture has been the primary and the predominant sector of West African economies [74].
For this reason, agricultural land continues to increase in many countries, like Senegal [75]. Unfortunately, this expansion does not come without ecological impact. It was noted that many factors contribute to deforestation in Ghana, including illegal and unsustainable forestry and agricultural expansion [76]. This situation may be one of the reasons why, according to the study, ecological and grassland land areas decreased by −54.97% and −23.28%, respectively, between 2011 to 2015.
Indeed, according to the study results, the built-up areas were characterized by rapid expansion. This extension depends on the availability of natural resources and their geographical localization. From an economic point of view, spatially differentiated land uses (residential, commercial, and industrial) are determined by the accessibility to the city center [77]. Urban sprawl is now influenced by several factors, including socioeconomic growth [78]. The trend of socioeconomic development resulted in a population concentration in towns. For this reason, some scholars certify that economic sciences have also addressed the impact of the size and density of urban areas in recent years [69]. Thus, the land is the support of all activities and suffers the impact of these activities in one way or another. In reality, each new project, whether for housing or economic purposes, leads to new constructions due to new land consumption.
This consumption depends on the level of income and the size of the project. The case of the building of dwellings is a convincing example. Indeed, man’s needs are not limited only to the demand for housing. In other words, an extension or creation of a new city involves other built-up area facilities, such as shopping malls, educational centers, etc. As a result, land consumption remains high in this case. This situation remains the same for industrial activities. New industries develop, often followed by dwellings and other built-up areas. Socio-economic development leads to land consumption in residential areas and economic purposes. However, it is interesting that industrial activities consume more land than residential extensions. All human activity a priori necessarily requires territorial implantation. It requires geographically accessible and well-equipped fields. There must be a close framework between spatial management and the whole economic dimension. Spatial economic models of land use often take the classic monocentric city model of urban economics [79]. This coordination of management makes it possible to control the size of cities and therefore promotes the conditions for a successful, efficient land use policy.
In developing countries, such as West African countries, industrialization is low compared with the United States or the Eurozone countries. Africa is home to five of the 10 fastest growing economies globally; this growth has been unsustainable and non-inclusive. Thus, it is mainly driven by exporting unprocessed commodities with little value [9]. Additionally, industrial investment is still too low in Sub-Saharan Africa, averaging 15% of GDP compared with 25% in Asia [80]. The data collected from the site of the World Bank highlighted that the characteristics of industrial development in ECOWAS are less essential than in the industrialized countries. Indeed, imported goods and services into the GDP recorded 36.30% over the study period, and the industrial added value was 17.37%. Besides, the industrial added value represented 23.3% in the European Union and 21.7% in China. Based on this comparison, the industrial development level in ECOWAS is less than in industrialized countries.
According to World Bank data, in 2019, the national income was not the same among the countries in ECOWAS. Indeed, some countries like Senegal, Ivory Coast, and Niger recorded US $23.57, US $58.79, and US $3.94 billion, respectively. In the same year, Nigeria recorded US $398.16 billion. Furthermore, according to the result, Nigeria recorded one of the essential LCR (0.084). Undoubtedly, it is clear that the industrial development level and space occupation do not reflect the same reality between the countries. Space occupation can be characterized by the speed of the spread of construction and population growth. Land use management becomes increasingly complex while these two factors intensify. Territorial strategy is based on the policies and mechanisms available to the country to implement a comprehensive spatial and temporal land use management approach. In the best cases, the managing land system must consider all types of space occupancy. This case is because agglomerations in the West African sub-region are often located in areas with natural resources, such as rivers, or in a country where manufacturing is developing. Previous literature highlighted that the manufacturing sector has been playing a crucial role in the economic growth of Nigeria [74]. However, the spread of built-up areas can considerably impact land policies. It implies that while the built-up area is shaped by industrialization in developed countries, it is dependent on natural resources.
The factors that induce built-up areas may differ between countries. Territorial inequalities can lead to reshaping the land use morphology. This imbalance can lead to migratory movements between cities. Thus, it is essential to understand that industrialization is generally correlated with poverty reduction [80]. Due to this fact, the rural population, for lack of solid income, moves to favorable areas searching for better living conditions. Compared with China (8.12%), the World Bank data show that the ECOWAS’s annual growth in GDP per capita recorded an average of 1.69% between 2003 and 2019. In this case, it generally assists rural depopulation, with implications for counties’ economic and social structure [81]. Rural hollowing is characterized as vacant and abandoned rural residential land in the inner villages [82]. The situation was evident in Senegal. Indeed, the decline of groundnut cultivation and the disappearance of certain industrial facilities for populations from the former urban centers and rural areas of the Groundnut Basin to the metropolis of Dakar occurred [83]. However, rural–urban migration in low-income nations, mainly West African countries, contributes to shortages in providing adequate housing, basic infrastructure, and services [50]. Migration, rural economic development [7], and urbanization [84] are the primary forces driving conversion from farmland to non-agricultural land uses. Thus, equality, migration, and income closely resemble urban land evolution. One way or another, West Africa has undergone intensive urbanization since the second half of the 20st century [85]. Despite the low level of development, the links between socio-economic development and land are increasingly various and complex. Thus, the extent of built-up sprawl is measured by the level of artificialization of the land. Measures for land use efficiency must consider the rapid evolution of the population and the process of socio-economic development that has been implemented. This problem is a significant problem in these countries.
Considering the level of development, the effectiveness of land use in ECOWAS is moderate or even low. This situation results from a lack of adequate policy, often due to the lack of control over the level of evolution of the population. On the other hand, the lack of financial resources combined with land use information leads to ineffective land use management administration. Therefore, the major problem is how the government will finance heavy urbanization over time. In other words, it is imperative to reflect and conduct a solid policy to implement the technical–financial means to ensure the efficiency of land use in ECOWAS countries.
5.3. The Relationship between Land Use Management and Land Use
Recently, efficient land use has become the core concept in socio-economic development. Several reforms have illustrated that new land use regulations can lead to economic growth. Indeed, rapid urban land area growth has been a significant characteristic of urbanization in China since reform and open-door policies began in the late 1970s [86]. Additionally, various sustainable land use management practices are influenced by farming technologies deployed by rural households, agro-ecological variations, plot characteristics, and institutional supports [34]. Consequently, land use management has significantly affected the land use process. The opposite can induce several problems. For instance, it was estimated that South Carolina could cost more than US $56 billion in infrastructure costs between 1995 and 2015 if current development trends remained unchecked [87].
According to this study, between 2003 to 2019, the average population of West Africans grew by 2.7% per year. As a result, land pressure is becoming increasingly high. Agricultural land, which decreased by −1.40% during the study period, was most threatened. Thus, the challenge for these countries is to ensure effective management of land use that considers both the rapidly changing population and supports ongoing socio-economic development. However, in most countries of the West African sub-region, land policy has rarely been established or is inadequate [23]. In other cases, the laws relating to the management of the land tenure system are often perceived as ambiguous. The law n 64–46 of 17 June 1964 governs land use management in Senegal, which stipulates that land does not belong to the State, territorial communities, or users but to the “Nation [88]. In other words, this law stipulates that most of the land in Senegal is national domain land that does not belong to the people who use it because the law has abolished customary rights. Consequently, the land is not registered and remains under traditional dominance; it is passed down from generation to generation.
However, land registration can allow for sustainable land use management. Better still, policies that aim to domesticate rural land practices to make them measurable, accounting, taxable, and governable are met with rural actors’ resistance [89]. As a result, landholders can sell, transfer, or reuse it for other purposes without significant legal constraints. Thus, it should be noted that the relationship between humans and land in African countries is different from that in other continents. From then on, these parameters mentioned above can be blocking factors for the efficient use of the land. Given that the LCRPGR result (0.82) was high, this situation can be at the root of inefficient land use in the West African sub-region.
Moreover, in African cities, the types of construction are often basic and rarely exceed 5–10 floors. The case of Senegal provides an excellent example to support this argument. The urbanism code does not provide vertical or horizontal construction types in Senegal. Rapidly growing cities gradually improve land use efficiency by increasing building height to control outward urban sprawl [90]. However, vertically built-up types consume the least land area. Hence, the horizontal construction policy can be a reliable means for implementing an effective land use policy. However, in African countries, constructions are generally of vertical types. It is easy to understand that land use policy poses a political problem and a regulatory one. However, due to a lack of good practice, land use in West Africa is far from initiating effective land use management and policy. In most areas in West Africa, the restructuring of specific laws will strive to put a legal system that will facilitate access to and management of land in general and agricultural land in particular [17].
Improving urban land use efficiency is commonly recognized as paramount in balancing farmland protection and the accommodation of socio-economic development [91]. Therefore, ECOWAS countries can implement or learn from many successes experienced worldwide regarding the big issue of managing efficient land. These land policy reforms can positively impact agricultural land and enhance urban and rural land efficiency. In another work, this policy aims at improving the level of agricultural land strategy and the frame of urban sprawl. Hence, implementing a new land policy in the ECOWAS can fight against the conversion of agricultural land into urban land. This situation is because the high demands for residential land use are the original force for urban expansion. The background shows that there are several methods for managing land use. We attempted to select and focus on some significant examples. Among this land policy, land consolidation is a helpful tool for the sustainable development of vacant and wasteland and improving land quality [82].
Additionally, it is essential to implement land policy inclusively linked to the adopted socio-economic development model. Poor coordination between socio-economic development laws can block the reform [17]. The basic structure of the Japanese urban land use management system is zoning regulations [92], implying that Japan’s territory has been shared according to socioeconomics. The same source highlighted that the efficient management of land use in Japan is essential to divide the national area into an urbanization-promotion area, industrial area, an agricultural area, etc. In China, the government has implemented a new approach role for land use to equilibrate the relationship between farmland and socio-economic development [86]. Indeed, political policies to optimize the urban–rural spatial structure and urban–rural coordinated development were adopted. This method mainly corrects the contradictions between innovation-driven development and institutional constraints.
6. Conclusions
The objectives of this article were to evaluate the LCRPGR and understand the evolution of land use types in West African countries. Indeed, this research has been carried out while West Africa confronts many issues that might impact land use. Rapid population growth [93], socio-economic development [94], and a lack of land policy implementation [88] are among the issues.
The main conclusions highlighted several aspects. The study period (2003 to 2019) showed that the LCRPGR represented about 0.82, increasing by 135,765,506 habitants over 16 years. The results for each country underline that Cabo Verdi recorded the highest LCRPGR with 1.693, and Niger occupied the last place with 0.576. The degree of coupling coordination model also showed different results. The degree of coupling in West African countries was 6.81 for the study period. The built-up area increased by 25.80%, and the population increased by 54.06%. Additionally, the land area per capita was 0.66 m2 in 2003 and was estimated at 0.495 m2 in 2019. Hence, the built-up area expanded faster than the population. The findings by country showed that the degree of coupling was high in Liberia (29.78) and low in Niger (0.37). At the same time, the population is increasing by 1,860,319 habitats in Liberia and 10,662,736 inhabitants in Niger.
Furthermore, from 2003 to 2019, grassland, ecological, and agricultural land represented 41.21%, 23.77%, and 15.89% of the total area. Otherwise, built-up land area occupied only 2.22% of the total area. In contrast, ecological and agricultural land decreased by −3.50% and −1.40%, respectively. Built-up areas recorded the main significant result with 25.80%. As a result, these findings have significant implications, because they provide relevant insights and knowledge about the evolution of land use in ECOWAS. As a consequence, this methodology is limited to analyzing the impact of socio-economic development on land use change in meticulous detail.
However, this paper advocated for paying attention to the issues. Agriculture provides the largest share of food supplies and ensures many ecosystem services [95]. In another way, food safety and security are two complementing elements of our sustainable future [96]. Given that the development of some cities is not the same, the study suggests a profound analysis of the changing towns like Dakar in Senegal. In 2020, the population of this city was estimated at 3,938,358 inhabitants for a land area of about 544 km2. The density represented 7239 inhabitants/km2, according to the national agency of statistics and demographics. Future research can provide information on land and urban sprawl. Another fact, according to World Bank data in 2020, is that West African countries’ average GDP was −0.4%. In the context of Covid19, we could observe population migration from rural to urban areas, which may have contributed to the emergence of additional suburban tows. Population growth and economic factors remain at the top of the global land use research agenda. Thus, ECOWAS must be towards sustainable land use by combining ecological, economic characteristics, and food policies. On the opposite hand, if population and economic growth continue in this trend without a comprehensive land use policy, the land consumption rate in ECOWAS could become one of the most significant and rapid in the world. As a result, the need for residential and economic land should be balanced, and socioeconomic concerns should be properly addressed in land reform.
Author Contributions
Conceptualization, B.F. and G.D.; methodology, B.F.; validation, G.D., B.F. and R.Z.; formal analysis, G.D.; resources, B.F. and R.Z.; data curation, B.F.; writing—original draft preparation, B.F.; writing—review and editing, G.D. and B.F.; visualization, B.F. and R.Z.; supervision, G.D.; project administration, G.D.; acquisition of funding, G.D. All authors have read and agreed to the published version of the manuscript.
Funding
This research was funded by the National Social Science Foundation of China, grand No. 21BJY209.
Institutional Review Board Statement
Not applicable.
Informed Consent Statement
Informed consent was obtained from all subjects involved in the study.
Data Availability Statement
Not applicable.
Acknowledgments
We would like to express our gratitude to the professionals of the Northeast Agricultural University who encouraged us to make this project a success.
Conflicts of Interest
The authors declare no conflict of interest.
References
- Ng, M.K.; Koksal, C.; Wong, C.; Tang, Y. Smart and Sustainable Development from a Spatial Planning Perspective: The Case of Shenzhen and Greater Manchester. Sustainability 2022, 14, 3509. [Google Scholar] [CrossRef]
- Barbé, H.; Frascaria-Lacoste, N. Integrating Ecology into Land Planning and Development: Between Disillusionment and Hope, Questioning the Relevance and Implementation of the Mitigation Hierarchy. Sustainability 2021, 13, 12726. [Google Scholar] [CrossRef]
- World Bank. World Development Report 2003: Sustainable Development in a Dynamic World—Transforming Institutions, Growth, and Quality of Life; The World Bank: Washington, DC, USA, 2003. [Google Scholar]
- Ranganathan, J.; Vennard, D.; Waite, R.; Lipinsk, B. Shifting Diets for a Sustainable Food Future; Working Paper, Installment 11 of Creating a Sustainable Food Future; World Resources Institute: Washington, DC, USA, 2016; Available online: http://www.worldresourcesreport.org (accessed on 27 May 2022).
- Chigvintsev, V.; Artyukhin, O.; Tereshchenko, V.; Ponedelkov, A.; Kritskaya, A. Food security of Russia: Main approaches to ensuring it (political science analysis). E3S Web Conf. 2020, 210, 03002. [Google Scholar] [CrossRef]
- Pratibha, N.; Belinda, R.; Alexandra, J.; Sally, M. Food Policy in Australia: The Role of Different Federal Government Organisations; The University of Sydney: Sydney, Australia, 2021. [Google Scholar]
- Liu, Y.; Yang, R.; Long, H.; Gao, J.; Wang, J. Implications of land-use change in rural China: A case study of Yucheng, Shandong province. Land Use Policy 2014, 40, 111–118. [Google Scholar] [CrossRef]
- Fróna, D.; Szenderák, J.; Harangi-Rákos, M. The Challenge of Feeding the World. Sustainability 2019, 11, 5816. [Google Scholar] [CrossRef]
- African Development Bank Group. Industrialize African: Annual Report. 2019. Available online: https://www.afdb.org/en/annual-report-2019 (accessed on 13 March 2022).
- Brown, D.G.; Johnson, K.M.; Loveland, T.R.; Theobald, D.M. Rural land-use trends in the conterminous united states, 1950–2000. Ecol. Appl. 2005, 15, 1851–1863. [Google Scholar] [CrossRef]
- United States (UN-HABITAT). Land Consumption-Module 3; United Nations Human Settlements Program: Nairobi, Kenya, 2018. [Google Scholar]
- Lubida, A.; Veysipanah, M.; Pilesjo, P.; Mansourian, A. Land-Use planning for sustainable urban development in africa: A spatial and multi-objective optimization approach. Geod. Cartogr. 2019, 45, 1–15. [Google Scholar] [CrossRef]
- Organization for Economic Co-operation and Development (OECD). Towards Sustainable Land Use Aligning Biodiversity, Climate, and Food Policies; OECD Publishing: Paris, France, 2020. [Google Scholar] [CrossRef]
- Niu, B.; Ge, D.; Yan, R.; Ma, Y.; Sun, D.; Lu, M.; Lu, Y. The Evolution of the Interactive Relationship between Urbanization and Land-Use Transition: A Case Study of the Yangtze River Delta. Land 2021, 10, 804. [Google Scholar] [CrossRef]
- Gau, H.R.; Aide, M. Globalization and Land-Use Transitions in Latin America. Ecol. Soc. 2008, 13, 16. [Google Scholar]
- Schubert, H.; Calvo, A.C.; Rauchecker, M.; Rojas-Zamora, O.; Brokamp, G.; Schütt, B. Assessment of Land Cover Changes in the Hinterland of Barranquilla (Colombia) Using Landsat Imagery and Logistic Regression. Land 2018, 7, 152. [Google Scholar] [CrossRef]
- Faye, B.; Du, G. Agricultural Land Transition in the “Groundnut Basin” of Senegal: 2009 to 2018. Land 2021, 10, 996. [Google Scholar] [CrossRef]
- Long, H.; Zhang, Y.; Ma, L.; Tu, S. Land Use Transitions: Progress, Challenges and Prospects. Land 2021, 10, 903. [Google Scholar] [CrossRef]
- Michel, C.; Horst, K.; Benjamin, M. Africa 2050: African Demography; Emerging Markets Forum: Washington, DC, USA, 2013. [Google Scholar]
- Niang, A.; Fatou, N.; Sarr, M.; Hathie, I.; Diouf, N.C.; Oumar, B.C.; Ka, I.; Gagné, M. Understanding Changing Land Access and Use by the Rural Poor in Senegal; International Institute for Environment and Development: London, UK, 2017. Available online: lied.org https://pubs.iied.org/17596iied (accessed on 22 May 2021).
- Hilhorst, T. The Role of Local Governance Bodies in Natural Resource Management in Mali, Burkina Faso and Niger, KIT Working Papers Series WPS.G1. 2008. Available online: www.kit.nl/workingpapers (accessed on 17 May 2022).
- Fritsche, U.R.; Eppler, U.; Iriarte, L.; Laaks, S.; Wunder, S.; Kaphengst, T.; Wolff, F.; Heyen, D.; Lutzenberger, A. Resource-Efficient Land Use—Towards a Global Sustainable Land Use Standard (GLOBALANDS); Umwelt Bundesamt: Berlin, Germany, 2015. [Google Scholar]
- Cotula, L.; Toulmin, C.; Hesse, C. Land Tenure and Resource Access in Africa Land Tenure and Administration in Africa: Lessons of Experience and Emerging Issues; International Institute for Environment and Development: London, UK, 2004. [Google Scholar]
- Food and Agriculture Organization of the United Nations and African Development Bank Group. Agricultural Growth in West Africa as a Market and Policy Driver (French). 2015. Available online: http://www.fao.org/3/i4337f/i4337f.pdf (accessed on 30 April 2021).
- Ottawa Research and Development Centre; Agriculture and Agri–Food Canada. Crop Rotations: Farming Practices, Monitoring, and Environmental Benefits; Nova Science Publishers: New York, NY, USA, 2016; Available online: https://novapublishers.com/shop/crop-rotations-farming-practices-monitoring-and-environmental-benefits/ (accessed on 30 October 2021).
- Federal Ministry for Economic Cooperation and Development (GIZ). Land Use Planning Concept, Tools and Applications; Federal Ministry for Economic Cooperation and Development: Berlin, Germany, 2011. [Google Scholar]
- Food and Agriculture Organization (FAO). The Future of Food and Agriculture Trends and Challenges; Food and Agriculture Organization: Rome, Italy, 2017. [Google Scholar]
- Fan, Z.; Deng, C.; Fan, Y.; Zhang, P.; Lu, H. Spatial-Temporal Pattern and Evolution Trend of the Cultivated Land Use Eco-Efficiency in the National Pilot Zone for Ecological Conservation in China. Int. J. Environ. Res. Public Health 2021, 19, 111. [Google Scholar] [CrossRef] [PubMed]
- African Union. The Africa We Want-Agenda 2063; African Union: Addis Ababa, Ethiopia, 2015. [Google Scholar]
- Manga Mohamed Lamine. Déforestation et Conflits Fonciers au Sénégal (1960–2012); Manga Mohamed Lamine: Togo, Cotonou, 2019. [Google Scholar]
- African Land Forum. Land Forum 15–17 September Regional Assembly 18 September: Agenda 2063; African Union: Addis Ababa, Ethiopia, 2020. [Google Scholar]
- Yuji, M.; Rajesh, B. Thapa, S. Analysis and Modeling in Geographical Transformation Process; The GeoJournal Library: London, UK; New York, NY, USA, 2011; Volume 100. [Google Scholar]
- Kendie, S.B. The Planning and Management of Land Resources in Africa; Centre for Development Studies: Cape Coast, Ghana, 2000. [Google Scholar]
- Etsay, H.; Negash, T.; Aregay, M. Factors that influence the implementation of sustainable land management practices by rural households in Tigrai region, Ethiopia. Ecol. Process. 2019, 8, 14. [Google Scholar] [CrossRef]
- Macie, E.A.; Hermansen, L.A. Human influences on forest ecosystems: The southern wildland-urban interface assessment: Summary report. For. Serv. 2003, 64, 13. [Google Scholar] [CrossRef]
- OECD. Towards Sustainable Land Use; OECD: Paris, France, 2020. [Google Scholar]
- Kouassi, J.-L.; Gyau, A.; Diby, L.; Bene, Y.; Kouamé, C. Assessing Land Use and Land Cover Change and Farmers’ Perceptions of Deforestation and Land Degradation in South-West Côte d’Ivoire, West Africa. Land 2021, 10, 429. [Google Scholar] [CrossRef]
- Agergaard, J.; Kirkegaard, S.; Birch-Thomsen, T. Between Village and Town: Small-Town Urbanism in Sub-Saharan Africa. Sustainability 2021, 13, 1417. [Google Scholar] [CrossRef]
- Iyoha, M.; Okim, A. The Impact of Trade on Economic Growth in ECOWAS Countries: Evidence from Panel Data. CBN J. Appl. Stat. 2017, 8, 23–49. [Google Scholar]
- USAID. Economic Growth and Trade|West Africa Regional|U.S. Agency for International Development. 2022. Available online: https://www.usaid.gov/west-africa-regiona/economic-growth-and-trade (accessed on 6 May 2022).
- Fayomi, O.; Adeola, G.L. ECOWAS and Sub-Regional Integration in West Africa: An Appraisal Covenant University Journal of Politics and International Affairs; OTA: Ogun State, Nigeria, 2015; Volume 3. [Google Scholar]
- Eresanya, E.O.; Oluleye, A.; Daramola, M.T. The Influence of Rainfall and Temperature on Total Column Ozone over West Africa. Adv. Res. 2017, 10, 1–11. [Google Scholar] [CrossRef]
- Djenaba, T. ECOWAS Challenges and Prospects-Presentation of the Research Activities of the West Africa Institut, (IAO). 2021. Available online: https://www.researchgate.net/publication/332083307_Defis_et_Perspectives_de_la_CEDEAO_-_Presentation_des_Activites_de_Recherche_de_l%27Institut_de_l%27Afrique_de_l%27Ouest_IAO (accessed on 29 October 2021).
- Faye, M.; Fall, A.; Faye, G.; Van Hecke, E. Rainfall variability and its impacts on agricultural yields in the New Land area (Eastern Senegal). BELGEO 2018. [Google Scholar] [CrossRef]
- Beucher, O.; Bazin, F. Agriculture in Africa and the Challenges of Climate Change; Institut de l’energie et de l’environnement de la Francophonie: Paris, France, 2012. [Google Scholar]
- Karen, H.-H.; Rüdiger, W.; Marco, S.; Georg, Z.; Adjima, T; Brice, S. Vegetation of West Africa—In Book: Biodiversity Atlas of West Africa II Chapter: 3.1. 2010. Available online: https://www.researchgate.net/publication/230816315_Vegetation_of_West_Africa (accessed on 22 November 2021).
- Sylla, M.B.; Nikiema, P.M.; Gibba, P.; Kebe, I.; Klutse, N.A.B. Climate change over West Africa: Recent trends and future projections. In Adaptation to Climate Change and Variability in Rural West Africa; Springer International Publishing: Cham, Switzerland, 2016; pp. 25–40. [Google Scholar]
- Jesús, G.-L.; Gema, S. ECOWAS Regional Integration Processes and International Cooperation; Spanish Agency for international Cooperation and Development: Madrid, Spain, 2014. [Google Scholar]
- National Agence Statistics Demography. Republic of Senegal Provisional 2017 and Final 2016 National Accounts (2014 base) (French). 2019. Available online: http://www.ansd.sn/ressources/publications/NOTE ANALYSE COMPTES NATIONAUX 2017_.pdf (accessed on 11 May 2021).
- Tacoli, C.; Mcgranahan, G.; Satterthwaite, D. Urbanization, Rural-Urban Migration, and Urban Poverty; International Institute for Environment and Development: London, UK, 2014. [Google Scholar]
- Ambiente, Y.M. West African Landscapes: A View on a Changing World; U.S. Geological Survey EROS: Garretson, SD, USA, 2016; pp. 279–280. [Google Scholar]
- Ndong, J.-B. L’évolution de la pluviométrie au Sénégal et les incidences de la sécheresse récente sur l’environnement/The evolution of rainfall in Senegal and the consequences of the recent drought on the environment. Rev. Geographie Lyon 1995, 70, 193–198. [Google Scholar] [CrossRef]
- Mechiche-Alami, A.; Abdi, A.M. Agricultural productivity in relation to climate and cropland management in West Africa. Sci. Rep. 2020, 10, 3393. [Google Scholar] [CrossRef] [PubMed]
- Faye, C. Analysis of Drought Trends in Senegalese Coastal Zone on Different Climatic Domains (1951–2010); Analele Universităţii din Oradea, Seria Geografie: Oradea, Romania, 2018; Available online: https://www.researchgate.net/publication/329351771_ANALYSIS_OF_DROUGHT_TRENDS_IN_SENEGALESE_COASTAL_ZONE_ON_DIFFERENT_CLIMATIC_DOMAINS_1951-2010 (accessed on 29 July 2021).
- Hereher, M. The Sahara: A Desert of Change; Nova Science Publishers, Inc.: Hauppauge, NY, USA, 2011; pp. 101–114. Available online: https://squ.pure.elsevier.com/en/publications/the-sahara-a-desert-of-change (accessed on 11 November 2021).
- Babagana, A. Sahara Desert Treasures, Geography, and Associated Wonders: Yesterday, Today and Tomorrow. 2016. Available online: https://www.researchgate.net/publication/309648345.; https://www.researchgate.net/publication/309648345_Sahara_Desert_Treasures_Geography_and_Associated_Wonders_Yesterday_Today_and_Tomorrow (accessed on 11 November 2021).
- Díaz-Pacheco, J.; van Delden, H.; Hewitt, R. The Importance of Scale in Land Use Models: Experiments in Data Conversion, Data Resampling, Resolution and Neighborhood Extent; Springer: Cham, Switzerland, 2018; pp. 163–186. [Google Scholar] [CrossRef]
- Anderson, J.R.; Hardy, E.E.; Roach, J.T.; Witmer, R.E. A land use and land cover classification system for use with Remote Sensor Data; Professional Paper; US Government Printing Office: Washington, DC, USA, 1976. [Google Scholar]
- Du, G.; Ma, J.; Chun, X. Study on the transformation of arable land use patterns in modern agricultural areas. Angew. Chem. Int. 2018, 6, 951–952. [Google Scholar] [CrossRef]
- Yao, Y. Study on the Space-time Evolution Characteristics of Land-Use Transformation in Hunan Province and Its Coupling Coordination Mechanism with Social and Economic Development; China University of Geosciences: Wuhan, China, 2020. [Google Scholar]
- Ouadday, S. Using Geospatial Information to Measure Urban Indicators (ODD 11) Cas de la Tunisie. 2021. Available online: https://docplayer.fr/214756483-Utilisation-des-informations-geospatiales-pour-mesurer-les-indicateurs-urbains-odd-11-cas-de-la-tunisie.html (accessed on 27 October 2021).
- Gao, Y.; Li, H.; Song, Y. Interaction Relationship between Urbanization and Land Use Multifunctionality: Evidence from Han River Basin, China. Land 2021, 10, 938. [Google Scholar] [CrossRef]
- Tong, Q.; Qiu, F. Population growth and land development: Investigating the bi-directional interactions. Ecol. Econ. 2019, 169, 106505. [Google Scholar] [CrossRef]
- Huang, X.; Xia, J.; Xiao, R.; He, T. Urban expansion patterns of 291 Chinese cities, 1990–2015. Int. J. Digit. Earth 2017, 12, 62–77. [Google Scholar] [CrossRef]
- The World Bank Group. Tokyo Development Learning Center Policy Paper Series II: A Case Study on Territorial Development In Japan. 2017. Available online: www.worldbank.org (accessed on 6 May 2022).
- Sabyasachi, T. Relationship between Infrastructure and Population Agglomerationin Urban India: An Empirical Assessment; ADBI Working Paper 731; Asian Development Bank Institute: Tokyo, Japan, 2017; Available online: adb.org/sites/default/files/publication/301256/adbi-wp731.pdf (accessed on 6 May 2022).
- Polyakov, M.; Zhang, D. Population Growth and Land Use Dynamics along Urban–Rural Gradient. J. Agric. Appl. Econ. 2008, 40, 649–666. [Google Scholar] [CrossRef]
- Shi, G.; Jiang, N.; Yao, L. Land Use and Cover Change during the Rapid Economic Growth Period from 1990 to 2010: A Case Study of Shanghai. Sustainability 2018, 10, 426. [Google Scholar] [CrossRef]
- Krehl, A.; Siedentop, S.; Taubenböck, H.; Wurm, M. A Comprehensive View on Urban Spatial Structure: Urban Density Patterns of German City Regions. ISPRS Int. J. Geo Inf. 2016, 5, 76. [Google Scholar] [CrossRef]
- Ehrlich, D.; Kemper, T.; Pesaresi, M.; Corbane, C. Built-up area and population density: Two Essential Societal Variables to address climate hazard impact. Environ. Sci. Policy 2018, 90, 73–82. [Google Scholar] [CrossRef] [PubMed]
- Organization for Economic Cooperation and Development (OECD). The Governance of Land Use: Policies Highlights. Regional Development Policy Division in the Public Government and Territorial Development Directorate of the OECD; Organization for Economic Cooperation and Development: Paris, French, 2017. [Google Scholar]
- Nicolau, R.; David, J.; Caetano, M.; Pereira, J.M.C. Ratio of Land Consumption Rate to Population Growth Rate—Analysis of Different Formulations Applied to Mainland Portugal. ISPRS Int. J. Geo Inf. 2018, 8, 10. [Google Scholar] [CrossRef]
- Tsipouri, L. Innovation Policy in Southern Europe: Smart Specialization Versus Path Dependence. In Advances in the Theory and Practice of Smart Specialization; Elsevier: Amsterdam, The Netherlands, 2017; pp. 125–155. [Google Scholar]
- Van, G. The Effect of Economic Sectors on the National Income of West African Economies from 2010 to 2019: A Multiple Regression Analysis; George Washington University: Washington, DC, USA; Duke University: Durham, NC, USA, 2020. [Google Scholar]
- Faye, B. Problématique de la gestion des ressources naturelles dans la Commune de Mont-Rolland. (Thiès). Master’s Thesis, Ecole de management de Dakar, Dakar, Senegal, 2017. [Google Scholar]
- Acheampong, E.O.; Macgregor, C.J.; Sloan, S.; Sayer, J. Deforestation is driven by agricultural expansion in Ghana’s forest reserves. Sci. Afr. 2019, 5, e00146. [Google Scholar] [CrossRef]
- Lai, Y.; Chen, K.; Zhang, J.; Liu, F. Transformation of Industrial Land in Urban Renewal in Shenzhen, China. Land 2020, 9, 371. [Google Scholar] [CrossRef]
- Ewing, R. Is Los Angeles-Style Sprawl Desirable? J. Am. Plan. Assoc. 1997, 63, 107–126. [Google Scholar] [CrossRef]
- Fragkias, M.; Geoghegan, J. Commercial and industrial land use change, job decentralization and growth controls: A spatially explicit analysis. J. Land Use Sci. 2010, 5, 45–66. [Google Scholar] [CrossRef][Green Version]
- Cadot, O.; Plane, P.; Wagner, L.; De Melo, J.; Woldemichael, M.T. Industrialisation and Structural Change: Can Sub-Saharan Africa Develop without Factories? Working paper; the Foundation for studies and Research on International Development (FERDI): Clermont-Ferrand, France, 2016. [Google Scholar]
- Johnson, K.M.; Lichter, D.T. Rural Depopulation: Growth and Decline Processes over the Past Century. Rural Sociol. 2019, 84, 3–27. [Google Scholar] [CrossRef]
- Liu, Y.; Li, J.T.; Yang, Y. Strategic adjustment of land use policy under the economic transformation. Land Use Policy 2018, 74, 5–14. [Google Scholar] [CrossRef]
- Carlos, O.; Cheikh, O.B. Agricultural Policies 2000-2012: Between Voluntarism and Incoherence (French). 2013. Available online: https://eprints.soas.ac.uk/16799/1/04Oya-Ba130131%20proof.pdf (accessed on 29 April 2021).
- Rondhi, M.; Pratiwi, P.A.; Handini, V.T.; Sunartomo, A.F.; Budiman, S.A. Agricultural Land Conversion, Land Economic Value, and Sustainable Agriculture: A Case Study in East Java, Indonesia. Land 2018, 7, 148. [Google Scholar] [CrossRef]
- Eva, D.; Benjamin, S. Rural-Urban Migration in West Africa: Contexts, Trends, and Recommendations. 2021. Available online: https://www.knomad.org/publication/rural-urban-migration-west-africa-contexts-trends-and-recommendations (accessed on 2 May 2022).
- Han, H.; Lai, S.-K. National Land Use Management in China: An Analytical Framework. J. Urban Manag. 2012, 1, 3–38. [Google Scholar] [CrossRef]
- Kundell, J.E.; Myszewski, M.; Terry, A.D. Land Use Planning and Policy Issues. 2002. Available online: https://urbanforestrysouth.org/swui-assessment/ch4.pdf (accessed on 2 May 2022).
- Niang, A.; Knapman, C. Land Access for Senegal’s Small Producers Under Threat; International Institute for Environment and Development: London, UK, 2017; Available online: https://pubs.iied.org/17375iied (accessed on 29 April 2021).
- Gabin, K. Burkina Faso, the Cadastral Factory of Rural Space: Size Competition and Land Appropriation by Title; University of Ouagadougou: Ouagadougou, Burkina Faso, 2015; Available online: https://www.researchgate.net/publication/317350489_La_fabrique_cadastrale_de_l%27espace_rural_Concurrence_de_grandeurs_et_appropriation_fonciere_par_le_titre_au_Burkina_Faso (accessed on 6 December 2021).
- Galster, G.; Hanson, R.; Ratcliffe, M.; Wolman, H.; Coleman, S.; Freihage, J. Wrestling Sprawl to the Ground: Defining and Measuring an Elusive Concept. Hous. Policy Debate 2001, 12, 681–717. [Google Scholar] [CrossRef]
- Yang, X.; Wu, Y.; Dang, H. Urban Land Use Efficiency and Coordination in China. Sustainability 2017, 9, 410. [Google Scholar] [CrossRef]
- Tatsuo, A. Urban Land Use Planning System in Japan; National Institute for Land and Infrastructure Management: Japan, Tokyo, 2007. [Google Scholar]
- Kaba, A.J. Explaining Africa’s Rapid Population Growth, 1950 to 2020: Trends, Factors, Implications, and Recommendations. Sociol. Mind 2020, 10, 226–268. [Google Scholar] [CrossRef]
- Savvides, A. Economic growth in Africa. World Dev. 1995, 23, 449–458. [Google Scholar] [CrossRef]
- Viana, C.M.; Freire, D.; Abrantes, P.; Rocha, J.; Pereira, P. Agricultural land systems importance for supporting food security and sustainable development goals: A systematic review. Sci. Total Environ. 2021, 806, 150718. [Google Scholar] [CrossRef]
- Vågsholm, I.; Arzoomand, N.S.; Boqvist, S. Food Security, Safety, and Sustainability—Getting the Trade-Offs Right. Front. Sustain. Food Syst. 2020, 4, 16. [Google Scholar] [CrossRef]
Publisher’s Note: MDPI stays neutral with regard to jurisdictional claims in published maps and institutional affiliations. |
© 2022 by the authors. Licensee MDPI, Basel, Switzerland. This article is an open access article distributed under the terms and conditions of the Creative Commons Attribution (CC BY) license (https://creativecommons.org/licenses/by/4.0/).