Article

Compositional and Animal Feeding Assessments of a Novel Herbicide-Tolerant Maize Variety

1
Institute of Insect Sciences, College of Agriculture and Biotechnology, Zhejiang University, Hangzhou 310058, China
2
Development Center for Science and Technology, Ministry of Agriculture and Rural Affairs, Beijing 100176, China
3
State Key Laboratory for Managing Biotic and Chemical Threats to the Quality and Safety of Agro-Products, Zhejiang Academy of Agricultural Sciences, Hangzhou 310021, China
4
The Supervision, Inspection and Testing Center of Genetically Modified Organisms, Ministry of Agriculture, Beijing 100083, China
*
Author to whom correspondence should be addressed.
Agriculture 2022, 12(6), 808; https://doi.org/10.3390/agriculture12060808
Submission received: 6 May 2022 / Revised: 24 May 2022 / Accepted: 1 June 2022 / Published: 3 June 2022
(This article belongs to the Special Issue Detection and Identification of Transgenic Organisms in Agriculture)

Abstract

:
ZDAX5 is a variety of herbicide-tolerant maize that contains the modified P450-N-Z1 gene isolated from Cynodon dactylon (L.) Pers. and the cp4 epsps gene isolated from the Agrobacterium tumefaciens strain CP4 and exhibits high tolerances to flazasulfuron and glyphosate under field conditions. Once ZDAX5 corn is available on the market, the evolution of herbicide-resistant weeds will be delayed by applying glyphosate and flazasulfuron to corn fields. Prior to commercialization, it is critical to assess the safety of ZDAX5 maize. Compositional analysis and feed consumption studies in rodents are an important consideration in the safety assessment of genetically modified crops. The nutritional components of ZDAX5 were analyzed and compared with those of its non-transgenic counterpart. The data showed that all the analyzed components in the herbicide-tolerant maize plants were substantially equivalent to those of its non-transgenic counterpart. Furthermore, most of the measured values from ZDAX5 were within the range of values reported for other commercial maize varieties. The sub-chronic feeding trial was carried out with grains from GM, and non-GM maize were independently added into rodent diets at concentrations of 12.5%, 25% and 50%. As a control, another set of rats was fed with a marketed diet. At the end of the 90-day feeding study, no negative effects associated with the consumption of GM maize were found. These results indicate that the herbicide-tolerant maize ZDAX5 is as nutritious and safe as non-transgenic maize.

1. Introduction

Genetically modified (GM) crops have been widely used in agricultural and food production [1]. In 2019, 190.4 million hectares of genetically modified crops were cultivated worldwide, with herbicide tolerant crops accounting for 43% [2]. Most commercial biotech crops planted throughout the world have one or more genes transferred into their genomes by contemporary biotechnology to gain desired traits such as herbicide tolerance as well as insect or disease resistance [3,4,5,6]. Since it is nutritious and affordable, maize is not only a staple food crop but also an essential raw ingredient for the feed industry. Despite this, weeds caused significant losses in productivity and quality [7,8]. Favorable climatic conditions foster weed development in widely spread crops, such as maize, resulting in yield reductions of up to 70% [9]. In addition, weeds disrupt crop metabolism, reducing carbs, proteins, fats and cellulose levels, which ultimately lowers crop quality. When maize is affected by weeds, the amount of protein and starch in the grains is reduced [10]. Herbicides are the most common, effective and cost-efficient technique for preventing and treating weeds. Herbicide-tolerant traits in genetically modified crops can help farmers increase crop yields by reducing weed pressure [11,12,13]. Most GM crops, on the other hand, are only herbicide-tolerant to one herbicide, such as glyphosate, and continued use of herbicides with the same mechanism of action can lead to the evolution of herbicide-resistant weeds [14,15,16,17]. To prevent the emergence and spread of herbicide-resistant weeds, new genes are required to develop transgenic herbicide-tolerant crops. In China, an herbicide-tolerant maize variety (ZDAX5) was developed by inserting the P450-N-Z1 gene isolated from Cynodon dactylon (L.) Pers. and the cp4 epsps gene isolated from Agrobacterium tumefaciens strain CP4 into the maize genome. The initial analysis showed that ZDAX5 corn was highly tolerant to flazasulfuron and glyphosate under field conditions (data not published). Flazasulfuron is a sulfonylurea herbicide that controls a wide range of weeds, including both annual and perennial species [18,19,20,21]. It is a selective systematic herbicide for pre-emergence and early post-emergence weed control. Mixed or alternate use of flazasulfuron and glyphosate can effectively slow down the emergence and development of herbicide resistance in weeds due to different modes of action between the flazasulfuron and glyphosate. Currently, there is no flazasulfuron-tolerant transgenic maize in both China and overseas. Farmers will be free to choose between herbicides with two different modes of action in their weed-control plans once ZDAX5 corn is available on the market. It may delay the appearance of new herbicide-resistant weeds if flazasulfuron is used in a reasoned manner in combination with glyphosate.
The food and feed safety of GM plants must be evaluated prior to commercialization. The study of the safety of foods or feeds obtained from GM crops tackles two key sources of possible health implications: those resulting from the activity and presence of the inserted trait (typically a protein) as well as the characteristics of the resulting food or feed crop plant [22]. Therefore, it was important to determine whether the insertion of the P450-N-Z1 and cp4 epsps genes into the corn genome or the presence of the P450-N-Z1 and CP4 EPSPS proteins caused any significant changes in the safety and nutrients of ZDAX5. The study of whether a GM plant is as healthy and nutritious as its counterpart plant includes several elements of evaluation, including toxicological, nutritional, microbiological and environmental consequences, in a process referred to as substantial equivalence [23]. The concept of substantial equivalence was created by the Organization for Economic Co-operation and Development (OECD) in 1993 and was subsequently developed by FAO/WHO in 2000 and 2002; it has been used internationally for GM crops risk assessment [24,25]. Although the phrase substantial equivalence was coined to describe the evaluation of foods, it is also applicable to the evaluation of plants and their products used as feedstuffs. Comparing GM crops to their non-transgenic counterparts is necessary for determining substantial equivalence. In order to discover similarities and probable discrepancies between the GM crops and its counterpart plant, the compositional analysis of GM plants and derived food and feed is a primary aspect of the comparative safety evaluation strategy. The major food and feed nutrients and anti-nutrients to consider in evaluating new maize varieties are outlined in the OECD consensus document on maize [26]. The analysis includes macronutrient proximate analysis, micronutrient proximate analysis and intrinsic toxins, allergies and anti-nutrient proximate analysis. Once a GM plant’s compositional equivalency has been demonstrated, the work can then concentrate on rodent feeding trials to validate its nutritional equivalence and gather more information on safety. In some cases, a 90-day rodent feeding study has been recommended to assess potential unintended effects of toxicological and nutritional relevance and to determine whether the GM food and feed is as safe and nutritious as its traditional comparator following long-term exposure [27]. In China, one of the key requirements of the application for the safety certification of GM crops is a 90-day feeding study in rodents. Lots of rodent feeding studies have been designed to determine whether the diets incorporated with grains from GM crops are substantially equivalent in composition and nutritional characteristics to the non-transgenic control diets [28,29,30,31]. The results from these studies demonstrated that the GM food and feed is as safe and nutritious as its traditional comparator.
In this study, the food safety of GM maize ZDAX5 with P450-N-Z1 and cp4 epsps was assessed in a compositional analysis and 90-day feeding study and compared with its non-transgenic counterpart to determine whether GM maize ZDAX5 is as nutritious and safe as its traditional comparator. This study will provide important data for the safety assessment of GM maize ZDAX5 in China. Furthermore, once ZDAX5 is available on the market, farmers will be free to choose between glyphosate and flazasulfuron in their weed-control plans, which may delay the evolution of herbicide-resistant weeds.

2. Materials and Methods

2.1. Protein Quantification and Nutritional Composition Analysis

2.1.1. Grain Samples Collection

Herbicide-tolerant transgenic maize ZDAX5 and corresponding non-transgenic corn were planted in China at three locations (Sanya at 18°37′27″ N longitude, 109°48′28″ E latitude; Changxing at 30°53′9″ N longitude, 119°37′57″ E latitude; and Deqing at 30°34′32″ N longitude, 119°55′53″ E latitude). Each location’s experiment used a randomized complete block design with three replicates. A non-transgenic counterpart corn plot and a transgenic corn ZDAX5 plot were included in each block. Seeds were planted at the rate of 4 holes per meter of row. ZDAX5 plants were treated with the recommended dosage of glyphosate (900 g a.e. ha−1) at the 4–5 leaf stage. When the plants achieved physiological maturity, grain was collected. At each site, 9 seeds were randomly selected for protein quantification. Three biological replicates from each site were collected for nutritional compositional analyses. Nutritional compositional analyses were performed to measure proximates, minerals, amino acids, fatty acids, vitamins and anti-nutrients at the Supervision and Testing Center for Agricultural Product Quality (Beijing), Ministry of Agriculture and Rural Affairs (Beijing, China).

2.1.2. Protein Quantification of P450-N-Z1 and CP4 EPSPS

Grain samples were milled into a fine powder in the presence of dry ice and stored at −80 °C for protein extraction and ELISA analysis. Proteins were extracted using a plant total protein extract kit (BB-3124-100T, BestBio, Shanghai, China). A standard curve was created for each ELISA experiment using known levels of the matching reference proteins. To determine the quantity of protein in each extract on a nanogram per milliliter (ng/mL) level, the mean absorbance for each sample extract was plotted against the relevant standard curve. Then, the concentration of each sample extract was transformed to indicate the quantity of protein in the grain.

2.1.3. Proximates (Moisture, Protein, Ash, Crude Fat, Dietary Fiber and Starch)

After drying the samples in a hot-air oven at 105 °C until a consistent weight was reached, moisture content was evaluated by gravimetric measurement of weight loss [32].
Protein was estimated by multiplying nitrogen content by a factor of 6.25, and the total nitrogen content was determined using the Kjeldahl method [33].
Ash content was evaluated by gravimetric measurement of the sample residue after it had been ignited in an oven at 600 °C to a constant weight [34].
Crude fat was determined by the Soxhlet extraction method [35], and dietary fiber was quantified according to the AOAC method [36].
After removing the fat and soluble sugars, starch was digested into tiny molecular sugars using amylase and subsequently into monosaccharides with hydrochloric acid. Finally, it was determined to reduce sugar and turn it into starch content [37].

2.1.4. Amino Acids Analyses

For the amino acids analyses, amino acids were analyzed with an automatic amino acid analyzer directly after protein hydrolysis with hydrochloric acid, except for cysteine and methionine. The sulfur-containing amino acids (cysteine and methionine) were oxidized with performic acid before hydrolysis with hydrochloric acid [38].

2.1.5. Fatty Acids Analyses

For the fatty acids analyses, individual fatty acids (linoleic, linolenic, oleic, palmitic and stearic acid) were determined by gas–liquid chromatography according to the Chinese standard GB9695.2-88 [39].

2.1.6. Vitamins Analyses

A fluorometric approach was used to quantify thiamin (Vitamin B1) and riboflavin (Vitamin B2) in accordance with Chinese standard GB 5009.84-2016 and 5009.84-2016, respectively. Vitamin E was measured using high-performance liquid chromatography and according to the method of GB 5009.82-2016. The sum of α + γ + δ vitamin E equals the total amount of vitamin E [40,41,42].

2.1.7. Minerals Analyses

Inductively coupled plasma optical emission spectrometry (ICPOES) was used to determine the levels of phosphorus, calcium, potassium, sodium, magnesium, zinc, iron, copper and manganese according to the Chinese standard GB 5009.268-2016 [43].

2.1.8. Anti-Nutrients Analyses

Phytic acid was evaluated by ion exchange using AOAC 986.11. Trypsin inhibitor activity in the grains was determined following the Chinese standard NY/T 1103.2-2006 [44].

2.2. 90-Day Feeding Study

2.2.1. Bioethics

The 90-day feeding study in rodents was subjected to the provisions of the Chinese Toxicology Assessment Procedures and Methods for Food Safety (Chinese Standard NY/T 1102-2006) and the OECD Good Laboratory Practice Guidelines. This study was approved to be carried out at the Experimental Animal Center, Supervision and Testing Center for GMOs Food Safety, Ministry of Agriculture on 12 June 2020. The experimental design was also approved by the Animal Ethics Committee of China Agricultural University (ethic approval number Aw12060202-4-2).

2.2.2. Plant Materials

In Hainan Province, China, the herbicide-tolerant maize ZDAX5 and its non-transgenic counterpart were both planted in parallel in the experimental field. At the 4–5 leaf stage, ZDAX5 plants were treated with glyphosate at a dosage of 900 g a.e. ha−1.

2.2.3. Diet Formulation

Grains from GM and non-transgenic maize were added to rat meals at percentages of 12.5%, 25% and 50%, respectively. As a control, another set of rats was fed with a marketed diet. All of the diets were vacuum-sealed and sterilized by 60Co. The nutrient composition levels of each feed met the growth and development needs of rats.

2.2.4. Animals

Beijing Vital River Laboratory Animal Technology Co., Ltd. (Beijing, China) provided 140 weaned Sprague Dawley rats, half male and half female, weighing about 80–100 g. After 3 days of adaptive feeding with an ordinary diet, the rats were randomly divided into 7 groups according to sex and body weight. There were 20 rats in each group, males and females were divided in half. Each group’s average body weight differed by about 20%. In total, 7 groups of rats were fed with a marketed diet, 12.5% non-GM diet, 25% non-GM diet, 50% non-GM diet, 12.5% GM diet, 25% GM diet and 50% GM diet, respectively. Rats were kept in a cage with free access to water and diet throughout the whole trial.

2.2.5. Body Weight

Daily observations of the rats’ activities, fur color, feeding, excretion and poisoning symptoms were recorded. The body weight was recorded once a week.

2.2.6. Clinical Examination (Hematology and Serum Chemistry)

On study day 90, hematological and serum chemistry variables were examined in blood collected from all rats. The rats were starved for 16 h before blood samples were taken from the orbital sinus under anesthesia.
The hematological samples were deposited in tubes containing EDTA·Na2. A HEMAVET 950FS animal blood cell counter (Drew Scientific, Inc., Dallas, Texas, USA) was used to measure white blood cell count (WBC), red blood cell count (RBC), hemoglobin (HGB), hematocrit (HCT) and blood platelet count (PLT).
The serum chemistry samples were centrifuged for 8 min at 4000 g, and the supernatants were collected separately. An automatic Biochemical Analyzer 7020 (HITACHI, Tokyo, Japan) was used to measure alanine aminotransferase (ALT), aspartate aminotransferase (AST), alkaline phosphatase (ALP), total protein (TP), albumin (ALB), creatinine (CREA), total cholesterol (CHOL) and glucose (GLU).

2.2.7. Organ Weight

At the end of the 90-day exposure test, the brain, heart, lung, thymus, liver, spleen, kidney, adrenals and testes or ovaries were among the organs weighed.

2.3. Statistical Analysis

The data was given as a mean value with a standard deviation (SD) for each variable. A standard t-test was used to examine differences in nutritional contents, and a significance level of p < 0.05 was considered significant. Furthermore, two treatments were considered equal if the difference was within 20% of the mean value of the respective reference treatment at the 90% confidence range according to the Nordic Council of Ministers’ suggestion. Differences in body weight, organ weight, hematological chemistry and serum chemistry between rats fed the GM diet and control diet and rats fed diets containing comparable GM and non-transgenic maize were assessed using common t-tests following a data homogeneity variance analysis by one-way analysis of variance (ANOVA).

3. Results

3.1. Protein Levels of P450-N-Z1 and CP4 EPSPS in ZDAX5 Grain

In total, 27 individual samples from 3 locations were collected. The expression of P450-N-Z1 and CP4 EPSPS in grain is presented as μg/g of fresh weight. The P450-N-Z1 and CP4 EPSPS expression levels in grain, the most commonly consumed commodity, were 0.38 μg/g and 42.79 μg/g of sample, respectively (Figure 1).

3.2. Nutritional Composition of ZDAX5 Grain

In the present study, samples were collected in a total of three locations (Sanya, Changxing and Deqing) to investigate the compositional equivalency between ZDAX5 maize and a conventional counterpart (Ruifeng-1). A common t-test was used to analyze the influence of genetic modification on nutritional content data from ZDAX5 and Ruifeng-1. The composition values for ZDAX5 and Ruifeng-1 were compared to the values published in OECD (2002) and the ILSI (International Life Sciences Institute) Crop Composition Database (2014), taking into account the natural variation of values in different lines, to see if the treatment differences exceeded the range of normal variation of the comparator [26].

3.2.1. Proximates

For compositional comparisons between ZDAX5 and its non-transgenic counterpart Ruifeng-1, the main nutrient analysis was conducted as shown in Table 1. No significant differences were found in the mean values of Moisture, Protein, Ash and Starch in ZDAX5 compared with Ruifeng-1, except for Lipid, which was 4.78 g/100 g in ZDAX5 and 5.33 g/100 g in the non-transgenic counterpart Ruifeng-1. All means were within the natural variance range of reported commercial lines of corn given in the OECD (2002) and the ILSI Crop Composition Database (2014).

3.2.2. Amino Acids

An automated amino acid analyzer was used to determine the compositions of the 16 amino acids, and the value of a specific amino acid was compared with the reference range. Table 2 shows the results of amino acids between ZDAX5 and Ruifeng-1. Except for Valine and Threonine, the amino acids’ levels in ZDAX5 were comparable to those of its corresponding counterpart Ruifeng-1. All amino acid values, with the exception of Glycine and Methionine, were within the ranges of comparable commercial lines published in the OECD (2002) and the ILSI Crop Composition Database (2014).

3.2.3. Fatty Acids

The fatty acids values of ZDAX5 and Ruifeng-1 are shown in Table 3. No statistically significant differences were found in the levels of myristic acid (C14:0), palmitoleic (16:1), heptadecanoic (C17:0) and behenic acid (C22:0). For palmitic acid (C16:0), stearic acid (18:0), oleic acid (C18:1), linoleic acid (C18:2), gamma linoleic (C18:3) and arachidic acid (C20:0), differences were observed. The values of palmitic (C16:0), stearic acid (18:0), oleic acid (C18:1), gamma linoleic (C18:3) and arachidic acid (C20:0) were slightly lower, but the linoleic acid (C18:2) values were higher in ZDAX5 than that in Ruifeng-1. Despite the absence of the OECD consensus document from 2002, all of the fatty acid values assessed in ZDAX5 and Ruifeng-1 were within the ranges of reference varieties provided by the ILSI Crop Composition Database (2014).

3.2.4. Vitamins

No statistically significant difference between ZDAX5 corn and Ruifeng-1 corn was observed for three vitamins: vitamin B1, vitamin B2 and vitamin E (Table 4). Except for vitamin B1, the values of the other two vitamins measured in ZDAX5 and Ruifeng-1 were in the ranges from other reported commercial lines listed in the OECD or the ILSI Crop Composition Database (2014).

3.2.5. Minerals

A statistically significant difference between ZDAX5 and Ruifeng-1 was detected for three minerals: iron, sodium and zinc. No statistically significant differences were found in the levels of calcium, copper, kalium, magnesium, manganese, phosphorus and selenium measured in ZDAX5 and Ruifeng-1 (Table 5). Except for magnesium, the minerals assessed in ZDAX5 and Ruifeng-1 were in good accordance with OECD (2022) or ILSI Crop Composition Database reference ranges (2014).

3.2.6. Anti-Nutrients

There are many kinds of natural toxins and anti-nutrients in plant food, and their anti-nutrition effects are also different. Phytic acid and trypsin inhibitors present in maize grain were proposed for testing in the OECD consensus documents [26]. No statistically significant difference was observed in the level of phytic acid between ZDAX5 corn and Ruifeng-1 corn. The level of trypsin inhibitors in Ruifeng-1 was lower than that in ZDAX5, which is not considered a biological significant difference (Table 6).

3.3. Sub-Chronic Dietary Study with Rats

A 90-day oral sub-chronic toxicity study was carried out in male and female Sprague Dawley rats. The rats were fed with 12.5%, 25% and 50% GM maize, 12.5%, 25% and 50% non-transgenic maize and a control diet, respectively.

3.3.1. Body Weight

The rats all made it through the 90-day test period and appeared healthy throughout the course of the research. In comparison to the control and non-GM diets, there were no statistically significant differences in the body weights of the male and female rats fed GM diets (Figure 2).

3.3.2. Clinical Examination (Hematology and Serum Chemistry)

At the end of the trial, hematology measurements were performed, as shown in Table 7. The PLT value of the 25% GM male group was significantly different from the control group. However, there was no significant difference between rats consuming diets containing 25% GM maize and 25% non-GM maize. No similar difference was found in the 12.5 and 50% groups. This disparity was thought to be due to random variation. There were no group-related changes or statistically identified differences in any of the hematologic parameters for female rats. Therefore, there is no dose-dependent effect on PLT for GM feeds.
Table 8 depicts blood biochemistry measurements collected at the end of the trial. The AST value in the females who consumed meals containing 12.5% GM maize was significantly different from the corresponding non-transgenic group, but there was no statistically significant difference compared with control group. Moreover, there is also no dose-dependent reduction in the AST values for GM feed. A statistically significant difference in the mean value of ALB in females was observed between the 50% GM and control group. Since the 50% GM group’s ALB value was not significantly different from the non-GM group’s, this adjustment was not determined to be negative. Females who ate meals containing 50% GM maize had a considerably lower GLU value than the non-GM group. These changes were not detected in the groups that consumed 12.5% and 50% GM maize, and they were not thought to be connected to the addition of GM maize.

3.3.3. Organ Weight

The organ weights of male and female rats fed GM maize compared to non-transgenic and control groups showed no group-related changes or statistically significant differences (Table 9).

4. Discussion

Population increase, climate change, weeds, pests and lack of fertile land are key issues that contemporary agriculture faces, and genetically modified plants have great potential for facing these challenges [8,45,46]. Genetically modified plants and derived food and feed that are already on the market were modified by inserting a single or a few genes that confer traits such as herbicide tolerance [27]. These GM plants produce new proteins that are not found in their wildtypes. Therefore, regardless of advancements in transgenic technology, the safety of food and feed derived from GM crops, including herbicide-tolerant plants, has always been a source of public worry [47]. The biosafety or toxicity safety assessment of GM crops is critical for their successful adoption because maize (Zea mays L.) is an important staple food and raw ingredient for food. Thus, this study was conducted to evaluate the safety of transgenic maize ZDAX5 expressing the P450-N-Z1 and CP4 EPSPS proteins using well-established methods.
Transgenic herbicide-tolerant crops developed with novel genes with clear intellectual property rights is of critical importance. ZDAX5 is a novel variety of herbicide-tolerant maize that exhibits high tolerance to flazasulfuron and glyphosate and co-expresses the P450-N-Z1 and cp4 epsps genes. The P450-N-Z1 gene was cloned from Bermuda grass in our laboratory previously, and this gene was patented in the United States [
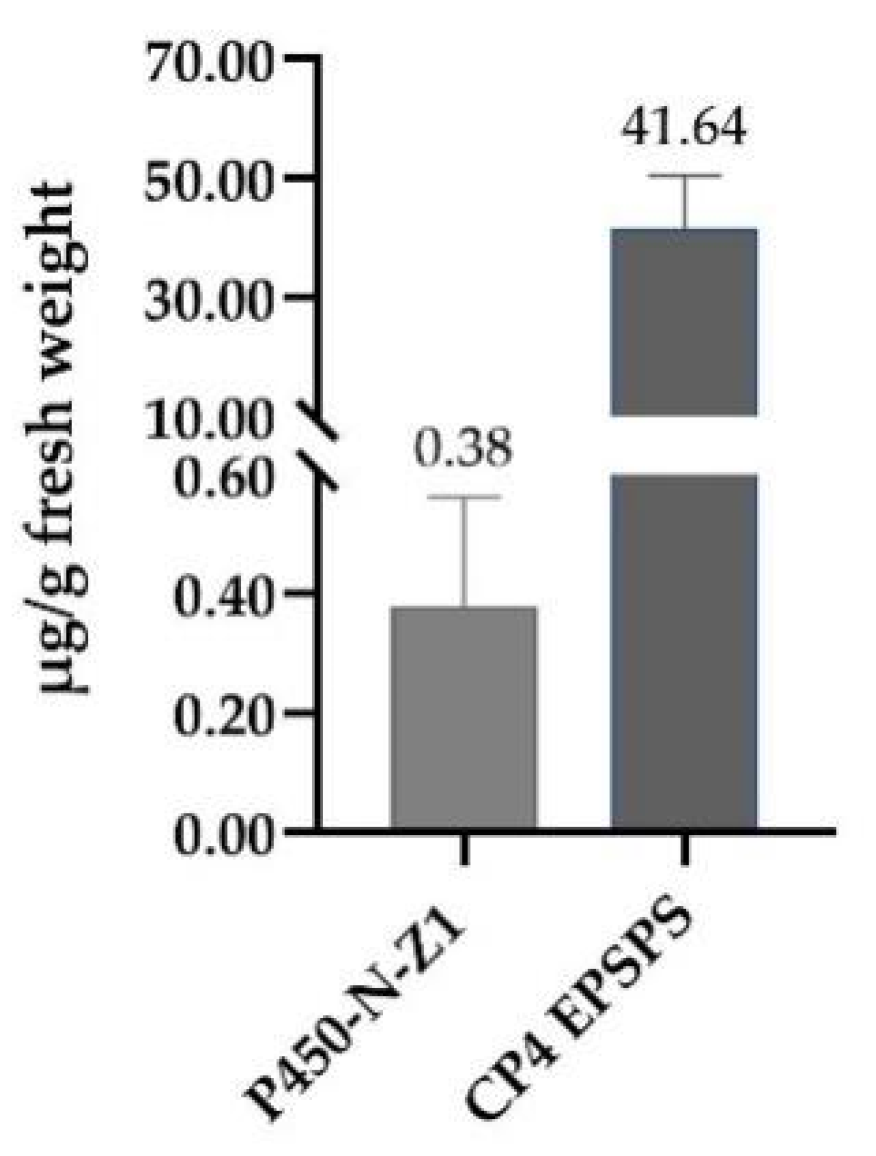
48]. Both China and the rest of the world currently lack flazasulfuron-tolerant transgenic maize. Once ZDAX5 corn is available on the market, it will be more competitive than similar herbicide-resistant products abroad. The P450-N-Z1 and CP4 EPSPS proteins in ZDAX5 are detectable and quantifiable in ZDAX5 grain. The biosafety assessment of the introduced CP4 EPSPS protein was previously documented [49,50,51,52]. The CP4 EPSPS protein has a history of safe usage in agriculture and has no known allergenic or toxic qualities [53]. The acute oral toxicity of CP4 EPSPS was assessed in mice, showing no adverse effects [53]. In addition, the CP4 EPSPS protein has demonstrated no adverse effects in sub-chronic toxicity trials [49,50]. For P450-N-Z1, the amino acid sequence of P450-N-Z1 shares high similarity to numerous plant P450s, including CYP81A6 and Nsf1, derived from rice and maize, respectively [48]. To date, no reports have demonstrated or speculated that these proteins are toxic or allergenic in humans or animals. The P450-N-Z1 protein is expressed in Bermuda grass, which is used as a feed and has not been found to have any toxicity in animals [54,55]. When the P450-N-Z1 protein is incubated with a digestive enzyme in vitro, the proteins are degraded within 30 min and do not resemble any known allergens or toxins structurally or functionally. Furthermore, the biosafety of P450-N-Z1 was tested in mice by giving them a large oral dosage of pure P450-N-Z1 protein; no negative effects or toxicity were observed (data not shown).
In the nutritional composition analysis, key nutritional components from the herbicide-tolerant maize ZDAX5 and its non-transgenic counterpart Ruifeng-1 were measured. All mean values calculated for the transgenic maize ZDAX5 samples, except for fiber, glycine, methionine, C17:0, C18:3 and magnesium, were within the ranges reported by the OECD (2002) or the ILSI Crop Composition Database (2014). The levels of C17:0, glycine and magnesium were higher than those provided by the OECD (2002) or the ILSI Crop Composition Database (2014) but equal to those of Ruifeng-1. The C18:3, methionine, and vitamin B1 levels were lower than those reported by the OECD (2002) or the ILSI Crop Composition Database (2014) but comparable to those of Ruifeng-1. These results demonstrated that the nutritional quality of transgenic maize grain was substantially equivalent to that of the non-transgenic counterpart. Compositional equivalence between ZDAX5 and its non-transgenic counterpart, Ruifeng-1, was clearly demonstrated. Even though some differences were statistically significant, the values fell within the normal variation range for the considered parameters and thus had no biological or toxicological significance. These results indicated that expressions of P450-N-Z1 and CP4 EPSPS in grain have no impact on the measured components. As previously stated, the introduction of well-characterized genes into a genome is unlikely to have a unexpected effect on crop composition [56]. In a crop such as maize, which has a long history of safe use, random genetic perturbations are unlikely to have a unexpected effect on food safety [57].
Though long-term feeding of transgenic products to animals shows no evidence of adverse effects on the human health, some researchers have still raised possibilities that these plants may cause unintended effects via different pathways, which needs to be strictly evaluated [58,59]. In particular, products from the exogenous genes that might cause the production of toxins that hurt human health should be evaluated. However, there is no evidence that products from the genes introduced to the plant genome are considered to be toxic. To solve public concerns regarding food safety, any transgenic plant should undergo a strict and systematic evaluation before entering the market [60,61].
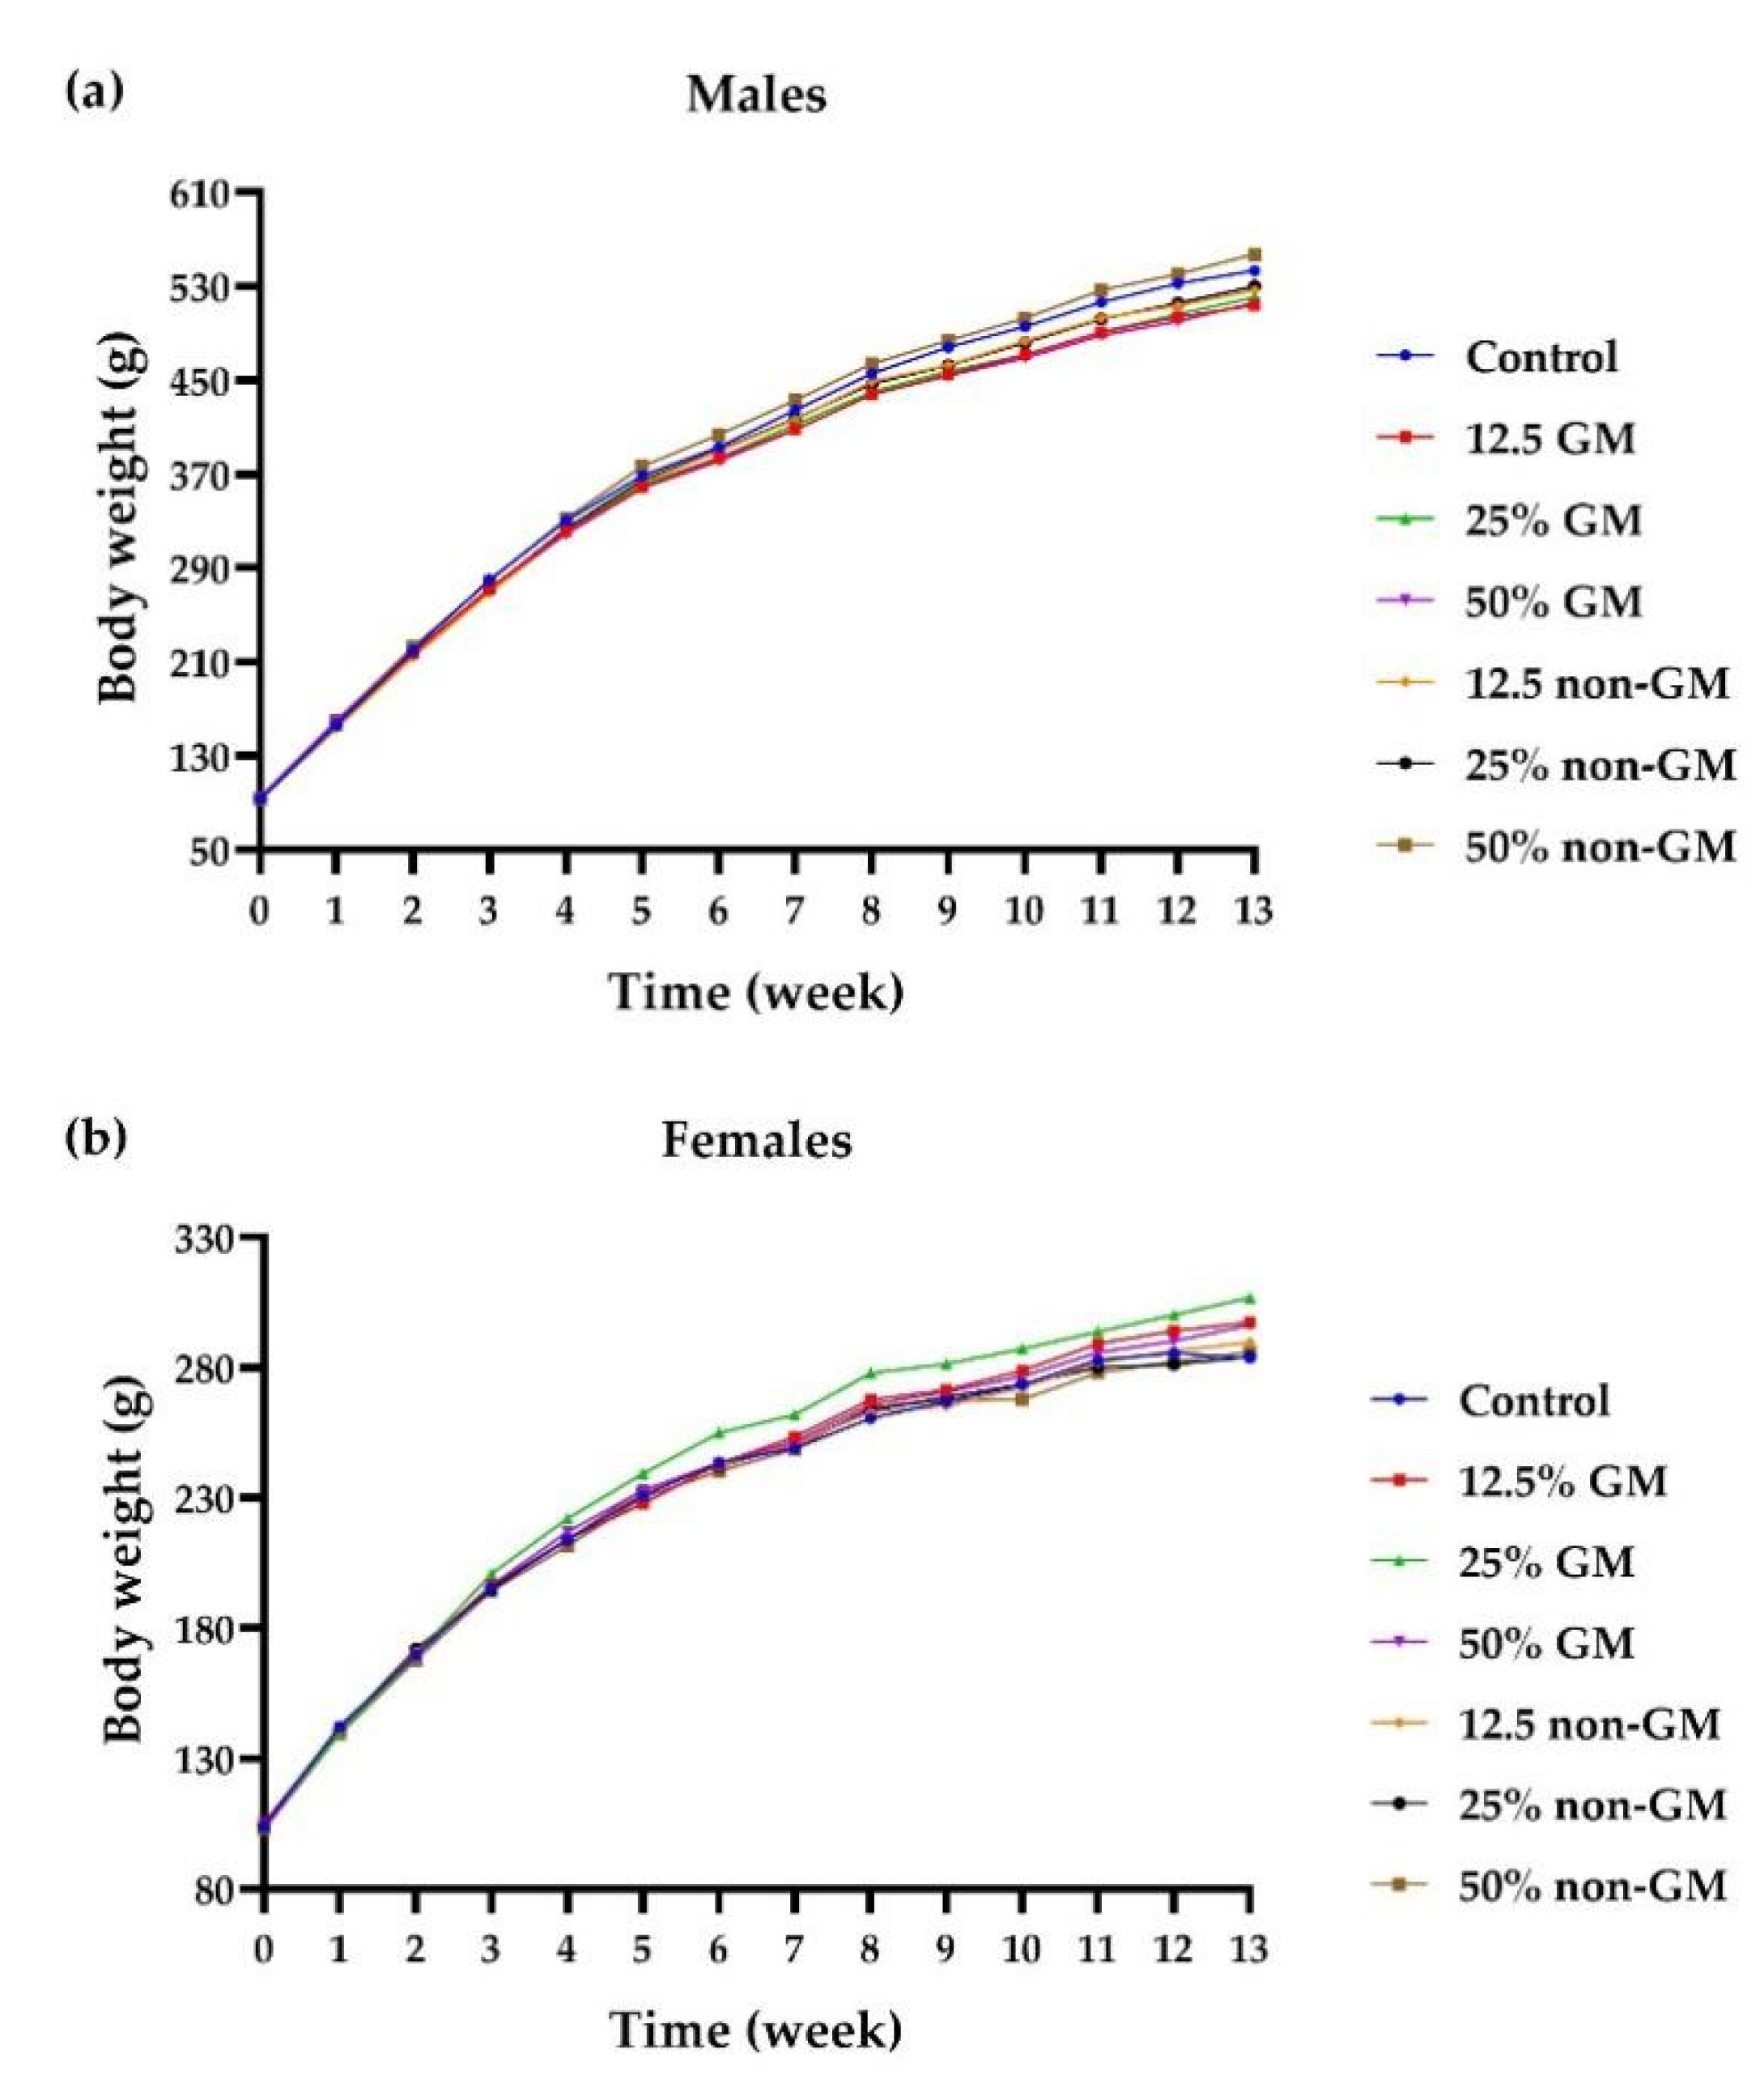
In the 90-day feeding trial, standard toxicological response variables in rats were used to assess the safety of long-term dietary exposure to grain from GM maize. During the 90-day toxicity study, all animals survived and stayed healthy. Rats fed transgenic maize in their diet showed identical body weight to rats fed regular food and diet containing non-transgenic maize. When the rats feeding on diets containing ZDAX5 maize grain were compared to those feeding on non-transgenic maize and control diets, there were several significant differences in the mean values of the response parameters (hematology and serum chemistry and organ weight). However, they were not thought to be negative and were not connected to the addition of GM maize. After further investigation, no changes were considered to be group-related. These findings matched those of prior 90-day rat feeding experiments [62,63,64]. For example, Zhu et al. [62] conducted a 90-day feeding study in rats with grain from glyphosate-tolerant maize that included the G2-aroA gene. The results suggested that G2-aroA maize grain has no adverse effects in Sprague Dawley rats, and it is as safe and wholesome as maize grain obtained from non-GM crops. Consumption of GM maize ZDAX5 showed no observed toxicological effects on animal health based on our 90-day feeding study. Therefore, the transgenic maize ZDAX5 carrying the exogenous P450-N-Z1 and cp4 epsps genes is as safe as the non-transgenic maize Ruifeng-1. This will provide important data for the safety assessment of GM maize ZDAX5 at home and abroad. Once ZDAX5 is available on the market, farmers will be free to choose between glyphosate and flazasulfuron in their weed-control plans, which may delay the evolution of herbicide-resistant weeds. This will bring great social value and economic value to human society.

5. Conclusions

The current sub-chronic study suggested that GM maize ZDAX5 with the P450-N-Z1 and cp4 epsps genes is not associated with adverse effects in Sprague Dawley rats, and it is as safe and wholesome as maize grain obtained from non-transgenic crops. This study will provide important data for the safety assessment of GM maize ZDAX5 in China.

6. Patents

Hangzhou Ruifeng Biosciences holds a US patent entitled “Herbicide resistant gene and use thereof”. Named inventors are Z. Shen, C. Lin and C. Liu.

Author Contributions

Conceived and designed the experiments: X.Y., Z.Z. and P.W. Performed the experiments: X.Y. and Z.Z. Analyzed the data: P.W. and X.C. Contributed reagents/materials/analysis tools: Z.S., X.Y. and Z.Z. Wrote the manuscript: X.Y. Read and gave suggestions on the manuscript: P.W., X.C., Y.H. and Z.S. All authors have read and agreed to the published version of the manuscript.

Funding

This research was funded by a major project of breeding new genetically modified organisms (2018ZX08003-02B).

Institutional Review Board Statement

Not applicable.

Informed Consent Statement

Not applicable.

Data Availability Statement

Not applicable.

Acknowledgments

The authors are thankful for the work done by the Key Laboratory of Safety Assessment of Genetically Modified Organism (Food Safety) and the Ministry of Agriculture and Rural Affairs for the chemical analysis work in this study.

Conflicts of Interest

The authors declare no conflict of interest. The funders had no role in the design of the study; in the collection, analyses or interpretation of data; in the writing of the manuscript; or in the decision to publish the results.

References

  1. Dunwell, J.M.; Paul, E.M. Impact of genetically modified crops in agriculture. Outlook Agric. 1990, 19, 103–109. [Google Scholar] [CrossRef]
  2. ISAAA. Global Status of Commercialized Biotech/GM Crops in 2019: Biotech Crops Drive Socio-Economic Development and Sustainable Environment in the New Frontier. 2019. Available online: https://www.isaaa.org (accessed on 2 May 2022).
  3. Menkir, A.; Badu-Apraku, B.; Yallou, C.G.; Kamara, A.Y.; Ejeta, G. Breeding maize for broad-based resistance to Striga Hermonthica. In Integrating New Technologies for Striga Control; 2007; pp. 99–114. Available online: https://www.worldscientific.com/doi/abs/10.1142/9789812771506_0008 (accessed on 2 May 2022).
  4. Cao, M.; Sato, S.J.; Behrens, M.; Jiang, W.Z.; Clemente, T.E.; Weeks, D.P. Genetic engineering of maize (Zea mays) for high-level tolerance to treatment with the herbicide dicamba. J. Agri. Food Chem. 2011, 59, 5830–5834. [Google Scholar] [CrossRef] [PubMed]
  5. Kramer, K.J.; Morgan, T.D.; Throne, J.E.; Dowell, F.E.; Bailey, M.; Howard, J.A. Transgenic avidin maize is resistant to storage insect pests. Nat. Biotechnol. 2000, 18, 670–674. [Google Scholar] [CrossRef] [PubMed] [Green Version]
  6. Murry, L.E.; Elliott, L.G.; Capitant, S.A.; West, J.A.; Hanson, K.K.; Scarafia, L.; Johnston, S.; Deluca-Flaherty, C.; Nichols, S.; Cunanan, D. Transgenic corn plants expressing MDMV strain B coat protein are resistant to mixed infections of maize dwarf mosaic virus and maize chlorotic mottle virus. Bio/technology 1993, 11, 1559–1564. [Google Scholar] [CrossRef]
  7. Soltani, N.; Dille, A.J.; Burke, I.C.; Everman, W.J.; Vangessel, M.J.; Davis, V.M.; Sikkema, P.H. Potential corn yield losses due to weeds in North America. Weed Technol. 2016, 30, 979–984. [Google Scholar] [CrossRef]
  8. Oerke, E.-C. Crop losses to pests. J. Agric. Sci. 2006, 144, 31–43. [Google Scholar] [CrossRef]
  9. Kannan, S.; Chinnagounder, C. Evaluation of Weed Control Options for Herbicide Resistant Transgenic Stacked (TC 1507 X NK603) and Conventional Maize Hybrids for Higher Productivity. Am. J. Plant Sci. 2013, 4, 1713–1720. [Google Scholar] [CrossRef] [Green Version]
  10. Karkanis, A.; Athanasiadou, D.; Giannoulis, K.; Karanasou, K.; Zografos, S.; Souipas, S.; Bartzialis, D.; Danalatos, N. Johnsongrass (Sorghum halepense (L.) Pers.) Interference, Control and Recovery under Different Management Practices and its Effects on the Grain Yield and Quality of Maize Crop. Agronomy 2020, 10, 266. [Google Scholar] [CrossRef] [Green Version]
  11. Xiao, G.; Yuan, L.; Sun, S.S.M. Strategy and utilization of a herbicide resistance gene in two-line hybrid rice. Mol. Breeding 2007, 20, 287–292. [Google Scholar] [CrossRef]
  12. Dhirendra, F.; Aakrati, A.; Donald, J.; Bhabesh, B.; Babu, R.; Vijay, S.; Agrawal, P.K.; Murali, A.; Reddy, M.K. Developing dual herbicide tolerant transgenic rice plants for sustainable weed management. Sci. Rep. 2018, 8, 11598. [Google Scholar]
  13. Owen, M.; Pedersen, P.; De Bruin, J.; Stuart, J.; Lux, J.; Franzenburg, D.; Grossnickle, D. Comparisons of genetically modified and non-genetically modified soybean cultivars and weed management systems. Crop Sci. 2010, 50, 2597–2604. [Google Scholar] [CrossRef]
  14. Heap, I. Global perspective of herbicide-resistant weeds. Pest Manag. Sci. 2014, 70, 1306–1315. [Google Scholar] [CrossRef] [PubMed]
  15. Powles, S.B.; Lorraine-Colwill, D.F.; Dellow, J.J.; Preston, C. Evolved resistance to glyphosate in rigid ryegrass (Lolium rigidum) in Australia. Weed Sci. 1998, 46, 604–607. [Google Scholar] [CrossRef]
  16. Vangessel, M.J. Glyphosate-resistant horseweed from Delaware. Weed Sci. 2001, 49, 703–705. [Google Scholar] [CrossRef]
  17. Culpepper, A.S.; Grey, T.L.; Vencill, W.K.; Kichler, J.M.; Webster, T.M.; Brown, S.M.; York, A.C.; Hanna, D.W.W. Glyphosate-resistant Palmer amaranth (Amaranthus palmeri) confirmed in Georgia. Weed Sci. 2006, 54, 620–626. [Google Scholar] [CrossRef]
  18. Hashizume, B. Flazasulfuron, a new turf herbicide (Shibagen). Jpn. Pestic. Inf. 1990, 57, 27–30. [Google Scholar]
  19. Dario, G.; Vincenzo, M.; Silva, M.D. Evaluation of the efficiency of the herbicide flazasulfuron on weed control in sugar cane (Saccharum officinarum L.) culture. Ecossistema 1997, 22, 102–106. [Google Scholar]
  20. Bourdrez, P.; Beraud, J.M. Flazasulfuron: Vine herbicide. Phytoma La Def. Des Veg. 1999, 521, 66–68. [Google Scholar]
  21. Singh, M.; Ramirez, A.; Jhala, A.J.; Malik, M. Weed Control Efficacy and Citrus Response to Flazasulfuron Applied Alone or in Combination with Other Herbicides. Am. J. Plant Sci. 2012, 3, 520–527. [Google Scholar] [CrossRef] [Green Version]
  22. Ridley, W.P.; Sidhu, R.S.; Pyla, P.D.; Nemeth, M.A.; Breeze, M.L.; Astwood, J.D. Comparison of the nutritional profile of glyphosate-tolerant corn event NK603 with that of conventional corn (Zea mays L.). J. Agri. Food Chem. 2002, 50, 7235–7243. [Google Scholar] [CrossRef]
  23. Dybing, E.; Doe, J.; Groten, J.; Kleiner, J.; Younes, M. Hazard characterisation of chemicals in food and diet: Dose response, mechanisms and extrapolation issues. Food Chem. Toxicol. 2002, 40, 237–282. [Google Scholar] [CrossRef]
  24. Schauzu, M. The concept of substantial equivalence in safety assessment of foods derived from genetically modified organisms. AgBiotechNet 2000, 2, 1–4. [Google Scholar]
  25. World Health Organization; Regional Office for Europe; European Centre for Environment and Health; Rome Division WHO/EURO/ECEH. Safety Aspects of Genetically Modified Foods of Plant Origin: Report of a Joint FAO/WHO Expert Consultation on Foods Derived from Biotechnology: WHO Headquarters, Geneva, Switzerland, 29 May–2 June 2000|Clc; Geneva World Health Organization: Geneva, Switzerland, 2000.
  26. OECD. Consensus Document on compositional considerations for new varieties of maize (Zea mays): Key food and feed nutrients, anti-nutrients and secondary plant metabolites. Ser. Saf. Nov. Food Feed. 2002, 6, 1–42. [Google Scholar]
  27. Authority, E. Safety and Nutritional Assessment of GM Plants and derived food and feed: The role of animal feeding trials. EFSA J. 2008, 46, S2–S70. [Google Scholar]
  28. Schrder, M.; Poulsen, M.; Wilcks, A.; Kroghsbo, S.; Knudsen, I. A 90-day safety study of genetically modified rice expressing Cry1Ab protein (Bacillus thuringiensis toxin) in Wistar rats. Food Chem. Toxicol. 2007, 45, 339–349. [Google Scholar] [CrossRef] [PubMed]
  29. Appenzeller, L.M.; Munley, S.M.; Hoban, D.; Sykes, G.P.; Delaney, B. Subchronic feeding study of herbicide–tolerant soybean DP-35643-5 in Sprague–Dawley rats. Food Chem. Toxicol. 2008, 46, 2201–2213. [Google Scholar] [CrossRef]
  30. Doull, J.; Gaylor, D.; Greim, H.A.; Lovell, D.P.; Lynch, B. Report of an Expert Panel on the reanalysis by of a 90-day study conducted by Monsanto in support of the safety of a genetically modified corn variety (MON 863). Food Chem. Toxicol. 2007, 45, 2073–2085. [Google Scholar] [CrossRef]
  31. Dryzga, M.; Yano, B.L.; Andrus, A.K.; Mattsson, J.L. Evaluation of the safety and nutritional equivalence of a genetically modified cottonseed meal in a 90-day dietary toxicity study in rats. Food Chem. Toxicol. 2007, 45, 1994–2004. [Google Scholar] [CrossRef]
  32. Chinese Standard GB 5009.3-2016; Methods for Determination of Moisture in Foods. Standards Press of China: Beijing, China, 2017.
  33. Chinese Standard GB 5009.5-2016; Methods for Determination of Protein in Foods. Standards Press of China: Beijing, China, 2017.
  34. Chinese Standard GB 5009.4-2016; Methods for Determination of Ash in Foods. Standards Press of China: Beijing, China, 2017.
  35. Chinese Standard GB 5009.6-2016; Methods for Determination of Fat in Foods. Standards Press of China: Beijing, China, 2017.
  36. Chinese Standard GB/T 5009.10-2003; Methods for Determination of Crude Fiber in Vegetable Foods. Standards Press of China: Beijing, China, 2004.
  37. Chinese Standard GB 5009.9-2016; Methods for Determination of Starch in Foods. Standards Press of China: Beijing, China, 2017.
  38. Chinese Standard GB 5009.124-2016; Methods for Determination of Amino Acids in Foods. Standards Press of China: Beijing, China, 2017.
  39. Chinese Standard GB 5009.168-2016; Methods for Determination of Fatty Acids in Foods. Standards Press of China: Beijing, China, 2017.
  40. Chinese Standard GB 5009.84-2016; Methods for Determination of Thiamine (Vitamin B1) in Foods. Standards Press of China: Beijing, China, 2017.
  41. Chinese Standard GB 5009.85-2016; Methods for Determination of Riboflavin (Vitamin B2) in Foods. Standards Press of China: Beijing, China, 2017.
  42. Chinese Standard GB 5009.82-2016; Methods for Determination of Tocopherol (Vitamin E) in Foods. Standards Press of China: Beijing, China, 2017.
  43. Chinese Standard GB 5009.268-2016; Methods for Determination of Minerals in Foods. Standards Press of China: Beijing, China, 2017.
  44. Chinese Standard NY/T 1103.2-2006; Safety Assessment of Genetically Modified Plant and Derived Products Parts 2: Assay of Anti-nutrients Pancreatic trypsin Inhibiter. Standards Press of China: Beijing, China, 2006.
  45. Ray, D.K.; Mueller, N.D.; West, P.C.; Foley, J.A.; Hart, J.P. Yield Trends Are Insufficient to Double Global Crop Production by 2050. PLoS ONE 2013, 8, e66428. [Google Scholar] [CrossRef] [Green Version]
  46. Abou-Hussein, S.D. Climate change and its impact on the productivity and quality of vegetable crops. J. Appl. Sci. Res. 2012, 8, 4359–4383. [Google Scholar]
  47. Domingo, J.L.; Bordonaba, J.G. A literature review on the safety assessment of genetically modified plants. Environ. Int. 2011, 37, 734–742. [Google Scholar] [CrossRef] [PubMed]
  48. Zheng, T.; Yu, X.; Sun, Y.; Zhang, Q.; Zhang, X.; Tang, M.; Lin, C.; Shen, Z. Expression of a Cytochrome P450 Gene from Bermuda Grass Cynodon dactylon in Soybean Confers Tolerance to Multiple Herbicides. Plants 2022, 11, 949. [Google Scholar] [CrossRef] [PubMed]
  49. Hammond, B.; Dudek, R.; Lemen, J.; Nemeth, M. Results of a 13 week safety assurance study with rats fed grain from glyphosate tolerant corn. Food Chem. Toxicol. 2004, 42, 1003–1014. [Google Scholar] [CrossRef] [PubMed]
  50. Yuan, J.; Tang, Z.; Zhao, J.; Shi, Z.; Wang, J. Toxicologic evaluation of chronic feeding of glyphosate-resistant transgenic soybean GTS40-3-2 meal to rats. Emir. J. Food Agric. 2017, 29, 856–862. [Google Scholar] [CrossRef] [Green Version]
  51. Salisu, I.B.; Shahid, A.A.; Yaqoob, A.; Rao, A.Q.; Husnain, T. Effect of dietary supplementation of recombinant Cry and CP4 EPSPS proteins on haematological indices of growing rabbits. J. Anim. Physiol. Anim. Nutr. 2019, 103, 305–316. [Google Scholar] [CrossRef] [PubMed] [Green Version]
  52. Qaa, B.; Ibsa, C.; Aas, A.; Al, A.; Aqr, A. A 90day subchronic toxicity study of transgenic cotton expressing Cry1Ac, Cry2A and CP4 EPSPS proteins in SpragueDawley rats. Food Chem. Toxicol. 2020, 146, 111783. [Google Scholar]
  53. Harrison, L.A.; Bailey, M.R.; Naylor, M.W.; Ream, J.E.; Hammond, B.G.; Nida, D.L.; Burnette, B.L.; Nickson, T.E.; Mitsky, T.A.; Taylor, M.L. The expressed protein in glyphosate-tolerant soybean, 5-enolypyruvylshikimate-3-phosphate synthase from Agrobacterium sp. strain CP4, is rapidly digested in vitro and is not toxic to acutely gavaged mice. J. Nutr. 1996, 126, 728–740. [Google Scholar] [CrossRef]
  54. Taliaferro, C.M.; Rouquette, F.M., Jr.; Mislevy, P. Bermudagrass and stargrass. Warm Seas. (C4) Grasses 2004, 45, 417–475. [Google Scholar]
  55. Burton, G.W. Coastal Bermuda Grass; University of Georgia: Athens, Georgia, 1948. [Google Scholar]
  56. Herman, R.A.; Phillips, A.M.; Collins, R.A.; Tagliani, L.A.; Prochaska, L.M. Compositional Equivalency of Cry1F Corn Event TC6275 and Conventional Corn (Zea mays L.). J. Agri. Food Chem. 2004, 52, 2726–2734. [Google Scholar] [CrossRef]
  57. Herman, R.A.; Storer, N.P.; Phillips, A.M.; Prochaska, L.M.; Windels, P. Compositional assessment of event DAS-59122-7 maize using substantial equivalence. Regul. Toxicol. Pharm. 2007, 47, 37–47. [Google Scholar] [CrossRef]
  58. Deng, P.J.; Zhou, X.Y.; Yang, D.Y.; Hou, H.L.; Liu, J. The definition, source, manifestation and assessment of unintended effects in genetically modified plants. J. Sci. Food Agric. 2008, 88, 2401–2413. [Google Scholar] [CrossRef]
  59. Rothamsted, A. Review of the strategies for the comprehensive food and feed safety and nutritional assessment of GM plants per se. EFSA Support. Publ. 2013, 10, EN-480. [Google Scholar]
  60. Zoller, O.; Rhyn, P.; Rupp, H.; Zarn, J.A.; Geiser, C. Glyphosate residues in Swiss market foods: Monitoring and risk evaluation. Food Addit. Contam. Part B 2018, 11, 83–91. [Google Scholar] [CrossRef] [PubMed]
  61. Andersson, H.C.; Arpaia, S.; Bartsch, D.; Casacuberta, J.; Davies, H.; Jardin, P.D.; Flachowsky, G.; Herman, L.; Jones, H.; Kärenlampi, S. Scientific opinion on application (EFSA-GMO-NL-2009-73) for the placing on the market of insect-resistant and herbicide-tolerant genetically modified soybean MON 87701 × MON 89788 for food and feed uses, import and processing under Regulation (EC) No 1829. EFSA J. 2012, 10, 2560. [Google Scholar]
  62. Zhu, Y.; He, X.; Luo, Y.; Zou, S.; Zhou, X.; Huang, K.; Xu, W. A 90-day feeding study of glyphosate-tolerant maize with the G2-aroA gene in Sprague-Dawley rats. Food Chem. Toxicol. 2013, 51, 280–287. [Google Scholar] [CrossRef]
  63. Lm, A.; Rm, B.; Amc, C.; Aj, C. Safety assessment of a lyophilized biomass of Tetraselmis chuii (TetraSOD) in a 90 day feeding study. Food Chem. Toxicol. 2019, 133, 110810. [Google Scholar]
  64. Malley, L.A.; Everds, N.E.; Reynolds, J.; Mann, P.C.; Lamb, I.; Rood, T.; Schmidt, J.; Layton, R.J.; Prochaska, L.M.; Hinds, M. Subchronic feeding study of DAS-59122-7 maize grain in Sprague-Dawley rats. Food Chem. Toxicol. 2007, 45, 1277–1292. [Google Scholar] [CrossRef]
Figure 1. Protein levels of P450-N-Z1 and CP4 EPSPS in ZDAX5 grain.
Agriculture 12 00808 g001
Figure 2. Body weight of rats during 13 weeks.: (a) mean weekly body weight of rats for male; (b) mean weekly body weight of rats for female.
Agriculture 12 00808 g002
Table 1. Proximate levels in ZDAX5 maize grain and Ruifeng-1 maize grain.
Componentp-Value 1ZDAX5Ruifeng-1OECD (2002) 2ILSI (2014) 3
Moisture (fw) 4>0.0510.28 ± 0.14 10.31 ± 0.12 7~23
Protein (dw) 5>0.0511.13 ± 0.23 11.16 ± 0.146~12.76.51–12.5
Lipid (dw) 5<0.054.78 ± 0.68 5.33 ± 0.24 3.1~5.82.73–5.48
Ash (dw) 5>0.051.70 ± 0.28 1.76 ± 0.21 1.1~3.90.84–1.82
Fiber (dw) 5>0.053.34 ± 0.122.80 ± 0.62 —e1.91–3.27
Starch (dw) 5>0.0564.23 ± 0.96 64.41 ± 0.51
1 The significance difference between ZDAX5 and Ruifeng-1 was determined with Student’s t-tests. No significant difference is found when the p-value is more than 0.05; Each value is the mean ± standard deviation; 2 Source: OECD (2002) data; 3 Source: the ILSI Crop Composition Database (2014); 4 fw = fresh weight; 5 dw = dry weight.
Table 2. Amino acid levels in ZDAX5 maize grain and Ruifeng-1 maize grain.
Componentp-Value 1Content (g/100 g) 2OECD (2002) 3ILSI (2014) 4
ZDAX5Ruifeng-1
Alanine>0.050.89 ± 0.04 0.90 ± 0.03 0.56~1.040.45–1.00
Arginine>0.050.56 ± 0.02 0.57 ± 0.03 0.22~0.640.32–0.64
Aspartic acid>0.050.77 ± 0.03 0.81 ± 0.05 0.48~0.850.42–0.82
Glutamic acid>0.052.36 ± 0.07 2.35 ± 0.04 1.25~2.581.04–2.66
Glycine>0.050.52 ± 0.02 0.54 ± 0.03 0.26~0.490.28–0.47
Histidine>0.050.29 ± 0.01 0.30 ± 0.02 0.15~0.380.20–0.36
Isoleucine>0.050.29 ± 0.01 0.29 ± 0.01 0.22~0.710.21–0.44
Leucine>0.051.02 ± 0.04 1.01 ± 0.04 0.79~2.410.66–1.74
Lysine>0.050.36 ± 0.02 0.38 ± 0.03 0.05~0.550.21–0.39
Methionine>0.050.03 ± 0.01 0.04 ± 0.01 0.10~0.460.13–0.30
Phenylalanine>0.050.45 ± 0.02 0.45 ± 0.01 0.29~0.640.28–0.73
Proline>0.050.85 ± 0.11 0.90 ± 0.13 0.63~1.360.52–1.20
Tyrosine>0.050.20 ± 0.04 0.22 ± 0.01 0.12~0.790.17–0.51
Valine<0.050.43 ± 0.01 0.45 ± 0.02 0.21~0.850.31–0.59
Serine>0.050.47 ± 0.01 0.47 ± 0.010.35~0.910.29–0.63
Threonine<0.050.38 ± 0.01 0.40 ± 0.01 0.27~0.580.24–0.45
1 The significance difference between ZDAX5 and Ruifeng-1 was determined with Student’s t-tests. No significant difference is found when the p-value is more than 0.05; 2 Values of amino acids were calculated based on their content (g/100 g). Each value is the mean ± standard deviation; 3 Source: OECD (2002) data; 4 Source: the ILSI Crop Composition Database (2014).
Table 3. Fatty acid levels in ZDAX5 maize grain and Ruifeng-1 maize grain.
Componentp-Value 1Content (%) 2ILSI (2014) 3
ZDAX5Ruifeng-1
C14:0>0.050.04 ± 0.001 0.04 ± 0.001
C16:0<0.0513.77 ± 0.17 14.27 ± 0.0513.22–16.62
C16:1>0.050.11 ± 0.003 0.11 ± 0.0020.09–0.17
C17:0>0.050.13 ± 0.003 0.13 ± 0.0030.07–0.11
C18:0<0.051.55 ± 0.02 1.71 ± 0.031.45–2.42
C18:1<0.0524.30 ± 0.12 25.18 ± 0.1016.38–28.34
C18:2<0.0557.89 ± 0.20 56.29 ± 0.09 51.04–64.22
C18:3<0.051.00 ± 0.02 1.02 ± 0.011.48–2.14
C20:0<0.050.43 ± 0.02 0.46 ± 0.010.32–0.48
C22:0>0.050.17 ± 0.02 0.19 ± 0.010.10–0.21
1 The significance difference between ZDAX5 and Ruifeng-1 was determined with Student’s t-tests. No significant difference is found when the p-value is more than 0.05; 2 Values of fatty acids were calculated based on their content (%). Each value is the mean ± standard deviation; 3 Source: the ILSI Crop Composition Database (2014).
Table 4. Vitamin levels in ZDAX5 maize grain and Ruifeng-1 maize grain.
Componentp-Value 1Content (mg/100 g) 2OECD (2002) 3ILSI (2014) 4
ZDAX5Ruifeng-1
vitamin B1>0.050.12 ± 0.01 0.12 ± 0.010.23~0.860.15–0.53
vitamin B2>0.050.07 ± 0.010.07 ± 0.010.03~0.560.13–0.41
vitamin E>0.052.40 ± 0.65 1.94 ± 0.28 -0.38–2.63
1 The significance difference between ZDAX5 and Ruifeng-1 was determined with Student’s t-tests. No significant difference is found when the p-value is more than 0.05; 2 Values of vitamins were calculated based on their content (mg/100 g). Each value is the mean ± standard deviation; 3 Source: OECD (2002) data; 4 Source: the ILSI Crop Composition Database (2014).
Table 5. Mineral levels in ZDAX5 maize grain and Ruifeng-1 maize grain.
Componentp-Value 1Content (mg/kg) 2OECD (2002) 3ILSI (2014) 4
ZDAX5Ruifeng-1
Calcium>0.0566.80 ± 8.34 71.54 ± 4.7330~100021.5–59.2
Copper>0.051.72 ± 0.13 1.61 ± 0.18 0.9~100.76–4.19
Iron<0.0541.22 ± 3.3454.82 ± 4.84 1~10014.6–38.9
Kalium>0.054233.33 ± 214.654352.22 ± 140.96 3200~72002730.0–4950.0
Magnesium>0.051611.11 ± 96.751566.67 ± 69.6482~1000816.0–1460.0
Sodium<0.0534.79 ± 2.6529.42 ± 6.35 0~1500.84–144.0
Phosphorus>0.054340.00 ± 354.514277.78 ± 328.022340~75002140.0–4670.0
Zinc<0.0538.63 ± 2.5634.53 ± 2.1812~3013.7–39.6
Selenium>0.050.03 ± 0.01 0.03 ± 0.000.01~10.03–0.27
Manganese>0.0512.07 ± 0.64 11.73 ± 0.49
1 The significance difference between ZDAX5 and Ruifeng-1 was determined with Student’s t-tests. No significant difference is found when the p-value is more than 0.05; 2 Values of minerals were calculated based on their content (mg/kg). Each value is the mean ± standard deviation; 3 Source: OECD (2002) data; 4 Source: the ILSI Crop Composition Database (2014).
Table 6. Anti-nutrient levels in ZDAX5 maize grain and Ruifeng-1 maize grain.
Componentp-Value 1Content 2OECD (2002)/ILSI (2014)
ZDAX5Ruifeng-1
phytic acid (g/kg)>0.0518.02 ± 0.83 18.22 ± 1.15Not available
trypsin inhibitors (TIU/g)<0.053127.78 ± 236.842748.89 ± 119.94Not available
1 The significance difference between ZDAX5 and Ruifeng-1 was determined with Student’s t-tests. No significant difference is found when the p-value is more than 0.05; 2 Value of phytic acid was calculated based on their content (g/kg). Each value is the mean ± standard deviation.
Table 7. Hematology of male and female rats feed with different diets (n = 10).
Control GroupNon-GM GroupsGM Groups
12.5%25%50%12.5%25%50%
Male
WBC (109/L)7.78 ± 1.567.65 ± 1.397.89 ± 1.118.03 ± 1.128.43 ± 1.138.10 ± 1.557.99 ± 2.20
RBC (1012/L)6.93 ± 1.138.03 ± 1.497.83 ± 1.297.26 ± 0.626.44 ± 0.466.64 ± 0.556.48 ± 0.60
HGB (g/L)126 ± 20145 ± 32135 ± 24131 ± 10115 ± 8118 ± 9117 ± 11
HCT (%)39.5 ± 6.844.4 ± 8.941.9 ± 7.140.6 ± 3.035.9 ± 2.436.8 ± 2.436.8 ± 3.5
PLT (109/L)560 ± 148587 ± 91625 ± 134641 ± 63675 ± 59722 ± 78 *583 ± 190
Female
WBC (109/L)6.59 ± 2.005.75 ± 1.435.68 ± 1.436.01 ± 0.984.63 ± 0.764.30 ± 1.104.86 ± 1.17
RBC (1012/L)6.90 ± 0.767.05 ± 1.747.01 ± 1.027.88 ± 0.776.83 ± 0.906.34 ± 0.356.84 ± 1.28
HGB (g/L)133 ± 13142 ± 38138 ± 20151 ± 18133 ± 17123 ± 9134 ± 28
HCT (%)45.1 ± 4.647.1 ± 11.045.9 ± 5.750.8 ± 5.044.1 ± 6.040.9 ± 2.245.0 ± 8.5
PLT (109/L)738 ± 107691 ± 130777 ± 65699 ± 89777 ± 126743 ± 44759 ± 014
* Significant difference between treatment groups and control group (p < 0.05).
Table 8. Serum chemistry of male and female rats feed with different diets (n = 10).
Control GroupNon-GM GroupsGM Groups
12.5%25%50%12.5%25%50%
Male
ALT (U/L)52.9 ± 6.355.2 ± 7.748.7 ± 7.949.0 ± 6.255.5 ± 5.050.4 ± 5.557.4 ± 14.1
AST (U/L)113 ± 19119 ± 24109 ± 34104 ± 9112 ± 17109 ± 29131 ± 28
ALP (U/L)103 ± 2495 ± 2385 ± 1287 ± 13101 ± 22101 ± 18103 ± 14
TP (g/L)64.7 ± 7.252.6 ± 13.355.0 ± 11.060.5 ± 6.755.1 ± 10.958.2 ± 11.164.6 ± 6.6
ALB (g/L)24.1 ± 2.021.5 ± 3.419.4 ± 1.6 *18.8 ± 1.6 *20.8 ± 2.522.6 ± 3.423.4 ± 3.7
CREA (mmol/L)50.8 ± 8.038.2 ± 8.4 *35.3 ± 5.1 *47.9 ± 8.542.3 ± 7.144.5 ± 8.351.6 ± 12.3
CHOL (mmol/L)3.23 ± 0.642.88 ± 0.962.68 ± 0.762.53 ± 0.702.74 ± 0.672.99 ± 0.832.86 ± 0.68
GLU (mmol/L)10.06 ± 2.478.12 ± 1.857.50 ± 1.82 *10.33 ± 1.667.85 ± 1.238.70 ± 1.519.34 ± 1.89
Female
ALT (U/L)48.5 ± 7.046.6 ± 7.046.4 ± 9.448.9 ± 10.143.1 ± 6.543.2 ± 6.243.6 ± 6.6
AST (U/L)92 ± 7100 ± 2488 ± 9100 ± 1779 ± 7 *82 ± 1290 ± 13
ALP (U/L)69 ± 1868 ± 2068 ± 1268 ± 2361 ± 2957 ± 1856 ± 5
TP (g/L)71.4 ± 6.064.5 ± 11.861.8 ± 6.160.4 ± 10.261.7 ± 7.959.9 ± 9.061.1 ± 7.1
ALB (g/L)29.2 ± 4.126.8 ± 4.525.4 ± 2.225.7 ± 2.726.3 ± 2.825.9 ± 1.923.8 ± 3.7 *
CREA (mmol/L)46.5 ± 8.044.8 ± 8.138.0 ± 3.147.6 ± 9.142.7 ± 7.638.6 ± 3.843.7 ± 6.7
CHOL (mmol/L)2.86 ± 0.732.50 ± 0.542.38 ± 0.532.40 ± 0.522.49 ± 0.892.24 ± 0.322.06 ± 0.49
GLU (mmol/L)9.75 ± 2.009.58 ± 1.818.59 ± 1.6011.41 ± 2.228.60 ± 1.747.74 ± 1.748.16 ± 1.73 #
* Significant difference between treatment groups and control group (p < 0.05); # Significant difference between GM diet and non-GM diet with same concentration (p < 0.05).
Table 9. Organ weight of male and female rats fed with different diets (n = 10).
Control GroupNon-GM GroupsGM Groups
12.5%25%50%12.5%25%50%
Male
Brain0.36 ± 0.020.40 ± 0.030.42 ± 0.04 *0.39 ± 0.050.40 ± 0.020.40 ± 0.040.38 ± 0.02
Liver2.64 ± 0.192.76 ± 0.562.78 ± 0.252.64 ± 0.212.54 ± 0.172.60 ± 0.232.60 ± 0.23
Spleen0.16 ± 0.020.17 ± 0.020.17 ± 0.020.18 ± 0.020.16 ± 0.020.15 ± 0.010.18 ± 0.02
Heart0.27 ± 0.030.27 ± 0.020.27 ± 0.070.27 ± 0.050.29 ± 0.040.30 ± 0.030.28 ± 0.03
Thymus0.11 ± 0.020.08 ± 0.02 *0.09 ± 0.02 *0.10 ± 0.010.10 ± 0.020.10 ± 0.010.10 ± 0.02
Kidneys0.62 ± 0.080.70 ± 0.060.70 ± 0.050.66 ± 0.060.64 ± 0.090.63 ± 0.040.64 ± 0.09
Adrenal0.012 ± 0.0020.012 ± 0.0020.012 ± 0.0020.012 ± 0.0030.014 ± 0.0040.012 ± 0.0020.012 ± 0.003
Testis0.79 ± 0.110.79 ± 0.040.75 ± 0.080.74 ± 0.080.78 ± 0.060.72 ± 0.060.72 ± 0.10
Female
Brain0.63 ± 0.060.63 ± 0.050.60 ± 0.040.62 ± 0.040.63 ± 0.060.66 ± 0.050.65 ± 0.04
Liver2.82 ± 0.412.75 ± 0.292.94 ± 0.512.75 ± 0.172.66 ± 0.272.92 ± 0.522.82 ± 0.42
Spleen0.20 ± 0.040.20 ± 0.040.20 ± 0.020.18 ± 0.020.19 ± 0.030.20 ± 0.030.20 ± 0.03
Heart0.31 ± 0.020.32 ± 0.030.30 ± 0.020.32 ± 0.070.30 ± 0.030.31 ± 0.050.32 ± 0.01
Thymus0.12 ± 0.030.14 ± 0.040.13 ± 0.020.12 ± 0.020.13 ± 0.040.12 ± 0.040.12 ± 0.04
Kidneys0.61 ± 0.070.63 ± 0.030.65 ± 0.040.65 ± 0.040.68 ± 0.080.70 ± 0.080.66 ± 0.08
Adrenal0.028 ± 0.0030.029 ± 0.0040.026 ± 0.0040.026 ± 0.0030.028 ± 0.0030.030 ± 0.0030.028 ± 0.004
Ovaries0.051 ± 0.0090.051 ± 0.0060.043 ± 0.0100.050 ± 0.0060.047 ± 0.0100.051 ± 0.0090.051 ± 0.014
* Significant difference between treatment groups and control group (p < 0.05).
Publisher’s Note: MDPI stays neutral with regard to jurisdictional claims in published maps and institutional affiliations.

