1. Introduction
Methyl bromide (MeBr) is a broad spectrum agricultural pesticide that has been used on more than 100 crops worldwide—mainly in strawberry, bell pepper and tomato production [
1]. Its primary use is as a soil fumigant to control soil-borne diseases, nematodes, soil insects, pathogens and weeds. It is also used in post-harvest storage and transportation of mainly fruits and vegetables; for laboratory and analytical use as a feedstock; and for quarantine and pre-shipment (QPS) purposes.
Despite widespread use of methyl bromide, this fumigant has been found to cause stratospheric ozone layer depletion and to be associated with serious health effects. Methyl bromide has also been associated with effects to soil biodiversity and groundwater contamination [
2]. In response to these findings, the 1992 Parties of the Montreal Protocol labeled it an ozone depleting substance (ODS) with an ozone depletion potential of 0.7 [
3,
4]. The U.S. Environmental Protection Agency (US EPA) placed it under the U.S. Clean Air Act of 1990 for regulation. Under the 1998 amendment to this Act, the importation and production of methyl bromide was to be reduced by 50% by the year 2001, 70% by 2003, and total phase-out by 2005 [
5,
6,
7,
8]. To date, exemptions to the phase-out have been allowed for quarantine and pre-shipment (QPS), critical use, and chemical feedstock uses. Nonetheless, there has been a heightened search for alternative pesticides to serve as substitutes to methyl bromide across its various uses.
The Methyl Bromide Technical Options Committee [
5] defined ‘alternatives’ as “any practice or treatment that can be used in place of methyl bromide. ‘Existing alternatives’ are those alternatives in present or past use in some regions. ‘Potential alternatives’ are those in the process of investigation or development”. The search for alternatives has been hampered by findings indicating that risks from such substitute chemicals may be as great as those from the pesticides being banned [
9], and by the challenges due to regional differences in soil types and weather conditions that may lead to discrepancies in the efficacy of the alternatives [
10]. While research on methyl bromide alternatives is ongoing, the US Environmental Protection Agency (EPA) continues to prioritize the registration of alternatives for various agricultural sectors.
Pesticides, by their very nature, are designed to impede and/or prevent the development of living organisms, to interfere with their ability to reproduce, or to kill them outright. While their use is generally undertaken to target specific organisms, pesticide applications often cause harm to non-target species. Due to differences in chemical composition, mode of action, and application techniques, the substitution of one pesticide for another may result in different effects on non-target populations. The focus of this paper is to derive a measure by which to compare the relative, potential impact of alternatives to methyl bromide on non-target populations. These include relative impacts to workers, consumers, birds, bees, fish, and beneficial arthropods. The measure we derive is based on the chemical composition of the pesticides and their expected application rates, not on regulatory guidelines or restrictions related to the handling or application of the pesticides. We limit our analysis to the alternative proposed for tomato production in Florida, which are shown in
Table 1.
Table 1.
Primary methyl bromide alternatives for the Florida Tomato Sector.
Table 1.
Primary methyl bromide alternatives for the Florida Tomato Sector.
| Alternatives available | Alternatives under development |
|---|
| 1,3-Dichloropropene (1,3-D) | Dimethyl Disulfide |
| Chloropicrin | Furfural |
| Dazomet | |
| Iodomethane | |
| Metam Sodium | |
| Glyphosate (H) | |
| Paraquat (H) | |
| Halosulfuron-methyl (H) | |
| s-Metolachlor (H) | |
| Trifloxysulfuron-methyl (H) | |
| Rimsulfuron (H) | |
| Fosthiazate | |
Historically, the United States (US) has consumed the bulk of total methyl bromide annually, 42 million pounds (29.4 percent) of the World’s 143 million pounds [
12]. Of this share, 83 percent was used for pre-plant soil fumigation, 11 percent for post-harvest treatment of stored commodities, and 6 percent for fumigation of structures [
1]. The National Center for Food and Agricultural Policy (NCFAP) estimated that about 35 million pounds (active ingredient) of methyl bromide were used annually for pre-plant soil fumigation in the US [
13].
Florida is one of the two leading methyl bromide users in the US because its weather conditions favor higher pest populations. In 1997, Florida accounted for 36 percent of the US pre-plant methyl bromide use [
1]. According to a 1996 survey, Florida crops depending on methyl bromide for fumigation included tomato (53 percent), bell peppers (33 percent), strawberry (12 percent), and eggplant (2 percent) [
14]. At that time, methyl bromide was applied in combination with chloropicrin to more than 80 percent of Florida’s tomato acreage [
15]. The most commonly used formulation of methyl bromide in Florida has historically been the 67/33, which has 67 percent methyl bromide and 33 percent chloropicrin.
Various studies have demonstrated that there is no perfect one-to-one replacement for all of the uses of methyl bromide [
2,
4]. The main challenges are in relation to efficacy (due to the broad spectrum activity), cost, ease of use, availability, and worker and environmental safety. One recommendation is to combine the activity of various active ingredients and improve fumigant retention in the soil using mulches [
16]. Most of the alternatives registered so far are effective either against nematodes, diseases, or both, but with little to no weed management activity. It is therefore recommended to mix the fumigants with herbicides and insecticides, a measure that greatly increases their cost. The proposed herbicides include glyphosate, paraquat, halosufuron methyl, s-metachlor, rimsulfuron, and trifloxysulfuron methyl [
11]. A qualitative measure of the effectiveness of the soil fumigant alternatives is shown in
Table 2.
Table 2.
Florida maximum use rates and effectiveness of soil fumigant alternatives.
Table 2.
Florida maximum use rates and effectiveness of soil fumigant alternatives.
| Fumigant chemical | Max. use rate | Relative pesticidal activity |
|---|
| Nematode | Disease | Weed |
|---|
| Methyl bromide 67/33 | 350 lb | Excellent | Excellent | Good–Excellent |
| Chloropicrin | 300 lb | None–Poor | Excellent | Poor |
| Methyl iodide | 350 lb | Good–Excellent | Good–Excellent | Good–Excellent |
| Metam sodium (Vapam) | 75 gal | Erratic | Erratic | Erratic |
| Telone II | 18 gal | Good–Excellent | None–Poor | Poor |
| Telone C17 | 26 gal | Good–Excellent | Good | Poor |
| Telone C35 | 35 gal | Good–Excellent | Good–Excellent | Poor |
| Pic-Clor 60 | 250 lb | Good–Excellent | Good–Excellent | Poor |
| Metam Potassuim (Kpam) | 60 gal | Erratic | Erratic | Erratic |
The United States Department of Agriculture’s (USDA) National Agricultural Pesticide Impact Assessment Program (NAPIAP) carried out one of the first economic impact assessments of the phase-out of methyl bromide [
17]. They concluded that the phase out of MeBr as a fumigant would result in a substantial impact on many commodities because available alternatives are either less effective or more expensive than MeBr [
17,
18], and that the effect would be most felt in Florida and California. They also estimated that the effects to fumigation would be $1.5 billion dollars in annual lost production in the United States alone. This estimate does not include post-harvest, non-quarantine uses and quarantine treatments of imports and other future economic aspects such as lost jobs, and markets. The report predicted the major crop losses would occur with tomatoes ($350 M), ornamentals ($170 M), tobacco ($130 M), peppers ($130 M), strawberries ($110 M) and forest seedlings ($35 M).
The nature and extent of pesticide impacts on the environment, non-target species, and human beings, vary to a great degree depending on their inherent chemical properties and the manner in which these chemicals are incorporated into the environment. The environmental behavior (mobility and persistence) and toxicity profiles for most pesticides differ from each other too. Merely reducing the amount of pesticides applied to crops may not provide sufficient insight into their environmental impacts [
19]. Thus, even though pesticide risk to the environment is related to the amount of active ingredient applied, total pounds of active ingredient applied per year is not the best indicator of risk [
20]. The interplay among these factors, together with the degree of exposure of organisms to the chemicals dictates the degree of pesticide impacts. In addition, climatic conditions, soil properties, topography, and many other site-specific factors influence pesticide behavior, consequently affecting risk and hazard levels [
21].
Pesticide risk is often defined as the inherent potential to cause harm coupled with the likelihood of exposure. Numerous pesticide risk indicator models exist for the calculation of environmental pesticide risk. These models differ in four main aspects: (1) the components of the analysis, including pesticides considered, variables assessed, and the choice of specific measurable endpoints as the indicators of impacts on these variables; (2) the mathematical structure of the model (e.g., relative weighting of variables and scoring of the results); (3) the method for filling data gaps; and 4) whether usage data were factored into the analysis [
22].
Several methods have been used to assign an economic value to pesticide impacts. Such methods include: remediation cost, lost productivity, and willingness-to-pay (WTP) to avoid pesticide risk. WTP, which is commonly used, does not measure the existence or extent of an environmental problem, rather it measures the attitude toward a problem, and whether the problem bothers a particular stakeholder enough to pay for an alternative [
23].
Environmental impacts of pesticide use were commonly proxied through variables such as pounds of active ingredient (A.I.) applied or dollars spent on pesticides [
24]. The disadvantage is that both these measures assume environmental damage is directly correlated with the quantity of pesticide used, regardless of the specific chemical formulation [
24]. The increased availability of low-dosage alternatives lend credence to the argument that weight and volume measures are not adequate proxies for assessing pesticide risk [
25].
Cornell University’s Environmental Risk Analysis Program has identified eight of the indicators widely used worldwide: Environmental Potential Risk Indicator for Pesticides (EPRIP), Environmental Yardstick for Pesticides (EYP), Survey of National Pesticide Risk Indicators (SYNOPS), System for Predicting the Environmental Impact of Pesticides (SyPEP), Pesticide Environmental Risk Indicator (PERI), Environmental Impact Quotient (EIQ), Chemical Hazard Evaluation for Management Strategies (CHEMS1), and Multi-Attribute Toxicity Factor (MATF). The first four indicators are referred to as predicted environmental concentration (PEC) indicators, and the later four constitute ranking indicators.
In this paper we concentrate on the Environmental Impact Quotient (EIQ), an indicator which expresses the relative impact of pesticides on the environment by scoring their effects on a set of environmental categories [
26]. The EIQ is a model that transforms the environmental impact information related to pesticide active ingredients to a single value. Lower values of the EIQ indicate lower risk of negative environmental impacts.
In the following section, we present the data and methodology used in our study.
Section 3 presents a discussion of our findings, and conclusions follow in Section 4.
2. Methods
In our study, we used environmental categories similar to Mullen
et al. [
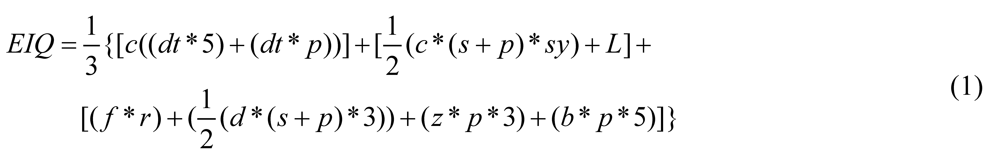
20], dividing the environmental pesticide impacts into eight categories. These categories include acute human health, chronic human health, aquatic species, birds, other mammals, arthropods, groundwater, and surface water. This categorization accounts for the problem that a given pesticide is likely to pose different levels of risk to different environmental components. The EIQ index in our study accounts for these categories through equation 1.
Table 3 provides definitions of the variables in equation 1 and the criteria for assigning values to those variables.
![Ijerph 08 04649 i001]()
Table 4 presents the values assigned to each variable across the set of proposed alternatives to methyl bromide in Florida tomato production. These values were obtained from different sources including International Union of Pure and Applied Chemistry 250 (IUPAC), Extension Toxicology Network (EXTOXNET), and the Crop Data Management System (CDMS) 251 which provides labels and material safety data sheets (MSDS). The list of alternatives to methyl bromide for use on Florida tomatoes was obtained from the US Environmental Protection Agency (US EPA).
Table 3.
Definition for symbols and ratings for each toxicity category in Equation (1).
Table 3.
Definition for symbols and ratings for each toxicity category in Equation (1).
| Environmental category | Symbol | Score 1 | Score 3 | Score 5 |
|---|
| Long-term health effects (chronic) | c | Little-none | Possible | Definite |
| Dermal toxicity (Rat LD50) | dt | >2000 mg/kg | 200–2000 mg/kg | 0–200 mg/kg |
| Bird toxicity (8 day LC50) | d | >1000 ppm | 100–1000 ppm | 1–100 ppm |
| Bee toxicity | z | Non-toxic | Moderately toxic | Highly toxic |
| Beneficial. Arthr. Toxicity. | b | Low impact | Moderate | Severe impact |
| Fish toxicity (96 h LC50) | f | >10 ppm | 1–10 ppm | <1 ppm |
| Plant surface half-life | p | 1–2 weeks (pre-emerg. Herbic.) | 2–4 weeks (post-emerg. herbic. | >4 weeks |
| Soil residue half-life (TI/2) | s | <30 days | 30–100 days | >100 days |
| Mode of Action | sy | Non-system; all herbicides | Systemic | |
| Leaching potential | L | Small | Medium | Large |
| Surface runoff potential | r | Small | Medium | Large |
Table 4.
Methyl bromide and alternative fumigant risk levels.
Table 4.
Methyl bromide and alternative fumigant risk levels.
| Active ingredient | Chronic health | Dermal toxicity | Plant surface ½ life | Soil residue ½ life | Mode of action | Leaching potential | Fish toxicity | Surface potential | Bird toxicity | Bee toxicity | Ben. Arthropod toxicity |
|---|
| Fumigants |
| MeBr | 5 | 5 | - | 1 | 1 | 1 | 3 | 1 | 3 | 1 | 1 |
| 1,3-D (Telone) | 3 | 3 | - | 1 | 1 | 3 | 3 | 1 | 3 | 3 | 3 |
| Chloropicrin | 1 | 5 | - | 1 | 1 | 1 | 5 | 1 | 5 | 3 | 1 |
| Iodomethane (Midas) | 3 | 1 | 1 | 1 | 1 | 1 | 1 | 1 | 3 | - | 3 |
| Metam sodium | 5 | 5 | - | 1 | 1 | 3 | 5 | 5 | 1 | 3 | 1 |
| Herbicides |
| Glyphosate | 1 | 5 | 1 | 1 | 1 | 1 | 3 | 5 | 1 | 3 | 3 |
| Paraquat | 5 | 3 | 5 | 5 | 1 | 1 | 3 | 5 | 3 | 1 | 1 |
| s-Metachlor | 3 | 1 | 1 | 3 | 1 | 3 | 3 | 3 | 1 | 5 | 1 |
| Trifloxysulfuronmethyl | 0 | 1 | 3 | 1 | 1 | 3 | 1 | 5 | 1 | 1 | 1 |
The EIQ formula can be broken down into effects on the farm worker (applicator and harvestor), consumer (exposure and groundwater effects), and ecology (fish, birds, bees, other beneficial insects), as shown in
Table 5.
Table 5.
EIQ equation environmental components.
Table 5.
EIQ equation environmental components.
| EIQ equation component | Equation |
|---|
| Farm worker (applicator + harvester) | c*((dt*5) + (dt*p)) |
| Consumer (exposure + groundwater effects) | (c*(s + p)/2*sy) + (L) |
| Ecology (fish, birds, bees, other beneficial insects) | (f*r) + (d*(s+p)/2*3) + (z*p*3) + (b*p*5) |
| Total EIQ = farm worker + consumer + ecology | {[c*(dt*5)+(dt*p)]+[(c*(s+p)/2*sy)+(L)+[(f*r)+(d*(s+p)/2*3)+(z*p*3)+(b*p*5)]}/3 |
| Field Use EIQ | EIQ * % active ingredient * rate/acre |
The EIQ criterion has been used widely to assess the relative risk associated with adopting various pesticides or pest management programs, including integrated pest management (IPM) programs. [
26]. Direct comparison between pesticides is most informative when they can be used to control the same pest. Methyl bromide alternatives are essentially supposed to control the same pests as methyl bromide.
In addition to the standard EIQ, we derive a Field Use EIQ that accounts for different formulations of the same active ingredients. While the EIQ is specific to individual active ingredients, the Field Use EIQ is specific to individual pesticide formulations, which may have multiple active ingredients. Additionally, the Field Use EIQ is weighted by the pesticide’s application rate. As shown in equation 2, the Field Use EIQ for pesticide formulation (p) is the sum of the EIQ’s of the individual active ingredients (a) weighted by both the proportion of the formulation each active ingredient comprises and the application rate (lb/acre) of the formulation. As with the standard EIQ, higher values of the Field Use EIQ indicate greater relative risk.
Field Use EIQp = Σa(EIQa × % active ingrediena) × Ratep (2)
where the subscript p refers to the pesticide formulation, and the subscript a refers to individual active ingredients.
Most of the proposed alternative fumigants are combinations of two or more chemicals. The two primary fumigant formulations for Florida tomatoes are combinations of 1,3-dichloropropene (Telone), and iodomethane (Midas). It is often recommended to include herbicides with the alternatives due to their poor weed suppression. To account for this, Field Use EIQs are also derived for the fumigants plus various combinations of pre- and post-emergence herbicides for maximum weed control, as recommended by Noling
et al. [
27].
3. Results
Field Use EIQ ratings generated for methyl bromide and various formulations of the recommended alternative fumigants are reported in
Table 6. Midas products have broad spectrum activity, so they were evaluated without a chloropicrin follow-up application. Telone products, on the other hand, have little disease activity, and no weed control activity. They were thus evaluated with a sequential application of chloropicrin and various recommended herbicides.
The main herbicides recommended are a mixture of napropamide and s-metolachlor as pre-emergent herbicides, followed by one or two applications of halosulfuran. For comparison purposes, we evaluated glyphosate (pre-emergent) and three other post-emergent herbicides: paraquat, trifloxysufuron methyl, and rimsulfuron.
Table 6.
Fumigant and herbicide characteristics.
Table 6.
Fumigant and herbicide characteristics.
| Product | Formulation | Application rate (lb/acre) | EIQ | Field use EIQ |
|---|
| Fumigants | | | | |
| | % Methyl Bromide/% Chloropicrin | | | |
| Methyl bromide | 67/33 | 200 | 53.6 [26] | 10,720 |
| | % Iodomethane/% Chloropicrin | | | |
| Midas 98:2 | 97.8/1.99 | 137.5 | 16.2 [c] | 2,223 |
| Midas EC Bronze | 49.9/44.78 | 275 | 26.8 [c] | 7,273 |
| Midas 50:50 | 49.9/49.75 | 275 | 29.0 [c] | 7,951 |
| Midas EC Gold | 32.93/61.69 | 415 | 31.3 [c] | 12,996 |
| Midas 33:67 | 32.93/66.67 | 415 | 33.6 [c] | 13,873 |
| Midas 25:75 | 24.95/74.63 | 550 | 35.7 [c] | 19,554 |
| | % 1,3-Dichloropropene/% Chloropicrin | | | |
| Telone II (1,3-D) | 97.5/0 | 121.2 | 27.8 [26] | 3,285 |
| Telone C17 | 81.2/16.5 | 147.9 | 29.6 [c] | 4,372 |
| Telone C35 | 63.4/34.7 | 187.6 | 32.3 [c] | 6,067 |
| Pic Clor 60 | 39/59.6 | 242 | 36.1 [c] | 8,739 |
| | % active ingredient | | | |
| Chloropicrin | 96 | 150 | 42.4 [26] | 6,106 |
| Vapam (metam sodium) | 42 | 320 | 26.6 [26] | 3,575 |
| Herbicides | | | | |
| Glyphosate | 41 | 2 | 15.33 [26] | 12.57 |
| Napropamide | 24.1 | 2 | 12.57 [26] | 6.06 |
| s-metolachlor | 83.7 | 0.95 | 22 [26] | 17.49 |
| Paraquat (post-) | 30.1 | 0.54 | 92 [c] | 14.95 |
| Halosulfuron methyl | 75 | 0.024 | 20.2 [26] | 0.36 |
| Rimsulfuron | 25 | 0.125 | 15.84 [26] | 0.5 |
| Trifloxysulfuron methyl | 75 | 0.006 | 12.67 [c] | 0.06 |
From
Table 6, methyl bromide has the highest EIQ value among all the fumigants in the study. However, the EIQs for both the Midas and the Telone products increase as the concentration of chloropicrin increases.
The rank order of the fumigants changes when application rate is incorporated into the Field Use EIQ. With the exception of Midas 98:2, the Midas products all have higher application rates than methyl bromide, and higher concentrations of chloropicrin. Together, these factors increase the Field Use EIQ, so much so that half of the Midas products have a higher Field Use EIQ than methyl bromide.
The Field Use EIQ of the Telone products also increases as application rate and the concentration of chloropicrin increase. Although they approach it, none of these products exceed the Field Use EIQ of methyl bromide.
Compared to the fumigants, the herbicides have similar EIQs. Their Field Use EIQs, however, are much lower than those of the fumigants. This is due to the lower application rates.
Among the herbicides, paraquat has the highest EIQ (92), compared to values between 12 and 22 for the rest of the herbicides. The rank order of the herbicides changes considerably, however, under the Field Use EIQ. Although the active ingredient in paraquat has a high EIQ, the concentration of active ingredient is low relative to several of the other herbicides. Similarly, the application rate of paraquat is lower. With these factors considered, paraquat has the third highest Field Use EIQ.
Results of the Field Use EIQs for various formulations of Midas, Telone + chloropicrin, and Telone + Vapam, with and without herbicides are shown in
Table 7. Because of the difference in magnitude of the Field Use EIQ between the fumigants and the herbicides, the addition of an herbicide treatment has little effect on the overall Field Use EIQ. However, these pesticides have different impacts on the environmental and human health components that comprise both the EIQ and the Field Use EIQ.
Table 7.
Field Use EIQ ratings of fumigants with and without herbicides (100 s).
Table 7.
Field Use EIQ ratings of fumigants with and without herbicides (100 s).
| Product | W/o herbicides | With pre-emergent herbicides | With nap + met and post-emergent herbicides | With glyphosate and post-emergent herbicides |
|---|
| glyp | nap + met | paraq | Halos | trif | rim | paraq | halos | glyp + trif | glyp + rim |
|---|
| Midas@ 98:2 | 22.2 | 22.4 | 22.5 | 22.6 | 22.5 | 22.5 | 22.5 | 22.5 | 22.4 | 22.2 | 22.4 |
| Midas@ EC Bronze | 73.7 | 73.8 | 74 | 74.1 | 74 | 74 | 74 | 74 | 73.8 | 73.7 | 73.8 |
| Midas@ 50:50 | 79.5 | 79.6 | 79.7 | 79.9 | 79.7 | 79.7 | 79.8 | 79.8 | 79.6 | 79.5 | 79.6 |
| Midas@ Gold | 130 | 130.1 | 130.2 | 130.3 | 130.2 | 130.2 | 130.2 | 130.2 | 130.1 | 130 | 130.1 |
| Midas@ 33:67 | 138.7 | 138.9 | 139 | 139.1 | 139 | 139 | 139 | 139 | 138.9 | 138.7 | 138.9 |
| Midas@ 25:75 | 195.5 | 195.7 | 195.8 | 195.9 | 195.8 | 195.8 | 195.8 | 195.8 | 195.7 | 195.5 | 195.7 |
| Telone II +Pic | 93.9 | 94 | 94.1 | 94.3 | 94.1 | 94.1 | 94.2 | 94.2 | 94 | 93.9 | 94 |
| Telone C17 + Pic | 104.8 | 104.9 | 105 | 105.2 | 105 | 105 | 105 | 105.1 | 104.9 | 104.8 | 104.9 |
| Telone C35 + Pic | 121.7 | 121.9 | 122 | 122.1 | 122 | 122 | 122 | 122 | 121.9 | 121.7 | 121.9 |
| Pic Clor 60 + Pic | 148.5 | 148.6 | 148.7 | 148.8 | 148.7 | 148.7 | 148.7 | 148.7 | 148.6 | 148.5 | 148.6 |
| Telone II +Vapam | 68.6 | - | - | - | - | - | - | - | - | - | - |
| Telone C17 Vapam | 79.5 | - | - | - | - | - | - | - | - | - | - |
| Telone C35 +Vapam | 96.4 | - | - | - | - | - | - | - | - | - | - |
| Pic Clor 60+ Vapam | 123.1 | - | - | - | - | - | - | - | - | - | - |
| MeBr | 107.2 | - | - | - | - | - | - | - | - | - | - |
3.1. Impacts by Environmental Category
Table 8 presents the Field Use EIQ for each pesticide, broken down by environmental category. With the exception of Midas 25/75, all alternative fumigants have the highest impacts on workers, and second highest effects to beneficial arthropods. Methyl bromide, too, has the highest effects on workers and the second highest effects on birds. In contrast, the herbicides tend to pose the highest relative risk to beneficial arthropods, followed by workers. As one would expect, the highest impacts are among categories that come into direct contact with the products, namely, workers and beneficial arthropods.
Table 8.
Field Use EIQ by environmental category.
Table 8.
Field Use EIQ by environmental category.
| Fumigant | Worker | Consumer + L | Fish | Birds | Bee | Beneficials |
|---|
| Midas@ 98:2 | 2,515 | 558 | 148 | 1,281 | 51 | 2,115 |
| Midas@ EC Bronze | 6,719 | 1,466 | 753 | 4,404 | 2,316 | 6,469 |
| Midas@ 50:50 | 7,190 | 1,568 | 821 | 4,755 | 2,573 | 6,959 |
| Midas@ EC Gold | 11,292 | 2,454 | 1,417 | 7,817 | 4,816 | 11,220 |
| Midas@ 33:67 | 12,005 | 2,608 | 1,520 | 8,349 | 5,204 | 11,961 |
| Midas@ 25:75 | 16,631 | 3,607 | 2,190 | 11,796 | 7,721 | 16,761 |
| Telone II + Pic | 9,860 | 2,007 | 1,075 | 4,219 | 4,730 | 6,281 |
| Telone C17 + Pic | 10,781 | 2,203 | 1,202 | 4,855 | 5,221 | 7,173 |
| Telone C35 + Pic | 12,138 | 2,498 | 1,402 | 5,897 | 5,967 | 8,620 |
| Pic Clor 60 + Pic | 13,851 | 2,893 | 1,724 | 7,827 | 7,036 | 11,221 |
| Telone II + Vapam | 8,138 | 2,020 | 1,565 | 1,099 | 2,787 | 4,953 |
| Telone C17 +Vapam | 9,059 | 2,216 | 1,692 | 1,735 | 3,278 | 5,845 |
| Telone C35 +Vapam | 10,416 | 2,511 | 1,892 | 2,777 | 4,024 | 7,292 |
| Pic Clor 60 +Vapam | 12,129 | 2,906 | 2,214 | 4,707 | 5,093 | 9,893 |
| MeBr | 12,193 | 1,885 | 464 | 7,125 | 2,206 | 6,063 |
| glyphosate (H) | 6.56 | 2.46 | 4.1 | 4.92 | 7.38 | 12.3 |
| paraquat (H) | 24.38 | 4.23 | 2.44 | 7.31 | 2.44 | 4.06 |
| halosulfuron methyl (H) | 0.22 | 0.11 | 0.05 | 0.11 | 0.16 | 0.44 |
| s-metachlor (H) | 9.54 | 7.16 | 7.16 | 9.54 | 7.16 | 11.93 |
| trifloxysulfuron methyl (H) | 0 | 0.01 | 0.02 | 0.03 | 0.04 | 0.07 |
| rimsulfuron (H) | 0.25 | 0.09 | 0.03 | 0.19 | 0.32 | 0.6 |
In addition to the fact that adding chloropicrin (Pic) to Telone products results in higher environmental risks than using metam sodium (Vapam), the ordering of the impacts is also altered for some environmental categories. This is due to the fact that chloropicrin and Vapam have different effects on each of the environmental categories. Among all the alternatives, however, Midas 98/2 has the lowest Field Use EIQ across all the environmental categories, while Midas 25/75 has the highest.
5. Conclusions
Increased awareness of environmental and human health effects from pesticide use in agriculture have prompted policy measures aimed at reducing these effects. One such policy measure is the decision to phase-out methyl bromide after the 1991 Montreal Protocol declared it as a Class I controlled substance. US chemical manufacturing companies, together with the Environmental Protection Agency, have actively been seeking alternative fumigants to methyl bromide for various agricultural sectors. Finding alternative fumigants to methyl bromide is especially important to the tomato industry. So far, it has been challenging to find broad spectrum alternatives, so several pesticides are combined to achieve such action.
Using the EIQ and Field Use EIQ, our findings indicate that workers and beneficial arthropods are the most likely to be affected by all fumigants. This result is expected since workers are exposed to fumigants in their most concentrated form during mixing and application, while beneficials are exposed via their habitat and feeding habits. On the other hand, fish and consumers face lower relative risk from the tomato fumigants. The results also indicate that while chloropicrin is needed as a warning agent to all the alternatives, increasing the chloropicrin component in the fumigant formulation greatly increases its relative risk. It appears prudent to limit chloropicrin use to the minimal amounts necessary for efficacy.
The impetus behind the methyl bromide phase-out is its ozone depleting potential. It is important to note that the EIQ and Field Use EIQ derived in this paper account for a limited scope of potential environmental impacts. For example, ozone depletion risk is not a component of either measure. Furthermore, regulatory guidelines or restrictions related to the handling or application of the pesticides are not accounted for in either measure. Nonetheless, The EIQ and Field Use EIQ are can help policy makers in evaluating the relative risks of proposed alternatives.
There is a wide array of environmental risk indicators for pesticides. Different indicators are developed for different purposes, and therefore may lead to very different conclusions. Indicators employing ranking methodologies are easier to use compared to predicted environmental concentration (PEC) indicators that are more data intensive. However, PEC indicators have been found to give a more complete picture of environmental risk
Furthermore, there is no scientifically valid way of combining risks across various environmental and health categories. Indices use weighting schemes to reflect the relative importance of one category to another. Assigning relative weights is ultimately a subjective, political process.
Lastly, indicators are relative measures, not direct measures of real risk. For this reason, they should be used as signposts only and should not be the sole basis for decision-making. These issues notwithstanding, relative risk indicators can facilitate regulatory and production decisions about which pesticides are used, and how they are used.