Health Inequities, Environmental Insecurity and the Attainment of the Millennium Development Goals in Sub-Saharan Africa: The Case Study of Zambia

Abstract
:Introduction
Materials and Methods
Results
Attainment of MDGs in the Different Regions of the World
Attainment of MDGs in Zambia: Progress Report
Goal 1: Eradicate extreme poverty and hunger
Target 1: Reduce by half, between 1990 and 2015, the proportion of people living in extreme poverty
Target 2 – Reduce by half, between 1990 and 2015, the proportion of people who suffer from hunger
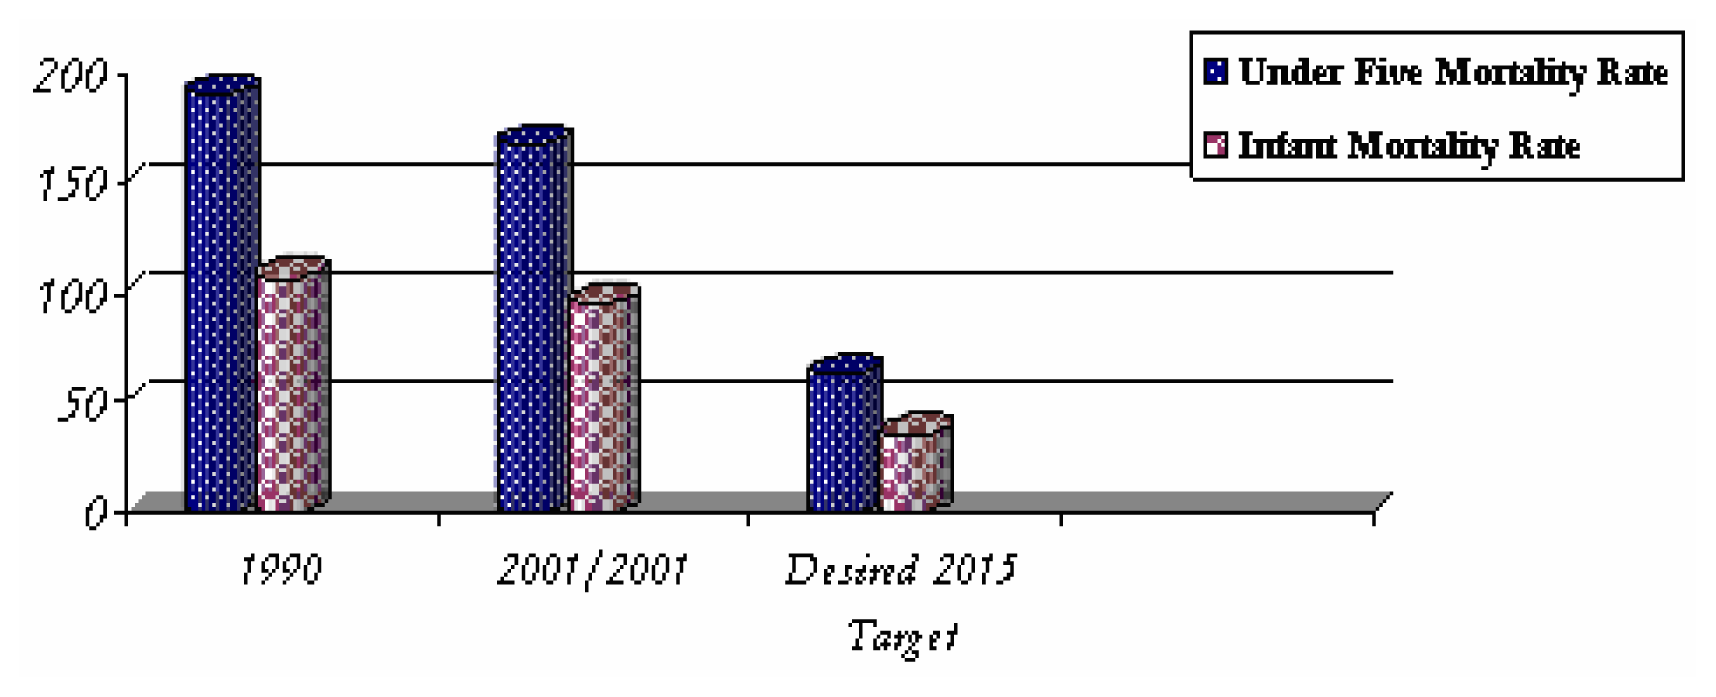
Goal 4: Reduce child mortality
Target 5: Reduce by two-thirds between 1990 and 2015, the under-five mortality rate
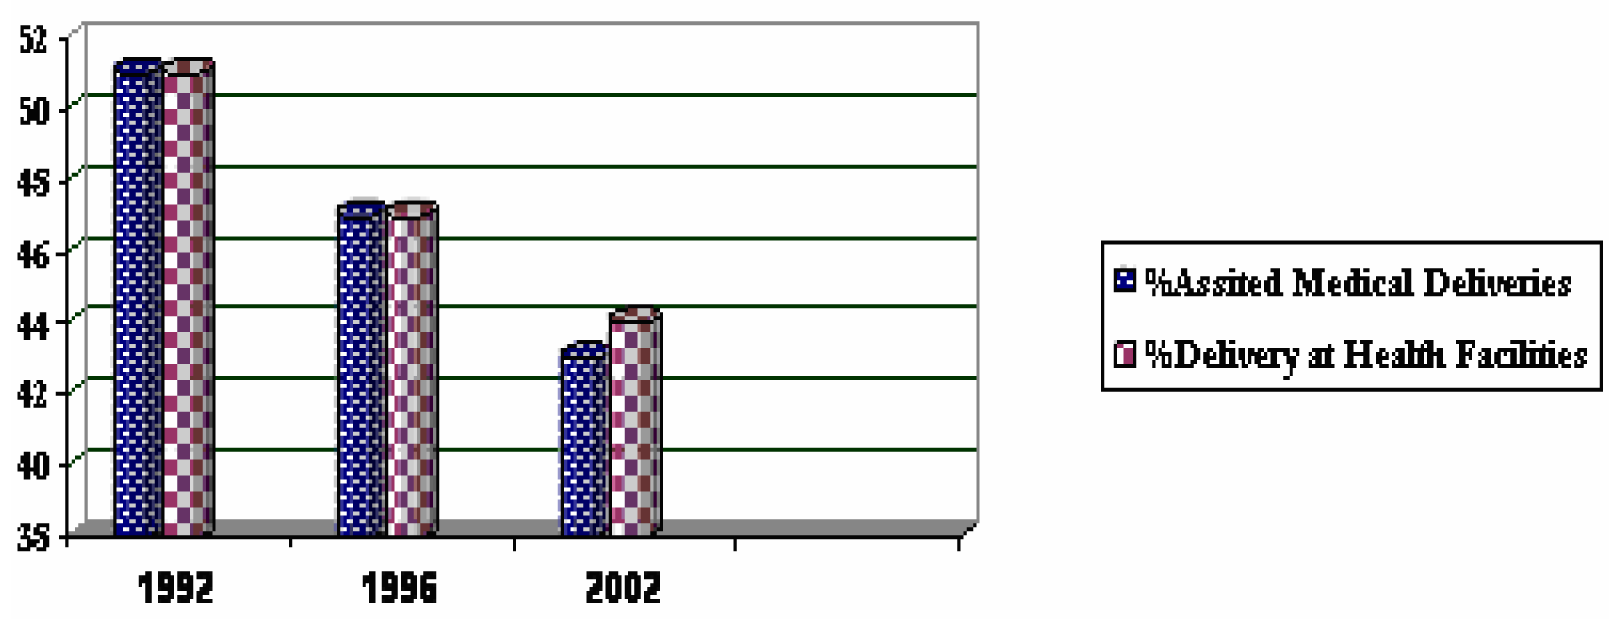
Goal 5: Improve maternal health
Target 6: Reduce by three-quarters, between 1990 and 2015, the maternal mortality ratio
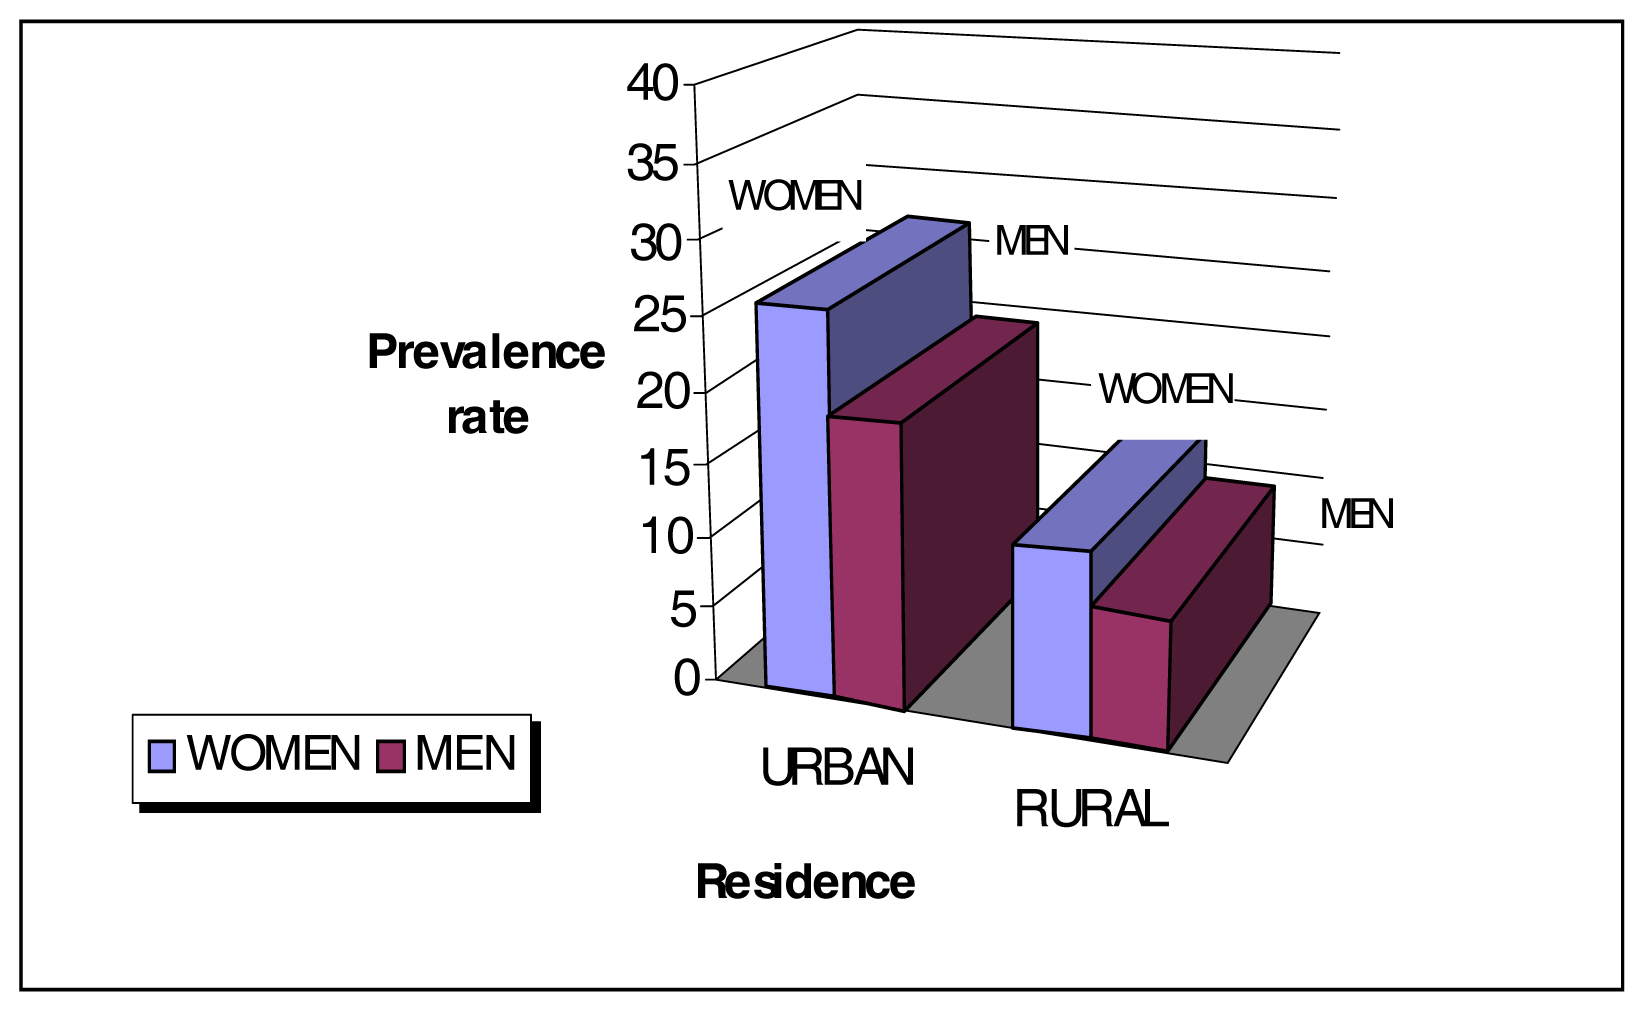
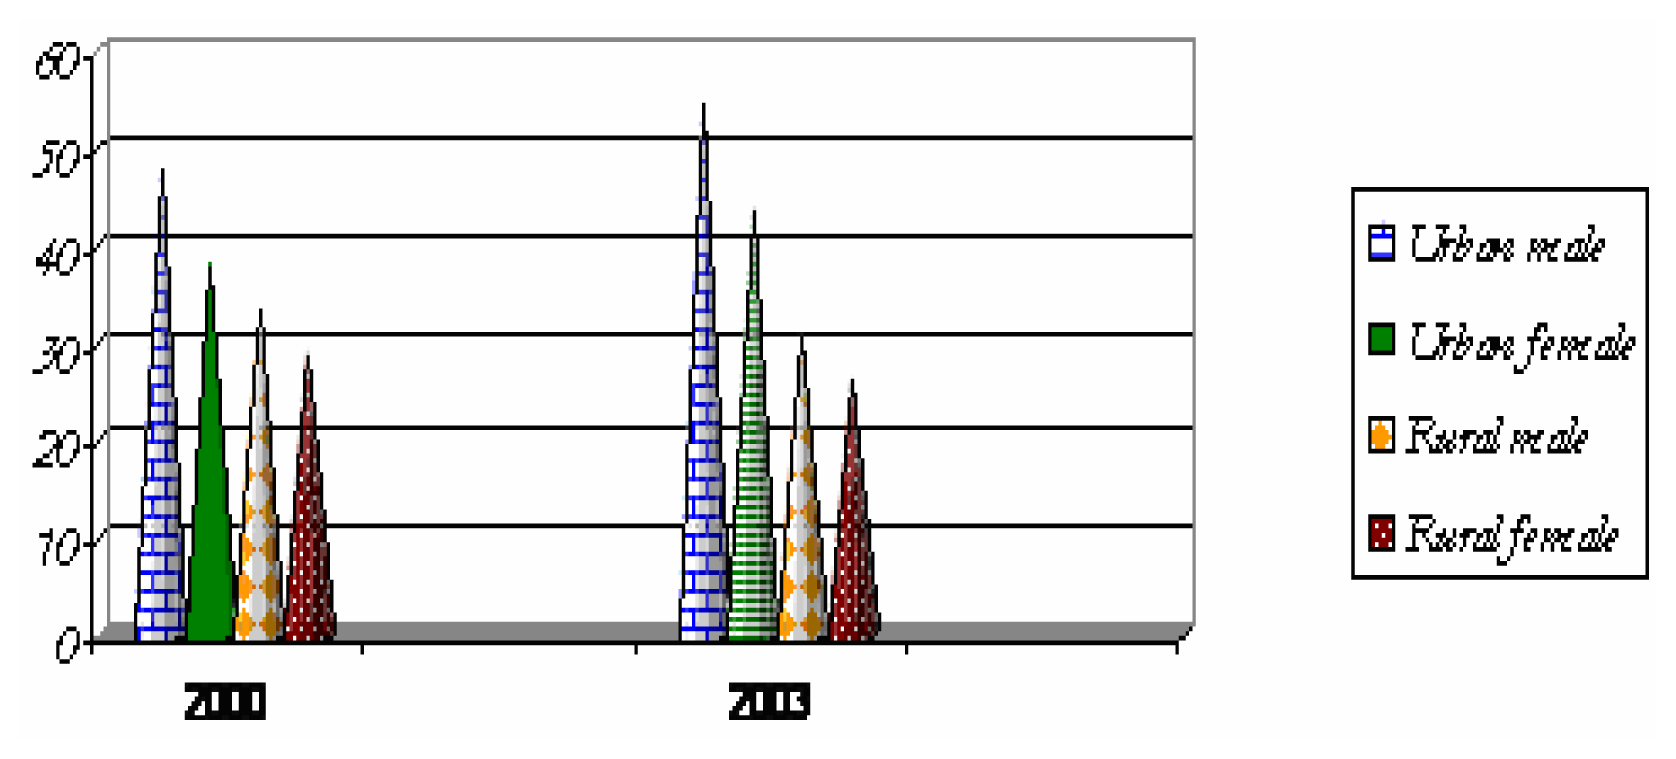
Goal 6: Combat HIV/AIDS, malaria and other diseases
Target 7: Have halted by 2015, and began to reverse the spread of HIV/AIDS
Target 8: To halt and begin to reverse the incidence of malaria and other major diseases by 2015
Goal 7: Ensure environmental sustainability
Target 9: Integrate the principles of sustainable development into country policies and programmers and reverse the loss of environmental resources
Target 10: Reduce by half by 2015 the proportion without sustainable access to safe drinking water and basic sanitation
Discussion
- Allocate more funds to health, education and agriculture to ensure scaling up of all that works well to eradicate poverty.
- Eliminate school and uniforms fees to enable all children, especially girls, attend and complete school.
- Provide children with free school meals and take home rations, to prevent malnutrition and anaemia.
- De-worm school children annually for improved health and educational outcomes.
- Design community nutrition programmes that support breastfeeding and use of local indigenous foods as supplements.
- In malaria-endemic areas, carry out combined activities such as distribution of free, insecticide-treated bed nets to children and pregnant women, intermittent preventive treatment of pregnant women, and indoor residual spraying.
- Eliminate user fees (and all hidden costs) for basic health care.
- Scale up treatment for AIDS, sexually transmitted infections, TB and malaria.
- Scale up activities and messages for prevention of STIs and HIV.
- Provide clean water, electricity, sanitation for all communities.
- Provide farmers with affordable soil nutrients and technical skills for diversified farming and increased food production.
- Train community leaders and members in health promotion, health, farming and infrastructure management so as to rapidly increase pool of skilled persons in rural communities.


| Africa 840 million | Asia 3,738 million | Oceania | Latin America and the Caribbean | Commonwealth of Independent states 281 million | ||||||
|---|---|---|---|---|---|---|---|---|---|---|
| North | Sub Saharan | East | South East | Southern | Western | Europe | Asia | |||
| Goal 1: Eradicate Extreme Hunger | ||||||||||
| Reduce poverty by half | On track | High no change | Met | On track | On track | Increase | ····· | Low minimal improvement | Increase | Increase |
| Reduce hunger by half | On track | Very high no change | On track | On track | Progress but lagging | Increase | Moderate no change | On track | Low, no change | Increase |
| Goal 2: Achieve Universal Primary Education | ||||||||||
| Universal primary schooling | On track | Progress but lagging | Met | Lagging | Progress but lagging | High but no change | Progress but lagging | On track | Decline | On track |
| Goal 3: Promote Gender Equality and Empower Women | ||||||||||
| Equal girls enrollment in primary schools | On track | Progress but lagging | Met | On track | Progress but lagging | Progress but lagging | On track | On track | Met | On track |
| Equal girls enrollment in secondary school | Met | No significant change | ····· | Met | No significant change | No significant change | Progress but lagging | On track | Met | Met |
| Literacy parity between young women and men | Lagging | Lagging | Met | Met | Lagging | Lagging | Lagging | Met | Met | Met |
| Women’s equal representation in national parliaments | Progress but lagging | Progress but lagging | Decline | Progress but lagging | Very low, small progress | Very low, no change | Progress but lagging | Progress but lagging | Recent progress | Decline |
| Goal 4: Reduce Child Mortality | ||||||||||
| Reduce mortality of under five years olds by two thirds | On track | Very high, no change | Progress but lagging | On track | Progress but lagging | Moderate, no change | Moderate no change | On track | Low no change | Increased mortality |
| Measles immunization | Met | Low no change | Progress but lagging | On track | Progress but lagging | On track | Decline | Met | Met | Met |
| Goal 5: Improve Maternal Health | ||||||||||
| Reduce maternal mortality by three quarters | Moderate level | Very high level | Low level | High level | Very high level | Moderate level | High level | Moderate level | Low | Low |
| Goal 6: Combat HIV/AIDS, malaria and other Diseases | ||||||||||
| Halt and reverse the spread of HIV/AIDS | ····· | Stable | Increase | Stable | Increase | ····· | Increase | Stable | Increase | Increase |
| Halt and reverse the spread of malaria | Low risk | High risk | moderate risk | moderate risk | moderate risk | Low risk | Low risk | Moderate risk | Low risk | Low risk |
| Hal and reverse the spread of TB | Low risk | High increasing | Moderate declining | High declining | High declining | Low declining | High increasing | Low declining | Moderate increasing | Moderate increasing |
| Goal 8: Global Partnership For Development | ||||||||||
| Youth unemployment | High no change | High no change | Low increasing | Rapidly increasing | Low increasing | High increasing | Low increasing | Increasing | Low, rapidly increasing | Low, rapidly increasing |
| Goal 7: Ensure Environmental Sustainability | ||||||||||
| Reverse loss of forests | Less than 1% of forests | Decline | Met | Decline | Small decline | Less than 1% forest | Decline | Decline except Caribbean | Met | Met |
| Half the proportion without improved drinking water in urban areas | High access but little change | Progress but lagging | Progress but lagging | Progress but lagging | On track | Progress but lagging | Low access no change | Progress but lagging | High access but limited change | High access but limited change |
| Half the proportion without sanitation in urban areas | On track | Low access no change | Progress but lagging | On track | On track | Met | High access but no change | High access but no change | High access but no change | High access but no change |
| Half proportion without sanitation in rural areas | Progress but lagging | No significant change | Progress but lagging | Progress but lagging | Progress but lagging | No significant change | No significant change | Progress but lagging | No significant change | No significant change |
| Improve the lives of slum dwellers | On track | Rising number and proportion of slum dwellers | Progress but lagging | On track | Some progress | Rising number and proportion of slum dwellers | ····· | Progress but lagging | Low but no change | Low but no change |
| Indicator | Value | Year | Latest Value |
|---|---|---|---|
| Population size (million) | 9.9 | 2000 | 11.4m (2005)* |
| Annual population growth rate (%) | 2.5 | 2000 | |
| Life expectancy at birth (years) | 50 | 2000 | 37.5 (2005) |
| Real GDP per capita (US$) | 354 | 2002 | 877 (2005) |
| Domestic debt as % of GDP | 26 | 2002 | |
| External debt as % of GDP | 190 | 2002 | |
| Debt service as % of exports of goods and services | 13.7 | 2002 | |
| Human development Index (value) | 0.38 | 2003 | |
| Human Development Index (rank out of 175) | 163 | 2003 | 166 (2005) |
| Population below national poverty line (%) | 73 | 1998 | 63.7 (2005) |
| Prevalence of HIV/AIDS (15–49 years) | 16 | 2002 | |
| Percentage of underweight children under 5 years (%) | 28 | 2002 | |
| Infant mortality (per 1,000 live births) | 95 | 2002 | |
| Under five mortality (1,000 live births) | 168 | 2002 | |
| Maternal mortality (per 100,000 live births) | 729 | 2002 | |
| Adult literacy (%) | 67 | 2000 | |
| Net enrolment in primary education (%) | 72 | 2002 | |
| Population without access to safe drinking water supply (%) | 51 | 2002 | |
| Population relying on traditional fuels for energy use (%) | 83 | 2000 |
| Zambia’s Progress towards the Millennium Development Goals | ||||
|---|---|---|---|---|
| Goals/Targets | Will target be met? | State of national support | ||
| 2005 | 2003 | 2005 | 2003 | |
| Extreme Poverty Halve between 1990 and 2015, the proportion of people living in extreme poverty. | Potentially | Unlikely | Good | weak but improving |
| Hunger Halve, between 1990 and 2015, the proportion of people who suffer from hunger | Unlikely | Unlikely | Weak | weak but improving |
| Universal Primary Education Ensure that by 2015, children everywhere, boys and girls alike, will be able to complete a full course of primary schooling | Likely | Potentially | Strong | Strong |
| Gender Equality and Women Empowerment Eliminate gender disparity in Primary and Secondary Education preferably by 2005 and to all levels of education no later than 2015 | Likely | Probably | Good | Fair |
| Child Mortality Reduce by two thirds, between 1990 and 2015, the under five mortality rate | Potentially | Potentially | Strong | Fair |
| Maternal Mortality Reduce by three quarters, between 1990 and 2015, the maternal mortality ratio | Unlikely | Unlikely | Weak | weak but improving |
| HIV/AIDS Have halted by 2015, and began to reverse the spread of HIV/AIDS | Likely | Potentially | Good | Fair |
| Malaria and other major diseases Have halted by 2015, and began reversing the incidence of malaria and other major diseases | Potentially | Potentially | Good | Fair |
| Environmental Sustainability Integrate the principles of sustainable development into country policies and programmes and reverse the loss of environmental resources | Unlikely | Unlikely | Weak | weak but improving |
| Water and Sanitation Halve by 2015 the proportion without sustainable access to safe drinking water and sanitation. | Potentially | Potentially | Weak | weak but improving |
| Indicator | 1990 | 2003 | 2015 MDG target |
|---|---|---|---|
| % Total population living in extreme poverty | 58 | 46 | 29 |
| % Urban population living in extreme poverty | 32 | 74 | 16 |
| % Rural population living in extreme poverty | 81 | 52 | 40 |
| Indicator | 1990 | 2001/2 | 2015 MDG target |
|---|---|---|---|
| Underweight children <5 years of age (%) | 25 | 28 | 12.5 |
| Stunted children <5years of age (%) | 40 | 47 | 20.0 |
| Wasted children <5 years of age (%) | 5 | 5 | 2.5 |
| Indicator | 1990 | 2001/2 | 2015 MDG target |
|---|---|---|---|
| Under-five mortality rate/1000 live births | 191 | 168 | 63* |
| Infant mortality rate/1000 live births | 107 | 95 | 35* |
| Proportion of 1 year-old children immunized against measles | No data | 99% | 99%** |
| Indicator | 1990 | 2001/2 | 2015 MDG target |
|---|---|---|---|
| Maternal mortality ratio/100,000 live births | 649 | 729 | 162 |
| Proportion of births attended by skilled health personnel | 51% | 43% | 80% |
| Province | Dr:Pop | CO:Pop | RM:Pop | RN:Pop | ZEM:Pop | ZEN:Pop | Pharm. Staff:Pop | Lab. Staff:Pop | EHT:Pop |
|---|---|---|---|---|---|---|---|---|---|
| Lusaka | 6,247 | 7, 544 | 12, 397 | 3,799 | 5, 243 | 1,577 | 319,847 | 15,527 | 27,573 |
| Copperbelt | 8,998 | 9, 719 | 14, 425 | 5, 091 | 3, 599 | 1,567 | 55,076 | 16,523 | 23,006 |
| Average Rural | 43,313 | 10,970 | 74, 713 | 17, 324 | 11, 541 | 2,863 | 169,160 | 49,582 | 13,099 |
| Provinces National | 17,589 | 9, 787 | 27, 714 | 8, 822 | 6, 099 | 2,293 | 123,509 | 27,249 | 15,150 |
| Disease | Incidence (Cases/1000 pop) | In-Patient CFR*(deaths/100 Admissions) | ||||
|---|---|---|---|---|---|---|
| 1999 | 2002 | 2004 | 1999 | 2002 | 2004 | |
| Malaria | 311.9 | 387.8 | 383.2 | 36.3 | 26.5 | 33.0 |
| Respiratory Infections: Non Pneumonia | 125.8 | 148.0 | 152.9 | 28.6 | 17.4 | 48.1 |
| Diarrhoea Non Bloody | 59.8 | 80.0 | 74.7 | 69.6 | 53.9 | 62.5 |
| Eye Infections | 38.8 | 42.7 | 39.7 | 17.8 | 0.9 | 2.0 |
| Respiratory Infections: Pneumonia | 33.5 | 45.0 | 43.7 | 120.1 | 58.0 | 68.7 |
| Indicator | 1990 | 2002 | 2015 MDG target |
|---|---|---|---|
| New malaria cases per 1000 | 255 | 377 | Less than 121 |
| Malaria fatality rates per 1000 | 11 | 48 | |
| Households with ITN* (%) | - | 14 |
| Indicator | 1990 | 1996 | 2001 | 2003 |
|---|---|---|---|---|
| Percentage of land covered by forest | 59.8 (1992) | 59.1 | 59.6 | 45 |
| Percentage of households with access to an improved water source* | ||||
|---|---|---|---|---|
| Indicator | 1991 | 1996 | 2000 | 2003 |
| All Zambia | 50 | 47 | 49.1..... | 53 |
| Rural | 20 | 28 | 31.2 (2001) | 37 |
| Urban | 90 | 85.3 | 89.8 (2001) | 86 |
| Percentage of households with access to improved sanitation** | ||||
| Indicator | 1991 | 1996 | 2000 | 2003 |
| All Zambia | 24 | 18 | 14.9 | 65 |
| Rural | 6 | 2 | 2.9 (2001) | 57 |
| Urban | 47 | 45.9 | 44.8 (2001) | 80 |
References
- World Health Organization, Basic documents; WHO: Geneva, 1948.
- World Health Organization, Poverty and health: a strategy for the African region (AFR/RC52/11); WHO: Brazzaville, 2003; pp. 1–13.
- United Nations. Millennium Development Goals. 2004. www.un.org/millenniumgoals/mdg2004.
- U.N Millennium Project, Investing in development: a practical plan to achieve the Millennium Development Goals; UNDP: New York, 2005; Overview; pp. 1–95.
- Wagstaff, A.; Claeson, M. The Millennium Development Goals for Health: Rising to the challenges; The World Bank: Washington D.C, 2004; Volume Chapter 2, pp. 31–46. [Google Scholar]
- Evans, D.; Edejer, T. T. Choosing interventions that are cost effective: an aid to policy. African Health Monitor 2005, 5, 227–29. [Google Scholar]
- World Health Organization. Health and the Millennium Development Goals. 2003. www.hlfhealthmdgs.org.
- Central Statistical Office, Ministry of Health and ORC Macro, Zambia Demographic and Health Survey 2001–2002; ORC Macro: Calverton, 2003; pp. 150–240.
- Central Statistical Office, Living Conditions Monitoring Survey Report 2002/2003; GRZ, 2004; pp. 44–167.
- Central Statistical Office, Ministry of Health and MEASURE Evaluation, Zambia Sexual Behaviour Survey, 2003; Lusaka, 2004; pp. 23–46.
- National HIV/AIDS/STI/TB Council, The HIV/AIDS Epidemic in Zambia: Where are we now? Where are we going? Lusaka, 2004; pp. 10–34.
- National HIV/AIDS/STI/TB Council, Joint Review of the national HIV/AIDS/STI/TB Intervention Strategic Plan 2002 2005; Lusaka, 2004; pp. 6–30.
- Ministry of Health, Draft 5-year Strategic Plan: A road map for RBM impact in Zambia 2006–2010; Lusaka, 2005; pp. 1–14.
- Government of the Republic of Zambia, Zambia Millennium Development Goals: status report 2003; GRZ, 2003; pp. 1–32.
- Government of the Republic of Zambia. Zambia Millennium Development Goals: draft status report 2005 2005, 1–46.
- Copperbelt Environmental Project, Determination of the Extent of Contamination in the Vicinity of the Kabwe Mine; Kabwe Scoping Study Phase One Completion Report. Water management; ZCCM-IH Kitwe, 2004.
© 2006 MDPI. All rights reserved.
Share and Cite
Anyangwe, S.C.E.; Mtonga, C.; Chirwa, B. Health Inequities, Environmental Insecurity and the Attainment of the Millennium Development Goals in Sub-Saharan Africa: The Case Study of Zambia. Int. J. Environ. Res. Public Health 2006, 3, 217-227. https://doi.org/10.3390/ijerph2006030026
Anyangwe SCE, Mtonga C, Chirwa B. Health Inequities, Environmental Insecurity and the Attainment of the Millennium Development Goals in Sub-Saharan Africa: The Case Study of Zambia. International Journal of Environmental Research and Public Health. 2006; 3(3):217-227. https://doi.org/10.3390/ijerph2006030026
Chicago/Turabian StyleAnyangwe, Stella C. E., Chipayeni Mtonga, and Ben Chirwa. 2006. "Health Inequities, Environmental Insecurity and the Attainment of the Millennium Development Goals in Sub-Saharan Africa: The Case Study of Zambia" International Journal of Environmental Research and Public Health 3, no. 3: 217-227. https://doi.org/10.3390/ijerph2006030026