Assessment of Public Health Risks Associated with Atmospheric Exposure to PM2.5 in Washington, DC, USA

Abstract
:Introduction
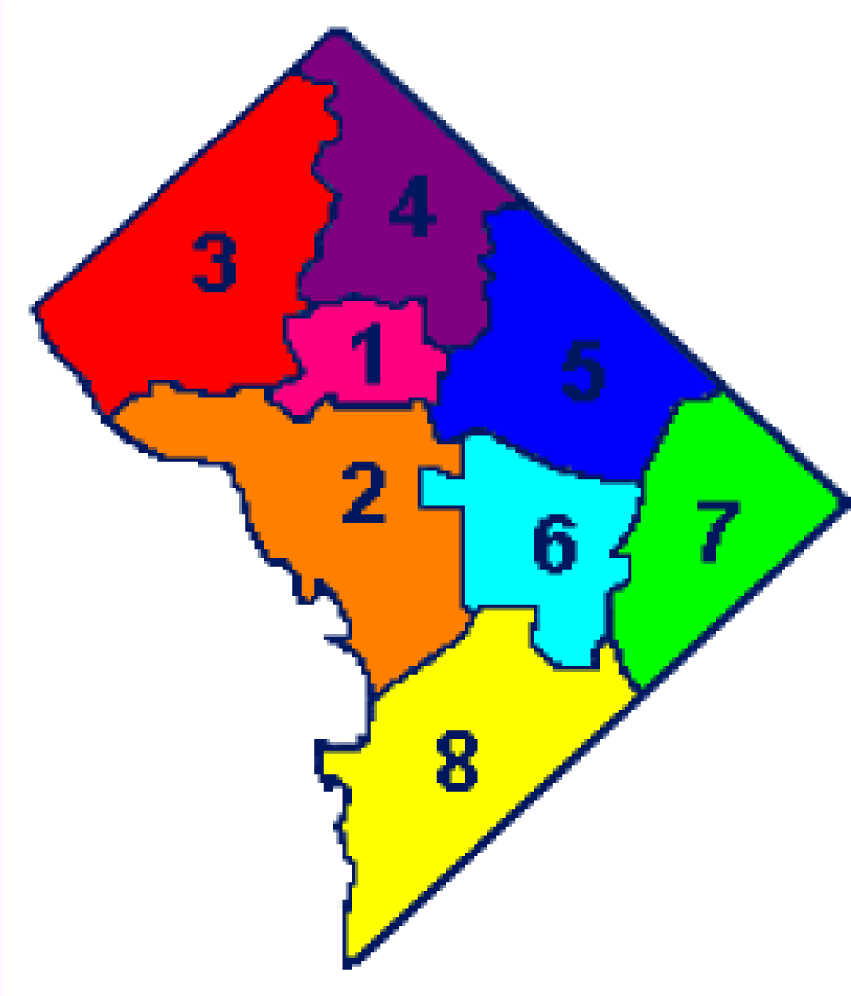
Discussion of Washington, DC Wards
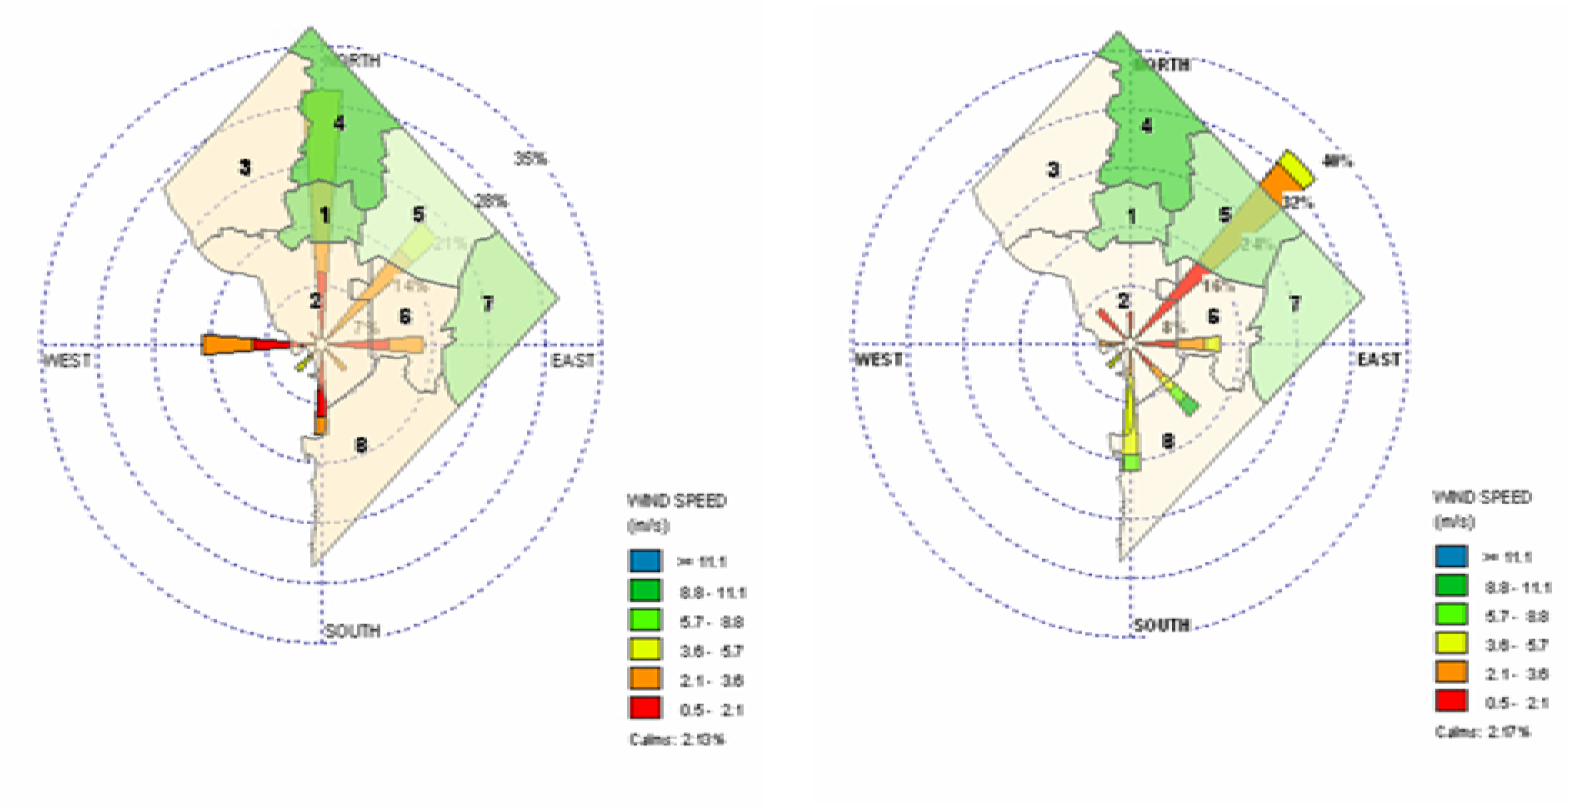
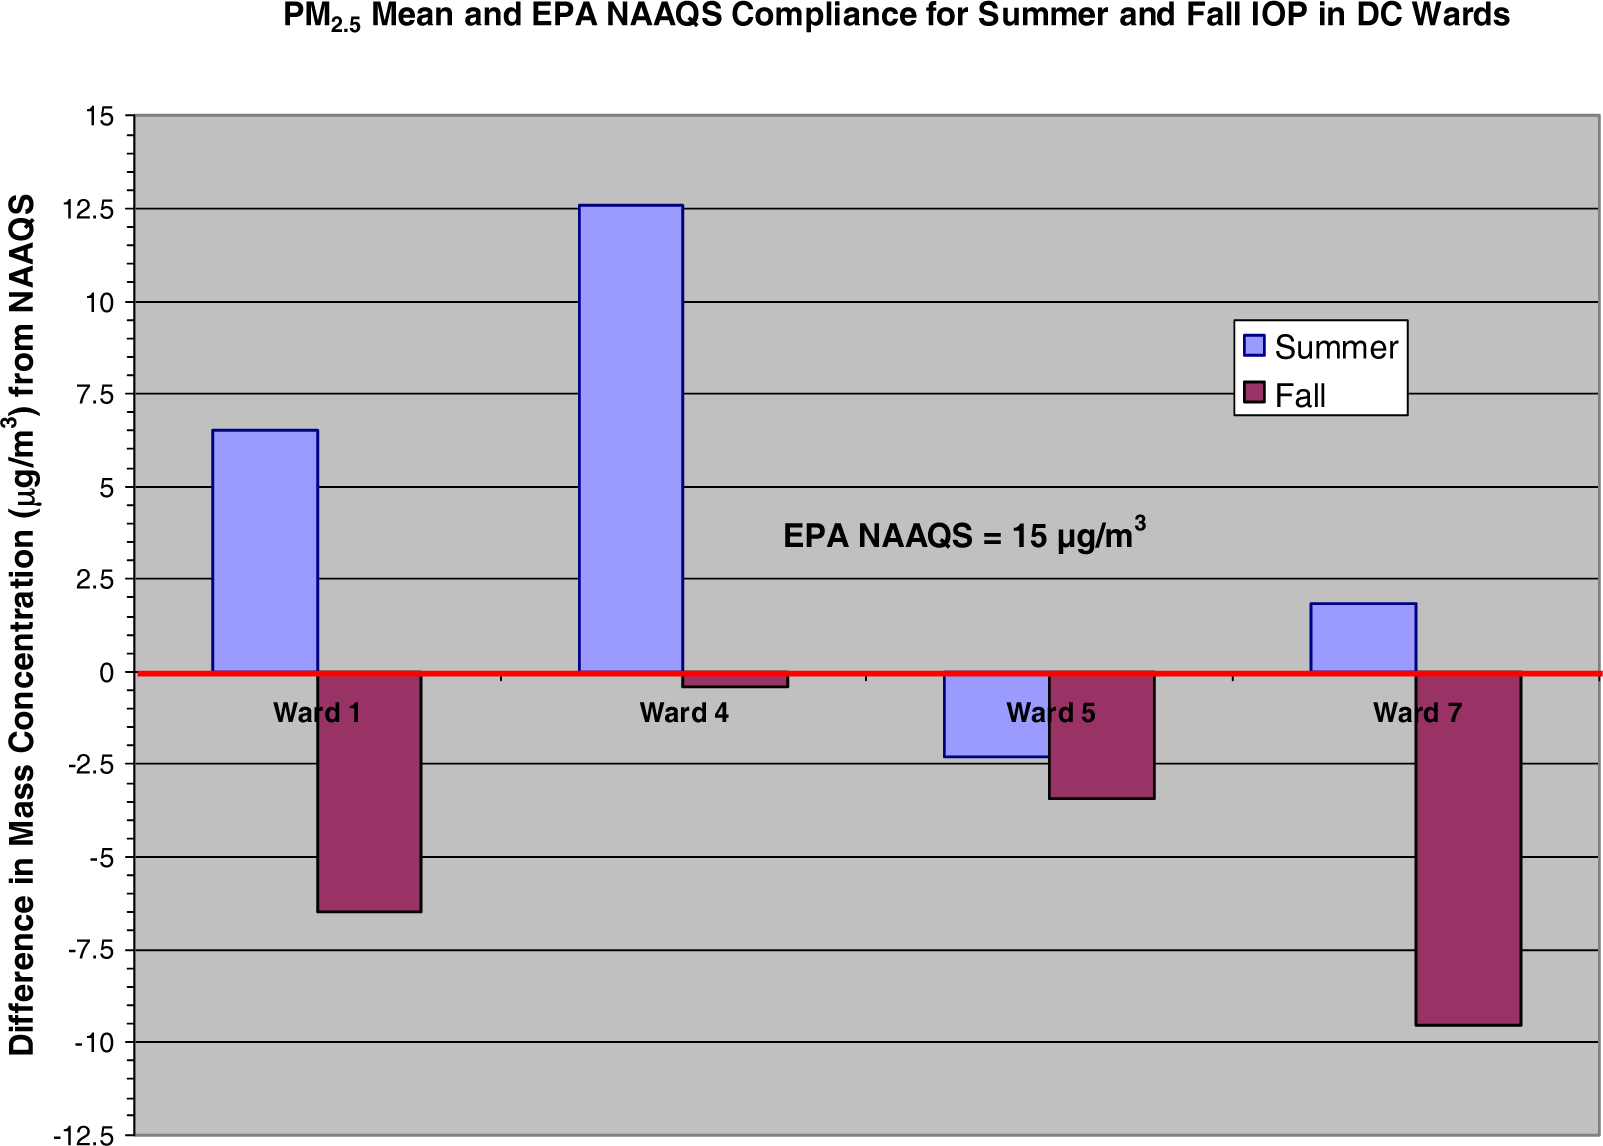
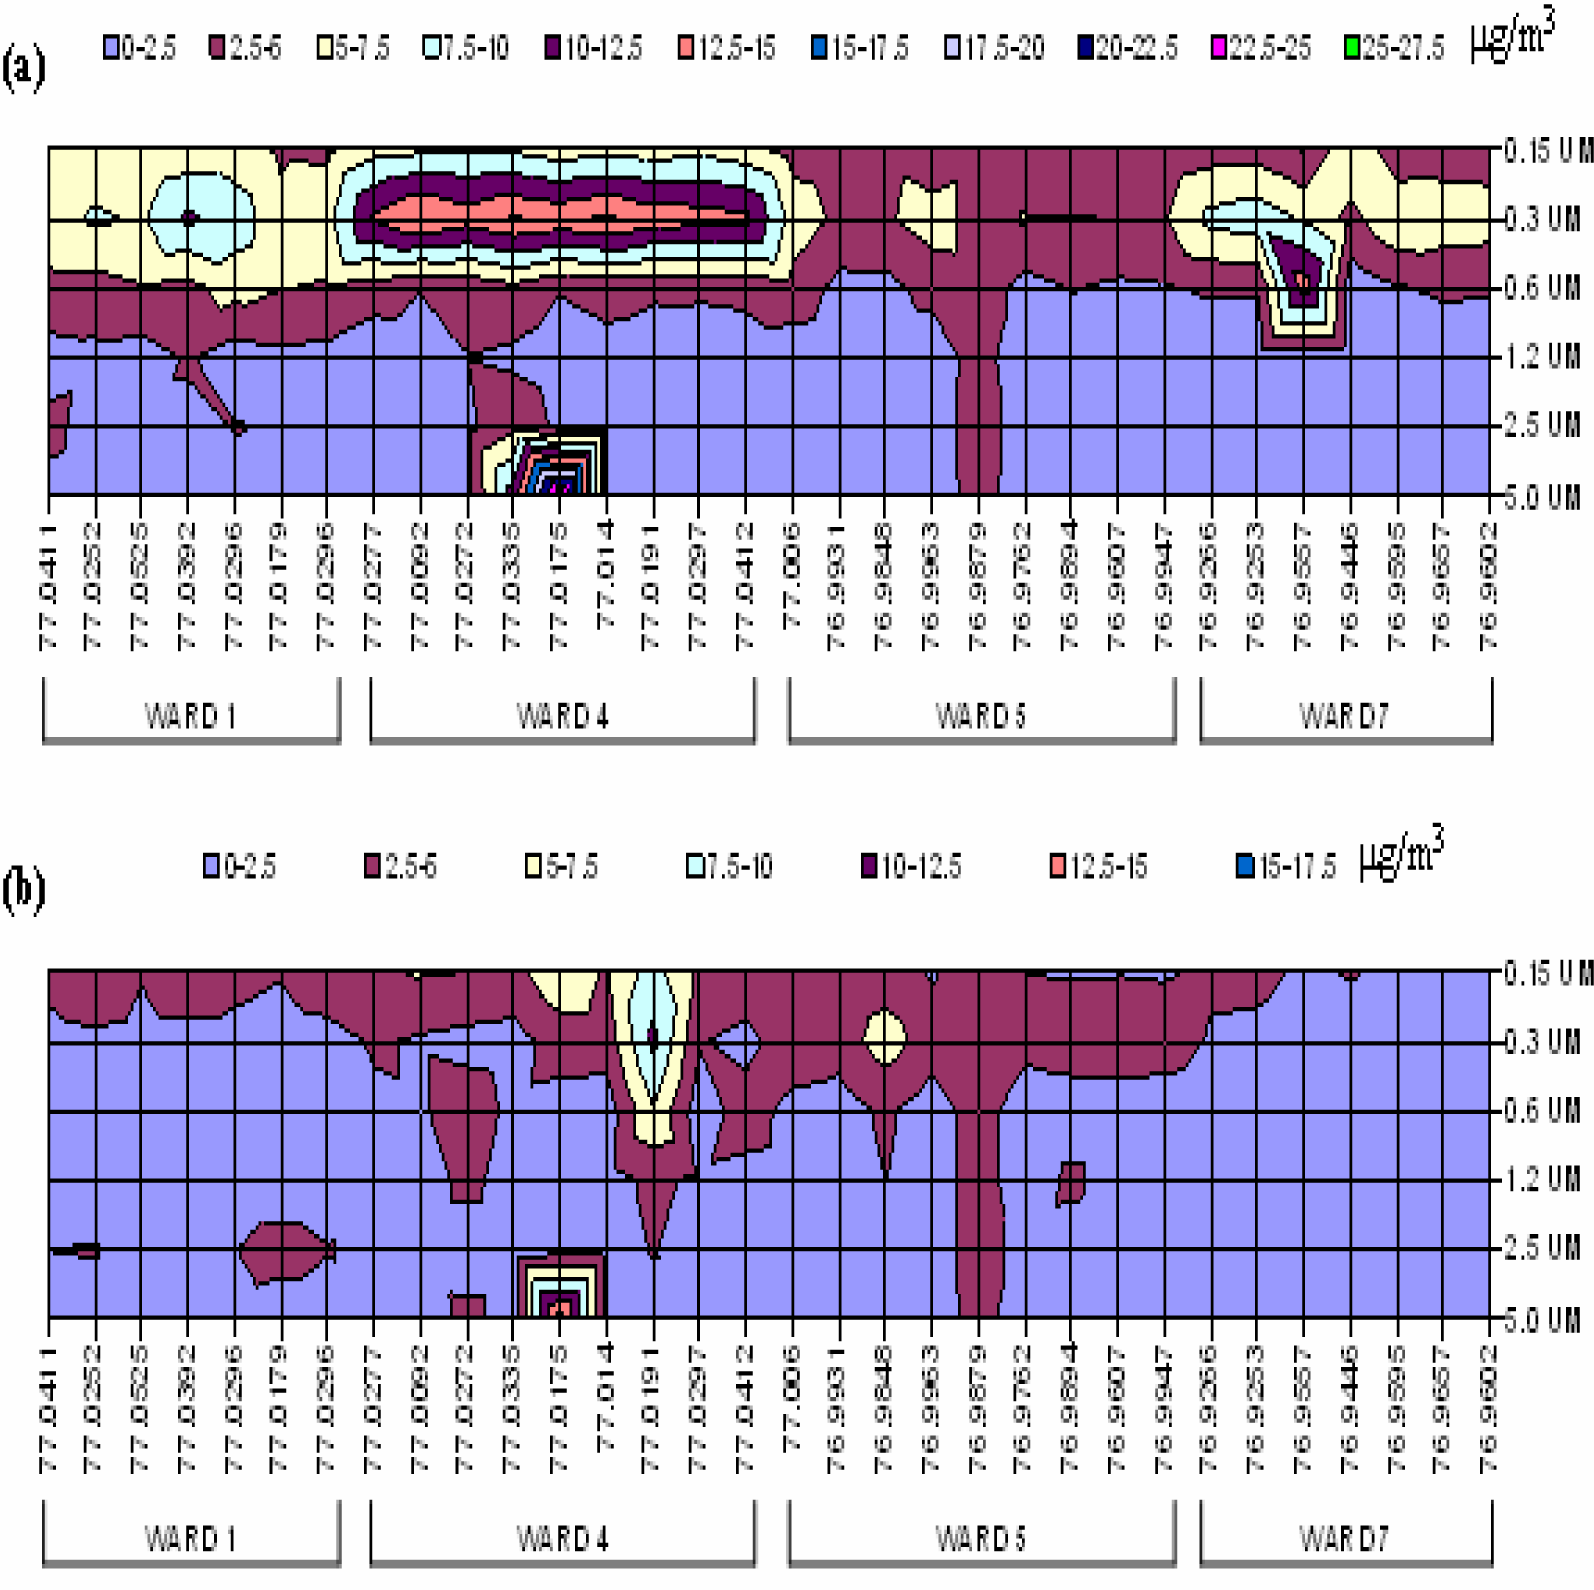
Discussion of Spatially-Temporal Particulate Matter Data
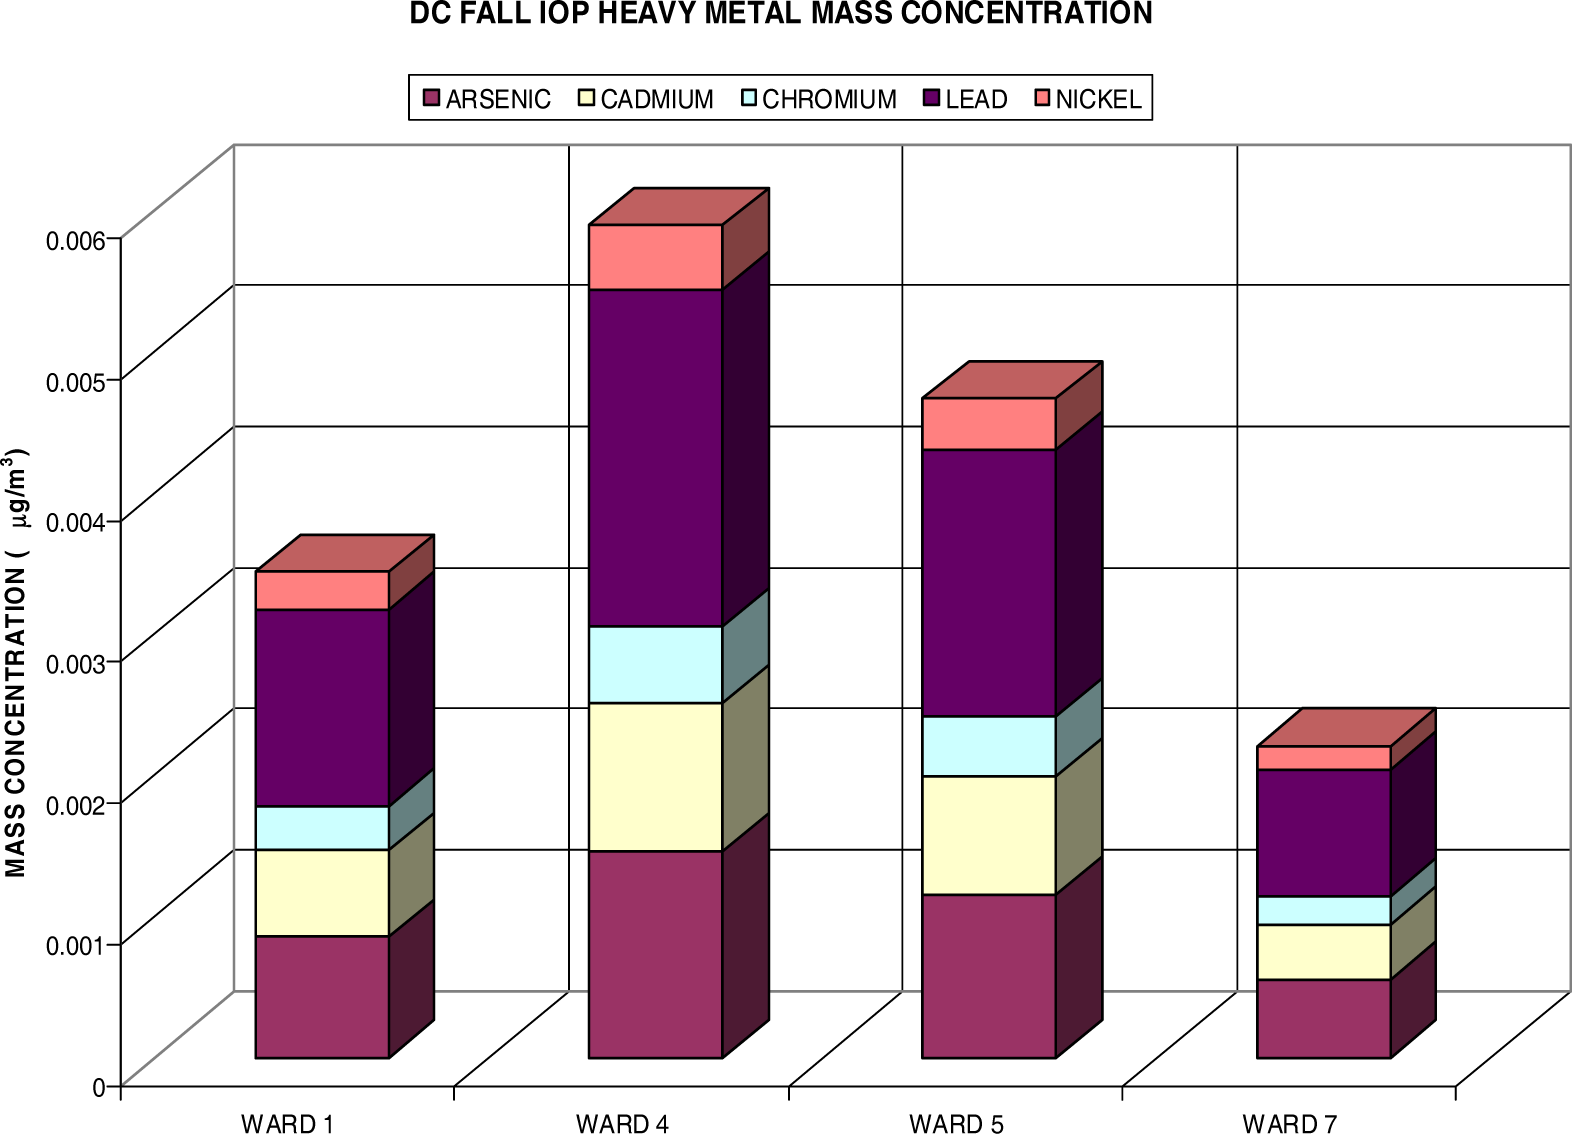
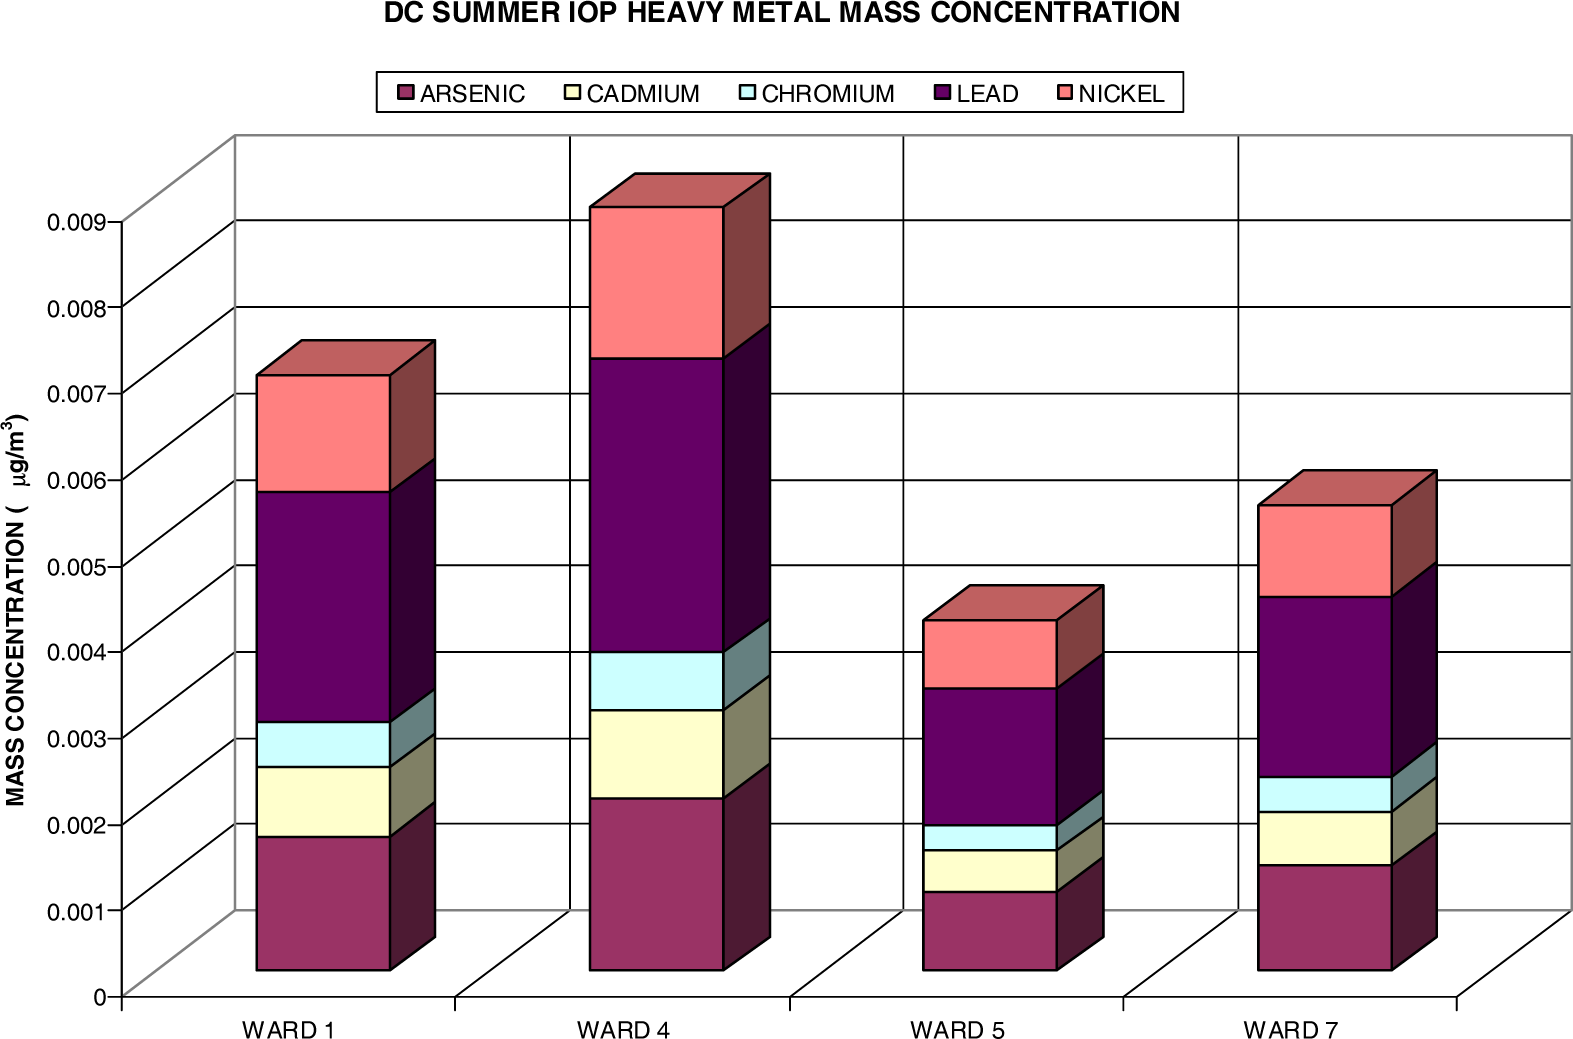
Heavy Metal Analysis via Fine Particulate (PM2.5)
Risk Assessment
| C | contaminant concentration (μg/m3) |
| IR | inhalation rate (m3/day) |
| ED | exposure duration (days) |
| BW | body weight (kg) |
| AT | number of days over which the exposure is averaged (days) |
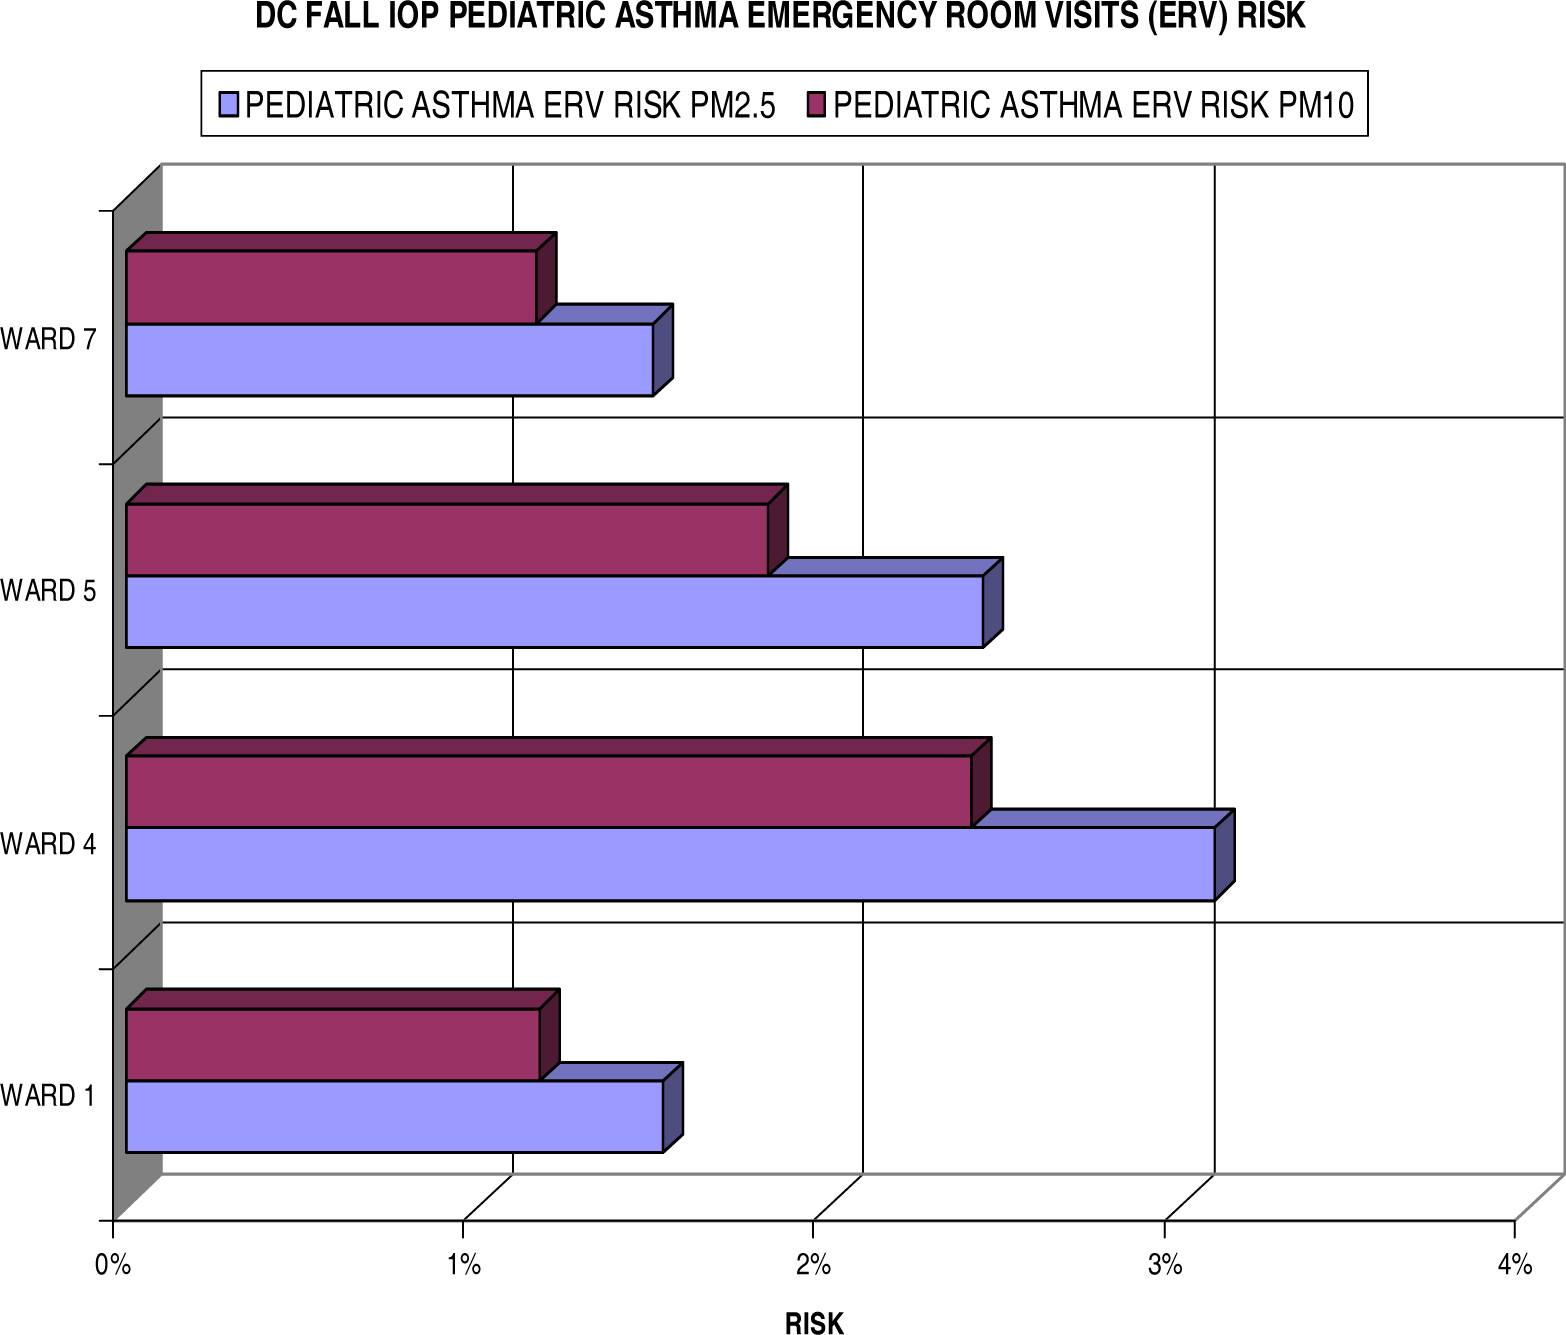
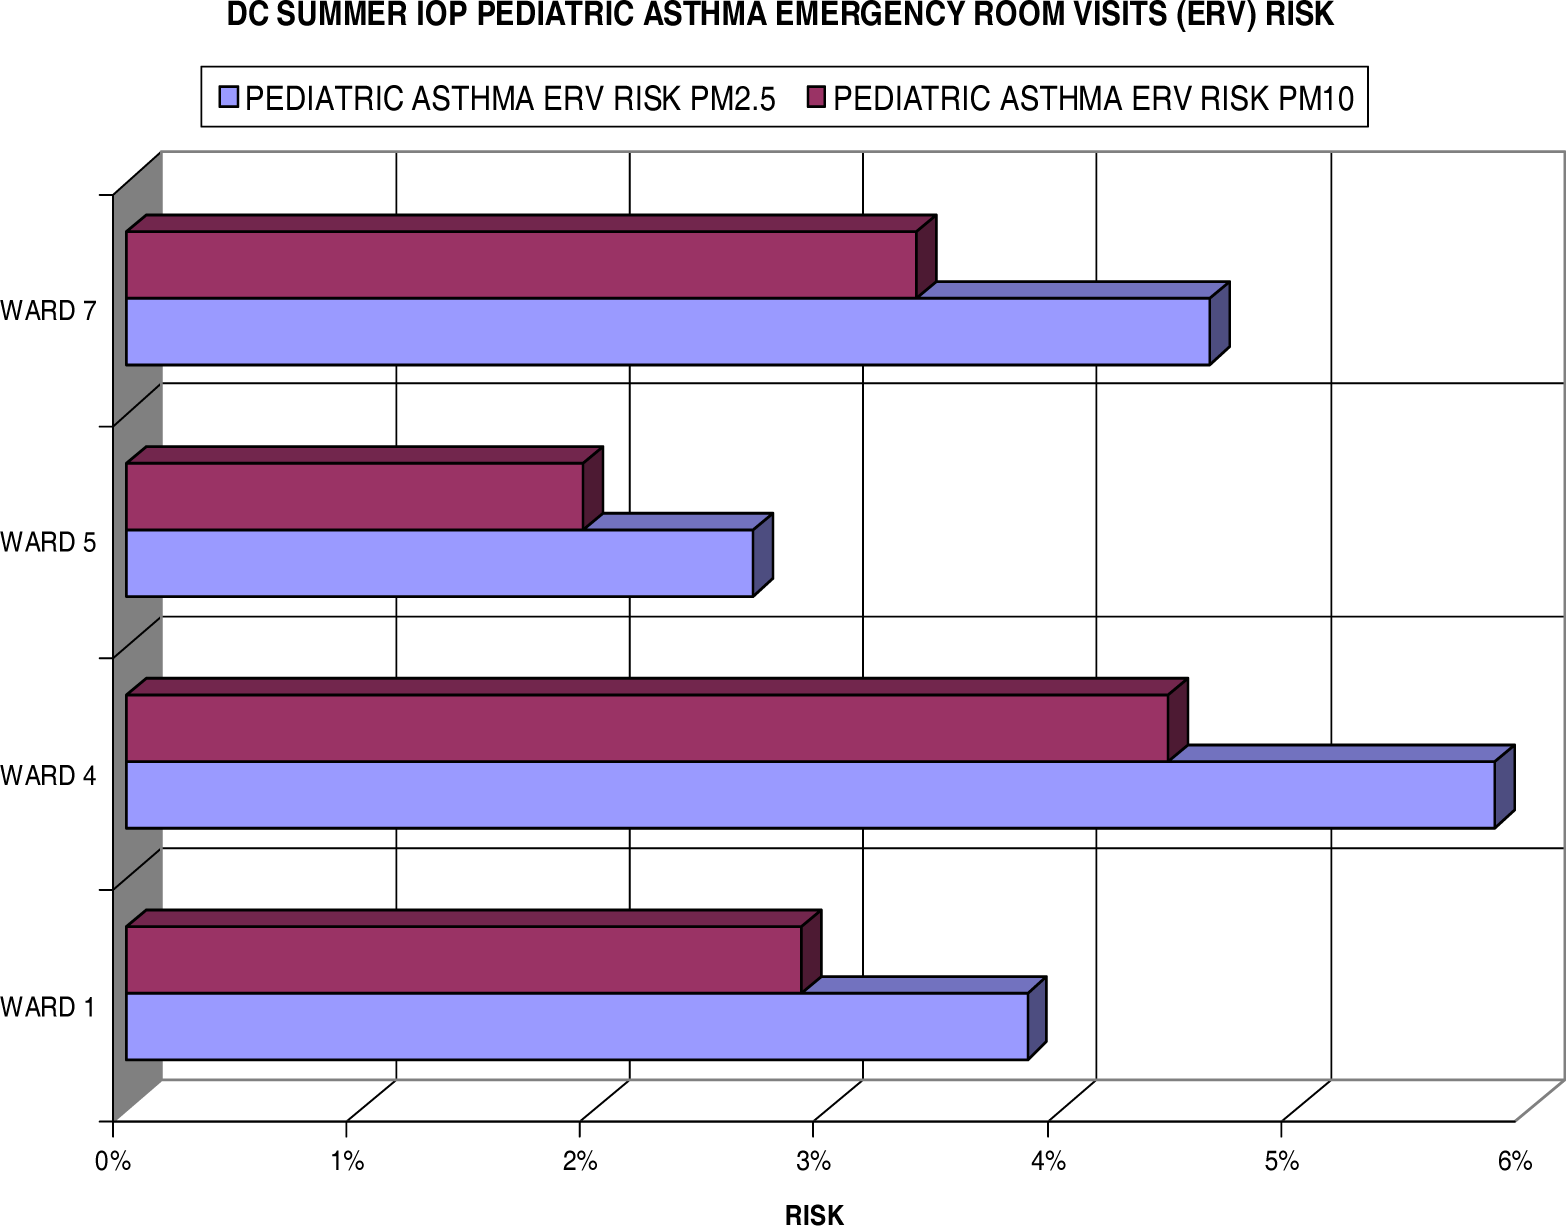
Pediatric Asthma Emergency Room Visits (ERV) Risks
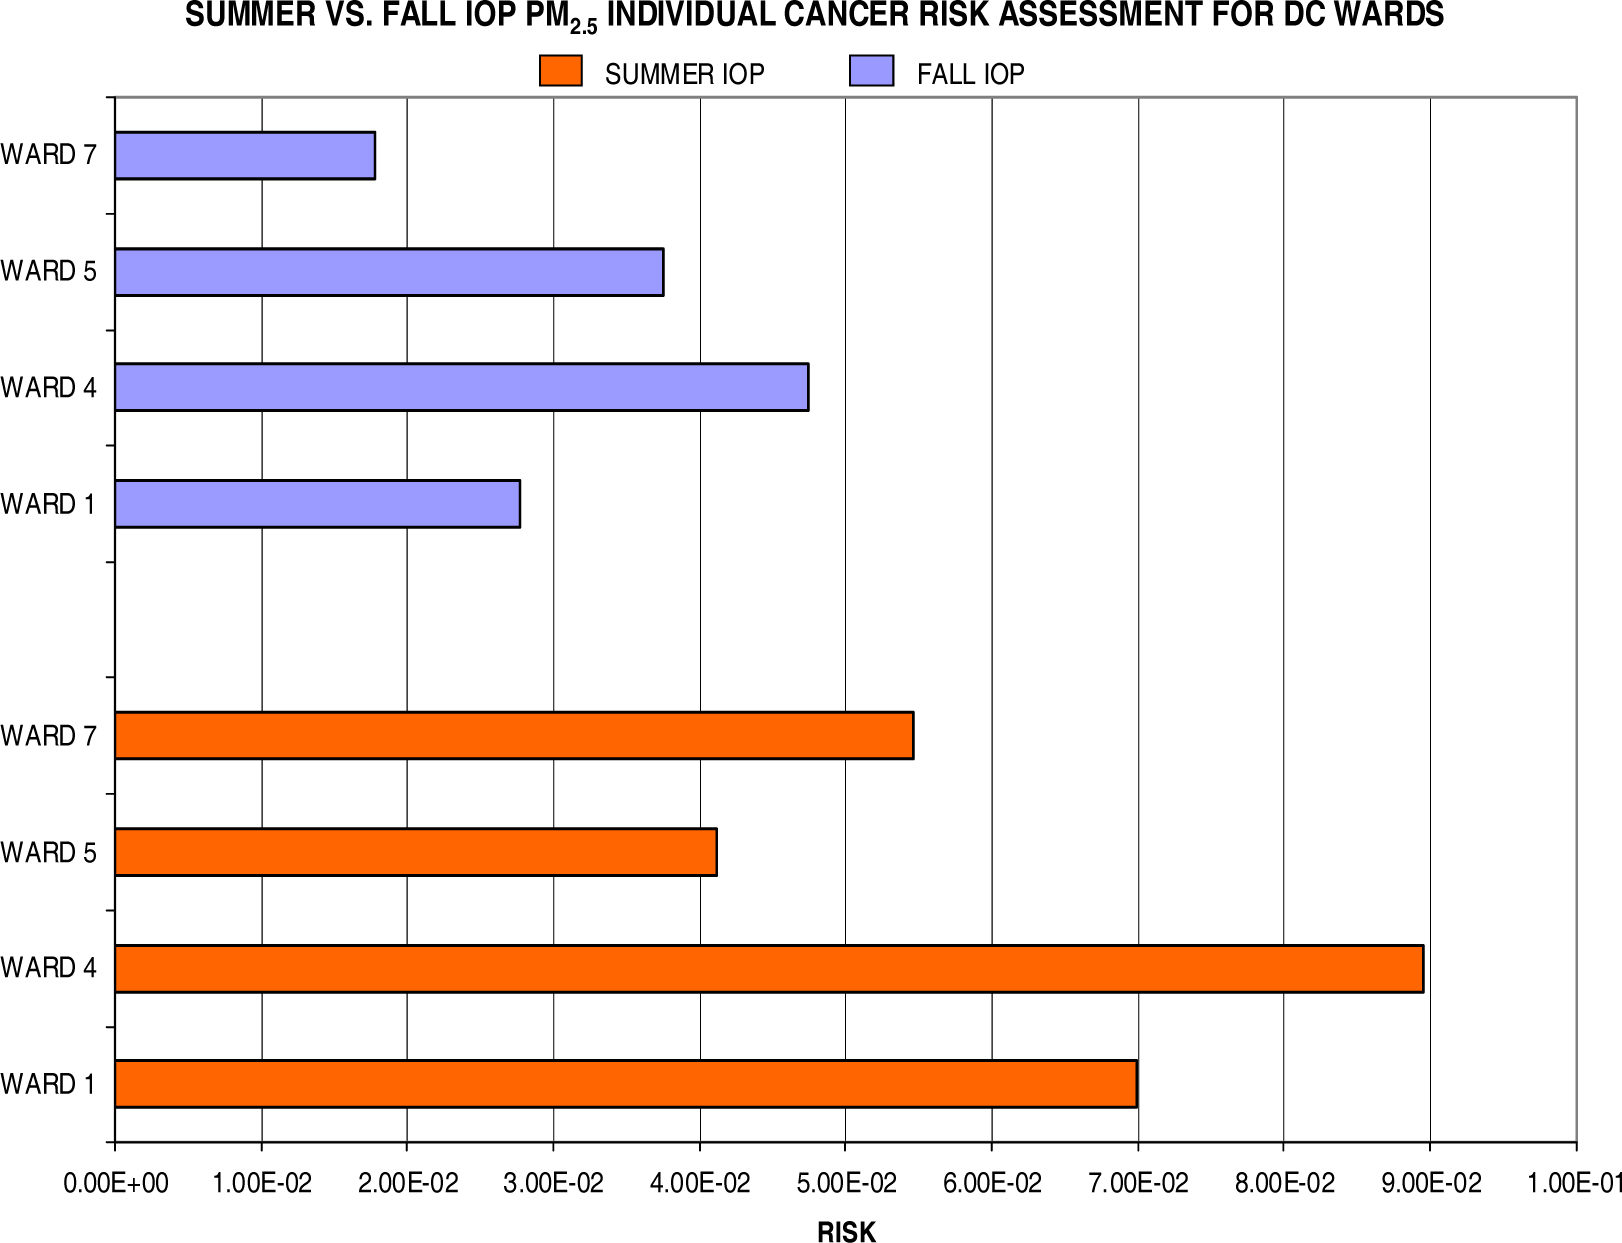
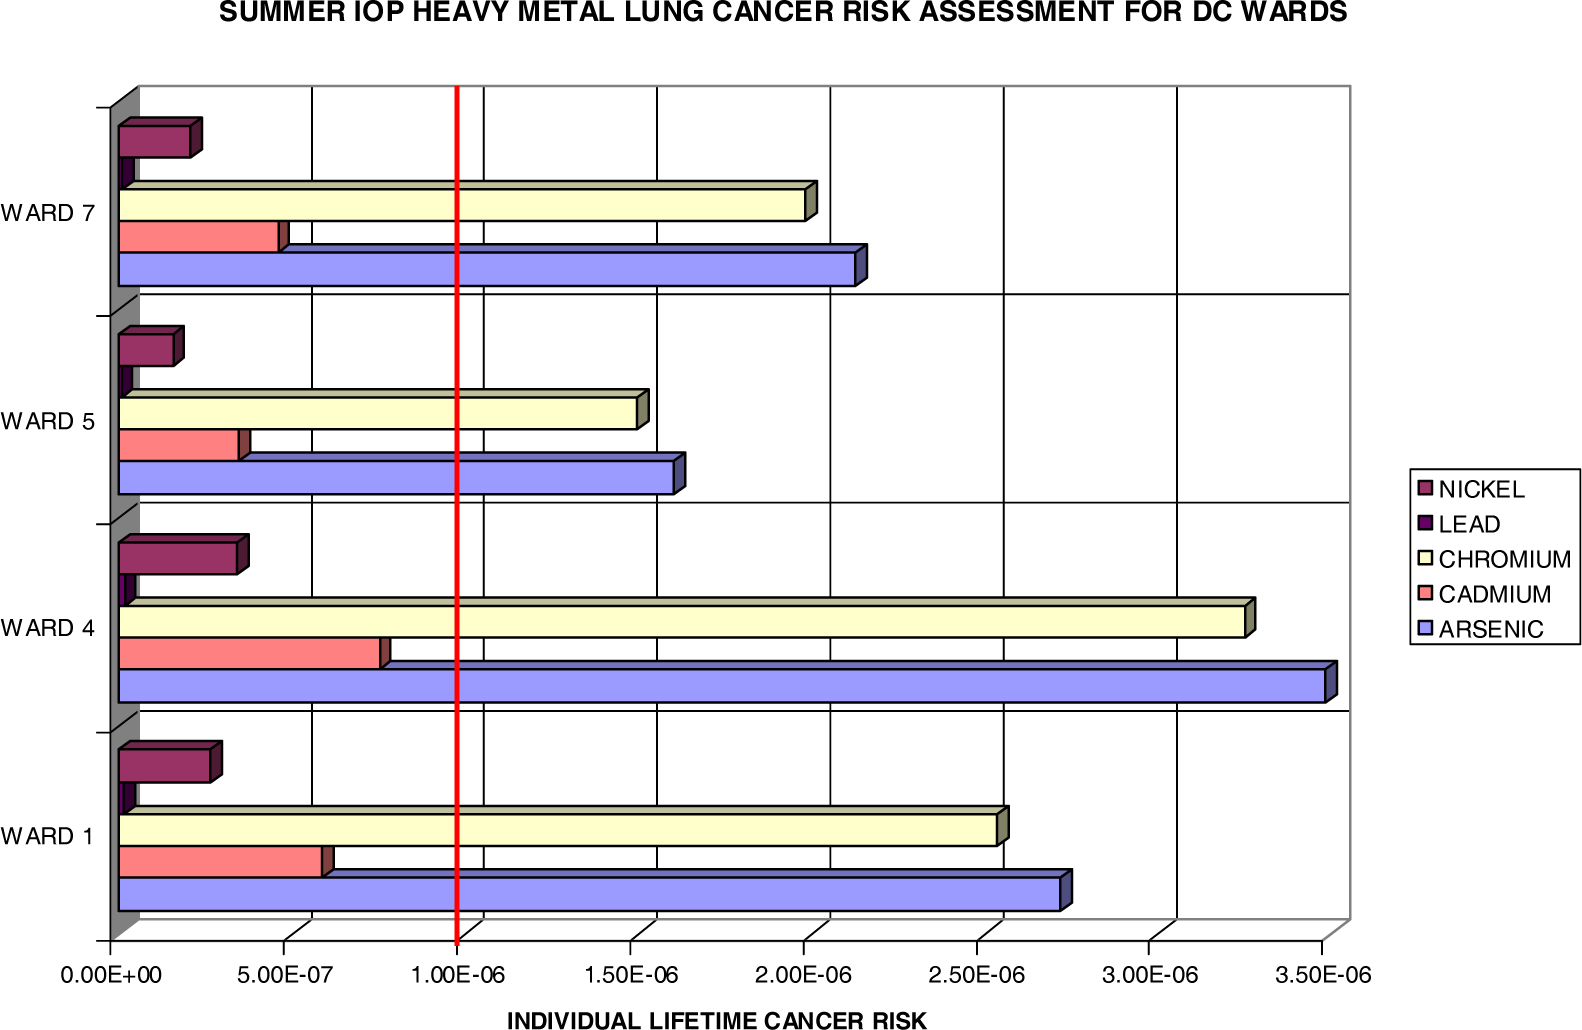
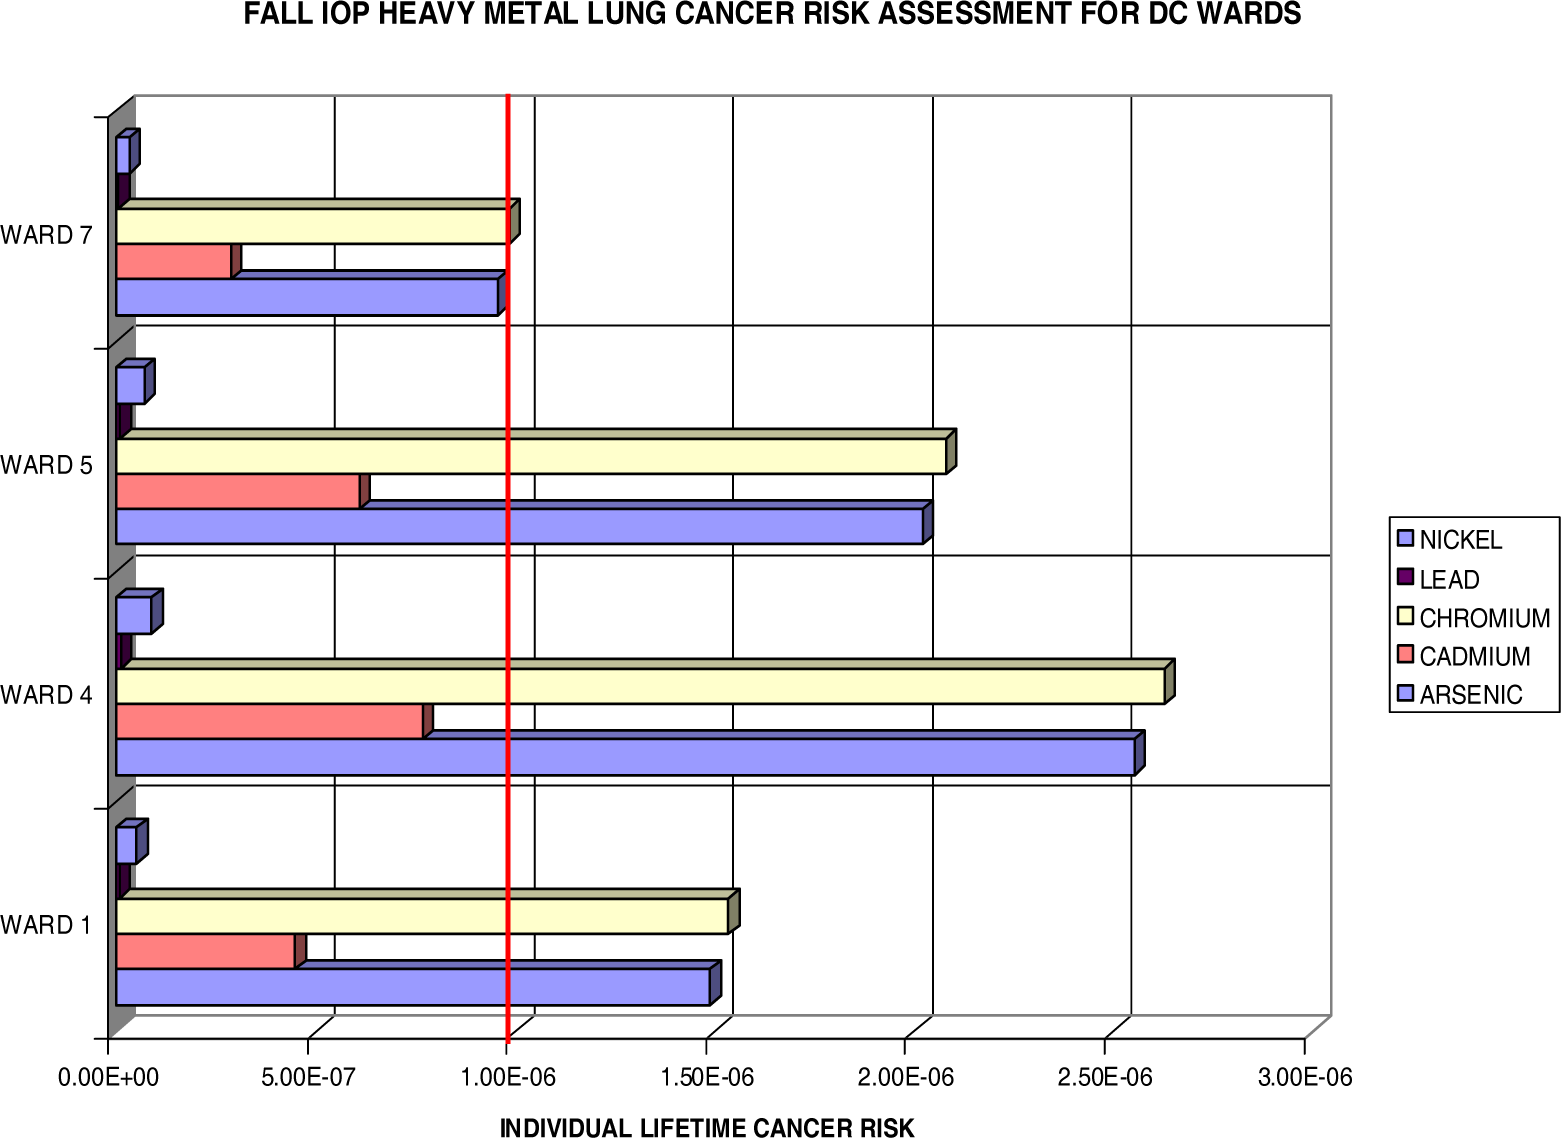
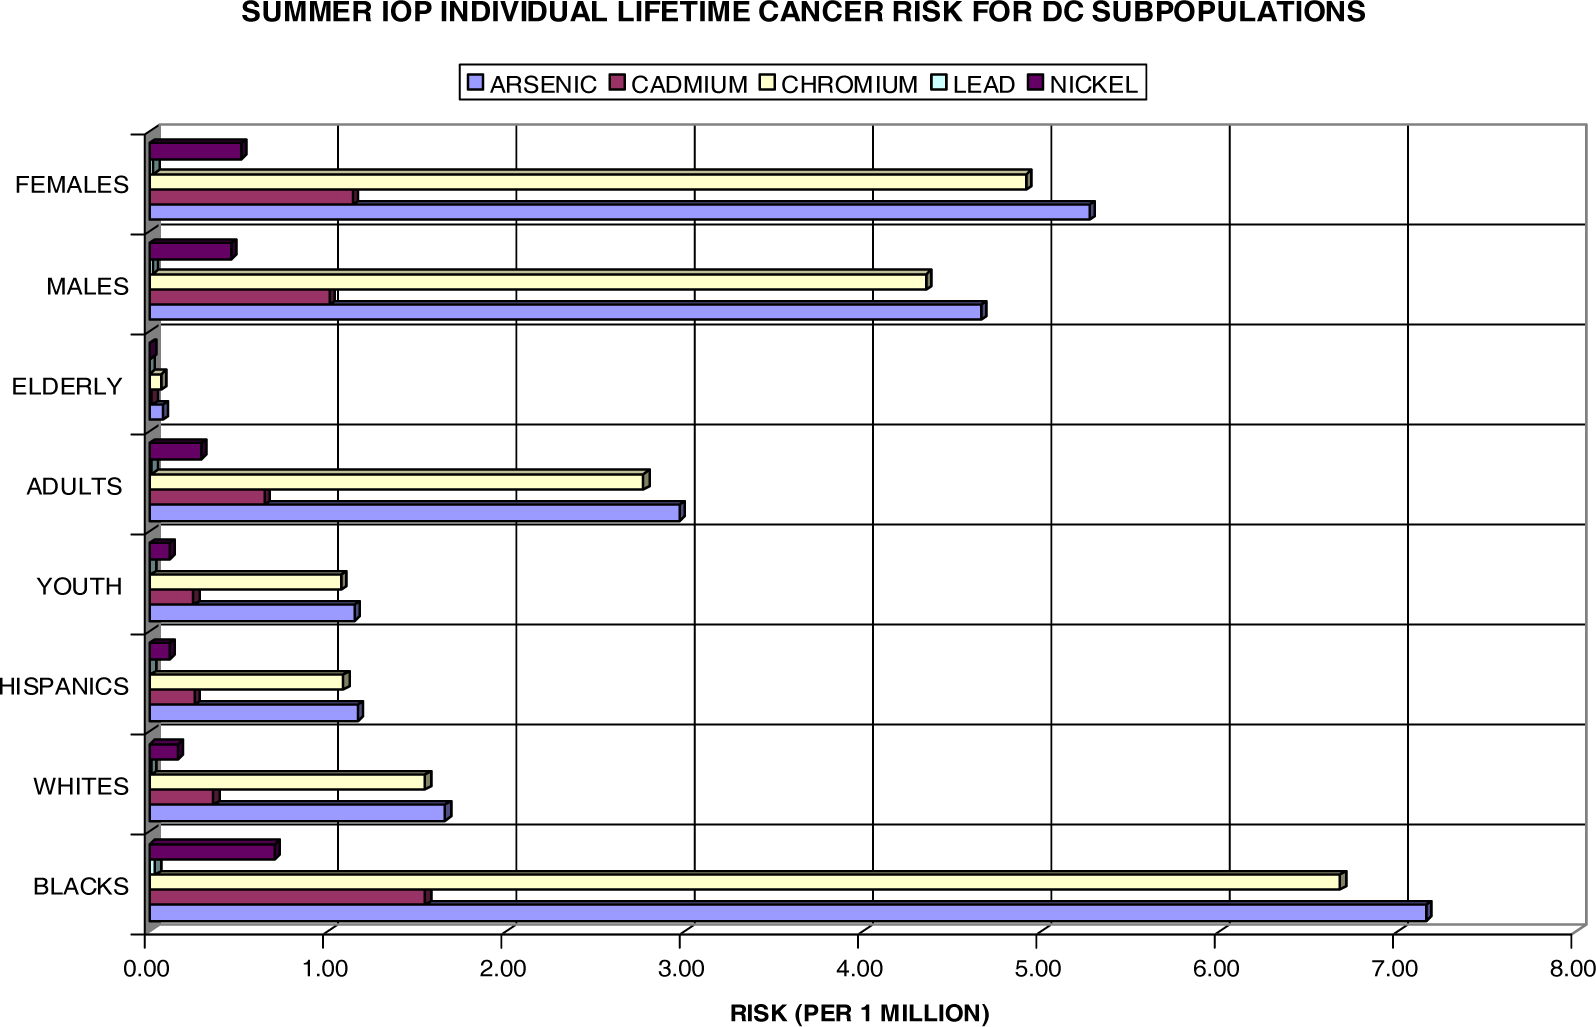
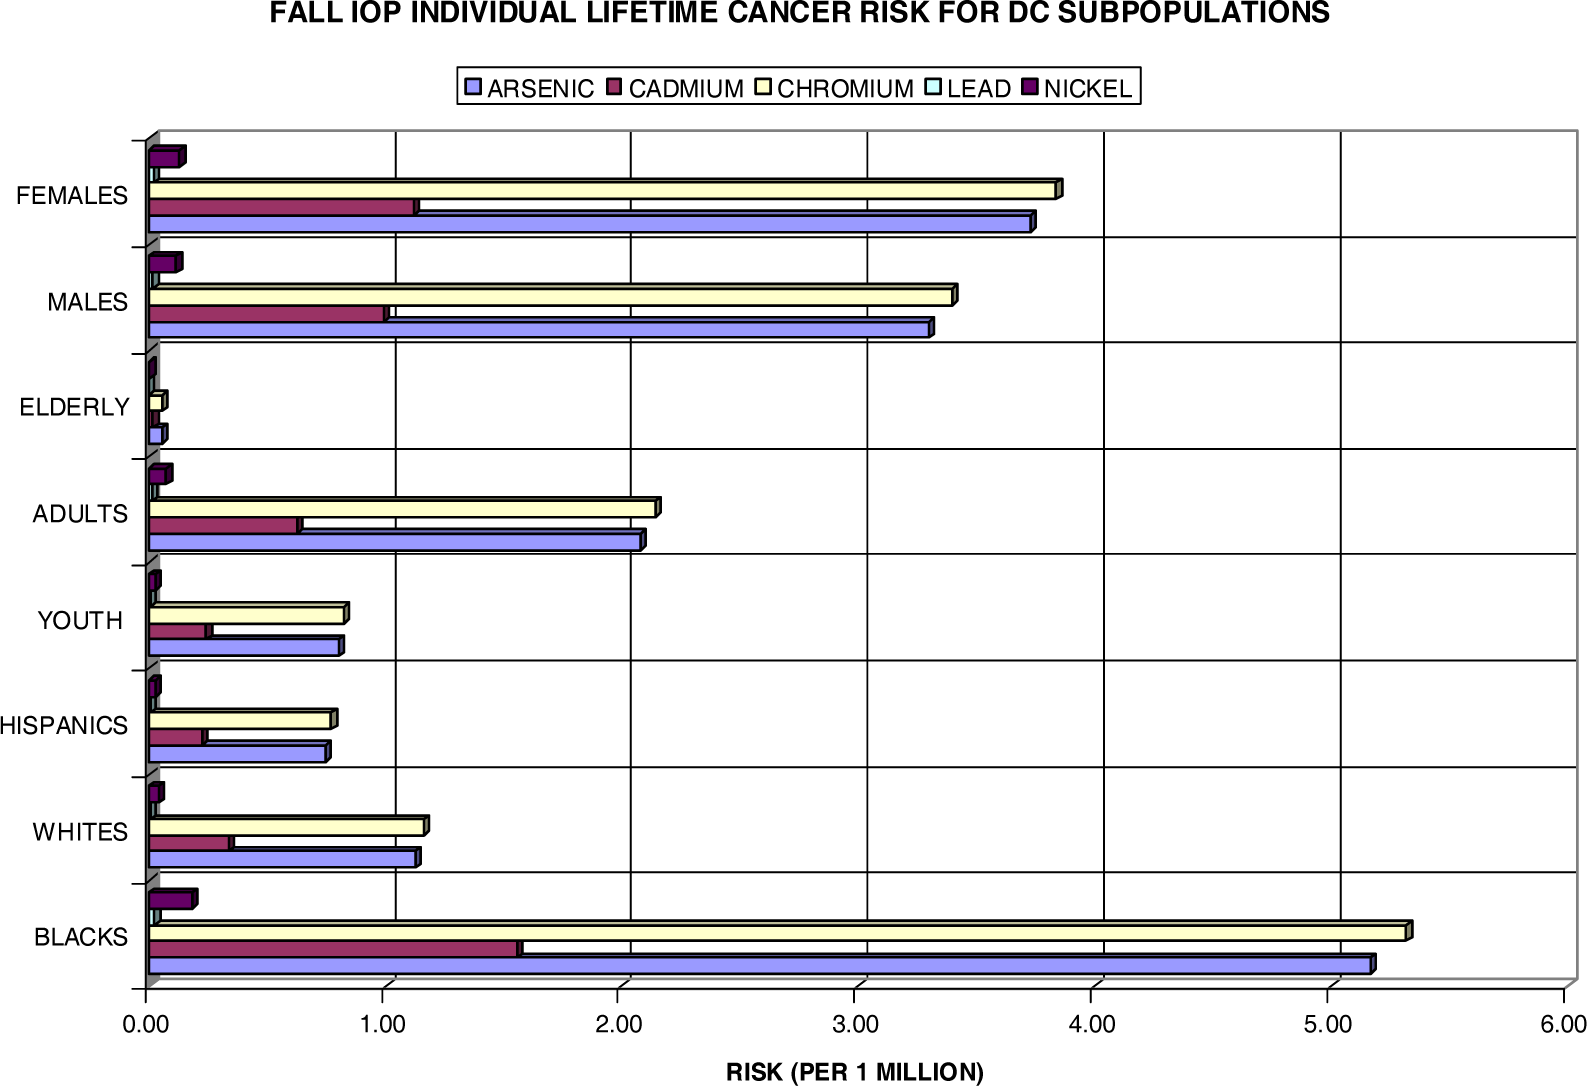
Lung Cancer Risks
- ▪ For exposures before 2 years of age (spanning a 2 year interval from birth up until child’s second birthday), there is a 10-fold ADAF
- ▪ For exposures between 2 and 15 years of age (spanning a 14 year period from a child’s second birthday up until their sixteenth birthday), there is a 3-fold ADAF
- ▪ For exposures between 16 and up, no adjustments are needed
| Ric | 2.87 × 10⁻⁶ or 2.9 per 1 million |
Conclusion


| Ward | Total Pop | Black Pop | White Pop | Hispanic Pop | Youth (<18) | Adult (18–64) | Elder (>64) | Male Pop | Female Pop |
|---|---|---|---|---|---|---|---|---|---|
| Ward 1 | 73364 | 33527 | 23256 | 18121 | 13132 | 54582 | 5649 | 36861 | 36503 |
| Ward 4 | 74092 | 52383 | 13114 | 9262 | 15707 | 45640 | 12669 | 34454 | 39638 |
| Ward 5 | 72527 | 62880 | 6817 | 1886 | 15303 | 44314 | 12909 | 33840 | 38687 |
| Ward 7 | 70540 | 68282 | 987 | 635 | 19398 | 41300 | 9875 | 30988 | 39552 |
| Total | 290523 | 217072 | 44174 | 29904 | 63540 | 185836 | 41102 | 136143 | 154380 |
| Summer IOP
| ||||
|---|---|---|---|---|
| Individuals at Risk for Pediatric Asthma ERV Visits
| ||||
| Ward 1 | Ward 4 | Ward 5 | Ward 7 | |
| PM2.5 | 504 | 914 | 408 | 894 |
| PM10 | 377 | 696 | 298 | 652 |
| Fall IOP
| ||||
|---|---|---|---|---|
| Individuals at Risk for Pediatric Asthma ERV Visits
| ||||
| Ward 1 | Ward 4 | Ward 5 | Ward 7 | |
| PM2.5 | 199 | 484 | 372 | 291 |
| PM10 | 153 | 377 | 278 | 226 |
| Pollutant | Unit Risk (Per μg/m3) |
|---|---|
| PM2.5 | 0.008 |
| Arsenic | 0.0043 |
| Cadmium | 0.0018 |
| Chromium | 0.012 |
| Lead | 0.000012 |
| Nickel | 0.00048 |
| Summer IOP | ||||||||
|---|---|---|---|---|---|---|---|---|
| Subpopulation Lifetime Excess Cancer Cases
| ||||||||
| Blacks | Whites | Hispanics | Youth | Adults | Elderly | Males | Females | |
| Arsenic | 1.554 | 0.073 | 0.035 | 0.073 | 0.552 | 0.003 | 0.635 | 0.814 |
| Cadmium | 0.336 | 0.016 | 0.008 | 0.016 | 0.119 | 0.001 | 0.137 | 0.176 |
| Chromium | 1.449 | 0.068 | 0.033 | 0.068 | 0.515 | 0.003 | 0.592 | 0.759 |
| Lead | 0.007 | 0.000 | 0.000 | 0.000 | 0.003 | 0.000 | 0.003 | 0.004 |
| Nickel | 0.152 | 0.007 | 0.003 | 0.007 | 0.054 | 0.000 | 0.062 | 0.079 |
| HM Total | 3.498 | 0.165 | 0.079 | 0.165 | 1.243 | 0.007 | 1.430 | 1.833 |
| Fall IOP | ||||||||
|---|---|---|---|---|---|---|---|---|
| Subpopulation Lifetime Excess Cancer Cases
| ||||||||
| Blacks | Whites | Hispanics | Youth | Adults | Elderly | Males | Females | |
| Arsenic | 1.121 | 0.050 | 0.022 | 0.051 | 0.386 | 0.002 | 0.449 | 0.575 |
| Cadmium | 0.337 | 0.015 | 0.007 | 0.015 | 0.116 | 0.001 | 0.135 | 0.173 |
| Chromium | 1.154 | 0.051 | 0.023 | 0.052 | 0.398 | 0.002 | 0.462 | 0.592 |
| Lead | 0.005 | 0.000 | 0.000 | 0.000 | 0.002 | 0.000 | 0.002 | 0.003 |
| Nickel | 0.039 | 0.002 | 0.001 | 0.002 | 0.013 | 0.000 | 0.016 | 0.020 |
| HM Total | 2.657 | 0.118 | 0.053 | 0.121 | 0.916 | 0.005 | 1.064 | 1.363 |
Acknowledgments
References
- Bhatnagar, Aruni. Cardiovascular pathophysiology of environmental pollutants. American Journal of Physiology - Heart and Circulatory Physiology 2004, 286, H479–H485. [Google Scholar]
- Cohen, Aaron J. Outdoor air pollution and lung cancer. Environmental Health Perspectives 2000, 108, 743–750. [Google Scholar]
- Cerveny, RS; Balling, RC, Jr. Weekly Cycles of Air Pollutants, Precipitation and Tropical Cyclones in the Coastal NW Atlantic Region. Nature 1998, 394, 561–563. [Google Scholar]
- DC Department of Public Health. Vital Statistics Data Sheet, Washington, DC, 1995.
- DC Department of Public Health. Vital Statistics Data Sheet, Washington, DC, 1996.
- DC Department of Public Health. Vital Statistics Data Sheet, Washington, DC 1997.
- DC Department of Public Health. Vital Statistics Data Sheet, Washington, DC 1998.
- DC Department of Public Health. Vital Statistics Data Sheet, Washington, DC 1999.
- DC Department of Public Health. Vital Statistics Data Sheet, Washington, DC 2000.
- 2000. DC Office of Planning/State Data Center,: Population by Single Race by Ward. [Web site] [Last accessed 02/15/2005]; available at http://planning.dc.gov/planning/cwp/view,a,1282,q,569299.asp.
- Dockery, DW; Pope, CA; Xu, XP; Spengler, JD; Ware, JH; Fay, ME; Ferris, BG; Speizer, FG. An association between air-pollution and mortality in 6 United States cities. New England Journal of Medicine 1993, 329, 1753–1759. [Google Scholar]
- Leaderer, Brian P; Naeher, Luke; Thomas, Jankun; Balenger, Kathleen; Holford, Theodore R; Toth, Cindy; Sullivan, Jim; Wolfson, Jack M; Koutrakis, Petros. Indoor, Outdoor, and Regional Summer and Winter Concentrations of PM10, PM2.5, SO42−, H+, NH4+, NO3−, NH3, and Nitrous Acid in Homes with and without Kerosene Space Heaters. Environmental Health Perspectives 1999, 107, 223–231. [Google Scholar]
- Levy, Johnathan I; Greco, Susan L; Spengler, John D. The importance of population susceptibility for air pollution risk assessment: A case study of power plants near Washington, DC. Environmental Health Perspectives 2002, 110, 1253–1260. [Google Scholar]
- Norris, G; YoungPong, SN; Koenig, JQ; Larson, TV; Sheppard, L; Stout, JW. An association between fine particles and asthma emergency department visits for children in Seattle. Environmental Health Perspectives 1999, 107, 489–493. [Google Scholar]
- Pope, C; Arden, III. Epidemiology of Fine Particulate Air Pollution and Human Health: Biologic Mechanisms and Who’s at Risk? Environmental Health Perspectives 2000, 108, 713–723. [Google Scholar]
- Pope, C; Arden, III; Burnett, Richard T; Thun, Michael J; Calle, Eugenia E; Krewski, Daniel; Ito, Kazuhiko; Thurston, George D. Lung cancer, cardiopulmonary mortality, and long-term exposure to fine particulate air pollution. Journal of the American Medical Association 2002, 287, 1132–1141. [Google Scholar]
- Protonotarios, V; Petsas, N; Moutsatsou, A. Levels and composition of atmospheric particulates (PM10) in a mining-industrial site in the city of Lavrion, Greece. Journal of the Air and Waste Management Association 2002, 52, 1263–1273. [Google Scholar]
- Raskin, Lauren. Breathing easy: Solutions in pediatric asthma. Maternal and Child Health Library. [Press Release]. [Web site]. Cited February. 2000. available at http://www.mchlibrary.info/documents/asthma.html.
- Sanockij, IV (Ed.) Methods for Determining Toxicity and Hazards of Chemicals. In Medicina (Moscow); 1970; pp. 62–63, (in Russian, as cited in Principles and Methods for Evaluating the Toxicity of Chemicals, Part I. World Health Organization, Geneva, 1971).
- Seybold, MG; Smith, CD; Krask, DJ; Woodman, MF; Allen, GA; Castro, MS; McKnight, JM. Paper No. 48.. “Monitoring Interstate Pollutant Transport from the Western Maryland Piney Run Site: Objectives, Design, and Demonstration”. Regional and Global Perspectives on Haze: Causes, Consequences and Controversies – Visibility Specialty Conference, Air & Waste Management Association, Asheville, NC, October 25–29, 2004.
- Tolbert, P; Mulholland, J; MacIntosh, D; Xu, F; Daniels, D; Devine, O; Carlin, B; Klein, M; Dorley, J; Butler, A; Nordenberg, D; Frumkin, H; Ryan, PB; White, M. Air pollution and pediatric emergency room visits for asthma in Atlanta. American Journal of Epidemiology 2000, 151, 798–810. [Google Scholar]
- Toxicology Excellence for Risk Assessment (TERA). Risk assessment of airborne chemical emissions from Cinergy Electric generating stations; Prepared for Cinergy Services, Inc., April 2002; pp. 1–17. [Google Scholar]
- U.S. Environmental Protection Agency. Exposure Factors Handbook, EPA/600/P-95/002Fa. August 1997.
- Zanobetti, A; Schwartz, J; Gold, DR. Are the sensitive subgroups for the health effects of airborne particles? Environmental Health Perspectives 2000, 108, 841–845. [Google Scholar]
© 2006 by the authors; licensee MDPI, Basel, Switzerland This article is an open access article distributed under the terms and conditions of the Creative Commons Attribution license (http://creativecommons.org/licenses/by/3.0/).
Share and Cite
Greene, N.A.; Morris, V.R. Assessment of Public Health Risks Associated with Atmospheric Exposure to PM2.5 in Washington, DC, USA. Int. J. Environ. Res. Public Health 2006, 3, 86-97. https://doi.org/10.3390/ijerph2006030010
Greene NA, Morris VR. Assessment of Public Health Risks Associated with Atmospheric Exposure to PM2.5 in Washington, DC, USA. International Journal of Environmental Research and Public Health. 2006; 3(1):86-97. https://doi.org/10.3390/ijerph2006030010
Chicago/Turabian StyleGreene, Natasha A., and Vernon R. Morris. 2006. "Assessment of Public Health Risks Associated with Atmospheric Exposure to PM2.5 in Washington, DC, USA" International Journal of Environmental Research and Public Health 3, no. 1: 86-97. https://doi.org/10.3390/ijerph2006030010
APA StyleGreene, N. A., & Morris, V. R. (2006). Assessment of Public Health Risks Associated with Atmospheric Exposure to PM2.5 in Washington, DC, USA. International Journal of Environmental Research and Public Health, 3(1), 86-97. https://doi.org/10.3390/ijerph2006030010