Article

Heat Risk Perception and Vulnerability in Puerto Rico: Insights for Climate Adaptation in the Caribbean

by
Brenda Guzman-Colon
1,
Zack Guido
2,
Claudia P. Amaya-Ardila
3,
Laura T. Cabrera-Rivera
1 and
Pablo A. Méndez-Lázaro
1,4,*
1
Department of Environmental Health, Graduate School of Public Health, University of Puerto Rico-Medical Sciences Campus, San Juan 00936-5067, Puerto Rico
2
Arizona Institute for Resilience, University of Arizona, Tucson, AZ 85721, USA
3
Department of Biostatistics, Graduate School of Public Health, University of Puerto Rico-Medical Sciences Campus, San Juan 00936-5067, Puerto Rico
4
Cancer Biology Division and Environmental Translational Cancer Program, Comprehensive Cancer Center, San Juan 00936-5067, Puerto Rico
*
Author to whom correspondence should be addressed.
Int. J. Environ. Res. Public Health 2025, 22(8), 1197; https://doi.org/10.3390/ijerph22081197
Submission received: 22 May 2025 / Revised: 2 July 2025 / Accepted: 3 July 2025 / Published: 31 July 2025

Abstract

Extreme heat poses growing health risks in tropical regions, yet public perception of this threat remains understudied in the Caribbean. This study examines how residents in Puerto Rico perceived heat-related health risks and how these perceptions relate to vulnerability and protective behaviors during the extreme heat events of the summer of 2020. We conducted a cross-sectional telephone survey of 500 adults across metropolitan and non-metropolitan areas of Puerto Rico, using stratified probability sampling. The questionnaire assessed heat risk perception, sociodemographic characteristics, health status, prior heat exposure, and heat-related behaviors. While most participants expressed concern about climate change and high temperatures, fewer than half perceived heat as a high level of personal health risk. Higher levels of risk perception were significantly associated with being male, aged 50–64, unemployed, and in fair health, having multiple chronic conditions, and prior experience with heat-related symptoms. Those with symptoms were nearly five times more likely to report high levels of risk perception (OR = 4.94, 95% CI: 2.93–8.34). In contrast, older adults (65+), despite their higher level of vulnerability, reported lower levels of risk perception and fewer symptoms. Nighttime heat exposure was widespread and strongly associated with heat-related symptoms. Common coping strategies included the use of fans and air conditioning, though economic constraints and infrastructure instability limited access. The findings highlight the disparity between actual and perceived vulnerability, particularly among older adults. Public health strategies should focus on risk communication tailored to vulnerable groups and address barriers to heat adaptation. Strengthening heat resilience in Puerto Rico requires improved infrastructure, equitable access to cooling, and targeted outreach.

1. Introduction

Exposure to elevated temperatures can lead to heat-related illnesses, exacerbate existing health conditions, negatively impact worker productivity, and hinder physical activity capacity. Extreme heat poses significant health risks, including increased mortality and morbidity, especially in cardiovascular and respiratory diseases [1,2,3,4,5,6,7,8].
Global evidence indicates increased vulnerability and exposure of populations to heatwaves [9]. While elevated temperatures affect all individuals, certain population groups exhibit increased vulnerability due to specific risk factors and social determinants of health. Groups at increased risk of heat-related illness or death include adults over 65 years of age, children, people with pre-existing medical conditions, outdoor workers, people living in poverty, and those who are socially isolated [10]. It has also been documented that residents of urban areas exhibit higher risks of heat exposure and health consequences owing to the heat island effect. Social determinants of health, such as income, educational level, social cohesion, housing and living conditions, and minority group status, also influence health risks associated with extreme heat events [8,9,11,12]. These factors often interact, increasing the risk among people with multiple vulnerabilities.
Heat risk perception refers to how people understand and determine their personal risks related to their exposure to high temperatures and their potential impact on health. Heat risk perception varies across populations and is influenced by structural, environmental, personal, and social factors. These factors influence how individuals understand their risk and whether they adopt protective measures to minimize exposure [11]. Outdoor environmental factors include meteorology (e.g., wind speed and direction, sun radiation, temperature, water vapor, and relative humidity) and climate (summer, fall, winter, and spring). Personal factors include thermal comfort, adaptive measures, and health concerns, whereas structural factors include communication systems, barriers to adaptation, and availability of resources [11]. The social factors include sociodemographic aspects and social support. Socioeconomic status, educational attainment, and health status are significant determinants of risk perception, with those with low income, higher education, and health problems generally having a higher level of risk perception [11,13,14,15,16,17,18]. Demographic factors, such as age, gender, and ethnicity, also impact perception, although these may vary by culture and context [4,13,18,19]. Occupation, especially for those who work outdoors, may increase risk perception [4,11,16,17]. Additionally, social cohesion and previous experiences with heat-related problems tended to increase awareness and perception of risk [11].
Although studies have been conducted on heatwave risk perception and adaptive behaviors, there are still significant gaps in knowledge on this topic, especially regarding the social and cultural factors that influence how people perceive and respond to extreme heat risks. There are also a few studies on heat risk perception in specific demographic and geographic contexts, with most studies concentrated in the United States, China, and Australia [11]. There is a need to expand our knowledge on this topic, especially in vulnerable populations, rural areas, and other regions, to formulate context-specific mitigation and adaptation strategies.
In the Caribbean, research on climate extremes and health implications is limited, with few studies addressing public health readiness and responses to severe weather, food and water security, the direct impact of increasing temperatures, and how the public perceives these effects [20]. In Puerto Rico, while there is a growing interest in climate perception, there remains a significant gap in research specifically focused on the public’s perception of thermal or heat-related risk. This lack of evidence is particularly concerning, given the island’s high vulnerability to extreme heat events and their potential health consequences. Addressing this gap is essential for developing context-specific policies and public health interventions. Understanding how individuals perceive heat-related risks can enhance the effectiveness of heat alert systems, guide resource allocation for cooling infrastructure, and support targeted communication strategies to protect vulnerable populations. Recent studies have suggested that the public is increasingly concerned about climate change, especially in relation to rising temperatures [21,22,23], reinforcing the urgency of advancing research linking heat risk perception to actionable policy responses in Puerto Rico and similar settings across the Caribbean.
Temperatures in Puerto Rico and the Virgin Islands have increased by nearly 2 °F since 1950, with projected warming of up to 7 °F above the historical record in a higher-emission scenario [24]. Extreme heat conditions in the Caribbean have intensified since 1980, with increasing trends in the number of heat-stressed days (>39.9 °C (103.8 °F)) [25]. Since 2000, the number of extremely hot nights has generally been above average, with higher numbers being recorded since 2015 [24]. The urban heat island effect caused temperatures in San Juan to rise faster than those on the rest of the islands [24]. Climatological analyses have identified the August–September–October period as the season with the highest levels of heat stress in the Caribbean. The year 2020 was one of the three warmest years in the region and set temperature records in Cuba, Puerto Rico, Dominica, and Grenada, reflecting an ongoing warming trend since the 1990s [25]. This year, two heatwaves were documented in April and September, which affected the region and exposed the population to unprecedented heat conditions [25].
In a warmer scenario, there are limited studies on climate perception in Puerto Rico. There is a notable absence of research that specifically addresses heat-related health risk perceptions. This gap underscores the need for targeted investigations to enhance our understanding of how climate-related risks impact community health and well-being and to inform the development of effective mitigation policies and programs.
This study aimed to examine the perception of risk, vulnerability, attitudes, and knowledge concerning heat in Puerto Rico during the summer of 2020. This research aims to determine whether individuals with greater vulnerability—due to age, chronic health conditions, unemployment, or lower educational attainment—report higher levels of perceived risks and greater concerns about heat-related health impacts. This analysis was guided by the Health Belief Model (HBM), a widely recognized theoretical framework for understanding how individuals perceive health risks and make decisions to adopt protective behaviors. According to the HBM, individuals are more inclined to take action if they perceive themselves as being susceptible to a health threat, believe that the threat has serious consequences, and are convinced that specific actions can mitigate it [26]. In the context of extreme heat, it is anticipated that individuals′ perception of personal risk, prior experiences with heat-related symptoms, and awareness of available resources will influence both their level of concern and protective behaviors. We hypothesized that individuals with a poor health status, previous experience with heat-related symptoms, or markers of social vulnerability are more likely to perceive high levels of heat-related health risks.

2. Materials and Methods
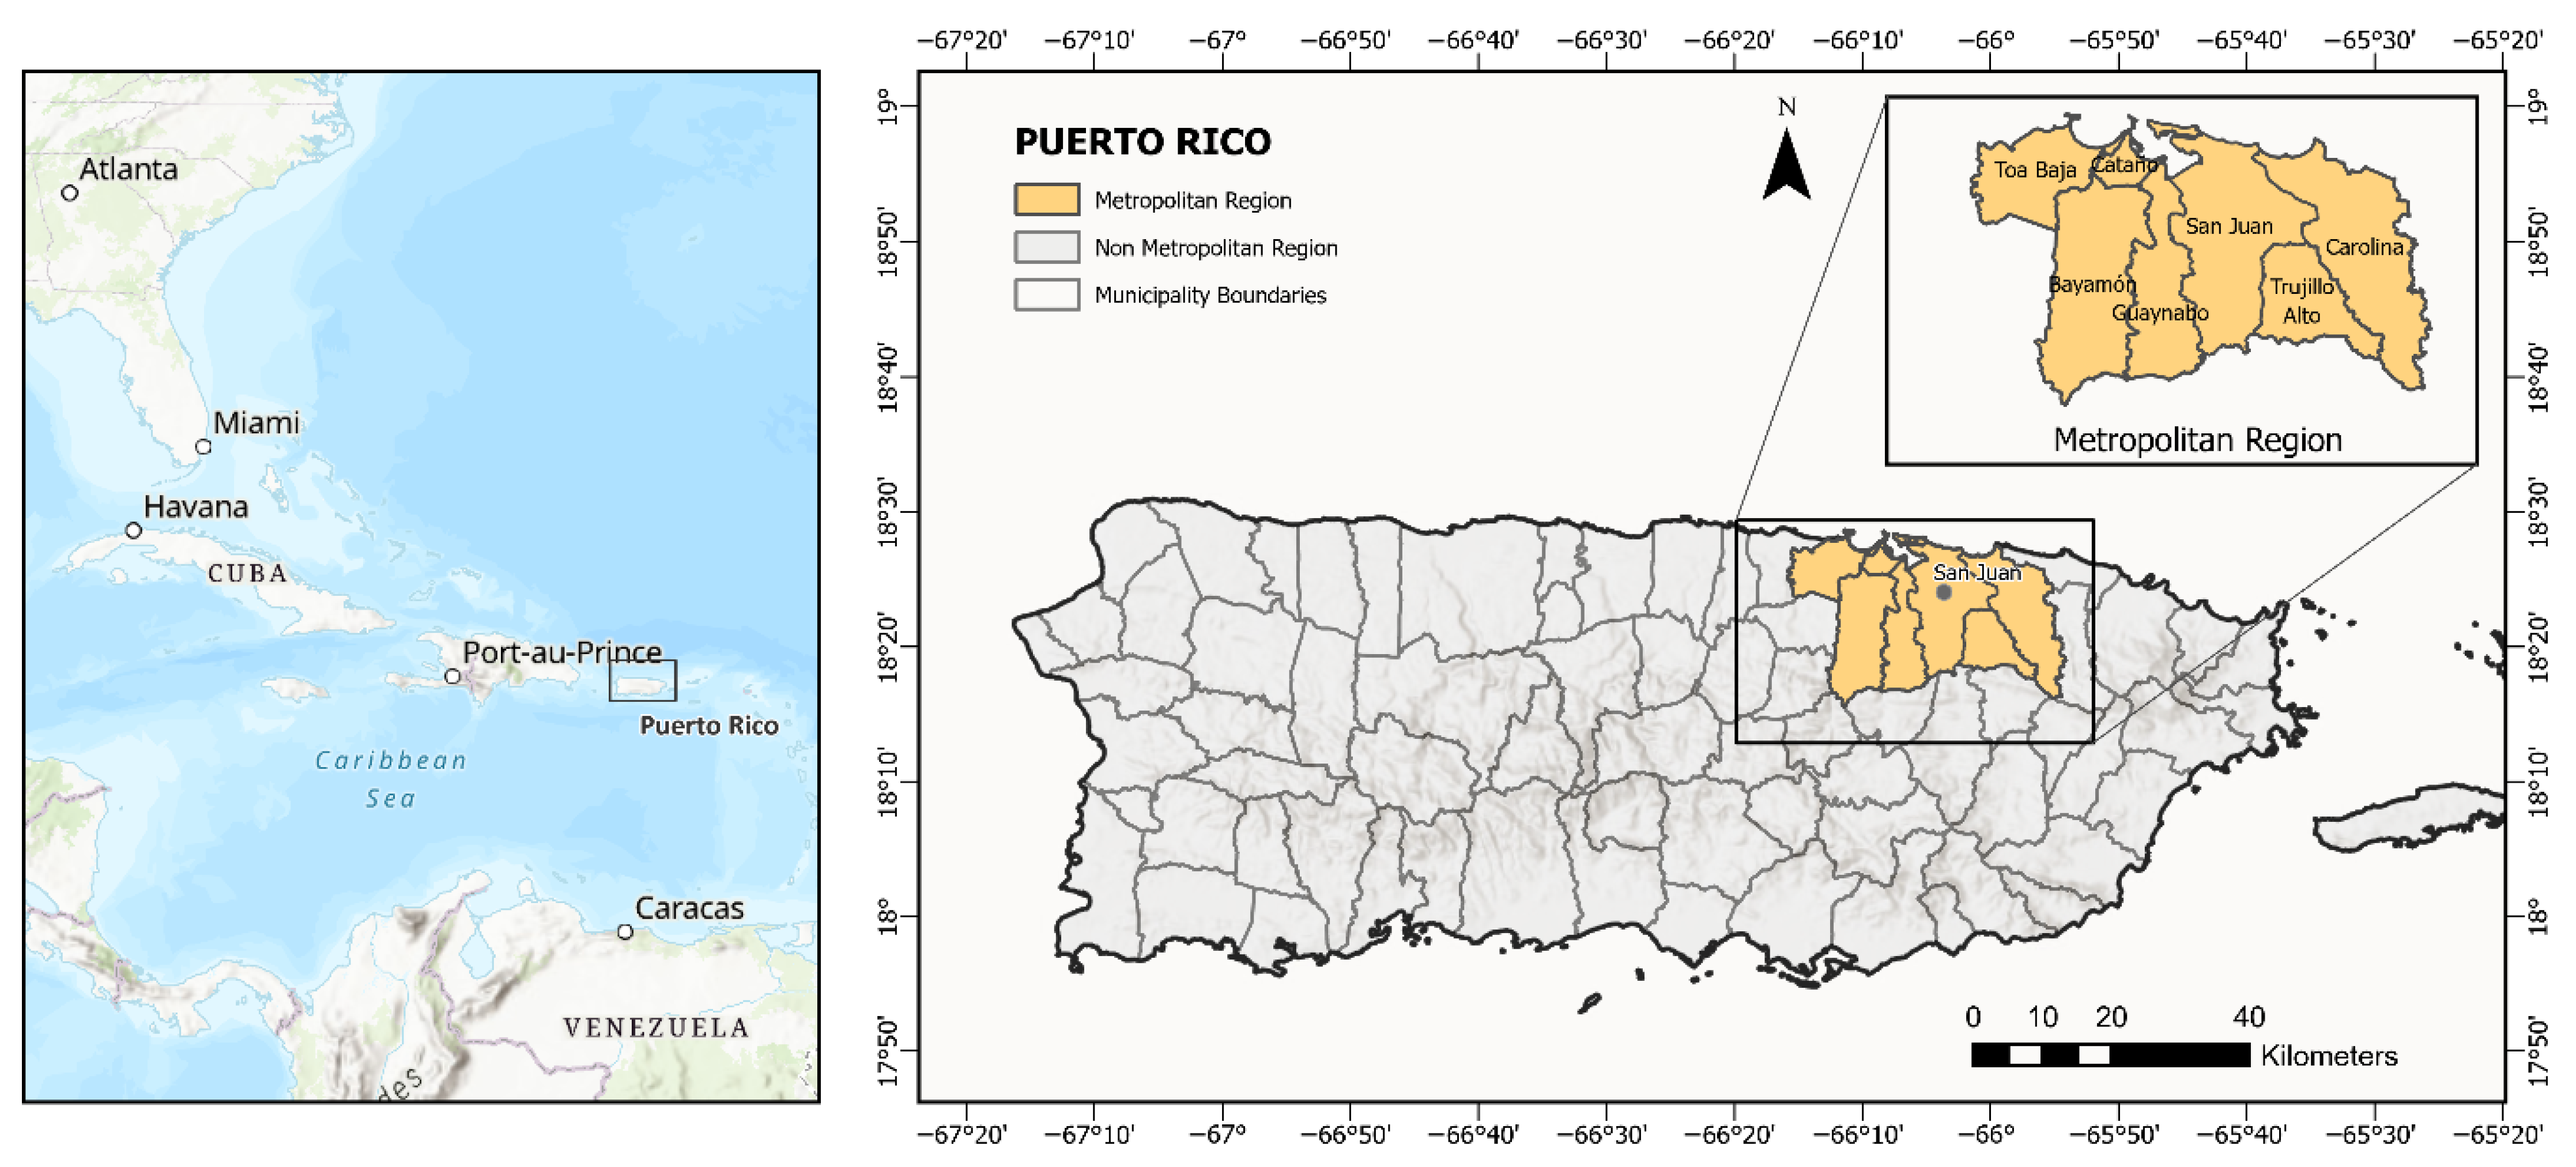
2.1. Study Area

Puerto Rico is an island located in the north-central Caribbean Sea (17.92° N–18.52° N, 65.62° W–67.28° W) with a tropical climate (Figure 1). The territory is divided into 78 municipalities, with a total population of approximately 3,285,874 inhabitants. The geographic scope of this study encompasses Puerto Rico. For the purposes of sample stratification and comparative analysis, two regions were delineated: the metropolitan region, which includes the municipalities of Bayamón, Carolina, Cataño, Guaynabo, San Juan, Toa Baja, and Trujillo Alto, and the non-metropolitan region, which consists of the remaining municipalities of Puerto Rico.
Extreme weather events in Puerto Rico include tropical cyclones and rising temperatures, with increasing frequencies of extreme heat and reduced rainfall [27]. Summers are characterized by consistent easterly trade winds and relatively stable temperatures, with daily highs ranging from 25 to 35 °C (77–95 °F) and lows between 20 and 25 °C (68–77 °F) [28]. In the San Juan metropolitan region, hot days often bring sunny skies and higher temperatures along the northern coast [28].

2.2. Survey Methods

This cross-sectional study used telephone surveys to collect data from a probabilistic sample of 500 adults aged 21 and older who resided in Puerto Rico during the summer of 2020 (June–September). The survey was co-designed by teams from the University of Arizona and the University of Puerto Rico Medical Sciences Campus. Participants were selected using proportionally stratified probability sampling based on geographic region (metropolitan vs. non-metropolitan) and demographic characteristics according to the 2018 Puerto Rico Community Survey (5-year estimate) (Table 1). Random digit dialing (RDD), following the Mitofsky–Waksberg method [29], was used to select telephone numbers. Estudios Tecnicos, Inc. conducted the interviews between 23 January and 22 March 2021. A total of 46,260 calls were made. The maximum sampling error was ±4.4% at a 95% confidence level.
The 40-question survey covered demographics, socioeconomic status, heat exposure, risk perception, information and institutional trust, heat-related behaviors, perceived exposure, health, and compound climate hazards, using predefined responses, open-ended questions, hybrid formats, and Likert scales. Informed consent was obtained from all the participants, and the data were processed using SPSS and Excel to ensure consistency, confidentiality, and anonymity. The study was approved by the University of Arizona IRB (protocol: 1812204202A003).

2.3. Data Analysis

Statistical analyses included variables on sociodemographic characteristics (region, age, gender, education, employment, and household size), health status, heat exposure, behaviors, and risk perception. Due to a 55% non-response rate, household income was excluded; however, education and employment were included as proxies for socioeconomic status. The health variables encompassed the self-perceived health status, which was selected from a range of five levels, from excellent to very poor. Additionally, health conditions and health insurance were considered. The inquiries addressed aspects such as thermal comfort, experiences with heat-related symptoms during the summer months, sleeping at uncomfortable temperatures, actions taken to stay cool at home, indicators of air conditioning (AC) usage, and the availability of alternative energy systems within the residential context. A full description of all the variables and their coding is provided in Appendix A Table A1.
The assessment of the heat risk perception entailed inquiries concerning the degree of concern regarding health in response to elevated temperatures and the probability of encountering a heat-related illness necessitating medical intervention within a five-year timeframe at the individual, family, and community levels. This approach enabled the independent evaluation of various dimensions of heat-related health risk perception. Risk perception was assessed using five-point Likert scales, later recoded as low, moderate, and high levels; immediate concern about high temperatures served as the primary indicator. In contrast, perceived future risk, as assessed in this study, pertains to the anticipated concern of developing illnesses requiring medical attention in the medium term. This suggests the necessity of evaluating future risk and vulnerability, as well as the severity of health impacts from heat events. These distinctions are significant because they may correspond to varying levels of action and adaptive behaviors. Furthermore, the survey included an open-ended question regarding the primary concerns associated with elevated temperatures, which were categorized as direct and indirect health effects.
Descriptive statistics and frequency distributions were used to analyze the study variables. To facilitate these analyses, certain variables were recoded into broad categories. Chi-squared tests were used to evaluate the associations between the variables of interest (region, sociodemographic, health status, perceived exposure, and heat-response behaviors) and the levels of risk perception. Additionally, chi-squared tests were used to evaluate the associations between the experience of heat-related symptoms and the variables of interest. We employed multinomial regression models to compare various categories of risk perception (low, moderate, and high levels) with potential predictor variables, utilizing the low-risk category as the reference point. Although the models estimated outcomes for both moderate and high levels of perceived risks, only the results for the high-risk category were presented, as they were more consistently significant and relevant to the study objectives. Initially, univariate analyses were conducted with each independent variable, followed by multivariate analyses to identify adjusted associations with risk perception. We used binary logistic regression analyses to evaluate the strengths of the associations between the predictor variables and prior experience with heat-associated symptoms (dichotomized as yes/no). Initially, univariate analyses were performed, followed by multivariate models adjusted for multiple independent variables. A significance level of 5% (p < 0.05) was used. Frequency and chi-squared analyses were conducted using SPSS Statistics (version 30), while logistic regression analyses were performed using STATA (version 18.5).

3. Results

3.1. Sociodemographic Characteristics of the Participants

The sample consisted of 500 adults across Puerto Rico, with the majority (72%) residing in non-metropolitan areas (Table 2). The mean age was 50.6 years, and 53% of the respondents were male. Most participants (61%) had completed post-secondary education, and 42% were employed at the time of the survey. Nearly one in five lived alone (Table 3), and 95% reported having health insurance coverage. A majority (69%) reported being in excellent or good health, while 71% had at least one chronic condition (Table 4). The most commonly reported conditions were cardiovascular (40%), neurological or sleep disorders (38%), and metabolic conditions (30%). Reports of fair or poor/very poor health were more prevalent among older adults, with 42.7% of the individuals aged 50 to 64 and 40.4% of those aged 65 and older indicating this health status.

3.2. Reported Thermal Comfort Threshold

Most participants (72%) reported feeling discomfort during outdoor activities at temperatures above 86 °F, with a mean thermal discomfort threshold of 89.4 °F (95% CI: 88.8–90.0) (Figure 2). This aligns with thermal comfort literature for tropical climates [30,31]. In 2020, this threshold was exceeded on 111 days, including 73 days (60%) during the summer months of June through September (Figure 2).

3.3. Health Risk Perception

Nearly half the participants (47%) reported a high level of concern about heat-related health risks, while fewer perceived themselves or their families as being likely to experience heat-related illness within five years (Table 5). Young adults (21–34) and older adults (65+) most frequently reported low levels of perceived risk. In contrast, concerns about climate change, high temperatures, and heatwaves were widespread, with over three-quarters of the respondents expressing high levels of concern.
Chi-squared tests showed that risk perception was significantly associated with region, age, gender, and employment status (Table 6). Adults aged 50–64 and those unable to work reported the highest levels of perceived risk, while those aged 65+ reported the lowest. Health risk perception was also higher among individuals in fair or poor health, those with multiple chronic conditions, and those who had previously experienced heat-related symptoms or uncomfortable sleep temperatures. No significant associations were found between perceived health risk and specific household heat mitigation behaviors, such as the use of air conditioning or visiting public spaces to cool down.

3.4. Future Health Risk Perception

Future health risk perception was assessed at the individual, family, and community levels over a five-year outlook. Chi-squared analyses revealed higher levels of perceived risk among men, adults aged 35–64, individuals with fair or poor health, those unemployed or unable to work, and respondents with lower educational attainment or multiple chronic conditions. Prior experience with heat-related symptoms and sleeping at uncomfortable temperatures were strongly associated with higher levels of perceived future risk across all the levels. Visiting public spaces to cool off was also linked to increased perceived risk at the family and community levels (Table 6).

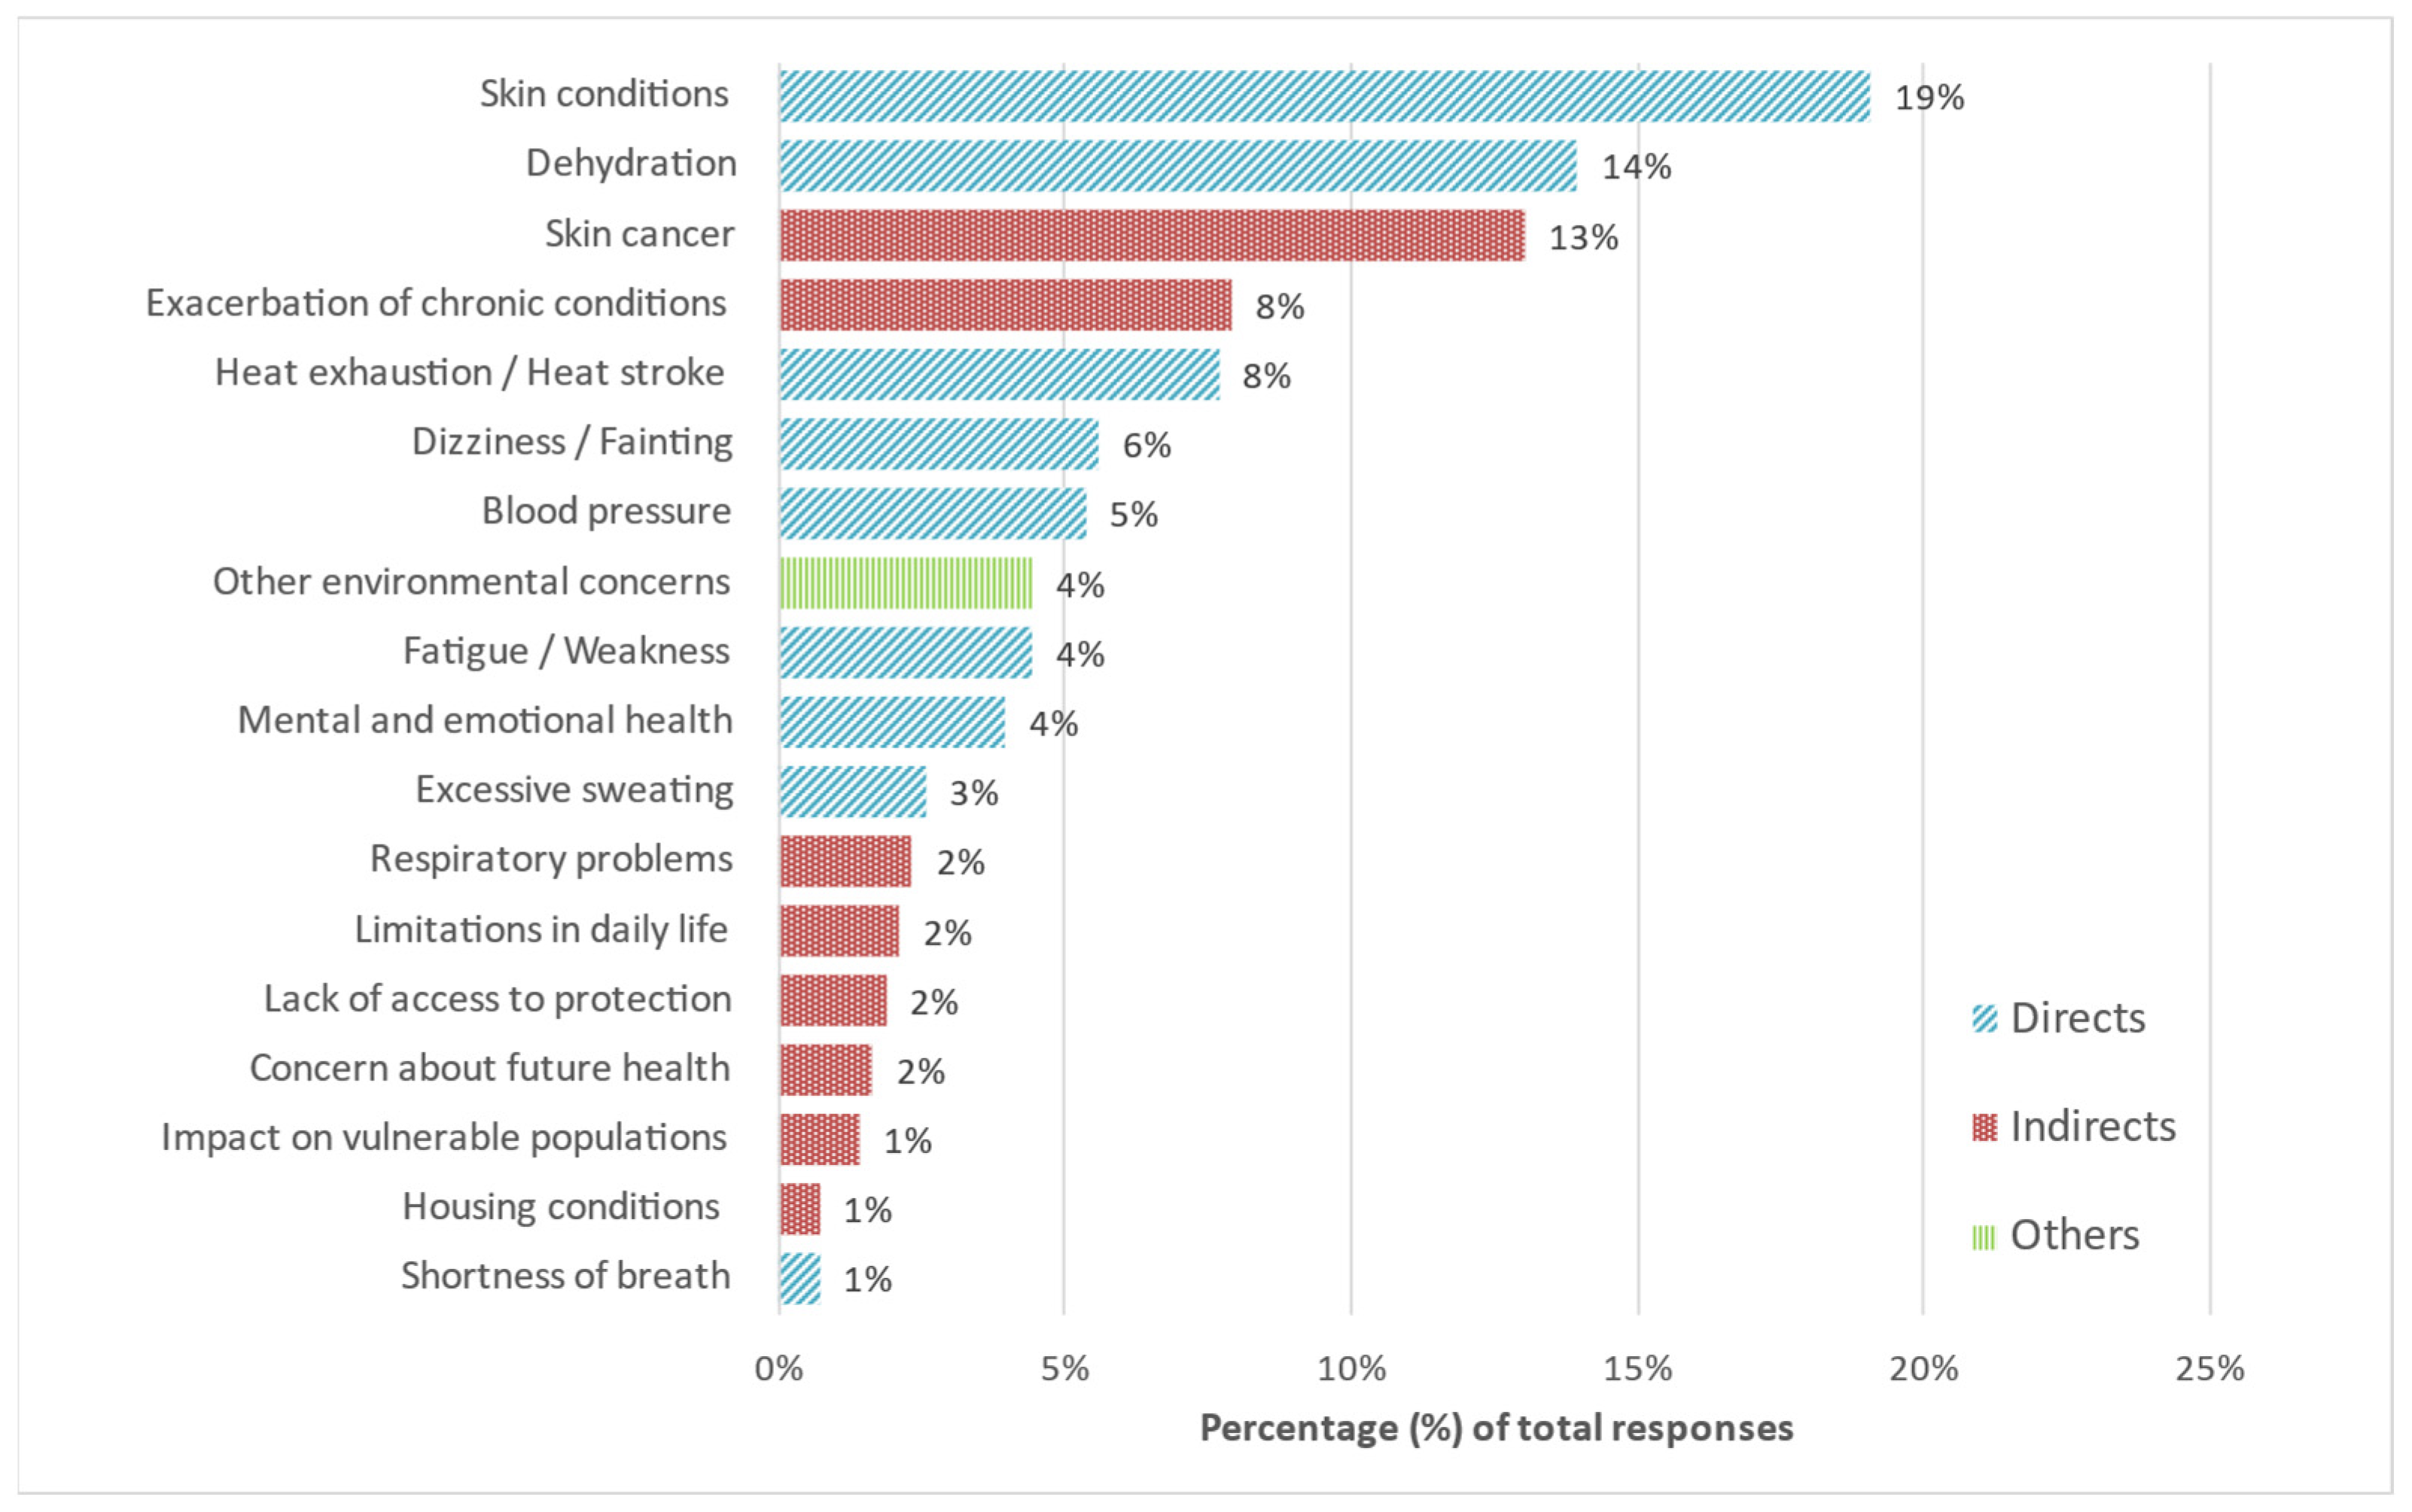
3.5. Self-Reported Concerns About High Temperatures

Participants reported 430 concerns about high temperatures, which were categorized as direct health effects (59%), indirect effects (35%), and other environmental concerns (4%) (Figure 3). Direct concerns included dehydration, dizziness, and excessive perspiration. Indirect concerns involved the exacerbation of pre-existing conditions and limitations on daily activities. Despite well-established links between heat and cardiovascular or respiratory illness, these outcomes were rarely mentioned. Only 2% explicitly identified respiratory issues, and 8% referred to chronic conditions more generally. This gap highlights a disconnect between scientific evidence and public perception, underlining the need for risk communication strategies that raise awareness of severe but less visible heat-related health risks.

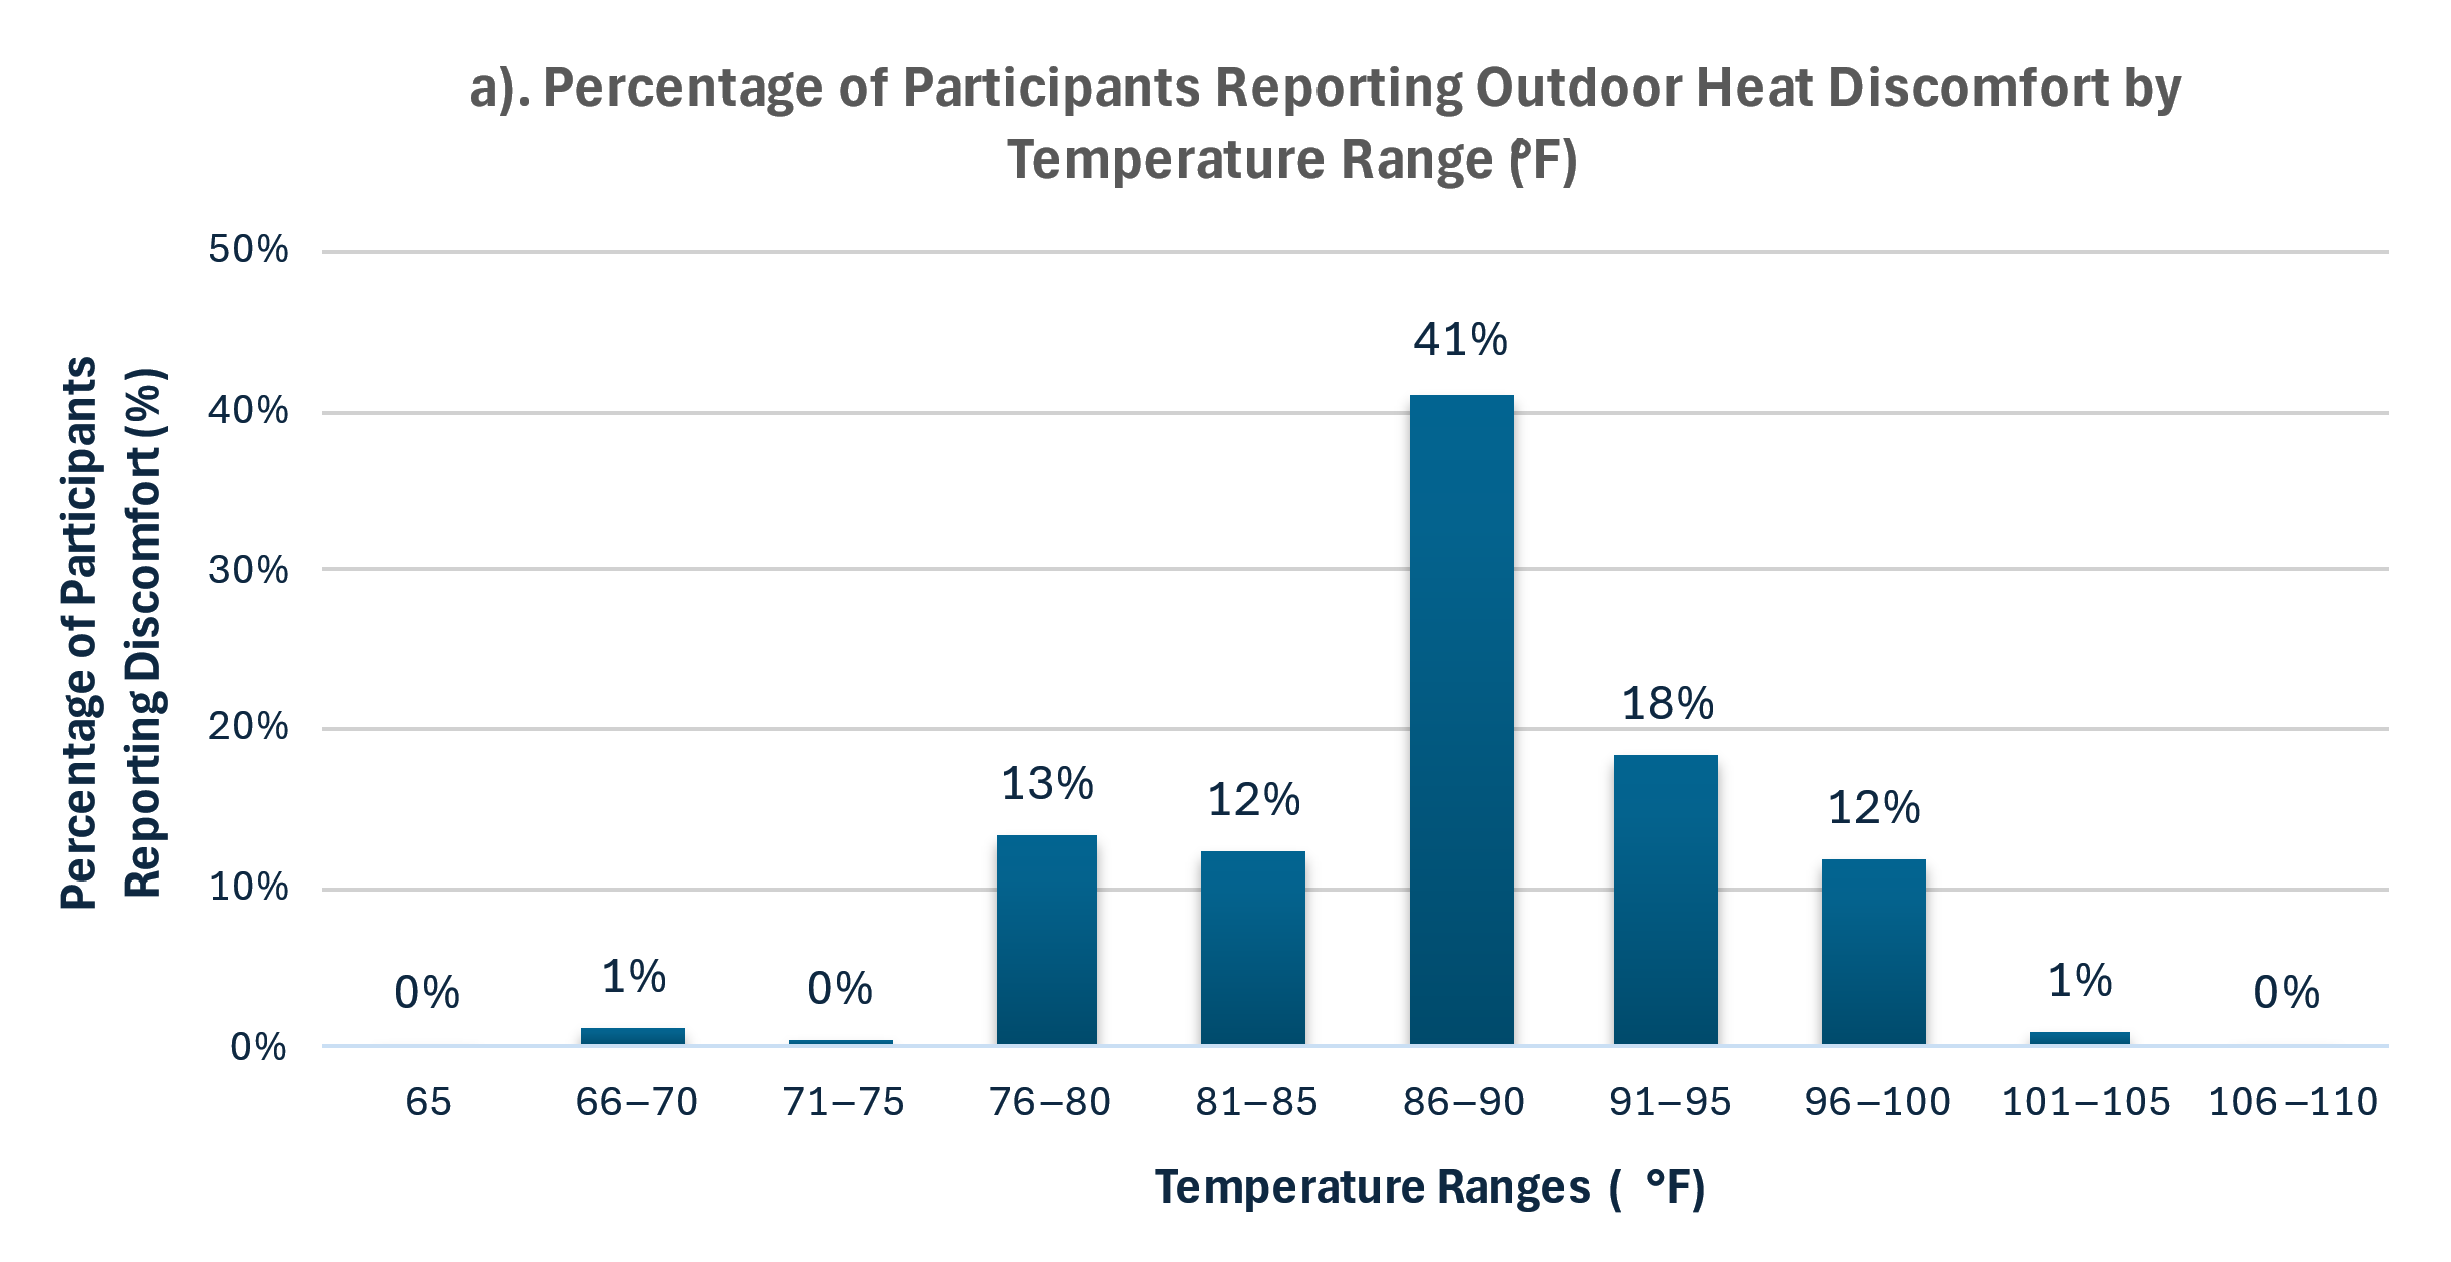
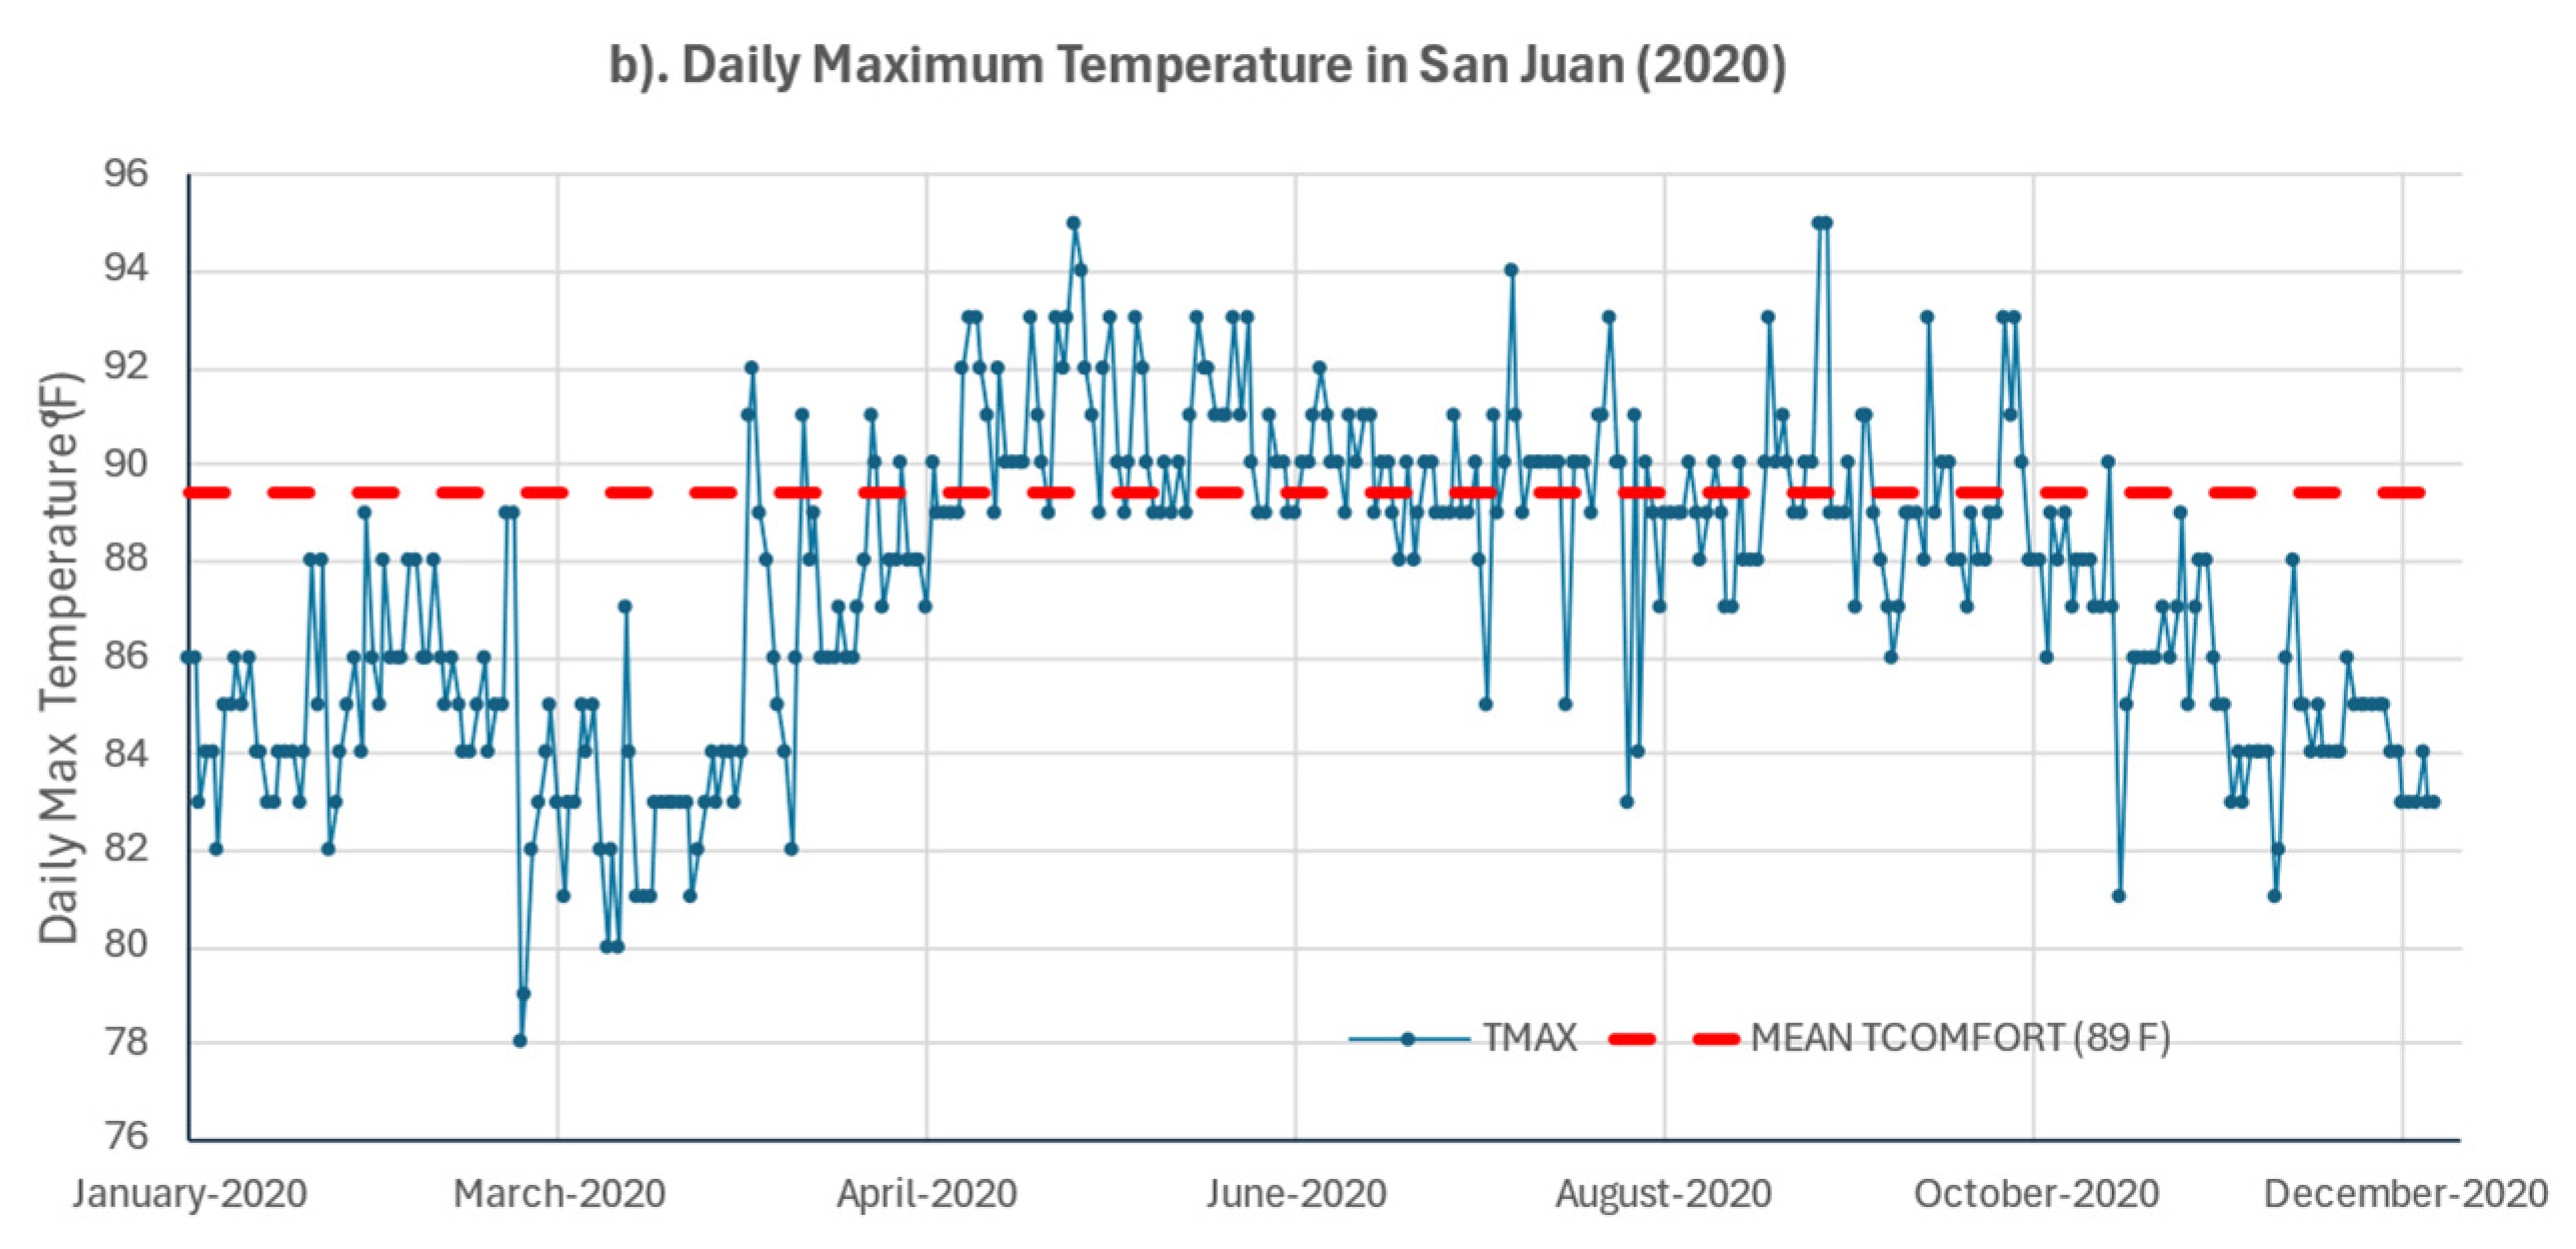
3.6. Perceived Heat Exposure

Forty-four percent (44%) of the respondents reported experiencing heat-related symptoms during the summer of 2020 (June through September) (Table 6). Among those who reported symptoms, 45% experienced them one to two times, 34% experienced them two to four times, and 22% experienced them five or more times during summer. The occurrence of heat-associated symptoms was most frequently reported among residents of non-metropolitan areas, men, individuals aged 50 to 64 years, households comprising two to three persons, individuals who were unemployed or unable to work, persons with lower educational levels, those who worked both indoors and outdoors, those who reported a fair health status, those who suffered from at least one chronic health condition, and those reporting thermal discomfort at temperatures ≤ 85 °F. Chi-squared tests indicated statistically significant associations between experiencing symptoms and gender (p = 0.023), educational level (p = 0.034), employment status (p = 0.01), health status (p < 0.001), and the number of health conditions (p < 0.001).
Sixty-eight percent (68%) reported having slept at uncomfortable temperatures; however, no statistically significant differences were observed by region or other sociodemographic variables, except for household size, which was more frequently reported among individuals living alone (p = 0.005).

3.7. Heat-Related Behaviors

About 45% of the participants reported visiting public places to cool down during the summer of 2020, though most did so infrequently. This behavior was more common among younger adults (21–34 years) and less frequent among older adults (65+ years), individuals unable to work, and those with lower educational attainment. To mitigate heat at home, the most common strategies were the use of fans (84%), air conditioning (64%), and natural ventilation. AC use was more prevalent in metropolitan areas and varied by duration, with nearly half using it 13 h or more per day. However, financial limitations were common; 43% reduced AC use due to cost, and 13% were unable to pay their electricity bill. About 61% of the respondents reported having backup power systems (Table 7). These behavioral patterns varied by demographic and health status, as shown in Table 8, highlighting that the most heat-vulnerable populations may also face structural and economic barriers to adaptation.

3.8. Predictors of Risk Perception and Heat Exposure

Multivariate logistic regression identified several factors significantly associated with high levels of heat risk perception, including non-metropolitan residence, male sex, age 50–64 years, and prior heat symptom experience (Table 9). Future risk perception at individual, family, and community levels showed distinct patterns of association with demographic factors and heat exposure experiences. Additionally, individuals with fair health, pre-existing chronic conditions, and those experiencing heat-related symptoms and uncomfortable sleeping temperatures showed increased likelihoods of reporting heat-related symptoms (Table 10).

4. Discussion

This study examined heat risk perception among 500 Puerto Rico residents during the record-breaking summer of 2020, when the Caribbean experienced unprecedented temperatures with significant heatwaves. While most participants expressed concern about climate threats, less than half perceived high levels of health risks from heat, and even fewer anticipated future heat-related illness.
Contrary to prior research suggesting women are more concerned about environmental threats, the men in this study reported higher levels of heat-related health risk perception. This may reflect differences in occupational exposure, cultural norms, or lived experiences. Although the work setting was not statistically significant, men may still encounter greater heat exposure. These findings highlight the importance of considering local gender roles and social context when designing public health interventions.
Statistically significant differences were observed in the levels of heat risk perception and perceived heat exposure between the two regions evaluated, with higher levels reported among the residents of the non-metropolitan area compared to the residents of the San Juan metropolitan area (an area of higher urban density), where greater exposure is presumed to be due to heat island effects. The observed differences could be related to possible acclimatization effects among the residents of the metropolitan area and to greater perceived vulnerability among the residents of the non-metropolitan area due to less access to heat mitigation resources. However, the study could not distinguish among rural, suburban, and urban zones, limiting the granularity of the geographic vulnerability analysis.
Older adults (65 years and older) reported the lowest levels of perceived health risks from heat exposure and the least experience of heat-associated symptoms, indicating a significant underestimation of their vulnerability. This finding aligns with previous studies, which have demonstrated that vulnerable groups, particularly older adults, often do not perceive a high level of risk and tend to underestimate their susceptibility to extreme heat [32,33]. Given their heightened vulnerability and low levels of risk perception, older adults should be considered as a critical target group for public health interventions aimed at increasing awareness, improving risk communication, and promoting protective behaviors during extreme heat events.
The participants with fair health and pre-existing chronic conditions reported higher levels of heat-related health risk perception. Risk perception increased progressively with the number of health conditions, particularly among those with two or more. These same factors were also associated with greater odds of experiencing heat-related symptoms. These findings are consistent with previous studies identifying poor health status and chronic illness as key drivers of vulnerability and perceived heat risk [11,13,14,15,16,17,18].
This study identified prior exposure to heat as a significant factor that influences health risk perception. Individuals who have experienced symptoms are five times more likely to perceive a higher level of risk. Both the experience of heat-related symptoms and sleeping at uncomfortable temperatures were significantly correlated with elevated health risk perception. This finding aligns with previous research indicating that past experience with heat-related issues tends to heighten awareness and risk perception [11]. Statistically significant associations were identified between the experience of heat-related symptoms and variables such as sex (higher among men), educational attainment (lower levels of education), employment status (unemployed), health status (fair), and pre-existing chronic conditions. These associations facilitate the identification of the groups most sensitive and vulnerable to extreme heat in Puerto Rico.
The majority of the participants (68%) reported experiencing sleep at temperatures deemed uncomfortable. Exposure to nighttime heat was significantly correlated with an increased likelihood of experiencing heat-related symptoms (OR = 1.85; p = 0.009). Elevated nighttime temperatures have been linked to heightened health risks and excess mortality, particularly among individuals without access to air conditioning [5,34]. Consequently, addressing nighttime heat exposure, particularly among vulnerable populations, is a crucial strategy for mitigating public health risks.
Among the measures adopted to mitigate heat, approximately half of the participants (45%) reported visiting a public space to cool off during summer, albeit infrequently. This behavior was more frequently employed among young adults (21–34 years) and less frequently among older adults (65 years). Potential limitations in mobility among older adults, coupled with the isolation measures recommended during the 2020 COVID-19 pandemic, may have contributed to the reported infrequency of visits to public spaces for cooling among this demographic. The two main strategies reported to mitigate heat in the home environment were the use of fans and air conditioning (AC). However, the implementation of these strategies faces structural barriers owing to the economic constraints that limit AC usage, deficiencies in the electrical system in Puerto Rico, the frequency and duration of power outages, and the vulnerability associated with tropical cyclones and their effects on the heat and electrical infrastructure. These factors may impair the capacity of Puerto Rico′s residents, particularly the most vulnerable population, to adapt to extreme heat conditions, thereby exacerbating existing inequalities.
This study acknowledges several limitations that should be considered when interpreting the findings. First, the cross-sectional nature of the study inherently limits the ability to establish causal links. Second, there is a possibility of recall bias, especially concerning subjective measures, which was due to the time lapse between the exposure period and data collection. Third, household income data were constrained by a significant amount of missing or incomplete responses. This limitation hindered our capacity to examine the influences of socioeconomic status and poverty on heat-related perceptions and behaviors, which are recognized as determinants of health outcomes in the context of climate-related stressors. However, the inclusion of variables such as educational level and employment status provided indirect insights into the socioeconomic disparities within the sample. Fourth, this study did not consider humidity levels, which significantly influence heat perception and physiological stress in tropical climates, like that of Puerto Rico, potentially affecting the accuracy of heat exposure assessments. Finally, as with all self-reported survey data, the possibility of response and social desirability biases exists, especially concerning behaviors and attitudes related to climate change and health, which may be influenced by awareness or perceived expectations.

5. Conclusions

This research reveals critical gaps in heat risk perception among Puerto Rico residents, with only one in four recognizing high levels of future risk despite current exposure concerns. Key vulnerable groups include non-metropolitan residents, men, adults aged 50–64, non-employed individuals, those with fair health and chronic conditions, and people experiencing nighttime heat discomfort. Priority interventions should focus on risk communication to vulnerable groups, emphasizing nighttime heat dangers and promoting protective behaviors. Addressing Puerto Rico′s electrical infrastructure challenges is essential for effective heat mitigation. Solutions should include decentralized energy systems, cooling centers with backup power, and passive thermal infrastructure to reduce electricity dependence and strengthen community resilience against increasing heat-related risks.

Author Contributions

Conceptualization, P.A.M.-L.; methodology, P.A.M.-L., Z.G., C.P.A.-A. and B.G.-C.; software, B.G.-C. and C.P.A.-A.; validation, B.G.-C. and P.A.M.-L.; formal analysis, B.G.-C.; investigation, B.G.-C.; resources, P.A.M.-L. and Z.G.; data curation, B.G.-C.; writing—original draft preparation, B.G.-C.; writing—review and editing, P.A.M.-L., Z.G., L.T.C.-R., C.P.A.-A. and B.G.-C.; visualization, B.G.-C.; supervision, P.A.M.-L.; project administration, P.A.M.-L. and Z.G.; funding acquisition, P.A.M.-L. and Z.G. All authors have read and agreed to the published version of the manuscript.

Funding

This research was supported by the National Oceanic and Atmospheric Administration (NOAA) through the Climate Adaptation Partnership (CAP) program, under grant number NA22OAR4310545, and through a grant from the NOAA International Research and Applications Project (NA18OAR4310338).

Institutional Review Board Statement

The study protocol met the criteria for IRB-approved research at the University of Arizona (IRB protocol number: 1812204202A003; approval date: 2 November 2020).

Informed Consent Statement

Informed consent was obtained from all the subjects involved in the study.

Data Availability Statement

The data presented in this study are available on request from the corresponding author due to ethical and privacy restrictions and may require approval from the Institutional Review Board (IRB).

Conflicts of Interest

The authors declare no conflicts of interest.

Appendix A

Table A1. Survey variables.
Domain/VariableDescriptionTypeSurvey Response OptionsAnalytical Coding
Sociodemographic and Socioeconomic (Social Determinants)
Geographic regionRegion in which the respondent resides, determined by the municipality of residenceNominalMunicipality of residence (coded as 1–78) and grouped in two regions: Metropolitan (Bayamon, Carolina, Cataño, Guaynabo, San Juan, Toa Baja, and Trujillo Alto) and Non-metropolitan (confirmed by the rest of the municipalities)(1) Metropolitan
(2) Non-metropolitan
AgeParticipant’s age in yearsCategorical (ordinal)Exact age recorded; age group selected by enumerator: (1) 21–34, (2) 35–49, (3) 50–64, or (4) 65 or more(1) 21–34, (2) 35–49, (3) 50–64, or (4) 65 or more
GenderGender of the respondent at birthNominal(1) Female, (2) Male, or (3) Other(1) Female, (2) Male, or (3) Other
Employment StatusEmployment StatusNominal(1) Employed, (2) Unemployed, (3) Retired, or (4) Unable to Work(1) Employed, (2) Unemployed, (3) Retired, or (4) Unable to Work
Household SizeThe total number of people currently living in the respondent′s household, including self.Categorical (ordinal)Any whole numberRecoded as (1) 1; (2) 2 to 3; (3) 4 or more
Household IncomeThe total annual household income (USD) from all sources, before taxesCategorical (ordinal)1 = Less than $10,000
2 = $10,000–$14,999
3 = $15,000–$24,999
4 = $25,000–$34,999
5 = $35,000–$49,999
6 = $50,000–$74,999
7 = $75,000 or more
Same as collected
Educational AttainmentThe highest level of education completedCategorical (ordinal)1 = Less than high school
2 = High school diploma
3 = Bachelor’s degree
4 = Master’s degree
5 = Doctoral degree
6 = Other (open)
Recoded as (1) less than high school, (2) high school, (3) technical/vocational course or associate degree, (4) bachelor′s degree, or (5) master′s degree or doctoral degree
Health Insurance CoverageIndicates whether the respondent has health insurance.Binary
(categorical)
1 = Yes, private insurance
2 = Yes, government health plan (Plan VITAL, known as “La Reforma de Salud”)
3 = Yes, Medicare
4 = No health insurance
Recoded: 0 = No (response 4); 1 = Yes (responses 1–3)
Type of Health InsuranceType of insurance among those with coverageCategorical (nominal)1 = Yes, private insurance
2 = Yes, government health plan (Plan VITAL, known as “La Reforma de Salud”)
3 = Yes, Medicare
4 = No health insurance
Recoded: 1 = Private; 2 = Government; 3 = Medicare; response 4 (No) excluded
Health Status and Conditions
Health StatusSelf-rated general health status reported by the respondentCategorical (ordinal)1 = Excellent
2 = Good
3 = Fair
4 = Poor
5 = Very Poor
Recoded: 1 = Excellent/Group (responses 1–2); 2 = Fair (response 3); 3 = Poor/Very Poor (responses 4–5)
Health Conditions (15 items) (Descriptive)Health conditions reported by the respondent across 15 listed health conditions.Categorical (nominal)Yes/NoUsed descriptively; conditions grouped in broader categories
Number of Health ConditionsThe total number of conditions reported across 15 listed health conditionsContinuous (discrete)
Categorical (ordinal)
Yes/NoThe total count of “yes” responses.
Grouped: 0 = None; 1 = 1 condition; 2 = 2–3; 3 = 4 or more
The Minimum Number of Health ConditionsBinary variables derived from the total number of reported health conditions, indicating whether the respondent had 1 or more, 2 or more, 3 or more, or 4 or more conditions.Binary (categorical)Derived from the total count of conditions (Yes responses)Yes = 1 or No = 0 (for each threshold, 1, 2, 3, and 4)
Heat Risk Perception
Perceived Health RiskSelf-reported level of concern about personal health during hot weatherCategorical (ordinal)Likert scale from 1 to 5, where 1 = “Not concerned at all” and 5 = “Extremely concerned”Recoded: 1 = Low (scores 1–2), 2 = Moderate (3), or 3 = High (scores 4–5)
Perceived Likelihood of Personal IllnessPerceived likelihood of experiencing a heat-related illness requiring medical attention within 5 yearsCategorical (ordinal)Likert scale from 1 to 5, where 1 = “Very unlikely” and 5 = “Very likely”Recoded: 1 = Low (scores 1–2), 2 = Moderate (3), or 3 = High (scores 4–5)
Perceived Likelihood of Family IllnessPerceived likelihood of a family member experiencing a heat-related illness requiring medical attention within 5 yearsCategorical (ordinal)Likert scale from 1 to 5, where 1 = “Very unlikely” and 5 = “Very likely”Recoded: 1 = Low (scores 1–2), 2 = Moderate (3), or 3 = High (scores 4–5)
Perceived Likelihood of Community IllnessPerceived likelihood of someone in the community experiencing a heat-related illness requiring medical attention within 5 yearsCategorical (ordinal)Likert scale from 1 to 5, where 1 = “Very unlikely” and 5 = “Very likely”Recoded: 1 = Low (scores 1–2), 2 = Moderate (3), or 3 = High (scores 4–5)
Descriptive Heat Risk Perception
Primary Reason for Heat ConcernOpen-ended question where participants stated their main reason for concern during hot weatherThematic categories (descriptive)Open-ended responseGrouped:
Direct health effects (responses indicating immediate physical symptoms or direct exposure to heat);
indirect health effects (responses indicating secondary consequences or the worsening of existing conditions);
other (environmental or other concerns)
Climate-Related Concerns
Concern about Climate ChangeLevel of concern about climate changeCategorical (ordinal)Likert scale from 1 to 5, where 1 = “Not concerned at all” and 5 = “Extremely concerned”Recoded: 1 = Low (scores 1–2), 2 = Moderate (3), or 3 = High (scores 4–5)
Concern about Hot TemperaturesLevel of concern about increasing hot temperatures Categorical (ordinal)Likert scale from 1 to 5, where 1 = “Not concerned at all” and 5 = “Extremely concerned”Recoded: 1 = Low (scores 1–2), 2 = Moderate (3), or 3 = High (scores 4–5)
Concern about HeatwavesLevel of concern about extreme heat events or heatwavesCategorical (ordinal)Likert scale from 1 to 5, where 1 = “Not concerned at all” and 5 = “Extremely concerned”Recoded: 1 = Low (scores 1–2), 2 = Moderate (3), or 3 = High (scores 4–5)
Perceived Heat Exposure
Threshold Temperature for Outdoor DiscomfortSelf-reported temperature (F) for outdoor heat discomfort based on combined responses from a structured and an open-ended question Continuous (numeric)
Binary (categorical)
Open numeric responses in °F or °CUsed as reported for descriptive analysis; values standardized to °F
Grouped: 1 = Below 86 °F; 2 = 86 °F or higher
Frequency of Heat-Related SymptomsThe number of times the respondent experienced symptoms believed to be heat-related during summer, such as fainting, rapid heartbeat, hallucinations, confusion, dizziness, or muscle painCategorical (ordinal)Open numeric responseGrouped: 1 = 1–2 times; 2 = 3–4 times; 3 = 5 or more
Experienced Heat-Related SymptomsBinary indicator of whether the respondent experienced heat-related symptoms during the summer of 2020Binary (categorical)Derived from the frequency of heat-related symptoms0 = No (frequency = 0);
1 = Yes (frequency ≥ 1)
Heat-Related Behaviors
Frequency of Visits to a Public Space to Cool downThe frequency with which the respondent or household members visited public spaces (e.g., malls and restaurants) specifically to cool down during the summer of 2020Categorical (ordinal)Five-point scale from 1 to 5, where 1 = “Never” to 5 = “Very frequently”Recoded: 0 = Never (score 1); 1 = Low (scores 2–3), 2 = High (scores 4–5)
Visited a Public Space to Cool downBinary indicator of whether respondents visited a public space to cool downBinary (categorical)Derived from 5-point scale responsesRecoded: 0 = No (score = 1); 1 = Yes (score ≥ 1)
Frequency:
Slept in Uncomfortably Hot Temperatures
Frequency with which the respondent slept in uncomfortably hot temperatures during the summer of 2020Categorical (ordinal)Five-point scale: 1 = Never, 2 = Rarely, 3 = Sometimes, 4 = Often, or 5 = AlwaysRecoded: 0 = Never (score 1); 1 = Low (scores 2–3); 2 = High (scores 4–5)
Slept in Uncomfortably Hot TemperaturesBinary indicator of whether respondents ever slept in uncomfortably hot temperaturesBinary (categorical)Derived from frequency scaleRecoded:
0 = No (score 1); 1 = Yes (score ≥ 1)
Used ACUsed air conditioning at home to stay cool (predefined survey option: “Used air conditioning”) Binary (categorical)Selected/Not SelectedRecoded: 0 = No; 1 = Yes
Used FansUsed fans at home to stay cool (predefined survey option: “Used ceiling fans or others”)Binary (categorical)Selected/Not SelectedRecoded: 0 = No; 1 = Yes
Opened Windows and Doors at NightOpened windows and doors at night to stay cool (predefined survey option)Binary (categorical)Selected/Not SelectedRecoded: 0 = No; 1 = Yes
AC Usage (hours)Average number of hours per day air conditioning was used during the summer of 2020Continuous (numeric)Open numeric responseGrouped: 1 = < 8 h; 2 = 8–12; 3 = 13–24 h
Descriptive Heat-Related Behaviors
Reduced AC Use Due to FinancesWhether financial limitations reduced AC use during the summer of 2020Categorical (nominal)Yes/No0 = No; 1 = Yes
Unable to Pay Electricity BillWhether the household was unable to pay the electricity bill during the summer of 2020Categorical (nominal)Yes/No0 = No; 1 = Yes
Alternative
Energy or Generator
Whether the household has a generator or alternative energy systemCategorical (nominal)1 = Yes, has an electric or gas generator
2 = Yes, has an alternative energy system
3 = Does not have
Used as reported for descriptive analysis

References

  1. Ebi, K.L.; Capon, A.; Berry, P.; Broderick, C.; de Dear, R.; Havenith, G.; Honda, Y.; Kovats, R.S.; Ma, W.; Malik, A.; et al. Hot weather and heat extremes: Health risks. Lancet 2021, 398, 698–708. [Google Scholar] [CrossRef]
  2. Haines, A.; Kovats, R.S.; Campbell-Lendrum, D.; Corvalán, C. Climate change and human health: Impacts, vulnerability and public health. Public Health 2006, 120, 585–596. [Google Scholar] [CrossRef] [PubMed]
  3. Hajat, S.; O’Connor, M.; Kosatsky, T. Health effects of hot weather: From awareness of risk factors to effective health protection. Lancet 2010, 375, 856–863. [Google Scholar] [CrossRef]
  4. Liu, T.; Xu, Y.J.; Zhang, Y.H.; Yan, Q.H.; Song, X.L.; Xie, H.Y.; Luo, Y.; Rutherford, S.; Chu, C.; Lin, H.L.; et al. Associations between risk perception, spontaneous adaptation behavior to heat waves and heatstroke in Guangdong province, China. BMC Public Health 2013, 13, 913. [Google Scholar] [CrossRef] [PubMed]
  5. Luber, G.; McGeehin, M. Climate Change and Extreme Heat Events. Am. J. Prev. Med. 2008, 35, 429–435. [Google Scholar] [CrossRef] [PubMed]
  6. Méndez-Lázaro, P.A.; Pérez-Cardona, C.M.; Rodríguez, E.; Martínez, O.; Taboas, M.; Bocanegra, A.; Méndez-Tejeda, R. Climate change, heat, and mortality in the tropical urban area of San Juan, Puerto Rico. Int. J. Biometeorol 2018, 62, 699–707. [Google Scholar] [CrossRef]
  7. Portier, C.; Tart, K.T.; Carter, S.; Dilworth, C.; Grambsch, A.; Gohlke, J.; Hess, J.; Howard, S.; Luber, G.; Lutz, J.; et al. A Human Health Perspective on Climate Change: A Report Outlining Research Needs on the Human Health Effects of Climate Change; Environmental Health Perspectives and National Institute of Environmental Health Sciences: Research Triangle Park, NC, USA, 2010.
  8. Salvador, C.; Gullón, P.; Franco, M.; Vicedo-Cabrera, A.M. Heat-related first cardiovascular event incidence in the city of Madrid (Spain): Vulnerability assessment by demographic, socioeconomic, and health indicators. Environ. Res. 2023, 226, 115698. [Google Scholar] [CrossRef]
  9. Romanello, M.; di Napoli, C.; Green, C.; Kennard, H.; Lampard, P.; Scamman, D.; Walawender, M.; Ali, Z.; Ameli, N.; Ayeb-Karlsson, S.; et al. Countdown The 2023 report of the Lancet Countdown on health and climate change: The imperative for a health-centred response in a world facing irreversible harms. Lancet 2023, 402, 2346–2394. [Google Scholar] [CrossRef]
  10. WHO. 2021 WHO Health and Climate Change Global Survey Report; WHO: Geneva, Switzerland, 2021. [Google Scholar]
  11. Hass, A.L.; Runkle, J.D.; Sugg, M.M. The driving influences of human perception to extreme heat: A scoping review. Environ. Res. 2021, 197, 111173. [Google Scholar] [CrossRef]
  12. Lwasa, S.; Seto, K.C.; Bai, X.; Blanco, H.; Gurney, K.R.; Kılkış, Ş.; Lucon, O.; Murakami, J.; Pan, J.; Sharifi, A.; et al. Urban Systems and Other Settlements. In IPCC, 2022: Climate Change 2022: Mitigation of Climate Change. Contribution of Working Group III to the Sixth Assessment Report of the Intergovernmental Panel on Climate Change; Shukla, P.R., Skea, J., Slade, R., Al Khourdajie, A., van Diemen, R., McCollum, D., Pathak, M., Some, S., Vyas, P., Fradera, R., et al., Eds.; Cambridge University Press: Cambridge, UK; New York, NY, USA, 2022. [Google Scholar] [CrossRef]
  13. Akompab, D.A.; Bi, P.; Williams, S.; Grant, J.; Walker, I.A.; Augoustinos, M. Heat waves and climate change: Applying the health belief model to identify predictors of risk perception and adaptive behaviours in Adelaide, Australia. Int. J. Environ. Res. Public Health 2013, 10, 2164–2184. [Google Scholar] [CrossRef]
  14. Ban, J.; Shi, W.; Cui, L.; Liu, X.; Jiang, C.; Han, L.; Wang, R.; Li, T. Health-risk perception and its mediating effect on protective behavioral adaptation to heat waves. Environ. Res. 2019, 172, 27–33. [Google Scholar] [CrossRef]
  15. Cutler, M.J.; Marlon, J.R.; Howe, P.D.; Leiserowitz, A. The influence of political ideology and socioeconomic vulnerability on perceived health risks of heat waves in the context of climate change. Weather. Clim. Soc. 2018, 10, 731–746. [Google Scholar] [CrossRef]
  16. Hass, A.L.; Ellis, K.N. Motivation for heat adaption: How perception and exposure affect individual behaviors during hot weather in Knoxville, Tennessee. Atmosphere 2019, 10, 591. [Google Scholar] [CrossRef]
  17. Li, H.; Guan, J.; Ye, H.; Yang, H. A survey of rural residents’ perception and response to health risks from hot weather in ethnic minority areas in southwest china. Int. J. Environ. Res. Public Health 2019, 16, 2190. [Google Scholar] [CrossRef]
  18. Ye, H.; Ma, J.; Wu, Y.; Zhang, Y. Perceptions of health risks from hot weather, and coping behaviors among ethnic minority groups in mountain areas of China: A case study in the tujia and Miao Autonomous Prefecture. Int. J. Environ. Res. Public Health 2018, 15, 2498. [Google Scholar] [CrossRef]
  19. Howe, P.D.; Marlon, J.R.; Wang, X.; Leiserowitz, A. Public perceptions of the health risks of extreme heat across US states, counties, and neighborhoods. Proc. Natl. Acad. Sci. USA 2019, 116, 6743–6748. [Google Scholar] [CrossRef] [PubMed]
  20. Rise, N.; Oura, C.; Drewry, J. Climate change and health in the Caribbean: A review highlighting research gaps and priorities. J. Clim. Change Health 2022, 8, 100126. [Google Scholar] [CrossRef]
  21. Rafael, M.-T.; Santos-Corrada, M.; Sandra, M. Perceptions of Climate Change in Puerto Rico before and after Hurricane Maria. Am. J. Clim. Change 2021, 10, 153–166. [Google Scholar] [CrossRef]
  22. Santos-Corrada, M.; Méndez-Tejeda, R. Public perception of climate change in a period of economic crisis in Puerto Rico. AIMS. Environ. Sci. 2017, 4, 83–93. [Google Scholar] [CrossRef]
  23. Estudios Tecnicos Inc. Estudio de Percepción Pública sobre el Riesgo y la Resiliencia al Cambio Climatico en Puerto Rico: Informe Final; Estudios Tecnicos Inc.: San Juan, Puerto Rico, 2018. [Google Scholar]
  24. Runkle, J.; Kunkel, K.E.; Stevens, L.E.; Champion, S.M.; Easterling, D.R.; Terando, A.; Sun, L.; Stewart, B.C.; Landers, G.; Rayne, S. Puerto Rico and the U.S. Virgin Islands State Climate Summary 2022; NOAA Technical Report NESDIS 150-PR; NOAA National Centers for Environmental Information: Silver Spring, MD, USA, 2022; pp. 1–5.
  25. Di Napoli, C.; Allen, T.; Méndez-Lázaro, P.A.; Pappenberger, F. Heat stress in the Caribbean: Climatology, drivers, and trends of human biometeorology indices. Int. J. Climatol. 2023, 43, 405–425. [Google Scholar] [CrossRef]
  26. Skinner, C.S.; Tiro, J.; Champion, V.L. The Health Belief Model. In Health Behavior: Theory, Research, and Practice; Glanz, K., Rimer, B.K., Viswanath, K., Eds.; Jossey-Bass: San Francisco, CA, USA, 2015; pp. 75–94. [Google Scholar]
  27. CEACC. Borrador Final del Plan de Mitigación, Adaptación y Resiliencia al Cambio Climático en Puerto Rico; Comité Expertos y Asesores Sobre Cambio Climático (CEACC): San Juan, PR, USA, 2024.
  28. Méndez-Lázaro, P.; Martínez-Sánchez, O.; Méndez-Tejeda, R.; Rodríguez, E.; Morales, E.; Schmitt-Cortijo, N. Extreme Heat Events in San Juan Puerto Rico: Trends and Variability of Unusual Hot Weather and its Possible Effects on Ecology and Society. J. Climatol. Weather. Forecast. 2015, 3, 2. [Google Scholar] [CrossRef]
  29. Brick, J.M.; Waksberg, J. Avoiding sequential sampling with random digit dialing. Surv. Methodol 1991, 17, 21–41. [Google Scholar]
  30. Patle, S.; Ghuge, V.V. Evolution and Performance Analysis of Thermal Comfort Indices for Tropical and Subtropical Region: A Comprehensive Literature Review. Int. J. Environ. Sci. Technol. 2024, 21, 10217–10258. [Google Scholar] [CrossRef]
  31. Johansson, E.; Yahia, M.W.; Arroyo, I.; Bengs, C. Outdoor thermal comfort in public space in warm-humid Guayaquil, Ecuador. Int. J. Biometeorol 2018, 62, 387–399. [Google Scholar] [CrossRef] [PubMed]
  32. Ratwatte, P.; Wehling, H.; Kovats, S.; Landeg, O.; Weston, D. Factors associated with older adults’ perception of health risks of hot and cold weather event exposure: A scoping review. Front. Public Health 2022, 10, 939859. [Google Scholar] [CrossRef]
  33. Sheridan, S.C. A survey of public perception and response to heat warnings across four North American cities: An evaluation of municipal effectiveness. Int. J. Biometeorol 2007, 52, 3–15. [Google Scholar] [CrossRef]
  34. Dahl, K.; Spanger-Siegfried, E.; Licker, R.; Caldas, A.; Abatzoglou, J.; Mailloux, N.; Cleetus, R.; Udvardy, S. Killer Heat in the United States: Climate Choices and the Future of Dangerously Hot Days; Union of Concerned Scientists: Cambridge, MA, USA, 2019. [Google Scholar]
Figure 1. Location of Puerto Rico in the Caribbean and delineation of study regions by municipality.
Ijerph 22 01197 g001
Figure 2. Outdoor heat discomfort and observed temperatures in San Juan, Puerto Rico. (a) Percentage of participants reporting the onset of outdoor heat discomfort by temperature range (F), based on survey responses. Percentages represent the first temperature range at which discomfort was perceived and are not cumulative. (b) Daily maximum temperature in San Juan (LM Marin International Airport, Station RQW00011641) for the year 2020, and mean thermal comfort threshold (89 °F) reported by survey participants (red dashed line).
Ijerph 22 01197 g002aIjerph 22 01197 g002b
Figure 3. Reported concerns related to high temperatures.
Ijerph 22 01197 g003
Table 1. Distribution of the study sample by region, age, and gender comparison of the adult population in Puerto Rico and persons sampled (N = 500).
CategoryPersons 21 Years of Age or Older (Puerto Rico) 1Percentage (%)Persons
Sampled 2
By Region
Metropolitan725,27728.4%142
Non-metropolitan1,827,38671.6%358
Total (Region)2,552,663100%500
By Gender and Age Group
Men 21 to 34 Years 301,07911.8%59
Men 35 to 49 Years304,85911.9%60
Men 50 to 64 Years302,69811.9%59
Men 65 Years or More278,72910.9%55
Women 21 to 34 Years 309,23812.1%60
Women 35 to 49 Years337,95413.2%66
Women 50 to 64 Years356,21214.0%70
Women 65 Years or More361,89414.2%71
Total (Gender and Age)2,552,663100%500
1 Source: U.S. Census Bureau, Puerto Rico Community Survey 2018 (5-year estimate), 2 One adult (21+) was randomly selected from each household for an interview.
Table 2. Sociodemographic characteristics of the survey participants (N = 500).
VariableCategoryFrequency (N)Percentage (%)
RegionMetropolitan14228.4%
Non-metropolitan35871.6%
GenderFemale23346.6%
Male26753.4%
Age (Years)21–3411923.8%
35–4912625.2%
50–6412925.8%
65 or More12625.2%
Education
(N = 498)
Less Than High School5210.4%
High School14128.3%
Assoc. Degree/Certificate7815.7%
Bachelor’s Degree15631.3%
Master’s or Doctoral Degree7114.3%
Employment Status
(N = 490)
Employed20742.2%
Unemployed10321.0%
Retired15130.8%
Unable to Work398.0%
Work Environment
(N = 207)
Interior13163.3%
Exterior2914.0%
Interior/Exterior4722.7%
Persons per Household 19318.6%
2 to 328156.2%
4 or More12625.2%
Health Insurance
(N = 495)
Yes47295.4%
No234.6%
Type of Health Insurance
(N = 495)
Private22645.7%
Public (Reforma)15531.3%
Medicare9118.4%
No Insurance234.6%
Table 3. Distribution of household size categories across age groups of respondents.
Household Size (Number of Persons)
Age GroupOne (1)Percentage (%)Two to ThreePercentage (%)Four or MorePercentage (%)Total
21–34 Years1412%6353%4235%119
35–49 Years1713%6552%4435%126
50–64 Years2822%7558%2620%129
65+ Years3427%7862%1411%126
Total93 281 126 500
Table 4. Health and chronic condition status (N = 500).
VariableCategoryFrequency (N)Percentage (%)
Health Status (Self-Reported)
(N = 499)
Excellent/Good34669.3%
Fair12725.5%
Poor/Very Poor265.2%
Number of Health Conditions
(N = 498)
None14729.5%
112725.5%
2 to 313326.7%
4 or More9118.3%
Type of Health Conditions
(N = 498)
Cardiovascular19940.0%
Metabolic15130.3%
Respiratory11623.3%
Neurological and Sleep Disorders18837.8%
Mental Health387.6%
Other Chronic Conditions357.0%
Table 5. Distribution of self-reported concern and perceived risk related to heat and climate threats.
VariableCategoryFrequency (N)Percentage (%)
Perceived Health Risk (N = 499)Low15731.5%
Moderate10721.4%
High23547.1%
Perceived Personal Likelihood of Heat-Related Illness (5 Years) (N = 479)Low27757.8%
Moderate8417.5%
High11824.6%
Perceived Family-Level Likelihood of Heat-Related Illness (5 Years) (N = 455)Low26658.5%
Moderate8318.2%
High10623.3%
Perceived Community-Level Likelihood of Heat-Related Illness (5 Years) (N = 329)Low15446.8%
Moderate8024.3%
High9528.9%
Climate-Change Concern (N = 497)Low418.2%
Moderate6112.3%
High39579.5%
High-Temperature Concern (N = 500)Low499.8%
Moderate5911.8%
High39278.4%
Heatwave Concern (N = 499)Low5611.2%
Moderate6212.4%
Table 6. Variables significantly associated with perceived health risk (Chi-squared test, p-value < 0.05).
VariablePerceived Health RiskFuture Personal Risk 1Future Family Risk 1Future Community Risk 1
Region0.0470.0900.1840.370
Age<0.0010.0010.0730.336
Gender<0.001<0.0010.0240.183
Educational Attainment0.1420.0230.2420.480
Employment Status0.0090.0020.0020.222
Occupational Environment0.2930.1380.0400.643
Health Status0.015<0.0010.0310.132
Number of Health Conditions0.001<0.0010.0740.039
2 or More Chronic Conditions0.031<0.0010.0150.007
3 or More Chronic Conditions0.002<0.0010.0050.029
4 or More Chronic Conditions<0.001<0.0010.0930.313
Experienced Heat-Related Symptoms<0.001<0.001<0.001<0.001
Experienced Heat Discomfort while Sleeping0.0180.006<0.001<0.001
Visit Public Place (to Cool Off)0.3120.3850.0080.045
1 Perceived risk of heat-related illness (5 years). Only variables with statistically significant associations (p < 0.05) according to the Chi-squared test are shown. Values in bold indicate statistical significance.
Table 7. Perceived heat exposure and heat-related behaviors.
VariableCategoryFrequency (N)Percentage (%)
Experienced Heat-Related Symptoms (N = 500)No28256.4%
Yes21843.6%
Frequency of Symptoms (N = 218)1–2 times9744.5%
2–4 times7433.9%
5 or more4721.6%
Visited Public Places to Cool Off (N = 496)No27555.4%
Yes22144.6%
Frequency of Visits
(N = 221)
Low 13962.9%
High8237.1%
Experienced Heat Discomfort while Sleeping (N = 498)No15931.9%
Yes33968.1%
Frequency Heat Discomfort while Sleeping (N = 339)Low 23368.7%
High10631.3%
Heat Mitigation Behaviors
(N = 497)
AC31964.2%
Fans41884.1%
Window/Door Opening19739.6%
Others234.6%
AC Usage (Hours per Day) (N = 306)<8 h5919.3%
8–12 h10935.6%
13–24 h13845.1%
Uncomfortable Outdoor Temperature (N = 408)≤85 °F11227.5%
≥86 °F29672.5%
Table 8. Profile of heat-sensitive and -vulnerable populations in Puerto Rico.
Health Risk Perception (Category with the Highest Percentage (%))
VariableHighPercentage (%)LowPercentage (%)p-Value *
RegionNon-metropolitan48.7Metropolitan39.40.047
GenderMale55.8Female37.9<0.001
Age (Years)50–6463.365+38.9<0.001
Educational Level<High School59.6Graduate Studies380.142
Persons per Household4 or More49.61 (Living Alone)40.60.310
Employment StatusUnable to Work75.0Retired35.10.009
Working EnvironmentExterior55.2Interior38.20.293
Health StatusRegular58.7Excellent/Good35.80.015
Number of Conditions4 or More65.6None35.40.001
Heat-Related SymptomsYes66.8No43.3<0.001
Uncomfortable Sleep Temp.Yes50.9No39.60.018
Thermal Discomfort<86 °F51.8≥86 °F27.80.856
Heat-Related Symptoms (Category with the Highest Percentage (%))
VariableYesPercentage (%)NoPercentage (%)p-Value *
RegionNon-metropolitan45.5Metropolitan61.30.167
GenderMale48.3Female61.80.023
Age (Years)50–6451.965+61.10.149
Educational Level<High School59.6Graduate Studies66.20.034
Persons per Household4 or More48.42 to 358.70.405
Employment StatusUnable to Work69.0Employed61.40.010
Working EnvironmentInterior/Exterior46.8Interior64.90.350
Health StatusRegular67.7Excellent/Good66.5<0.001
Number of Conditions4 or More67.0None70.1<0.001
Uncomfortable Sleep Temp.Yes48.7No67.3<0.001
Thermal Discomfort<86 °F52.7≥86 °F53.70.249
* Bolded values indicate statistical significances at p < 0.05 in chi-squared tests.
Table 9. Multinomial logistic regression models for perceived heat-related health risks.
OR (Adjusted)95% CIp-Value
1. Perceived Health Risk Associated with Heat
 Region
   Metropolitan1.00
   Non-metropolitan1.69(1.00, 2.84)0.047
 Age
  21–34 Years1.00
  35–49 Years1.40(0.73,2.70)0.319
  50–64 Years3.59(1.66, 7.77)0.001
  65+ Years1.29(0.50, 3.33)0.596
 Gender
  Female1.00
  Male2.00(1.24, 3.23)0.005
 Experienced Heat-Related Symptoms
  No1.00
  Yes4.94(2.93, 8.34)0.000
(Number of obs. = 484; LR chi2 (30) = 126.04; prob. > chi2 = <0.001; pseudo R2 = 0.1246)
2. Perceived Individual Risk of Heat-Related Illness (5 Years)
 Age
  21–34 Years1.00
  35–49 Years1.45(0.63, 3.38)0.385
  50–64 Years2.78(1.25, 6.19)0.012
  65+ Years0.959(0.39, 2.34)0.928
 Gender
  Female1.00
  Male3.28(1.81, 5.93)0.000
 Experienced Heat-Related Symptoms
  No1.00
  Yes2.98(1.66, 5.36)0.000
(Number of obs. = 385; LR chi2 (34) = 109.39; prob. > chi2 = <0.001; pseudo R2 = 0.1433)
3. Perceived Family Risk of Heat-Related Illness (5 Years)
 Gender
  Female1.00
  Male1.82(1.01, 3.27)0.045
 Experienced Heat-Related Symptoms
  No1.00
  Yes3.43(1.91, 6.16)0.000
(Number of obs. = 352; LR chi2 (34) = 77.77; prob. > chi2 = <0.001; pseudo R2 = 0.1108)
4. Perceived Community Risk of Heat-Related Illness (5 Years)
 Experienced Heat-Related Symptoms
  No1.00
  Yes2.56(1.42, 4.62)0.002
 Slept in Heat Discomfort
  No1.00
  Yes2.53(1.34, 4.79)0.004
(Number of obs. = 321; LR chi2 (26) = 57.01; prob. > chi2 = 0.004; pseudo R2 = 0.0840)
All the models used low levels of perceived risk as the reference categories. The odds ratios (ORs) shown represent the likelihood of reporting high levels of perceived risk compared to low levels of perceived risk. The results for the moderate-risk category were excluded from the table to avoid redundancy, as they were fewer and less consistent. Values in bold indicate statistical significance. Only variables with p < 0.05 in the adjusted model are shown. Adjusted models included the following covariates: 1: region, age, gender, employment status, health status, number of chronic conditions, experienced heat-related symptoms, and slept in heat discomfort; 2: region, age, gender, educational level, health status, number of chronic conditions, experienced heat-related symptoms, slept in heat discomfort, and thermal discomfort threshold; 3: region, age, gender, employment status, health status, number of chronic conditions, experienced heat-related symptoms, slept in heat discomfort, visited a public place to cool down, and thermal discomfort threshold; 4: region, gender, health status, number of chronic conditions, experienced heat-related symptoms, slept in heat discomfort, and visited a public place to cool down.
Table 10. Binary logistic regression models for heat-related symptoms.
VariableUnadjusted OR(95% CI)p-ValueAdjusted OR *(95% CI)p-Value
 Gender
  Female1.00
  Male1.51(1.06, 2.16)0.0231.37(0.89, 2.11)0.150
 Education
  Less Than High School1.00 1.00
  High School0.53(0.28, 1.01)0.0550.71(0.32, 1.58)0.396
  Associate Degree or Certificate0.68(0.33, 1.38)0.2821.07(0.44, 2.60)0.878
  Bachelor′s Degree0.45(0.24, 0.85)0.0140.81(0.34, 1.92)0.636
  Graduate Degree0.35(0.16, 0.73)0.0050.70(0.27, 1.86)0.479
 Employment Status
  Employed1.00 1.00
  Unemployed1.5(0.93, 2.41)0.0970.89(0.49, 1.63)
  Retired1.07(0.70, 1.65)0.7380.87(0.41, 1.86)
  Unable to Work3.52(1.53, 8.13)0.0031.15(0.41, 3.29)0.788
 Health Status
  Excellent/Good1.00
  Fair4.15(2.70, 6.42)0.0003.07(1.79, 5.25)0.000
  Poor/Very Poor3.17(1.39, 7.21)0.0062.08(0.73, 5.90)0.170
 Number of Chronic Conditions
  None1.00
  1 Condition1.38(0.83, 2.28)0.2161.30(0.74, 2.33)0.360
  2–3 Conditions2.30(1.41, 3.76)0.0011.95(1.07, 3.56)0.029
  4 or More Conditions4.75(2.71, 8.35)0.0003.09(1.48, 6.42)0.003
 Health Insurance Type
  Private1.00
  Public (Reforma)1.97(1.31, 2.99)0.0011.29(0.76, 2.21)0.338
  Medicare1.06(0.65, 1.75)0.803
 Slept in Heat Discomfort
  No1.00
  Yes1.95(1.32, 2.89)0.0012.11(1.31, 3.41)0.002
 Use AC
  No1.00
  Yes0.62(0.43, 0.90)0.0120.84(0.51, 1.39)0.508
Only variables with p < 0.05 in unadjusted regressions are included. Adjusted ORs are from a multivariate model including the following covariates: age, gender, employment status, educational level, health status, number of chronic conditions, AC use, slept in heat discomfort, and type of health insurance. Bolded values indicate statistical significance at p < 0.05 in adjusted model. * Model statistics: Number of obs. = 458; LR chi2 (20) = 87.69; prob. > chi2 =< 0.001; pseudo R2 = 0.1398.
Disclaimer/Publisher’s Note: The statements, opinions and data contained in all publications are solely those of the individual author(s) and contributor(s) and not of MDPI and/or the editor(s). MDPI and/or the editor(s) disclaim responsibility for any injury to people or property resulting from any ideas, methods, instructions or products referred to in the content.

