
Assessing Heat–Health Vulnerability Through Temporal, Demographic, and Spatial Lenses: A Time-Stratified Case-Crossover Analysis in New York State


Abstract
1. Introduction
2. Materials and Methods
2.1. Study Design and Population
2.2. Health Outcomes
2.3. Air Temperature
2.4. Air Pollution
2.5. Stratification Factors
2.6. Statistical Analysis
3. Results
4. Discussion
5. Conclusions
Supplementary Materials
Author Contributions
Funding
Institutional Review Board Statement
Informed Consent Statement
Data Availability Statement
Acknowledgments
Conflicts of Interest
References
- Rosenzweig, C.; Solecki, W.; DeGaetano, A.; O’Grady, M.; Hassol, S.; Grabhorn, P. Responding to Climate Change in New York State: The ClimAID Integrated Assessment for Effective Climate Change Adaptation; Technical Report; New York State Research and Development Authority (NYSERDA): Albany, NY, USA, 2011. [Google Scholar]
- Lamie, C.; Bader, D.; Graziano, K.; Horton, R.; John, K.; O’Hern, N.; Spungin, S.; Stevens, A. New York State Climate Impacts Assessment Chapter 02: New York State’s Changing Climate. Ann. N. Y. Acad. Sci. 2024, 1542, 91–145. [Google Scholar] [CrossRef]
- Gronlund, C.J. Racial and socioeconomic disparities in heat-related health effects and their mechanisms: A review. Curr. Epidemiol. Rep. 2014, 1, 165–173. [Google Scholar] [CrossRef]
- Kingsley, S.L.; Eliot, M.N.; Gold, J.; Vanderslice, R.R.; Wellenius, G.A. Current and Projected Heat-Related Morbidity and Mortality in Rhode Island. Environ. Health Perspect. 2016, 124, 460–467. [Google Scholar] [CrossRef]
- Nayak, S.G.; Shrestha, S.; Kinney, P.L.; Ross, Z.; Sheridan, S.C.; Pantea, C.I.; Hsu, W.H.; Muscatiello, N.; Hwang, S.A. Development of a heat vulnerability index for New York State. Public Health 2018, 161, 127–137. [Google Scholar] [CrossRef]
- Noe, R.S.; Jin, J.O.; Wolkin, A.F. Exposure to natural cold and heat: Hypothermia and hyperthermia Medicare claims, United States, 2004–2005. Am. J. Public Health 2012, 102, e11–e18. [Google Scholar] [CrossRef]
- Gronlund, C.J.; Zanobetti, A.; Wellenius, G.A.; Schwartz, J.D.; O’Neill, M.S. Vulnerability to Renal, Heat and Respiratory Hospitalizations During Extreme Heat Among U.S. Elderly. Clim. Change 2016, 136, 631–645. [Google Scholar] [CrossRef]
- Harlan, S.L.; Brazel, A.J.; Prashad, L.; Stefanov, W.L.; Larsen, L. Neighborhood microclimates and vulnerability to heat stress. Soc. Sci. Med. 2006, 63, 2847–2863. [Google Scholar] [CrossRef]
- O’Neill, M.S.; Zanobetti, A.; Schwartz, J. Disparities by race in heat-related mortality in four US cities: The role of air conditioning prevalence. J. Urban Health Bull. N. Y. Acad. Med. 2005, 82, 191–197. [Google Scholar] [CrossRef]
- Manware, M.; Dubrow, R.; Carrión, D.; Ma, Y.; Chen, K. Residential and Race/Ethnicity Disparities in Heat Vulnerability in the United States. GeoHealth 2022, 6, e2022GH000695. [Google Scholar] [CrossRef]
- Vaidyanathan, A.; Gates, A.; Brown, C.; Prezzato, E.; Bernstein, A. Heat-Related Emergency Department Visits—United States, May–September 2023. MMWR. Morb. Mortal. Wkly. Rep. 2024, 73, 324–329. [Google Scholar] [CrossRef]
- Sun, S.; Weinberger, K.R.; Nori-Sarma, A.; Spangler, K.R.; Sun, Y.; Dominici, F.; Wellenius, G.A. Ambient heat and risks of emergency department visits among adults in the United States: Time stratified case crossover study. BMJ 2021, 375, e065653. [Google Scholar] [CrossRef]
- Adeyeye, T.E.; Insaf, T.Z.; Al-Hamdan, M.Z.; Nayak, S.G.; Stuart, N.; DiRienzo, S.; Crosson, W.L. Estimating policy-relevant health effects of ambient heat exposures using spatially contiguous reanalysis data. Environ. Health A Glob. Access Sci. Source 2019, 18, 35. [Google Scholar] [CrossRef]
- Statewide Planning and Research Cooperative System. (2024). Overview. Available online: https://www.health.ny.gov/statistics/sparcs/ (accessed on 15 May 2025).
- North American Land Data Assimilation System. NLDAS-2 Forcing Dataset Information. Available online: https://ldas.gsfc.nasa.gov/nldas/v2/forcing (accessed on 16 April 2025).
- Cosgrove, B.A.; Lohmann, D.; Mitchell, K.E.; Houser, P.R.; Wood, E.F.; Schaake, J.C.; Robock, A.; Marshall, C.; Sheffield, J.; Duan, Q.; et al. Real-time and retrospective forcing in the North American Land Data Assimilation System (NLDAS) project. J. Geophys. Res. Atmos. 2003, 108, GCP 3-1–GCP 3-12. [Google Scholar] [CrossRef]
- North American Land Data Assimilation System. NLDAS-2 Forcing Download Information. Available online: https://ldas.gsfc.nasa.gov/nldas/nldas-2-forcing-data (accessed on 16 April 2025).
- United States Environmental Protection Agency. RSIG-Related Downloadable Data Files. Available online: https://www.epa.gov/hesc/rsig-related-downloadable-data-files (accessed on 11 January 2025).
- United States Department of Agriculture Economic Research Service. Rural-Urban Commuting Area Codes. Available online: https://www.ers.usda.gov/data-products/rural-urban-commuting-area-codes/ (accessed on 22 April 2025).
- WWAMI Rural Health Research Center. RUCA Data: Using RUCA Data. Available online: https://depts.washington.edu/uwruca/ruca-uses.php (accessed on 29 May 2025).
- Carracedo-Martínez, E.; Taracido, M.; Tobias, A.; Saez, M.; Figueiras, A. Case-crossover analysis of air pollution health effects: A systematic review of methodology and application. Environ. Health Perspect. 2010, 118, 1173–1182. [Google Scholar] [CrossRef]
- Janes, H.; Sheppard, L.; Lumley, T. Overlap bias in the case-crossover design, with application to air pollution exposures. Stat. Med. 2005, 24, 285–300. [Google Scholar] [CrossRef]
- Maclure, M. The case-crossover design: A method for studying transient effects on the risk of acute events. Am. J. Epidemiol. 1991, 133, 144–153. [Google Scholar] [CrossRef]
- Zhou, W.; Wang, Q.; Li, R.; Kadier, A.; Wang, W.; Zhou, F.; Ling, L. Combined effects of heatwaves and air pollution, green space and blue space on the incidence of hypertension: A national cohort study. Sci. Total Environ. 2023, 867, 161560. [Google Scholar] [CrossRef]
- Zhou, L.; Wang, Y.; Wang, Q.; Ding, Z.; Jin, H.; Zhang, T.; Zhu, B. The interactive effects of extreme temperatures and PM(2.5) pollution on mortalities in Jiangsu Province, China. Sci. Rep. 2023, 13, 9479. [Google Scholar] [CrossRef]
- Xu, R.; Huang, S.; Shi, C.; Wang, R.; Liu, T.; Li, Y.; Zheng, Y.; Lv, Z.; Wei, J.; Sun, H.; et al. Extreme Temperature Events, Fine Particulate Matter, and Myocardial Infarction Mortality. Circulation 2023, 148, 312–323. [Google Scholar] [CrossRef]
- Dear, K.; Ranmuthugala, G.; Kjellström, T.; Skinner, C.; Hanigan, I. Effects of temperature and ozone on daily mortality during the August 2003 heat wave in France. Arch. Environ. Occup. Health 2005, 60, 205–212. [Google Scholar] [CrossRef]
- Osilla, E.V.; Marsidi, J.L.; Shumway, K.R.; Sharma, S. Physiology, Temperature Regulation. Available online: https://www.ncbi.nlm.nih.gov/books/NBK507838/ (accessed on 29 May 2025).
- Kenny, G.P.; Wilson, T.E.; Flouris, A.D.; Fujii, N. Chapter 31—Heat exhaustion. In Handbook of Clinical Neurology; Romanovsky, A.A., Ed.; Elsevier: Amsterdam, The Netherlands, 2018; Volume 157, pp. 505–529. [Google Scholar]
- Jian, Y.; Liu, J.; Pei, Z.; Chen, J. Occupants’ tolerance of thermal discomfort before turning on air conditioning in summer and the effects of age and gender. J. Build. Eng. 2022, 50, 104099. [Google Scholar] [CrossRef]
- United States Centers for Disease Control and Prevention. Acclimatization. Available online: https://www.cdc.gov/niosh/heat-stress/recommendations/acclimatization.html (accessed on 29 June 2025).
- Meade, R.D.; Akerman, A.P.; Notley, S.R.; McGinn, R.; Poirier, P.; Gosselin, P.; Kenny, G.P. Physiological factors characterizing heat-vulnerable older adults: A narrative review. Environ. Int. 2020, 144, 105909. [Google Scholar] [CrossRef] [PubMed]
- Gamble, J.L.; Balbus, J.; Berger, M.; Bouye, K.; Campbell, V.; Chief, K.; Conlon, K.; Crimmins, A.; Flanagan, B.; Gonzalez-Maddux, C.; et al. Ch. 9: Populations of Concern. In The Impacts of Climate Change on Human Health in the United States: A Scientific Assessment; U.S. Global Change Research Program: Washington, DC, USA, 2016; pp. 247–286. [Google Scholar]
- United States Environmental Protection Agency. Climate Change and the Health of Older Adults. Available online: https://www.epa.gov/climateimpacts/climate-change-and-health-older-adults (accessed on 11 March 2025).
- United States Centers for Disease Control and Prevention. Fairness in Climate Adaptation Planning. Available online: https://www.cdc.gov/climate-health/php/brace/jedi.html?CDC_AAref_Val=https://www.cdc.gov/climateandhealth/JEDI.htm (accessed on 11 March 2025).
- Ahn, M.; Keith, L.; Brown, H. Rural heat health disparities: Evidence from the U.S. National EmergencyMedical Services Information System (NEMSIS). J. Clim. Change Health 2025, 22, 100432. [Google Scholar] [CrossRef]
- Wickerson, G.; Preston, T.; Hernandez, P. Extreme Heat is Not Just an Urban Threat: The Risk to Rural Communities. Available online: https://headwaterseconomics.org/natural-hazards/extreme-heat-risk-to-rural-communities/ (accessed on 19 May 2025).
- Stevens, A., Lamie, C., Eds. New York State Climate Impacts Assessment: Understanding and Preparing for our Changing Climate. Available online: https://nysclimateimpacts.org (accessed on 29 June 2025).
- Clark, A.; Grineski, S.; Curtis, D.S.; Cheung, E.S.L. Identifying groups at-risk to extreme heat: Intersections of age, race/ethnicity, and socioeconomic status. Environ. Int. 2024, 191, 108988. [Google Scholar] [CrossRef]
- Caldwell, J.T.; Ford, C.L.; Wallace, S.P.; Wang, M.C.; Takahashi, L.M. Intersection of Living in a Rural Versus Urban Area and Race/Ethnicity in Explaining Access to Health Care in the United States. Am. J. Public Health 2016, 106, 1463–1469. [Google Scholar] [CrossRef]
- Probst, J.C.; Moore, C.G.; Glover, S.H.; Samuels, M.E. Person and place: The compounding effects of race/ethnicity and rurality on health. Am. J. Public Health 2004, 94, 1695–1703. [Google Scholar] [CrossRef]
- Aggarwal, R.; Chiu, N.; Loccoh, E.C.; Kazi, D.S.; Yeh, R.W.; Wadhera, R.K. Rural-Urban Disparities: Diabetes, Hypertension, Heart Disease, and Stroke Mortality Among Black and White Adults, 1999–2018. J. Am. Coll. Cardiol. 2021, 77, 1480–1481. [Google Scholar] [CrossRef]
- New York State Department of Health. Extreme Heat Advice. Available online: https://www.health.ny.gov/environmental/emergency/weather/hot/ (accessed on 23 July 2024).
- New York City Department of Health and Mental Hygiene. Hot Weather and Your Health. Available online: https://www.nyc.gov/site/doh/health/emergency-preparedness/emergencies-extreme-weather-heat.page (accessed on 23 July 2024).
- New York State Office of Temporary and Disability Assistance. Home Energy Assistance Program (HEAP). Available online: https://otda.ny.gov/programs/heap/ (accessed on 12 March 2025).
- New York State Department of Health. Essential Plan Cooling Program. Available online: https://info.nystateofhealth.ny.gov/CoolingProgram (accessed on 27 June 2025).
- New York State Department of Labor. Protecting Outdoor Workers from Extreme Weather: Extreme Heat. Available online: https://dol.ny.gov/system/files/documents/2024/08/p198-extreme-heat-8-5-24.pdf (accessed on 27 June 2025).
- New York State Department of Environmental Conservation. Adapting to Extreme Heath in New York State—Extreme Heat Action Plan: Adaptation Agenda for 2024–2030. Available online: https://dec.ny.gov/environmental-protection/climate-change/effects-impacts/extreme-heat (accessed on 29 June 2025).
- National Weather Service: National Oceanic and Atmospheric Administration. NWS HeatRisk. Available online: https://www.wpc.ncep.noaa.gov/heatrisk/ (accessed on 11 March 2025).
- New York State Mesonet. NYS Mesonet History. Available online: https://nysmesonet.org/about/history (accessed on 11 March 2025).


| Heat-Related Illness a | ||
|---|---|---|
| n (%) | Rate b | |
| Cases | 23,853 (23.49) | 10.1 |
| Control Days | 77,678 (76.51) | |
| Inpatient | 3247 (13.61) | 1.4 |
| Emergency Department | 20,606 (86.39) | 10.1 |
| Case Month | ||
| May | 2186 (9.16) | 0.9 |
| June | 5091 (21.34) | 2.2 |
| July | 10,614 (44.50) | 4.5 |
| August | 4085 (17.13) | 1.7 |
| September | 1877 (7.87) | 0.8 |
| Age in years, Mean (SD) | 43 (23.31) | |
| Age, years | ||
| ≤4 | 458 (1.92) | 3.2 |
| 5–19 | 3911 (16.40) | 9.0 |
| 20–44 | 8561 (35.89) | 10.5 |
| 45–64 | 5964 (25.00) | 9.4 |
| 65–84 | 3843 (16.11) | 13.3 |
| ≥85 | 1116 (4.68) | 22.2 |
| Sex | ||
| Male | 13,992 (58.66) | 12.2 |
| Female | 9861 (41.34) | 8.1 |
| Race/Ethnicity | ||
| White, non-Hispanic | 13,707 (57.46) | 10.2 |
| Hispanic | 2889 (12.11) | 6.7 |
| Black, non-Hispanic | 3994 (16.74) | 11.8 |
| Asian/Pacific Islander | 380 (1.59) | 2.0 |
| Other c | 1577 (6.61) | 26.9 |
| Missing | 1306 (5.47) | |
| Urbanicity d | ||
| Urban | 20,685 (86.72) | 10.0 |
| Rural | 3168 (13.28) | 11.3 |
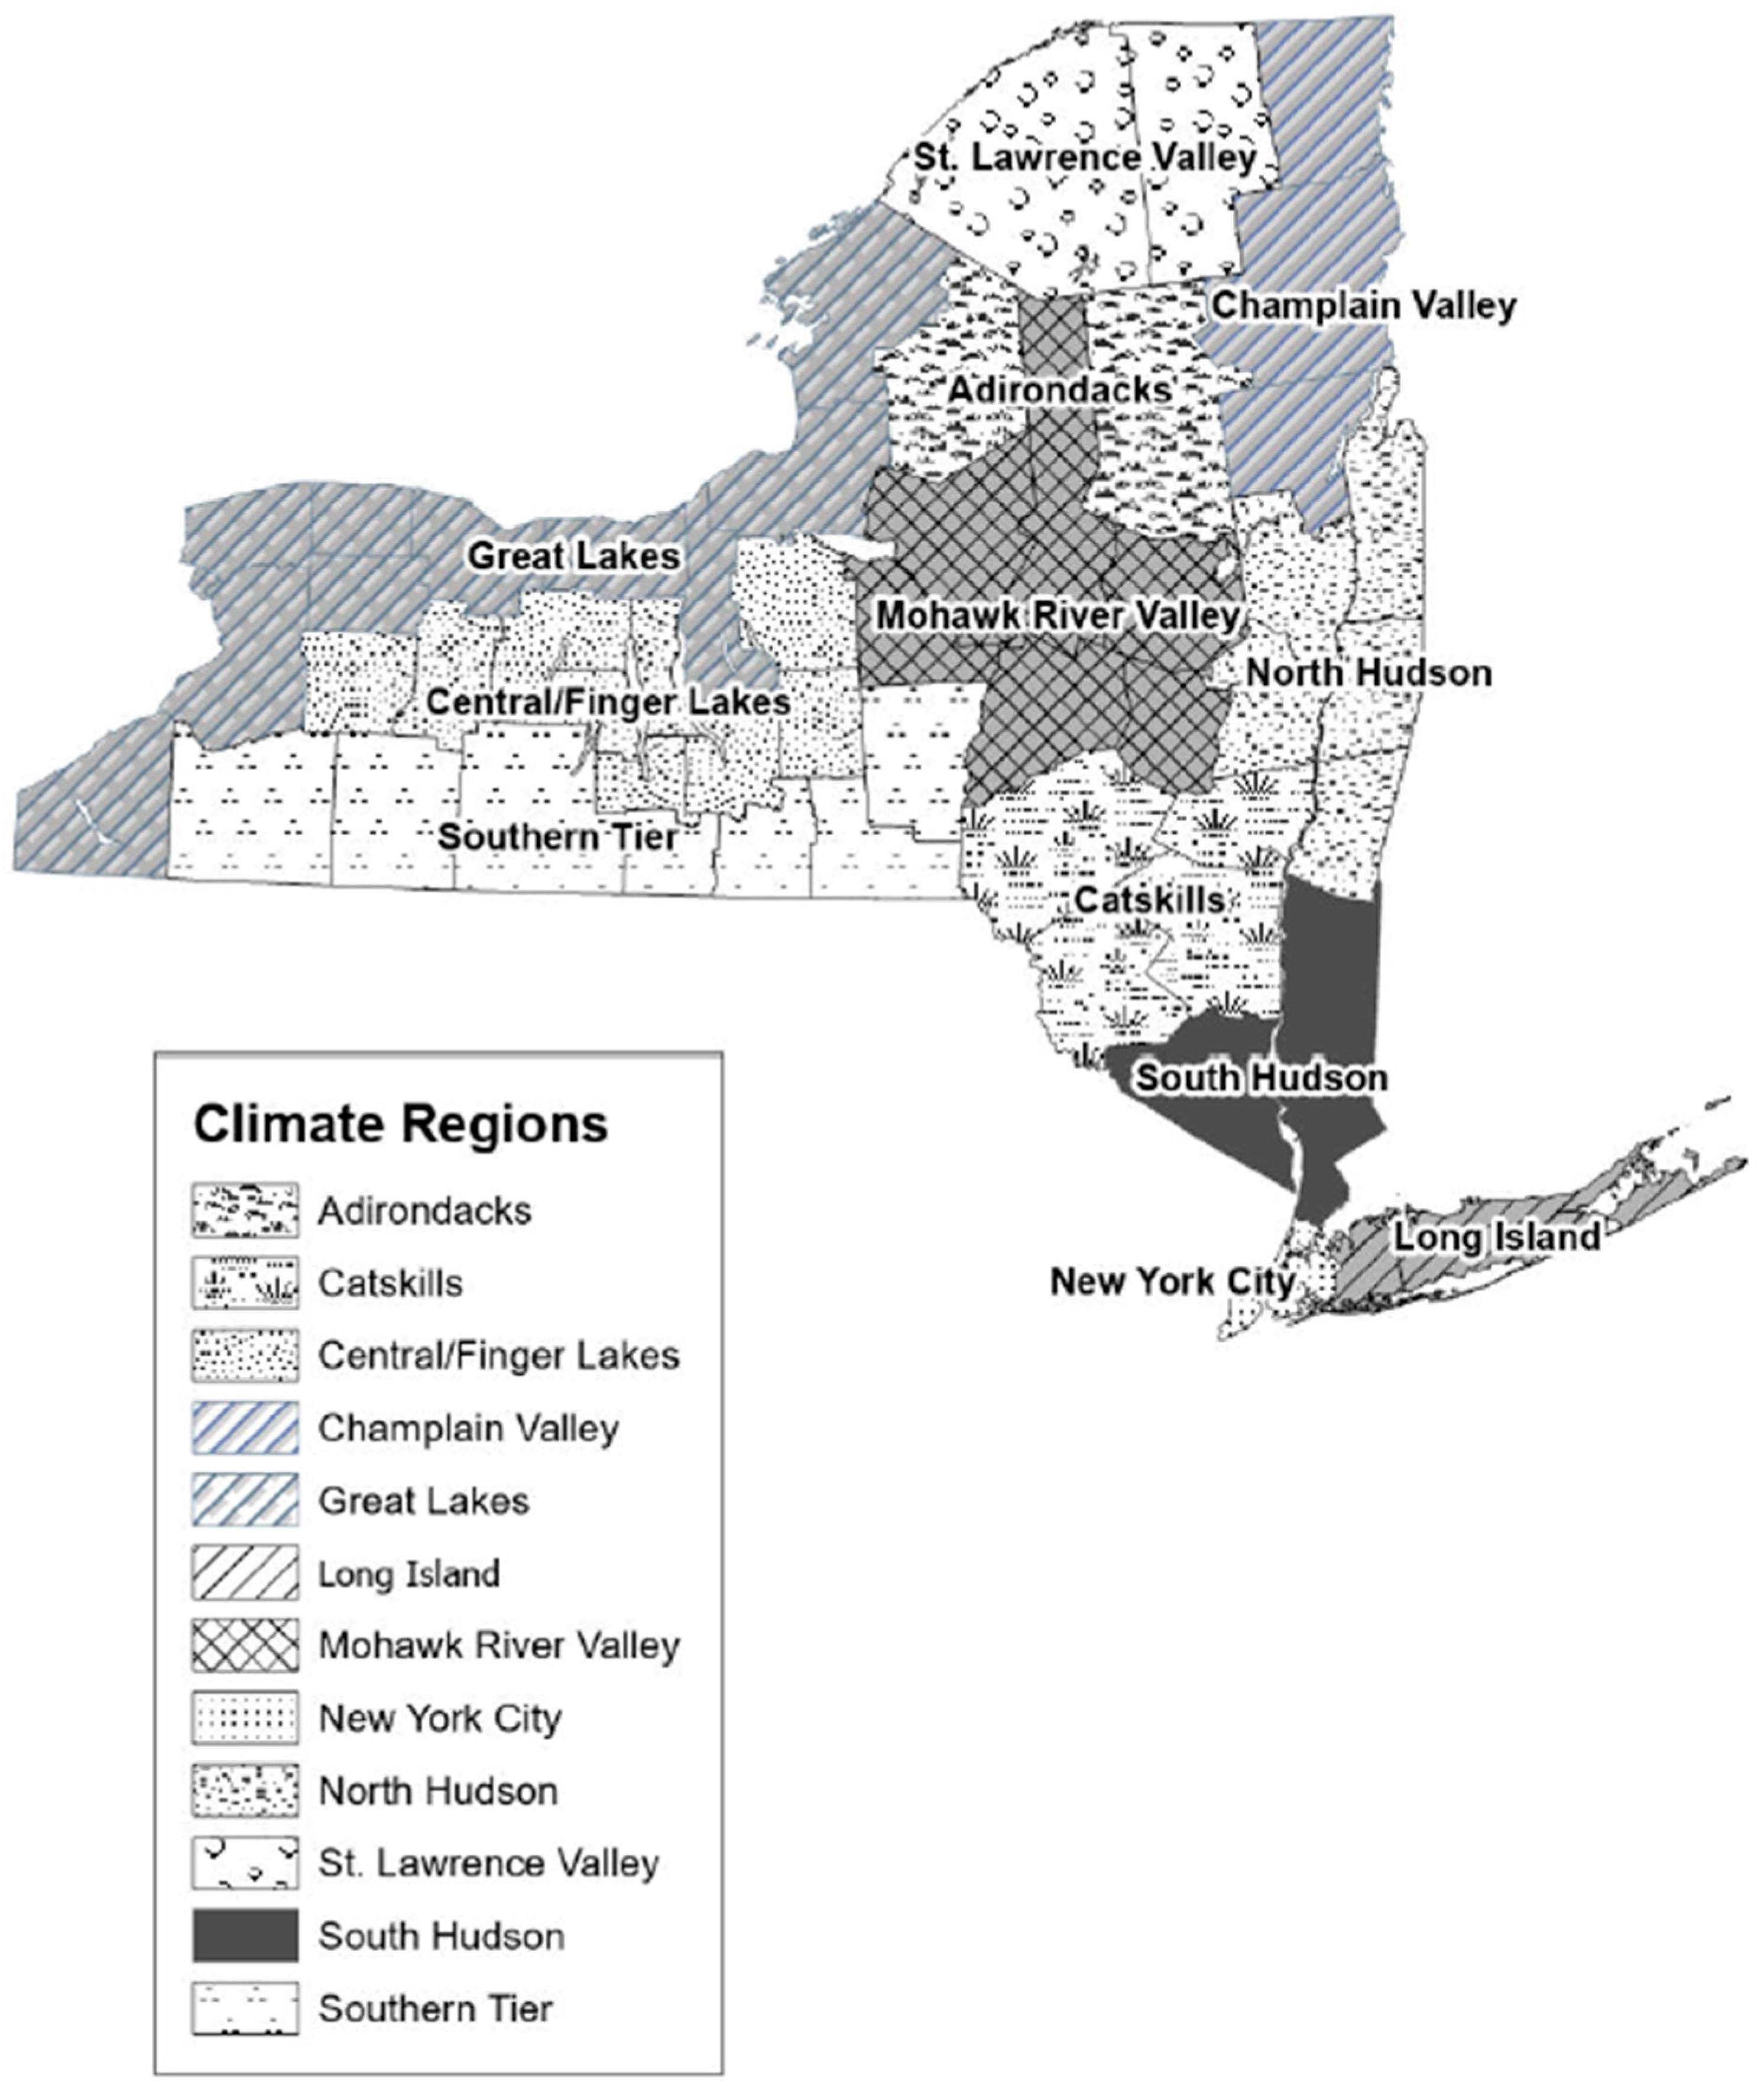
| Climate Region e | ||
| Adirondacks | 36 (0.15) | 9.4 |
| Catskills | 552 (2.31) | 13.0 |
| Central/Finger Lakes | 1391 (5.83) | 12.7 |
| Champlain Valley | 337 (1.41) | 15.1 |
| Great Lakes | 3509 (14.71) | 11.6 |
| Long Island | 3819 (16.01) | 11.1 |
| Mohawk River Valley | 899 (3.77) | 13.2 |
| New York City | 7595 (31.84) | 7.5 |
| North Hudson | 1386 (5.81) | 11.9 |
| South Hudson | 2889 (12.11) | 11.7 |
| Southern Tier | 1113 (4.67) | 15.2 |
| St. Lawrence Valley | 324 (1.36) | 16.5 |
| Missing | 3 (0.01) | |
| Heat-Related Illness a | |
|---|---|
| RR b (CI c) | |
| All | 1.71 (1.68, 1.73) |
| Month | |
| May | 1.81 (1.72, 1.90) |
| June | 1.69 (1.64, 1.74) |
| July | 1.64 (1.60, 1.67) |
| August | 1.86 (1.79, 1.94) |
| September | 1.75 (1.66, 1.84) |
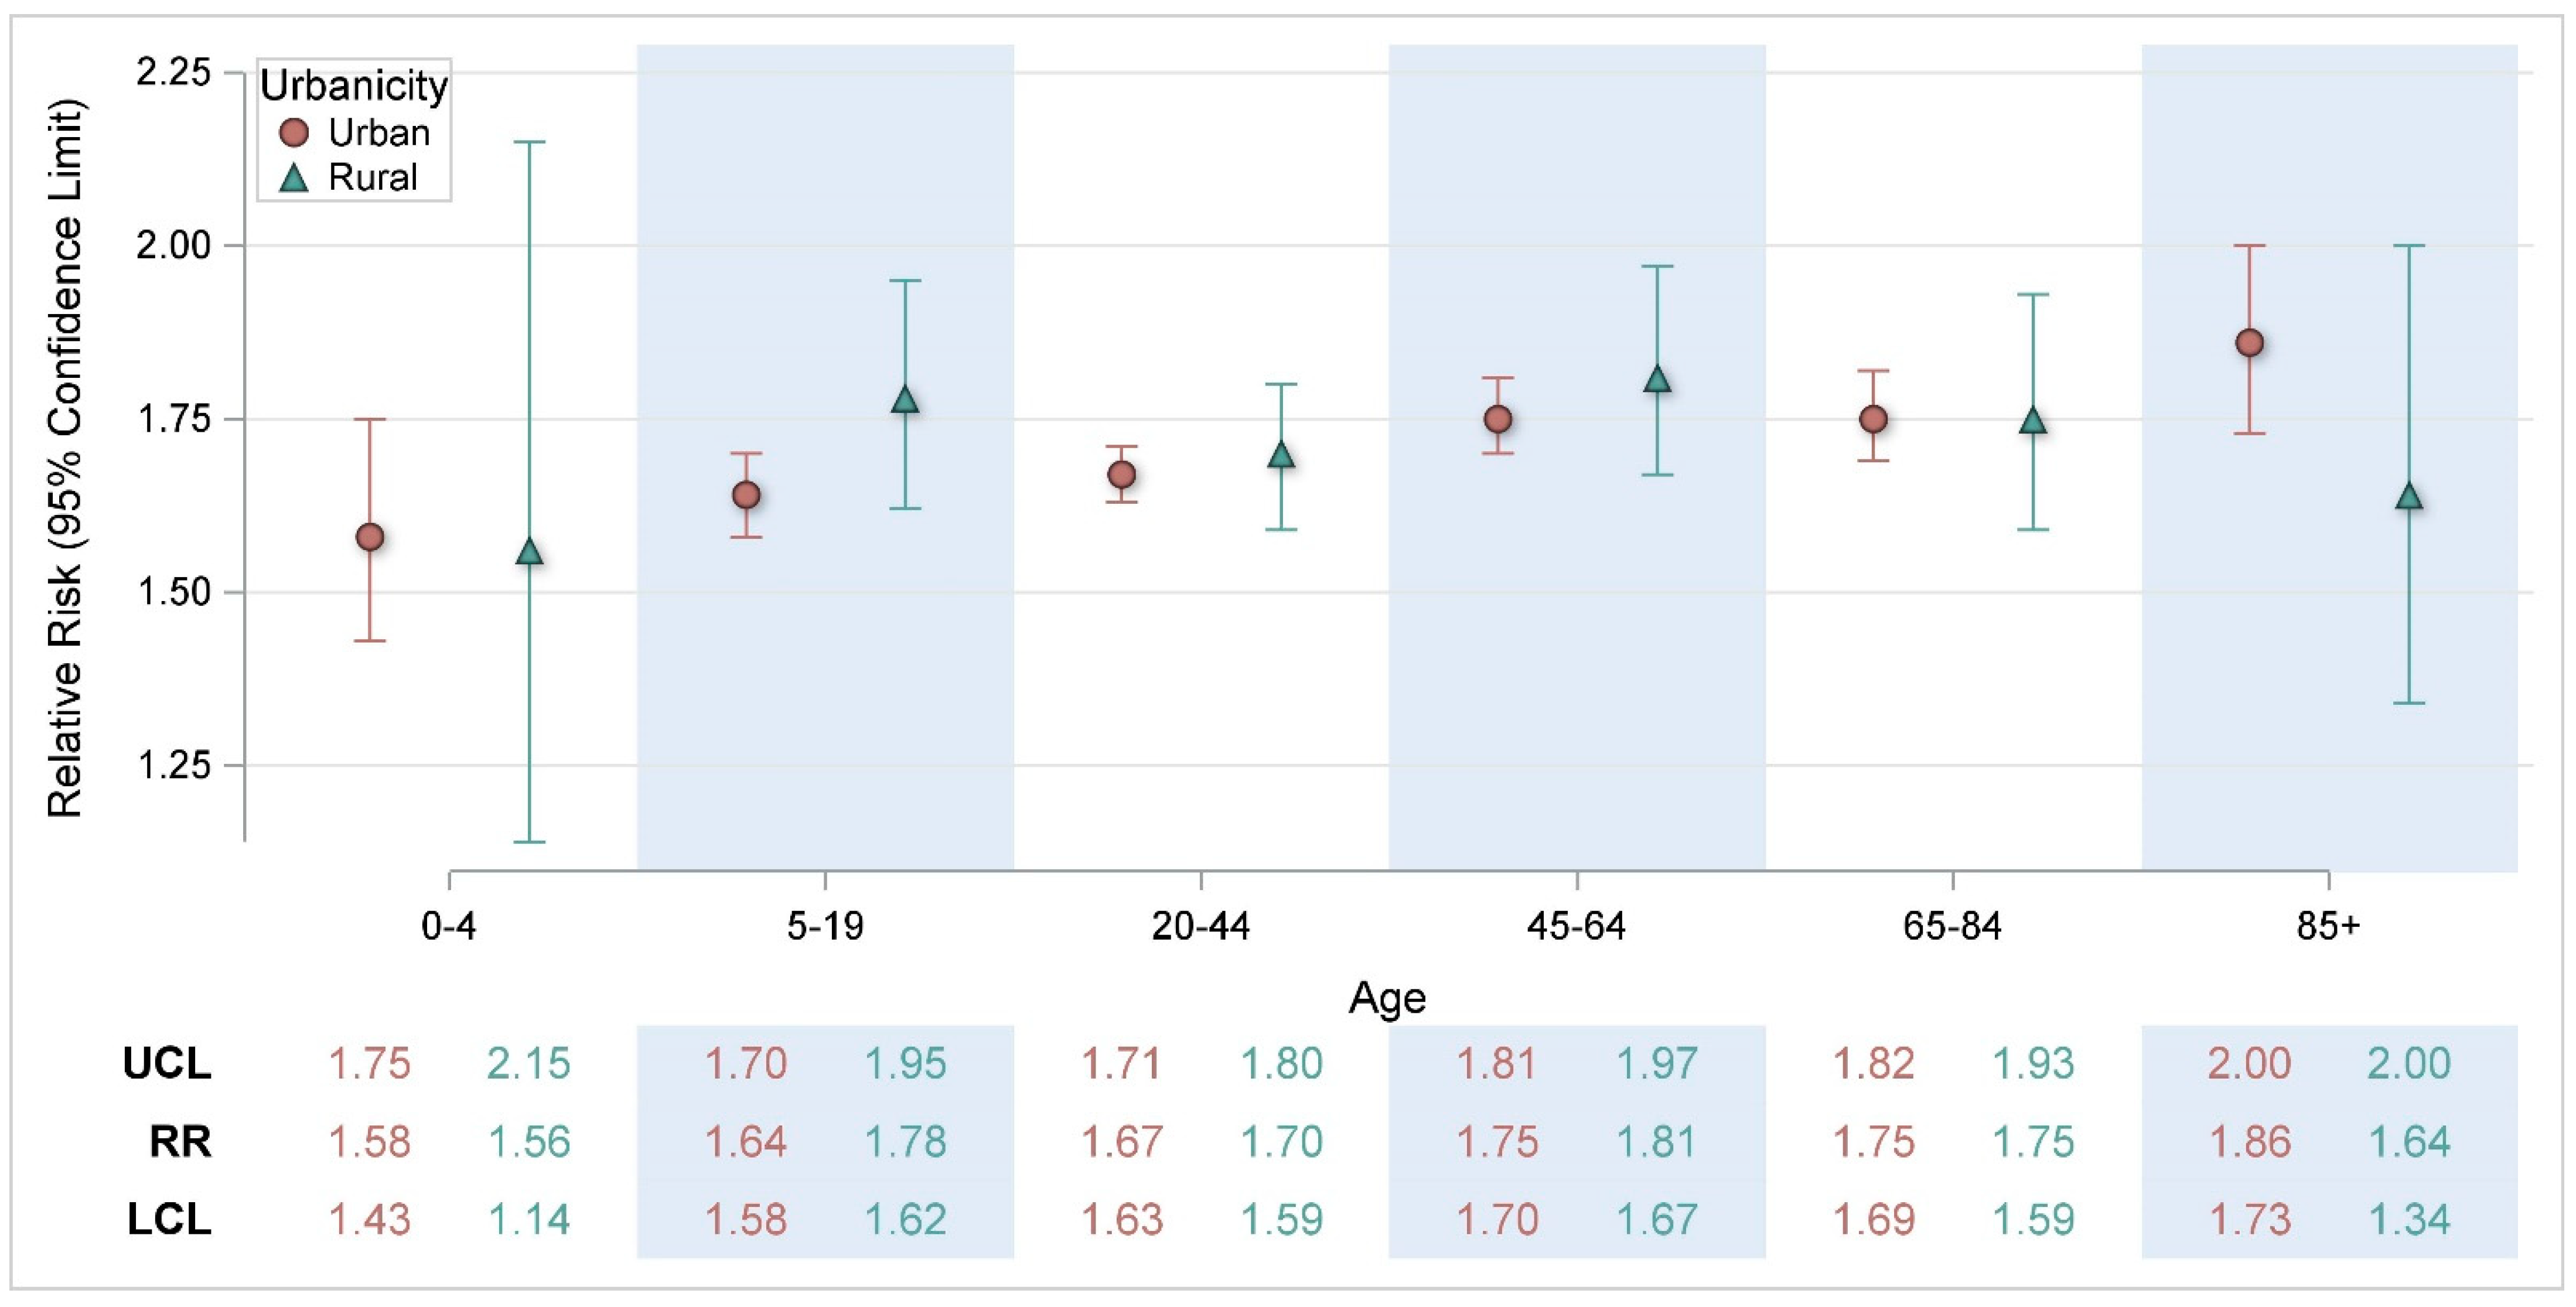
| Age | |
| 0–4 | 1.59 (1.44, 1.75) |
| 5–19 | 1.65 (1.60, 1.71) |
| 20–44 | 1.67 (1.64, 1.71) |
| 45–64 | 1.76 (1.71, 1.81) |
| 65–84 | 1.75 (1.69, 1.81) |
| 85+ | 1.83 (1.71, 1.96) |
| Sex | |
| Male | 1.70 (1.67, 1.74) |
| Female | 1.71 (1.68, 1.75) |
| Race/Ethnicity | |
| Non-Hispanic White | 1.71 (1.68, 1.74) |
| Hispanic | 1.69 (1.62, 1.76) |
| Non-Hispanic Black | 1.72 (1.66, 1.78) |
| Asian/Pacific Islander | 1.58 (1.41, 1.76) |
| Other d | 1.66 (1.58, 1.75) |
| Urbanicity e | |
| Urban | 1.70 (1.68, 1.73) |
| Rural | 1.74 (1.67, 1.81) |
| Climate Region f | |
| Adirondacks | 3.28 (1.68, 6.42) |
| Catskills | 1.69 (1.55, 1.84) |
| Central/Finger Lakes | 1.75 (1.65, 1.85) |
| Champlain Vally | 1.64 (1.46, 1.85) |
| Great Lakes | 1.69 (1.63, 1.75) |
| Long Island | 1.84 (1.76, 1.92) |
| Mohawk River Valley | 1.71 (1.59, 1.84) |
| New York City | 1.69 (1.65, 1.73) |
| North Hudson | 1.63 (1.55, 1.72) |
| South Hudson | 1.68 (1.61, 1.74) |
| Southern Tier | 1.93 (1.80, 2.07) |
| St. Lawrence Valley | 1.73 (1.54, 1.95) |
Disclaimer/Publisher’s Note: The statements, opinions and data contained in all publications are solely those of the individual author(s) and contributor(s) and not of MDPI and/or the editor(s). MDPI and/or the editor(s) disclaim responsibility for any injury to people or property resulting from any ideas, methods, instructions or products referred to in the content. |
© 2025 by the authors. Licensee MDPI, Basel, Switzerland. This article is an open access article distributed under the terms and conditions of the Creative Commons Attribution (CC BY) license (https://creativecommons.org/licenses/by/4.0/).
Share and Cite
Aydin-Ghormoz, H.; Adeyeye, T.; Hsu, W.; Muscatiello, N. Assessing Heat–Health Vulnerability Through Temporal, Demographic, and Spatial Lenses: A Time-Stratified Case-Crossover Analysis in New York State. Int. J. Environ. Res. Public Health 2025, 22, 1124. https://doi.org/10.3390/ijerph22071124
Aydin-Ghormoz H, Adeyeye T, Hsu W, Muscatiello N. Assessing Heat–Health Vulnerability Through Temporal, Demographic, and Spatial Lenses: A Time-Stratified Case-Crossover Analysis in New York State. International Journal of Environmental Research and Public Health. 2025; 22(7):1124. https://doi.org/10.3390/ijerph22071124
Chicago/Turabian StyleAydin-Ghormoz, Heather, Temilayo Adeyeye, Wanhsiang Hsu, and Neil Muscatiello. 2025. "Assessing Heat–Health Vulnerability Through Temporal, Demographic, and Spatial Lenses: A Time-Stratified Case-Crossover Analysis in New York State" International Journal of Environmental Research and Public Health 22, no. 7: 1124. https://doi.org/10.3390/ijerph22071124
APA StyleAydin-Ghormoz, H., Adeyeye, T., Hsu, W., & Muscatiello, N. (2025). Assessing Heat–Health Vulnerability Through Temporal, Demographic, and Spatial Lenses: A Time-Stratified Case-Crossover Analysis in New York State. International Journal of Environmental Research and Public Health, 22(7), 1124. https://doi.org/10.3390/ijerph22071124