
Adjustment Criteria for Air-Quality Standards by Altitude: A Scoping Review with Regulatory Overview

Abstract
1. Introduction
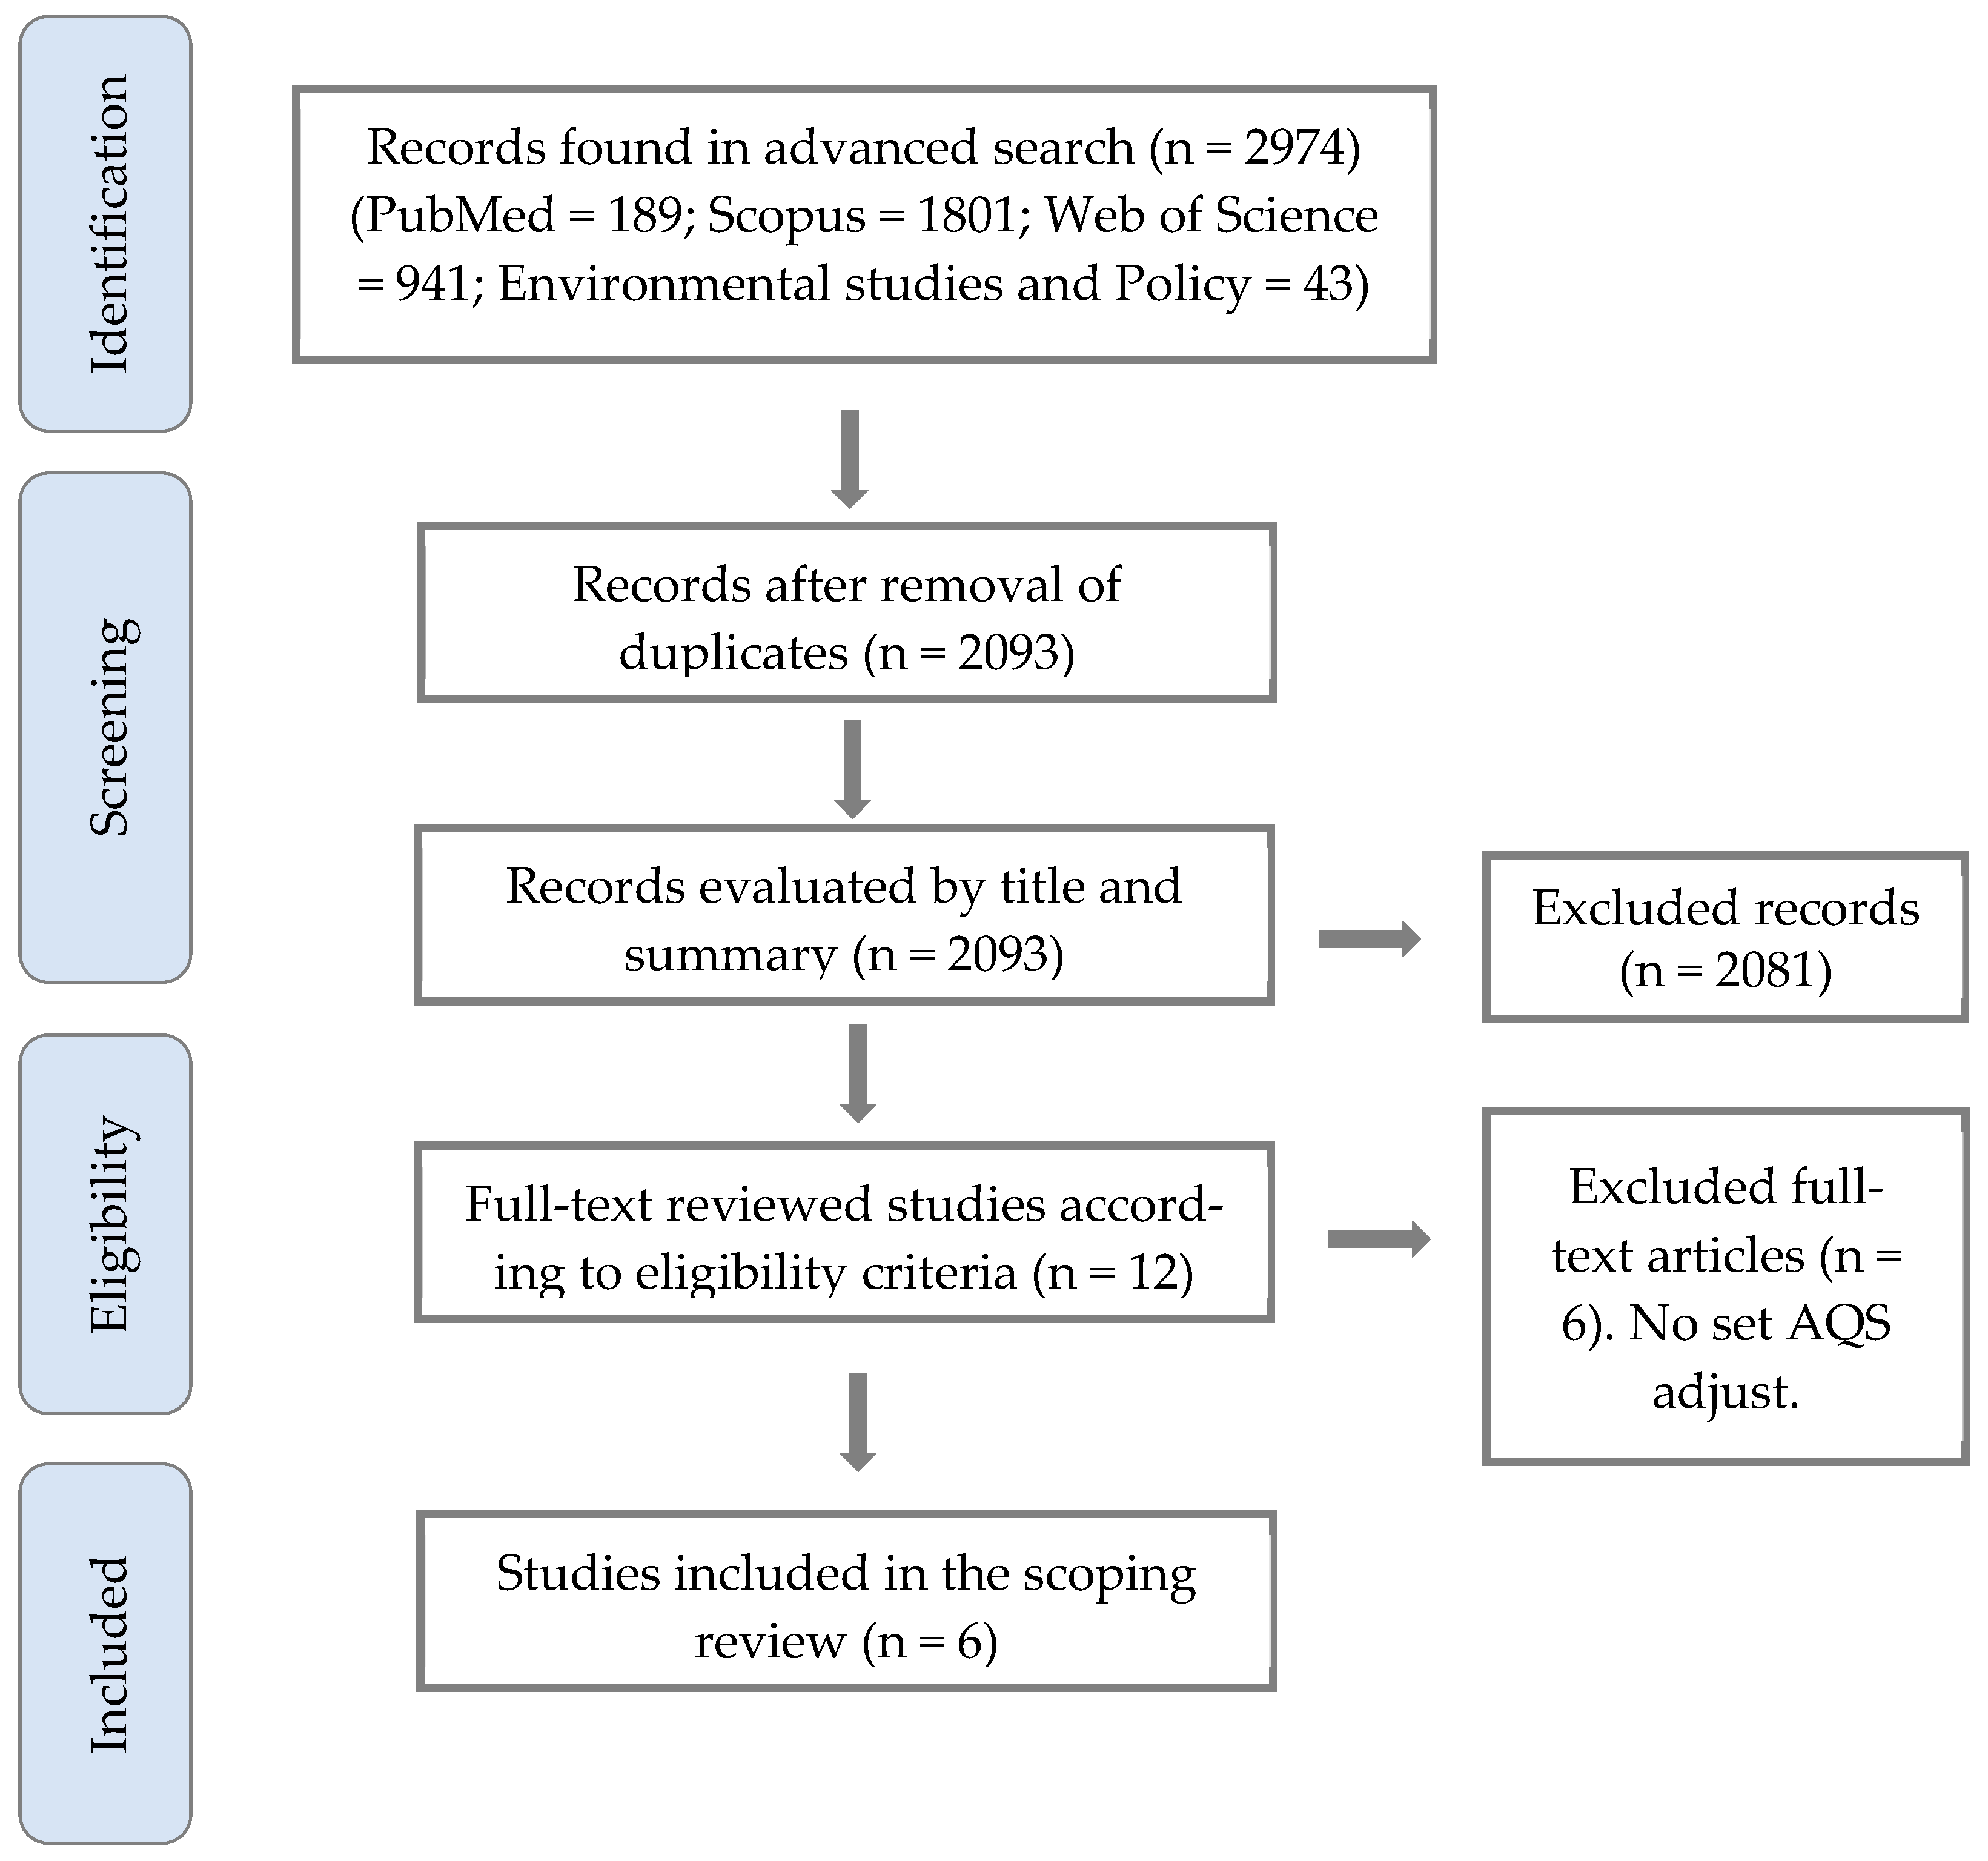
2. Methods
2.1. Protocol Registration and Search Strategies
2.2. Eligibility Criteria and Selection Studies
- Studies proposing, modeling, or establishing criteria for altitude-adjusted AQS in outdoor air, considering any methodological approach.
- The primary pollutants (criteria pollutants) [31] of interest included particulate matter (PM), nitrogenous species, carbon oxides, and ozone.
2.3. Data Management
3. Results
3.1. Altitude Adjusting Criteria in AQS

| Author Details | Methodology and Pollutant Assessed | Basis for Model Adjustment | Model Equation for AQS Adjustment |
|---|---|---|---|
| Goddard and Goddard, 1979—USA [33] | Report with calculus. Exemplified with H2S. | Concentration conversion by change of pressure and temperature. | |
| Bravo and Urone, 1981—Mexico [34] | Simulation study using TPS. | Hyperventilation at altitude increases risk of pollutant exposure. | |
| Collier and Goldsmith, 1983—USA [36] | Numerical simulation modeling of CO. | Less oxygen partial pressure at altitude increases risk of carboxyhemoglobin. | Coburn, Forster, and Kane (CFK) Equation |
| Madueño et al., 2020—Germany [42] | Observational field study measuring black carbon exposure. | Hyperventilation and modes of transport at altitude increase risk of pollutant exposure. | where: : Respiratory Deposition Dose, : Pollutant concentration, : Minute ventilation, : Exposure time, : Index for activity type and : Index street segment |
| Bravo Alvarez et al., 2013—Mexico [43] | Simulation-based estimation using PM10. | General gas law. Volume concentration change at different pressures and temperatures. | where: : Pollutant concentration, : Pressure, : Temperature, : Index for local condition and : Index for standard condition |
| Yan et al., 2021—China [44] | Observational field study measuring CO and NO2. | Low oxygen content and ambient pressure can influence vehicle pollutant emissions. | where: : Altitude coefficient, : Emission factor at altitude and : Base (standard) emission factor |
3.2. Altitude-Influenced Pollutants, AQS, and Regulation in Major HA Countries
4. Discussion
4.1. Altitude-Specific AQS Adjustment Proposals
4.2. Regulatory AQS Frameworks
4.3. Implications and Research Needs
5. Strengths and Limitations
6. Conclusions
Supplementary Materials
Author Contributions
Funding
Acknowledgments
Conflicts of Interest
References
- WHO Billions of People Still Breathe Unhealthy Air: New WHO Data. Available online: https://www.who.int/news/item/04-04-2022-billions-of-people-still-breathe-unhealthy-air-new-who-data (accessed on 16 October 2024).
- Health Effects Institute. State of Global Air 2024; Health Effects Institute: Boston, MA, USA, 2024. [Google Scholar]
- Dominski, F.H.; Lorenzetti Branco, J.H.; Buonanno, G.; Stabile, L.; Gameiro da Silva, M.; Andrade, A. Effects of Air Pollution on Health: A Mapping Review of Systematic Reviews and Meta-Analyses. Environ. Res. 2021, 201, 111487. [Google Scholar] [CrossRef] [PubMed]
- Feng, T.; Sun, Y.; Shi, Y.; Ma, J.; Feng, C.; Chen, Z. Air Pollution Control Policies and Impacts: A Review. Renew. Sustain. Energy Rev. 2024, 191, 114071. [Google Scholar] [CrossRef]
- Jonidi Jafari, A.; Charkhloo, E.; Pasalari, H. Urban Air Pollution Control Policies and Strategies: A Systematic Review. J. Environ. Health Sci. Eng. 2021, 19, 1911–1940. [Google Scholar] [CrossRef] [PubMed]
- Kutlar Joss, M.; Eeftens, M.; Gintowt, E.; Kappeler, R.; Künzli, N. Time to Harmonize National Ambient Air Quality Standards. Int. J. Public Health 2017, 62, 453–462. [Google Scholar] [CrossRef]
- UNEP Regulating Air Quality: The First Global Assessment of Air Pollution Legislation. Available online: https://www.unep.org/resources/report/regulating-air-quality-first-global-assessment-air-pollution-legislation (accessed on 8 April 2025).
- Fowler, D.; Brimblecombe, P.; Burrows, J.; Heal, M.R.; Grennfelt, P.; Stevenson, D.S.; Jowett, A.; Nemitz, E.; Coyle, M.; Lui, X.; et al. A Chronology of Global Air Quality: The Development of Global Air Pollution. Philos. Trans. R. Soc. 2020, 378, 20190314. [Google Scholar] [CrossRef]
- Wooley, D.; Leiter, A.; Salgado, M.; Zalzal, P. EPA’s New Particulate Matter Standard. Environ. Law Report 2024, 54, 10535–10547. [Google Scholar]
- Shairsingh, K.; Ruggeri, G.; Krzyzanowski, M.; Mudu, P.; Malkawi, M.; Castillo, J.; da Silva, A.S.; Saluja, M.; Martínez, K.C.; Mothe, J.; et al. WHO Air Quality Database: Relevance, History and Future Developments. Bull. World Health Organ. 2023, 101, 800–807. [Google Scholar] [CrossRef]
- Ravindra, K.; Singh, V.; Mor, S. Why We Should Have a Universal Air Quality Index? Environ. Int. 2024, 187, 108698. [Google Scholar] [CrossRef]
- Vahlsing, C.; Smith, K.R. Global Review of National Ambient Air Quality Standards for PM10 and SO2 (24 h). Air Qual. Atmos. Health 2012, 5, 393–399. [Google Scholar] [CrossRef]
- WHO. WHO Global Air Quality Guidelines. Particulate Matter (PM2.5 and PM10), Ozone, Nitrogen Dioxide, Sulfur Dioxide and Carbon Monoxide; WHO: Geneva, Switzerland, 2021; pp. 30–35. [Google Scholar]
- Masiol, M.; Formenton, G.; Visin, F.; Bonetto, A.; Rovea, M.; Ficotto, S.; Danesin, E.; Toffanin, T.; Maggiulli, A.; Battistel, M.; et al. Sources of Wintertime PM2.5 at a Major City in an Alpine Valley: The Role of Atmospheric Dispersion and Inversion Dynamics. Atmos. Environ. 2024, 330, 120556. [Google Scholar] [CrossRef]
- U.S. EPA. Altitude as a Factor in Air Pollution; U.S. EPA: Washington, DC, USA, 1978. [Google Scholar]
- Dordević, D.S.; Šolević, T.M. The Contributions of High- and Low Altitude Emission Sources to the near Ground Concentrations of Air Pollutants. Atmos. Res. 2008, 87, 170–182. [Google Scholar] [CrossRef]
- Herrmann, E.; Weingartner, E.; Henne, S.; Vuilleumier, L.; Bukowiecki, N.; Steinbacher, M.; Conen, F.; Coen, M.C.; Hammer, E.; Jurányi, Z.; et al. Analysis of Long-Term Aerosol Size Distribution Data from Jungfraujoch with Emphasis on Free Tropospheric Conditions, Cloud Influence, and Air Mass Transport. J. Geophys. Res. Atmos. 2015, 120, 9459–9480. [Google Scholar] [CrossRef]
- Bigham, A.W.; Wilson, M.J.; Julian, C.G.; Kiyamu, M.; Vargas, E.; Leon-Velarde, F.; Rivera-Chira, M.; Rodriquez, C.; Browne, V.A.; Parra, E.; et al. Andean and Tibetan Patterns of Adaptation to High Altitude. Am. J. Hum. Biol. 2013, 25, 190–197. [Google Scholar] [CrossRef]
- Storz, J.F. High-Altitude Adaptation: Mechanistic Insights from Integrated Genomics and Physiology. Mol. Biol. Evol. 2021, 38, 2677–2691. [Google Scholar] [CrossRef]
- Moore, L.G. Human Genetic Adaptation to High Altitude. High Alt. Med. Biol. 2001, 2, 257–279. [Google Scholar] [CrossRef]
- West, J.B. Oxygen Enrichment of Room Air to Relieve the Hypoxia of High Altitude. Respir. Physiol. 1995, 99, 225–232. [Google Scholar] [CrossRef]
- Li, Y.; Frandsen, K.M.; Guo, W.; Lu, Y.; Hvelplund, M.H.; Suolang, B.; Xi, Z.; Duan, M.; Liu, L. Impact of Altitude on the Dosage of Indoor Particulates Entering an Individual’s Small Airways. J. Hazard. Mater. 2024, 468, 133856. [Google Scholar] [CrossRef]
- Ortiz-Prado, E.; Encalada, S.; Mosquera, J.; Simbaña-Rivera, K.; Gomez-Barreno, L.; Duta, D.; Ochoa, I.; Izquierdo-Condoy, J.S.; Vasconez, E.; Burgos, G.; et al. A Comparative Analysis of Lung Function and Spirometry Parameters in Genotype-Controlled Natives Living at Low and High Altitude. BMC Pulm. Med. 2022, 22, 100. [Google Scholar] [CrossRef]
- Dzhalilova, D.; Makarova, O. Differences in Tolerance to Hypoxia: Physiological, Biochemical, and Molecular-Biological Characteristics. Biomedicines 2020, 8, 428. [Google Scholar] [CrossRef]
- Sullivan, K.M.; Mei, Z.; Grummer-Strawn, L.; Parvanta, I. Haemoglobin Adjustments to Define Anaemia. Trop. Med. Int. Health. 2008, 13, 1267–1271. [Google Scholar] [CrossRef]
- Ehrlich, D.; Melchiorri, M.; Capitani, C. Population Trends and Urbanization in Mountain Ranges of the World. Land 2021, 10, 255. [Google Scholar] [CrossRef]
- Tremblay, J.C.; Ainslie, P.N. Global and Country-Level Estimates of Human Population at High Altitude. Proc. Natl. Acad. Sci. USA 2021, 118, e2102463118. [Google Scholar] [CrossRef] [PubMed]
- Wiedensohler, A.; Andrade, M.; Weinhold, K.; Müller, T.; Birmili, W.; Velarde, F.; Moreno, I.; Forno, R.; Sanchez, M.F.; Laj, P.; et al. Black Carbon Emission and Transport Mechanisms to the Free Troposphere at the La Paz/El Alto (Bolivia) Metropolitan Area Based on the Day of Census (2012). Atmos. Environ. 2018, 194, 158–169. [Google Scholar] [CrossRef]
- Vargas, M.H.; Becerril-Ángeles, M.; Medina-Reyes, I.S.; Rascón-Pacheco, R.A. Altitude above 1500 m Is a Major Determinant of Asthma Incidence. An Ecological Study. Respir. Med. 2018, 135, 1–7. [Google Scholar] [CrossRef]
- Guo, Y.; Xing, Z.; Shan, G.; Janssens, J.P.; Sun, T.; Chai, D.; Liu, W.; Wang, Y.; Ma, Y.; Tong, Y.; et al. Prevalence and Risk Factors for COPD at High Altitude: A Large Cross-Sectional Survey of Subjects Living Between 2100–4700 m Above Sea Level. Front. Med. 2020, 7, 581763. [Google Scholar] [CrossRef]
- Saxena, P.; Sonwani, S. Primary Criteria Air Pollutants: Environmental Health Effects. In Criteria Air Pollutants and Their Impact on Environmental Health; Springer: Singapore, 2019; pp. 49–82. ISBN 978-981-13-9992-3. [Google Scholar]
- Peters, M.D.J.; Godfrey, C.; McInerney, P.; Munn, Z.; Tricco, A.C.; Khalil, H. Chapter 11: Scoping Reviews. In JBI Reviewer’s Manual; Aromataris, E., Munn, Z., Eds.; JBI: Miami, FL, USA, 2020. [Google Scholar]
- Goddard, W.B.; Goddard, C.B. Ambient Air Quality Standard-Altitude Corrections. Eng. Environ. Stud. 1979, 1–4. [Google Scholar] [CrossRef]
- Bravo, A.; Urone, P. The Altitude: A Fundamental Parameter in the Use of Air Quality Standards. J. Air Pollut. Control Assoc. 1981, 31, 264–265. [Google Scholar] [CrossRef]
- Cogo, A. The Lung at High Altitude. Multidiscip. Respir. Med. 2011, 6, 14–15. [Google Scholar] [CrossRef]
- Collier, C.R.; Goldsmith, J.R. Interactions of Carbon-Monoxide and Hemoglobin at High-Altitude. Atmos. Environ. 1983, 17, 723–728. [Google Scholar] [CrossRef]
- Patel, S.; Jose, A.; Mohiuddin, S.S. Physiology, Oxygen Transport and Carbon Dioxide Dissociation Curve; StatPearls: Treasure Island, FL, USA, 2023. [Google Scholar]
- Kitagishi, H.; Mao, Q. Capture of Carbon Monoxide Using a Heme Protein Model: From Biomimetic Chemistry of Heme Proteins to Physiological and Therapeutic Applications. Polym. J. 2021, 54, 465–472. [Google Scholar] [CrossRef]
- McGrath, J.J. Carbon Monoxide Studies at High Altitude. Neurosci. Biobehav. Rev. 1988, 12, 311–314. [Google Scholar] [CrossRef] [PubMed]
- U.S. EPA NAAQS Table|US EPA. Available online: https://www.epa.gov/criteria-air-pollutants/naaqs-table (accessed on 30 January 2025).
- Tahoe Regional Planning Agency Lake Tahoe Info|Highest 8-Hour Average Concentration of Carbon Monoxide. Available online: https://www.laketahoeinfo.org/Indicator/Detail/64/Overview (accessed on 30 January 2025).
- Madueño, L.; Kecorius, S.; Andrade, M.; Wiedensohler, A. Exposure and Respiratory Tract Deposition Dose of Equivalent Black Carbon in High Altitudes. Atmosphere 2020, 11, 598. [Google Scholar] [CrossRef]
- Bravo Alvarez, H.; Sosa Echeverria, R.; Sanchez Alvarez, P.; Krupa, S. Air Quality Standards for Particulate Matter (PM) at High Altitude Cities. Environ. Pollut. 2013, 173, 255–256. [Google Scholar] [CrossRef]
- Yan, G.; Wang, M.; Qin, P.; Yan, T.; Li, K.; Wang, X.; Han, C. Field Measurements of Vehicle Pollutant Emissions in Road Tunnels at Different Altitudes. Tunn. Undergr. Space Technol. 2021, 118, 104187. [Google Scholar] [CrossRef]
- Savioli, G.; Ceresa, I.F.; Gori, G.; Fumoso, F.; Gri, N.; Floris, V.; Varesi, A.; Martuscelli, E.; Marchisio, S.; Longhitano, Y.; et al. Pathophysiology and Therapy of High-Altitude Sickness: Practical Approach in Emergency and Critical Care. J. Clin. Med. 2022, 11, 3937. [Google Scholar] [CrossRef]
- Jiang, Z.; Niu, H.; Jia, Z.; Wu, L.; Zhang, Q.; Zhang, Y.; Mao, H. Comparison of Vehicular Emissions at Different Altitudes: Characteristics and Policy Implications. Environ. Pollut. 2025, 367, 125679. [Google Scholar] [CrossRef]
- Targino, A.C.; Rodrigues, M.; Krecl, P.; Cipoli, Y.A.; Ribeiro, J.P.M. Commuter exposure to black carbon particles on diesel buses, on bicycles and on foot: A case study in a Brazilian city. Environ. Sci. Pollut. Res. 2017, 25, 1132–1146. [Google Scholar] [CrossRef]
- Horiuchi, M.; Kirihara, Y.; Fukuoka, Y.; Pontzer, H. Sex Differences in Respiratory and Circulatory Cost during Hypoxic Walking: Potential Impact on Oxygen Saturation. Sci. Rep. 2019, 9, 9550. [Google Scholar] [CrossRef]
- Dons, E.; Panis, I.L.; Van Poppel, M.; Theunis, J.; Wets, G. Personal Exposure to Black Carbon in Transport Microenvironments. Atmos. Environ. 2012, 55, 392–398. [Google Scholar] [CrossRef]
- Milledge, J.S. The Control of Breathing at High Altitude; University of Birmingham: Birmingham, UK, 1968. [Google Scholar]
- Liu, Z.; Cui, H.; Zhao, L.; Ma, F.; Liu, Y.; Chen, Y.; Chen, J.; Jia, Y.; Li, W.; Cai, J.; et al. Effects of Plateau Air Quality and Low Oxygen Content on Platelet MtDNA Methylation and High Altitude Pulmonary Edema. Aerosol Air Qual. Res. 2021, 21, 210222. [Google Scholar] [CrossRef]
- Feng, R.; Wang, K.; Wang, F. Quantifying Influences of Administrative Division Adjustment on PM2.5 Pollution in China’s Mega-Urban Agglomerations. J. Environ. Manag. 2022, 302, 113993. [Google Scholar] [CrossRef] [PubMed]
- Torres-Duque, C.A.; Alí-Munive, A.; Severiche-Bueno, D.; Durán-Silva, M.; Aguirre-Franco, C.E.; González-Florez, A.; Pareja-Zabala, M.J.; Jiménez-Maldonado, L.; Gonzalez-Garcia, M. Tropical High Altitude and Severe Asthma in Adults: House Dust Mite Sensitization and Phenotypic Distribution. J. Asthma 2024, 61, 222–231. [Google Scholar] [CrossRef] [PubMed]
- JTG/T D70/2-02-2014; Guidelines for Design of Ventilation of Highway Tunnels. Ministry of Transport of China: Beijing, China, 2014.
- Nazarenko, Y.; Pal, D.; Ariya, P.A. Air Quality Standards for the Concentration of Particulate Matter 2.5, Global Descriptive Analysis. Bull. World Health Organ. 2021, 99, 125–137. [Google Scholar] [CrossRef] [PubMed]
- WHO. Guidelines for Air Quality; WHO: Geneva, Switzerland, 2000. [Google Scholar]
- Ning, Z.; He, S.; Liao, X.; Ma, C.; Wu, J. Cold Waves and Fine Particulate Matter in High-Altitude Chinese Cities: Assessing Their Interactive Impact on Outpatient Visits for Respiratory Disease. BMC Public Health 2024, 24, 1377. [Google Scholar] [CrossRef] [PubMed]
- Ning, G.; Wang, S.; Ma, M.; Ni, C.; Shang, Z.; Wang, J.; Li, J. Characteristics of Air Pollution in Different Zones of Sichuan Basin, China. Sci. Total Environ. 2018, 612, 975–984. [Google Scholar] [CrossRef]
- Wang, C.H.; Shi, G.Y.; Du, L.T.; Ni, X.L.; Hu, Y.; Pang, D.B.; Meng, J.H. The Source of Volatile Organic Compounds Pollution and Its Effect on Ozone in High-Altitude Areas. Ecotoxicol. Environ. Saf. 2024, 286, 117221. [Google Scholar] [CrossRef]
- Kim, K.H.; Kabir, E.; Kabir, S. A Review on the Human Health Impact of Airborne Particulate Matter. Environ. Int. 2015, 74, 136–143. [Google Scholar] [CrossRef]
- Silva, R.A.; West, J.J.; Zhang, Y.; Anenberg, S.C.; Lamarque, J.F.; Shindell, D.T.; Collins, W.J.; Dalsoren, S.; Faluvegi, G.; Folberth, G.; et al. Global Premature Mortality Due to Anthropogenic Outdoor Air Pollution and the Contribution of Past Climate Change. Environ. Res. Lett. 2013, 8, 034005. [Google Scholar] [CrossRef]
- Ebi, K.L.; McGregor, G. Climate Change, Tropospheric Ozone and Particulate Matter, and Health Impacts. Environ. Health Perspect. 2008, 116, 1449–1455. [Google Scholar] [CrossRef]
- US Standard Atmosphere NASA-TM-X-74335. Available online: https://ntrs.nasa.gov/archive/nasa/casi.ntrs.nasa.gov/19770009539.pdf (accessed on 25 November 2024).
- Burtscher, M. Effects of Living at Higher Altitudes on Mortality: A Narrative Review. Aging Dis. 2013, 5, 274. [Google Scholar] [CrossRef]
- Cohen, J.E.; Small, C. Hypsographic Demography: The Distribution of Human Population by Altitude. Proc. Natl. Acad. Sci. USA 1998, 95, 14009–14014. [Google Scholar] [CrossRef] [PubMed]
- NB 62011:2018; Calidad del aire–Contaminantes atmosféricos en exterior-Límites máximos permisibles. IBNORCA: La Paz, Bolivia, 2018.
- NB 62014:2018; Calidad del aire - Determinación de material particulado en suspensión con un diámetro aerodinámico equivalente menor a 10 y 2.5 micrómetros (PM10 y PM2.5) - Muestreo activo - Método gravimétrico. IBNORCA: La Paz, Bolivia, 2018.
- NB 62018:2018; Calidad del aire - Índice de la contaminación atmosférica diario. IBNORCA: La Paz, Bolivia, 2018.
- National Standard GB 3095-2012; National Ambient Air Quality Standard. China Environmental Science Press: Beijing, China, 2012.
- Wu, T. The Qinghai–Tibetan Plateau: How High Do Tibetans Live? High Alt. Med. Biol. 2001, 2, 489–499. [Google Scholar] [CrossRef] [PubMed]
- Wang, Z.; Tan, Y.; Guo, M.; Cheng, M.; Gu, Y.; Chen, S.; Wu, X.; Chai, F. Prospect of China’s Ambient Air Quality Standards. J. Environ. Sci. 2023, 123, 255–269. [Google Scholar] [CrossRef] [PubMed]
- Zhao, Y.; Tan, Y.; Feng, S. Does Reducing Air Pollution Improve the Progress of Sustainable Development in China? J. Clean. Prod. 2020, 272, 122759. [Google Scholar] [CrossRef]
- Zhang, W.; Xu, H.; Yu, X.; Li, J.; Zhang, Y.; Dai, R.; Zheng, S.; Meng, W.; Shen, H.; Chen, Y.; et al. Rigorous Regional Air Quality Standards for Substantial Health Benefits. Earths Future 2023, 11, e2023EF003860. [Google Scholar] [CrossRef]
- Song, Q.; Zhang, N.; Zhang, Y.; Yin, D.; Hao, J.; Wang, S.; Li, S.; Xu, W.; Yan, W.; Meng, X.; et al. The Development of Local Ambient Air Quality Standards: A Case Study of Hainan Province, China. Eco-Environ. Health 2024, 3, 11–20. [Google Scholar] [CrossRef]
- Li, C.; Chen, P.; Kang, S.; Yan, F.; Hu, Z.; Qu, B.; Sillanpää, M. Concentrations and Light Absorption Characteristics of Carbonaceous Aerosol in PM2.5 and PM10 of Lhasa City, the Tibetan Plateau. Atmos. Environ. 2016, 127, 340–346. [Google Scholar] [CrossRef]
- Li, C.; Han, X.; Kang, S.; Yan, F.; Chen, P.; Hu, Z.; Yang, J.; Ciren, D.; Gao, S.; Sillanpää, M.; et al. Heavy Near-Surface PM2.5 Pollution in Lhasa, China during a Relatively Static Winter Period. Chemosphere 2019, 214, 314–318. [Google Scholar] [CrossRef]
- CONDESAN. Sustainable Mountain Development in the Andes; CONDESAN: Lima, Peru, 2012. [Google Scholar]
- Velásquez, M.T. El Hombre Nativo de Las Grandes Alturas. Estudios Fisiológicos En Los Andes Peruanos, 1st ed.; Instituto Nacional de Salud: Lima, Peru, 2013; ISBN 978-612-310-038-4. [Google Scholar]
- Bury, J. Mining Migrants: Transnational Mining and Migration Patterns in the Peruvian Andes. Prof. Geogr. 2007, 59, 378–389. [Google Scholar] [CrossRef]
- Hancco, I.; Bailly, S.; Baillieul, S.; Doutreleau, S.; Germain, M.; Pépin, J.L.; Verges, S. Excessive Erythrocytosis and Chronic Mountain Sickness in Dwellers of the Highest City in the World. Front. Physiol. 2020, 11, 773. [Google Scholar] [CrossRef]
- Neumann, P. Toxic Talk and Collective (In)Action in a Company Town: The Case of La Oroya, Peru. Soc. Probl. 2016, 63, 431–446. [Google Scholar] [CrossRef]
- Paula, S. The La Oroya Case: The Relationship Between Environmental Degradation and Human Rights Violations. Hum. Rights Brief 2010, 18, 19–23. [Google Scholar]
- World Health Organization. Air Quality Guidelines. Global Update 2005: Particulate Matter, Ozone, Nitrogen Dioxide, and Sulfur Dioxide; World Health Organization: Geneva, Switzerland, 2006. [Google Scholar]
- Villanueva Mercado, A. Proyecto de Ley N° 756/2016-CR; Congreso de la Republica: Lima, Perú, 2016. [Google Scholar]
- Mardoñez, V.; Pandolfi, M.; Borlaza, L.J.S.; Jaffrezo, J.-L.; Alastuey, A.; Besombes, J.-L.; Moreno, R.I.; Perez, N.; Močnik, G.; Ginot, P.; et al. Source Apportionment Study on Particulate Air Pollution in Two High-Altitude Bolivian Cities: La Paz and El Alto. Atmos. Chem. Phys. 2023, 23, 10325–10347. [Google Scholar] [CrossRef]
- UNEP Air Quality Policies in Bolivia (Plurinational State of). Available online: https://www.unep.org/resources/policy-and-strategy/air-quality-policies-bolivia-plurinational-state (accessed on 10 February 2025).
- Pareja, A.; Hinojosa, M.; Luján, M. Inventario de Emisiones Atmosféricas Contaminantes de la Ciudad de Cochabamba, Bolivia, año 2008. Acta Nova 2011, 5, 344–374. [Google Scholar]
- Vilcassim, R.; Thurston, G.D. Gaps and Future Directions in Research on Health Effects of Air Pollution. EBioMedicine 2023, 93, 104668. [Google Scholar] [CrossRef]
- Ning, Z.; Ma, Y.; He, S.; Li, G.; Xu, Y.; Wang, Z.; Zhang, Y.; Ma, E.; Ma, C.; Wu, J. High Altitude Air Pollution and Respiratory Disease: Evaluating Compounded Exposure Events and Interactions. Ecotoxicol. Environ. Saf. 2024, 285, 117046. [Google Scholar] [CrossRef]
- Carvalho, H. The Air We Breathe: Differentials in Global Air Quality Monitoring. Lancet Respir. Med. 2016, 4, 603–605. [Google Scholar] [CrossRef]
- Zhang, K.; Ba, M.; Meng, H.; Sun, Y.; Shi, H. Correlation Analysis of City Air Quality in Henan Province. DEStech Trans. Comput. Sci. Eng. 2018, 3, 1–12. [Google Scholar] [CrossRef]
- Dame, J.; Schmidt, S.; Müller, J.; Nüsser, M. Urbanization and Socio-Ecological Challenges in High Mountain Towns: Insights from Leh (Ladakh), India. Landsc. Urban Plan. 2019, 189, 189–199. [Google Scholar] [CrossRef]
- Luan, W.; Li, X. Rapid Urbanization and Its Driving Mechanism in the Pan-Third Pole Region. Sci. Total Environ. 2021, 750, 141270. [Google Scholar] [CrossRef]
- Orlove, B.; Milch, K.; Zaval, L.; Ungemach, C.; Brugger, J.; Dunbar, K.; Jurt, C. Framing Climate Change in Frontline Communities: Anthropological Insights on How Mountain Dwellers in the USA, Peru, and Italy Adapt to Glacier Retreat. Reg. Environ. Chang. 2019, 19, 1295–1309. [Google Scholar] [CrossRef]
- Zeng, Z.; Chen, A.; Ciais, P.; Li, Y.; Li, L.Z.X.; Vautard, R.; Zhou, L.; Yang, H.; Huang, M.; Piao, S. Regional Air Pollution Brightening Reverses the Greenhouse Gases Induced Warming-Elevation Relationship. Geophys. Res. Lett. 2015, 42, 4563–4572. [Google Scholar] [CrossRef]
- Zalakeviciute, R.; Alexandrino, K.; Rybarczyk, Y.; Debut, A.; Vizuete, K.; Diaz, M. Seasonal Variations in PM10 Inorganic Composition in the Andean City. Sci. Rep. 2020, 10, 17049. [Google Scholar] [CrossRef] [PubMed]
- Shelton, S.; Liyanage, G.; Jayasekara, S.; Pushpawela, B.; Rathnayake, U.; Jayasundara, A.; Jayasooriya, L.D. Seasonal Variability of Air Pollutants and Their Relationships to Meteorological Parameters in an Urban Environment. Adv. Meteorol. 2022, 2022, 5628911. [Google Scholar] [CrossRef]
- Hock, R.; Rasul, G.; Adler, C.; Caceres, B.; Gruber, S.; Hirabayashi, Y.; Jackson, M.; Kääb, A.; Kang, S.; Kutuzov, S.; et al. High Mountain Areas. In IPCC Special Report on the Ocean and Cryosphere in a Changing Climate; Pörtner, H.-O., Roberts, D.C., Masson-Delmotte, V., Zhai, P., Tignor, M., Poloczanska, E., Mintenbeck, K., Alegría, A., Nicolai, M., Okem, A., et al., Eds.; Cambridge University Press: Cambridge, UK, 2019; pp. 131–202. [Google Scholar]
- Ding, Y.; Shi, B.; Su, G.; Li, Q.; Meng, J.; Jiang, Y.; Qin, Y.; Dai, L.; Song, S. Assessing Suitability of Human Settlements in High-Altitude Area Using a Comprehensive Index Method: A Case Study of Tibet, China. Sustainability 2021, 13, 1485. [Google Scholar] [CrossRef]
- Asad, A.; Ullah, K.; Butt, M.J.; Labban, A. bin H. Analysis of Urban Heat Island Effects in High Altitude Areas of Pakistan. Remote Sens. Appl. 2023, 32, 101071. [Google Scholar] [CrossRef]
- Warthon Ascarza, J.L. Obtención de un Factor de Ajuste de los Estándares de Calidad del Aire Para Material Particulado en Función de la Altitud; Universidad Nacional de San Agustín: Arequipa, Peru, 2023. [Google Scholar]
- Woody, A.I. How Is the Ideal Gas Law Explanatory? Sci. Educ. 2013, 22, 1563–1580. [Google Scholar] [CrossRef]
- Giraldo, M.; Huertas, J.I. Real Emissions, Driving Patterns and Fuel Consumption of in-Use Diesel Buses Operating at High Altitude. Transp. Res. D Transp. Environ. 2019, 77, 21–36. [Google Scholar] [CrossRef]
- Martínez, J.; Robles, L.; Montalvo, F.; Baño Morales, D.; Zambrano, I. Effects of Altitude in the Performance of a Spark Ignition Internal Combustion Engine. Mater. Today Proc. 2022, 49, 72–78. [Google Scholar] [CrossRef]
- Bishop, G.A.; Morris, J.A.; Stedman, D.H.; Cohen, L.H.; Countess, R.J.; Countess, S.J.; Maly, P.; Scherer, S. The Effects of Altitude on Heavy-Duty Diesel Truck on-Road Emissions. Environ. Sci. Technol. 2001, 35, 1574–1578. [Google Scholar] [CrossRef]
- Qi, Z.; Gu, M.; Cao, J.; Zhang, Z.; You, C.; Zhan, Y.; Ma, Z.; Huang, W. The Effects of Varying Altitudes on the Rates of Emissions from Diesel and Gasoline Vehicles Using a Portable Emission Measurement System. Atmosphere 2023, 14, 1739. [Google Scholar] [CrossRef]
- Marinello, S.; Lolli, F.; Gamberini, R. Roadway Tunnels: A Critical Review of Air Pollutant Concentrations and Vehicular Emissions. Transp. Res. D Transp. Environ. 2020, 86, 102478. [Google Scholar] [CrossRef]
- Svartengren, M.; Strand, V.; Bylin, G.; Järup, L.; Pershagen, G. Short-Term Exposure to Air Pollution in a Road Tunnel Enhances the Asthmatic Response to Allergen. Eur. Respir. J. 2000, 15, 716–724. [Google Scholar] [CrossRef]
- Longley, I. NIWA Ltd. In TP11: Criteria for In-Tunnel and Ambient Air Quality; NIWA Ltd.: Auckland, New Zealand, 2014. [Google Scholar]
- Wuyam, B.; Baillieul, S.; Doutreleau, S.; Vergès, S. Adaptation à l’altitude Dans Les Maladies Respiratoires. Rev. Mal. Respir. 2022, 39, 26–33. [Google Scholar] [CrossRef]
- Grimminger, J.; Richter, M.; Tello, K.; Sommer, N.; Gall, H.; Ghofrani, H.A. Thin Air Resulting in High Pressure: Mountain Sickness and Hypoxia-Induced Pulmonary Hypertension. Can. Respir. J. 2017, 2017, 8381653. [Google Scholar] [CrossRef]
- Slessarev, M.; Mardimae, A.; Preiss, D.; Vesely, A.; Balaban, D.Y.; Greene, R.; Duffin, J.; Fisher, J.A. Differences in the Control of Breathing between Andean Highlanders and Lowlanders after 10 Days Acclimatization at 3850 m. J. Physiol. 2010, 588, 1607. [Google Scholar] [CrossRef]
- Weitz, C.A.; Garruto, R.M.; Chin, C.T. Larger FVC and FEV1 among Tibetans Compared to Han Born and Raised at High Altitude. Am. J. Phys. Anthropol. 2016, 159, 244–255. [Google Scholar] [CrossRef]
- López Jové, O.R.; Arce, S.C.; Chávez, R.W.; Alaniz, A.; Lancellotti, D.; Chiapella, M.N.; Julián, A.; De Vito, E.L.; Sala, H.L. Spirometry Reference Values for an Andean High-Altitude Population. Respir. Physiol. Neurobiol. 2018, 247, 133–139. [Google Scholar] [CrossRef]
- Greksa, L.P.; Spielvogel, H.; Paz-Zamora, M.; Caceres, E.; Paredes-Fernández, L. Effect of Altitude on the Lung Function of High Altitude Residents of European Ancestry. Am. J. Phys. Anthropol. 1988, 75, 77–85. [Google Scholar] [CrossRef]
- Borghi, F.; Spinazzè, A.; Mandaglio, S.; Fanti, G.; Campagnolo, D.; Rovelli, S.; Keller, M.; Cattaneo, A.; Cavallo, D.M. Estimation of the Inhaled Dose of Pollutants in Different Micro-Environments: A Systematic Review of the Literature. Toxics 2021, 9, 140. [Google Scholar] [CrossRef]
- U.S. EPA. Metabolically Derived Human Ventilation Rates: A Revised Approach Based Upon Oxygen Consumption Rates (Final Report, 2009); U.S. EPA: New York, NY, USA, 2009; EPA/600/R-06/129F. [Google Scholar]
- U.S. EPA. Chapter 6. Inhalation Rates. In Exposure Factors Handbook; National Center for Environmental Assessment: Washington, DC, USA, 2011. [Google Scholar]
- Dünnwald, T.; Gatterer, H.; Faulhaber, M.; Arvandi, M.; Schobersberger, W. Body Composition and Body Weight Changes at Different Altitude Levels: A Systematic Review and Meta-Analysis. Front. Physiol. 2019, 16, 430. [Google Scholar] [CrossRef] [PubMed]
- Hamad, N.; Travis, S.P.L. Weight Loss at High Altitude: Pathophysiology and Practical Implications. Eur. J. Gastroenterol. Hepatol. 2006, 18, 5–10. [Google Scholar] [CrossRef] [PubMed]
- Corlin, L.; Woodin, M.; Amaravadi, H.; Henderson, N.; Brugge, D.; Durant, J.L.; Gute, D.M. A Field Study to Estimate Inhalation Rates for Use in a Particle Inhalation Rate Exposure Metric. Sci. Total Environ. 2019, 696, 133919. [Google Scholar] [CrossRef] [PubMed]
- Ogawa, T.; Fujii, N.; Kurimoto, Y.; Nishiyasu, T. Effect of Hypobaria on Maximal Ventilation, Oxygen Uptake, and Exercise Performance during Running under Hypobaric Normoxic Conditions. Physiol. Rep. 2019, 7, e14002. [Google Scholar] [CrossRef]
- Netzer, N.C.; Rausch, L.K.; Frieß, M.; Strohl, K.P.; Schilz, R.; Decker, M.; Pramsohler, S. Expiratory Peak Flow and Minute Ventilation Are Significantly Increased at High Altitude versus Simulated Altitude in Normobaria. Life 2022, 12, 306. [Google Scholar] [CrossRef]
- Teboul, J.L.; Scheeren, T. Understanding the Haldane Effect. Intensive Care Med. 2017, 43, 91–93. [Google Scholar] [CrossRef]
- Leigh-Smith, S. Carbon Monoxide Poisoning in Tents—A Review. Wilderness Environ. Med. 2004, 15, 163. [Google Scholar] [CrossRef]
- Foutch, R.G.; Henrichs, W. Carbon Monoxide Poisoning at High Altitudes. Am. J. Emerg. Med. 1988, 6, 596–598. [Google Scholar] [CrossRef]
- Crow, L.W. Meteorological and Climatological Factors Affecting Denver Air Quality. Atmos. Environ. (1967) 1979, 13, 1472–1473. [Google Scholar] [CrossRef]
- Kurt, G.K.; Khoshkholgh, M.G.; Alfattani, S.; Ibrahim, A.; Darwish, T.S.J.; Alam, M.S.; Yanikomeroglu, H.; Yongacoglu, A. A Vision and Framework for the High Altitude Platform Station (HAPS) Networks of the Future. IEEE Commun. Surv. Tutor. 2021, 23, 729–779. [Google Scholar] [CrossRef]
- Gochfeld, M.; Burger, J. Disproportionate Exposures in Environmental Justice and Other Populations: The Importance of Outliers. Am. J. Public. Health 2011, 101, S53–S63. [Google Scholar] [CrossRef] [PubMed]
- Boulon, J.; Sellegri, K.; Hervo, M.; Picard, D.; Pichon, J.M.; Fréville, P.; Laj, P. Investigation of Nucleation Events Vertical Extent: A Long Term Study at Two Different Altitude Sites. Atmos. Chem. Phys. 2011, 11, 5625–5639. [Google Scholar] [CrossRef]
- Venzac, H.; Sellegri, K.; Villani, P.; Picard, D.; Laj, P. Seasonal Variation of Aerosol Size Distributions in the Free Troposphere and Residual Layer at the Puy de Dome Station, France. Atmos. Chem. Phys. 2009, 9, 1465–1478. [Google Scholar] [CrossRef]
- Sellegri, K.; Rose, C.; Marinoni, A.; Lupi, A.; Wiedensohler, A.; Andrade, M.; Bonasoni, P.; Laj, P. New Particle Formation: A Review of Ground-Based Observations at Mountain Research Stations. Atmosphere 2019, 10, 493. [Google Scholar] [CrossRef]
- Spracklen, D.V.; Carslaw, K.S.; Kulmala, M.; Kerminen, V.M.; Sihto, S.L.; Riipinen, I.; Merikanto, J.; Mann, G.W.; Chipperfield, M.P.; Wiedensohler, A.; et al. Contribution of Particle Formation to Global Cloud Condensation Nuclei Concentrations. Geophys. Res. Lett. 2008, 35, L06808. [Google Scholar] [CrossRef]
- Adler Tavella, R.; Scursone, G.F.; dos Santos da Silva, L.; Nadaleti, W.C.; Adamatti, D.F.; El Khouri Miraglia, S.G.; da Silva Júnior, F.M.R. Predicting Air Pollution Changes Due to Temperature Increases in Two Brazilian Capitals Using Machine Learning–A Necessary Perspective for a Climate Resilient Health Future. Int. J. Environ. Health Res. 2025, 1–15. [Google Scholar] [CrossRef]
- Liu, X.; Pushpawela, B.; Jayaratne, R.; Thai, P.; Christensen, B.; Zing, I.; Lamont, R.; Dunbabin, M.; Wang, H.; Gao, J.; et al. Response of Low-Cost Sensors to High PM2.5 Concentrations during Bushfire and Haze Events. Aerosol Sci. Technol. 2024, 58, 978–990. [Google Scholar] [CrossRef]
| Contaminant | Average Time | Bolivia | Peru | China | WHO Guide 2021 | |
|---|---|---|---|---|---|---|
| Permissible Air-Quality Limits 1 | Maximum Limits for Atmospheric Pollutants 2 | Air-Quality Standards 3 | Ambient Air-Quality Standards 4 | |||
| PM2.5, µg·m−3 | Annual | -- | 10 | 25 | Class I: 15 | 5 |
| Class II: 35 | ||||||
| 24 h | -- | 25 | 50 | Class I: 35 | 15 | |
| Class II: 75 | ||||||
| PM10, µg·m−3 | Annual | 50 | 20 | 50 | Class I: 40 | 15 |
| Class II: 70 | ||||||
| 24 h | 150 | 50 | 100 | Class I: 50 | 45 | |
| Class II: 150 | ||||||
| TPS, µg·m−3 | Annual | 75 | 75 | -- | -- | -- |
| 24 h | 260 | -- | -- | -- | -- | |
| O3, µg·m−3 | 1 h | 236 | -- | -- | Class I: 160 | -- |
| Class II: 200 | ||||||
| 8 h | -- | 100 | 100 | Class I: 100 | 100 | |
| Class II: 160 | ||||||
| Annual | -- | 60 | -- | -- | -- | |
| NO2, µg·m−3 | 1 h | 400 | 200 | 200 | 200 | -- |
| 24 h | 150 | 150 | -- | 80 | 25 | |
| Annual | --- | 40 | 100 | 40 | 10 | |
Disclaimer/Publisher’s Note: The statements, opinions and data contained in all publications are solely those of the individual author(s) and contributor(s) and not of MDPI and/or the editor(s). MDPI and/or the editor(s) disclaim responsibility for any injury to people or property resulting from any ideas, methods, instructions or products referred to in the content. |
© 2025 by the authors. Licensee MDPI, Basel, Switzerland. This article is an open access article distributed under the terms and conditions of the Creative Commons Attribution (CC BY) license (https://creativecommons.org/licenses/by/4.0/).
Share and Cite
Rueda-Torres, L.V.; Warthon-Ascarza, J.; Pacsi-Valdivia, S. Adjustment Criteria for Air-Quality Standards by Altitude: A Scoping Review with Regulatory Overview. Int. J. Environ. Res. Public Health 2025, 22, 1053. https://doi.org/10.3390/ijerph22071053
Rueda-Torres LV, Warthon-Ascarza J, Pacsi-Valdivia S. Adjustment Criteria for Air-Quality Standards by Altitude: A Scoping Review with Regulatory Overview. International Journal of Environmental Research and Public Health. 2025; 22(7):1053. https://doi.org/10.3390/ijerph22071053
Chicago/Turabian StyleRueda-Torres, Lenin Vladimir, Julio Warthon-Ascarza, and Sergio Pacsi-Valdivia. 2025. "Adjustment Criteria for Air-Quality Standards by Altitude: A Scoping Review with Regulatory Overview" International Journal of Environmental Research and Public Health 22, no. 7: 1053. https://doi.org/10.3390/ijerph22071053
APA StyleRueda-Torres, L. V., Warthon-Ascarza, J., & Pacsi-Valdivia, S. (2025). Adjustment Criteria for Air-Quality Standards by Altitude: A Scoping Review with Regulatory Overview. International Journal of Environmental Research and Public Health, 22(7), 1053. https://doi.org/10.3390/ijerph22071053