


Oocyte Exposure to Low Levels of Triclosan Has a Significant Impact on Subsequent Embryo Physiology
 , and
, and
Abstract
1. Introduction
2. Materials and Methods
2.1. Experimental Design Overview
2.2. Cumulus–Oocyte Complexes’ In Vitro Maturation (IVM) and In Vitro Culture of Bovine Embryos (IVC)
2.3. Preparation and Storage of TCS Stocks
2.4. Individual In Vitro Culture of Embryos for Metabolic Assays
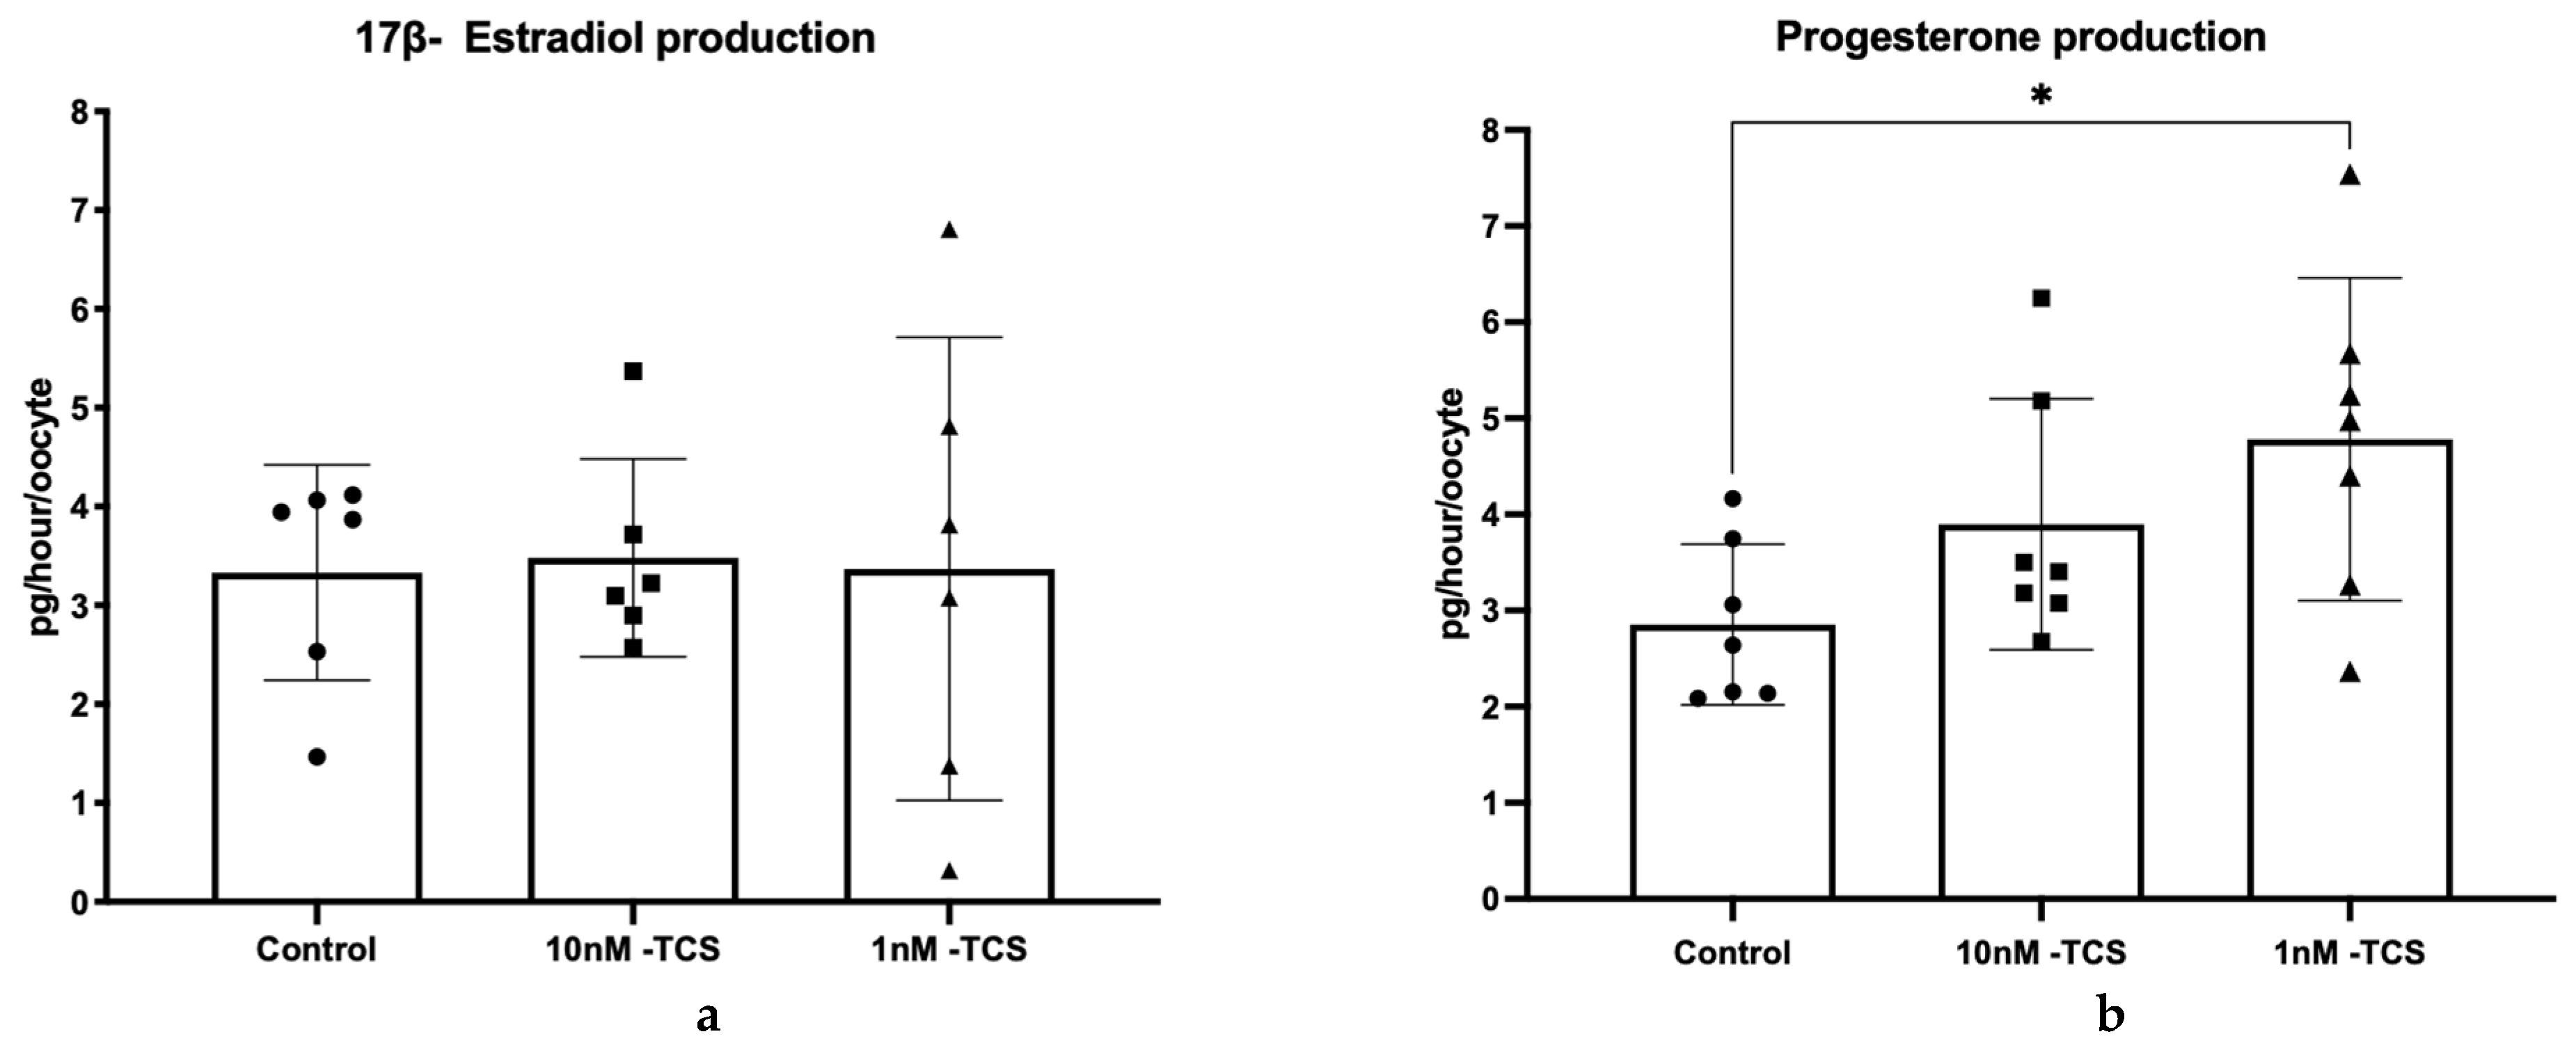
2.5. Determination of Steroid Hormone Release
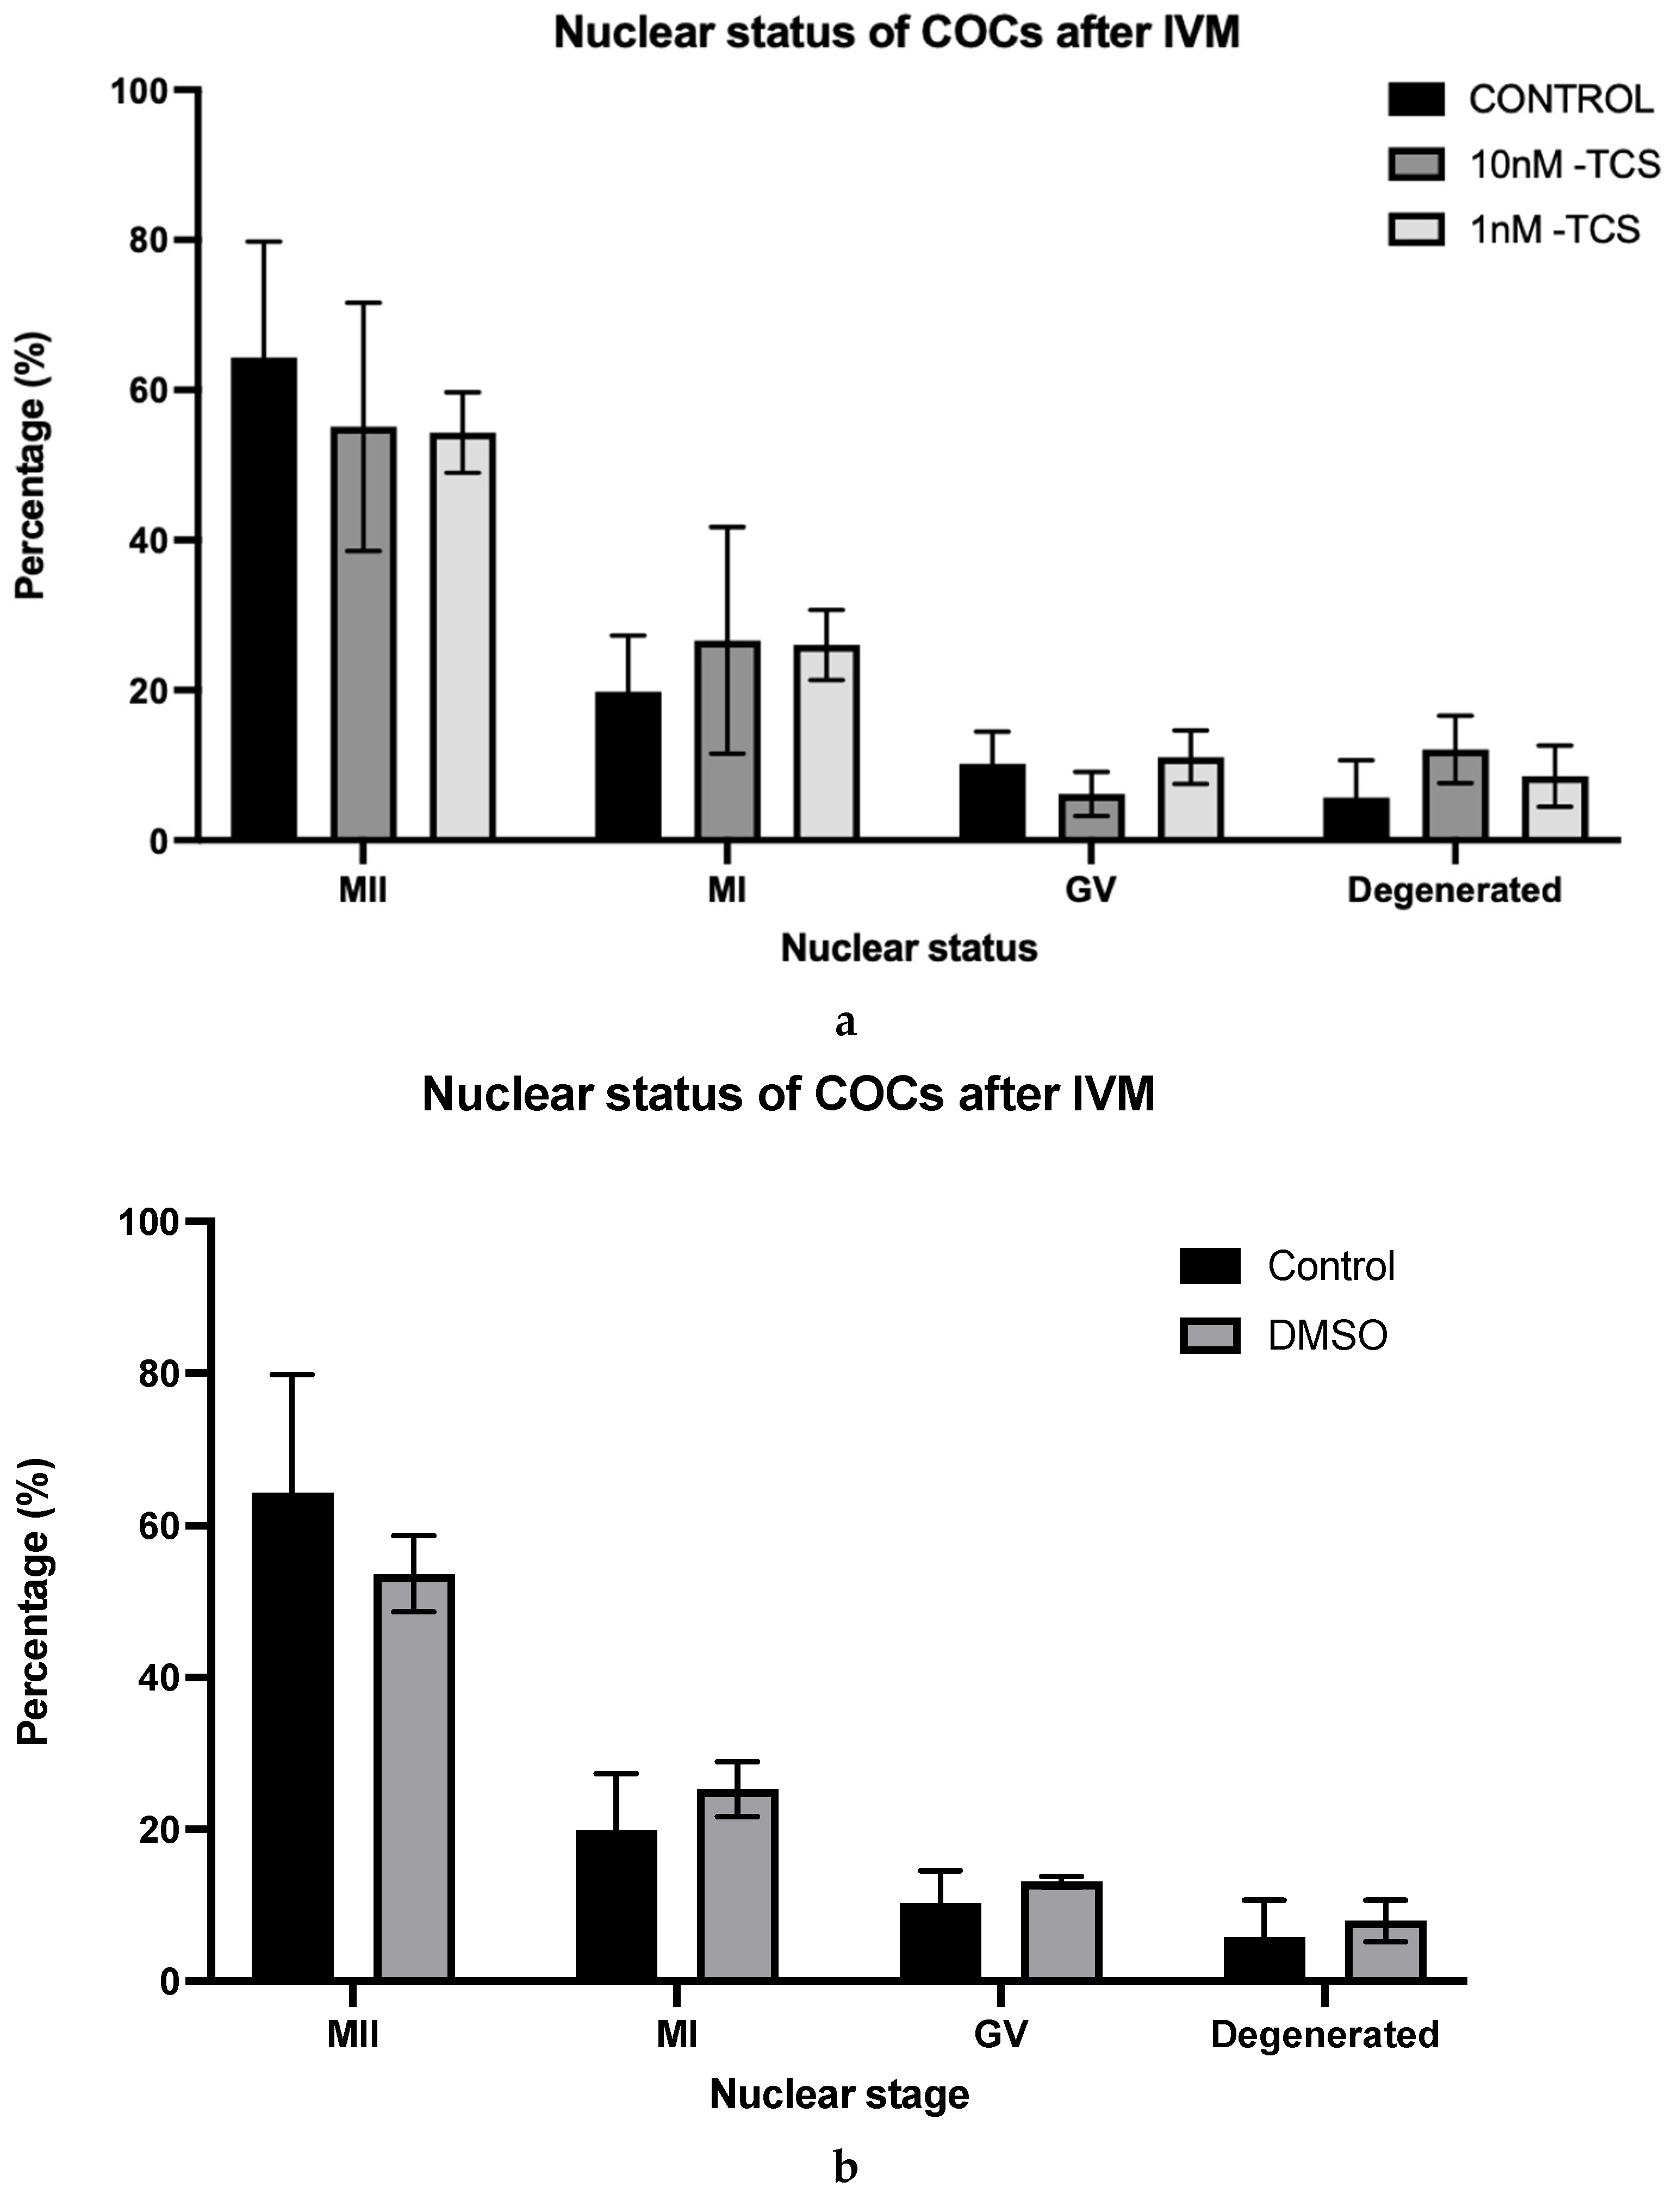
2.6. Identification of COCs Nuclear Status After IVM
2.7. Quantification of Consumption and Release of Key Metabolites (CORE Analysis)
2.8. Quantification of Amino Acid Turnover
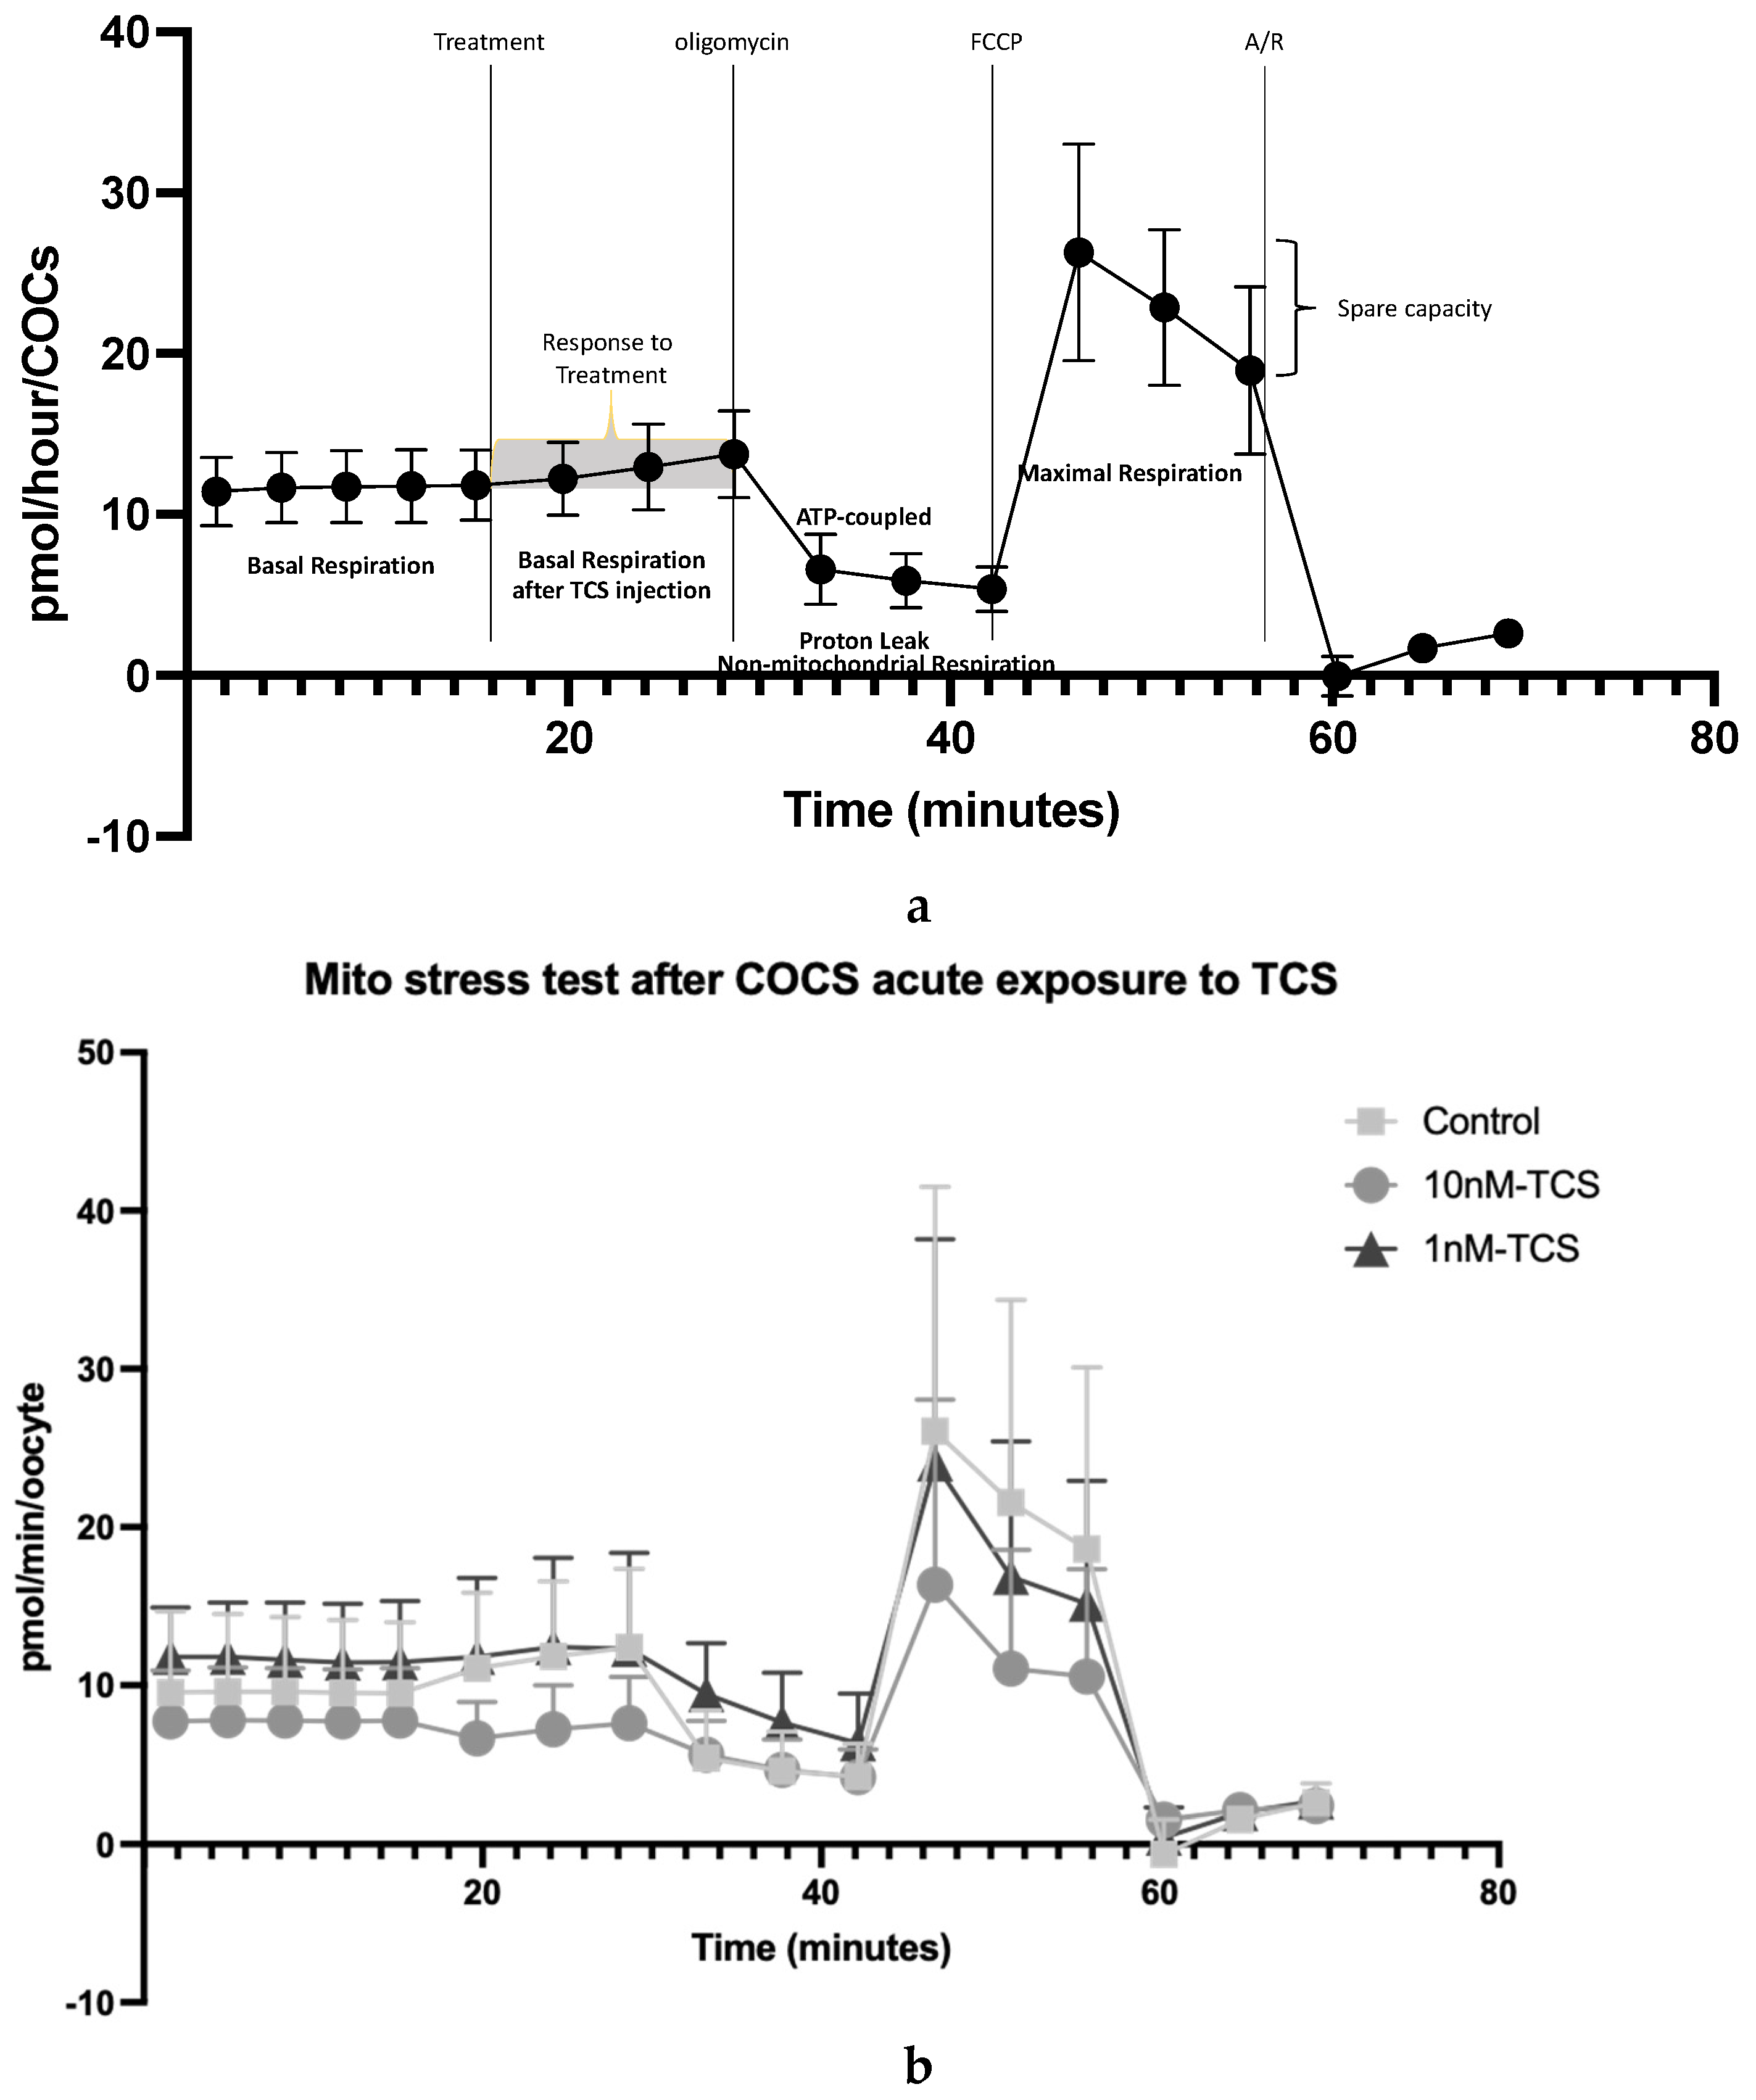
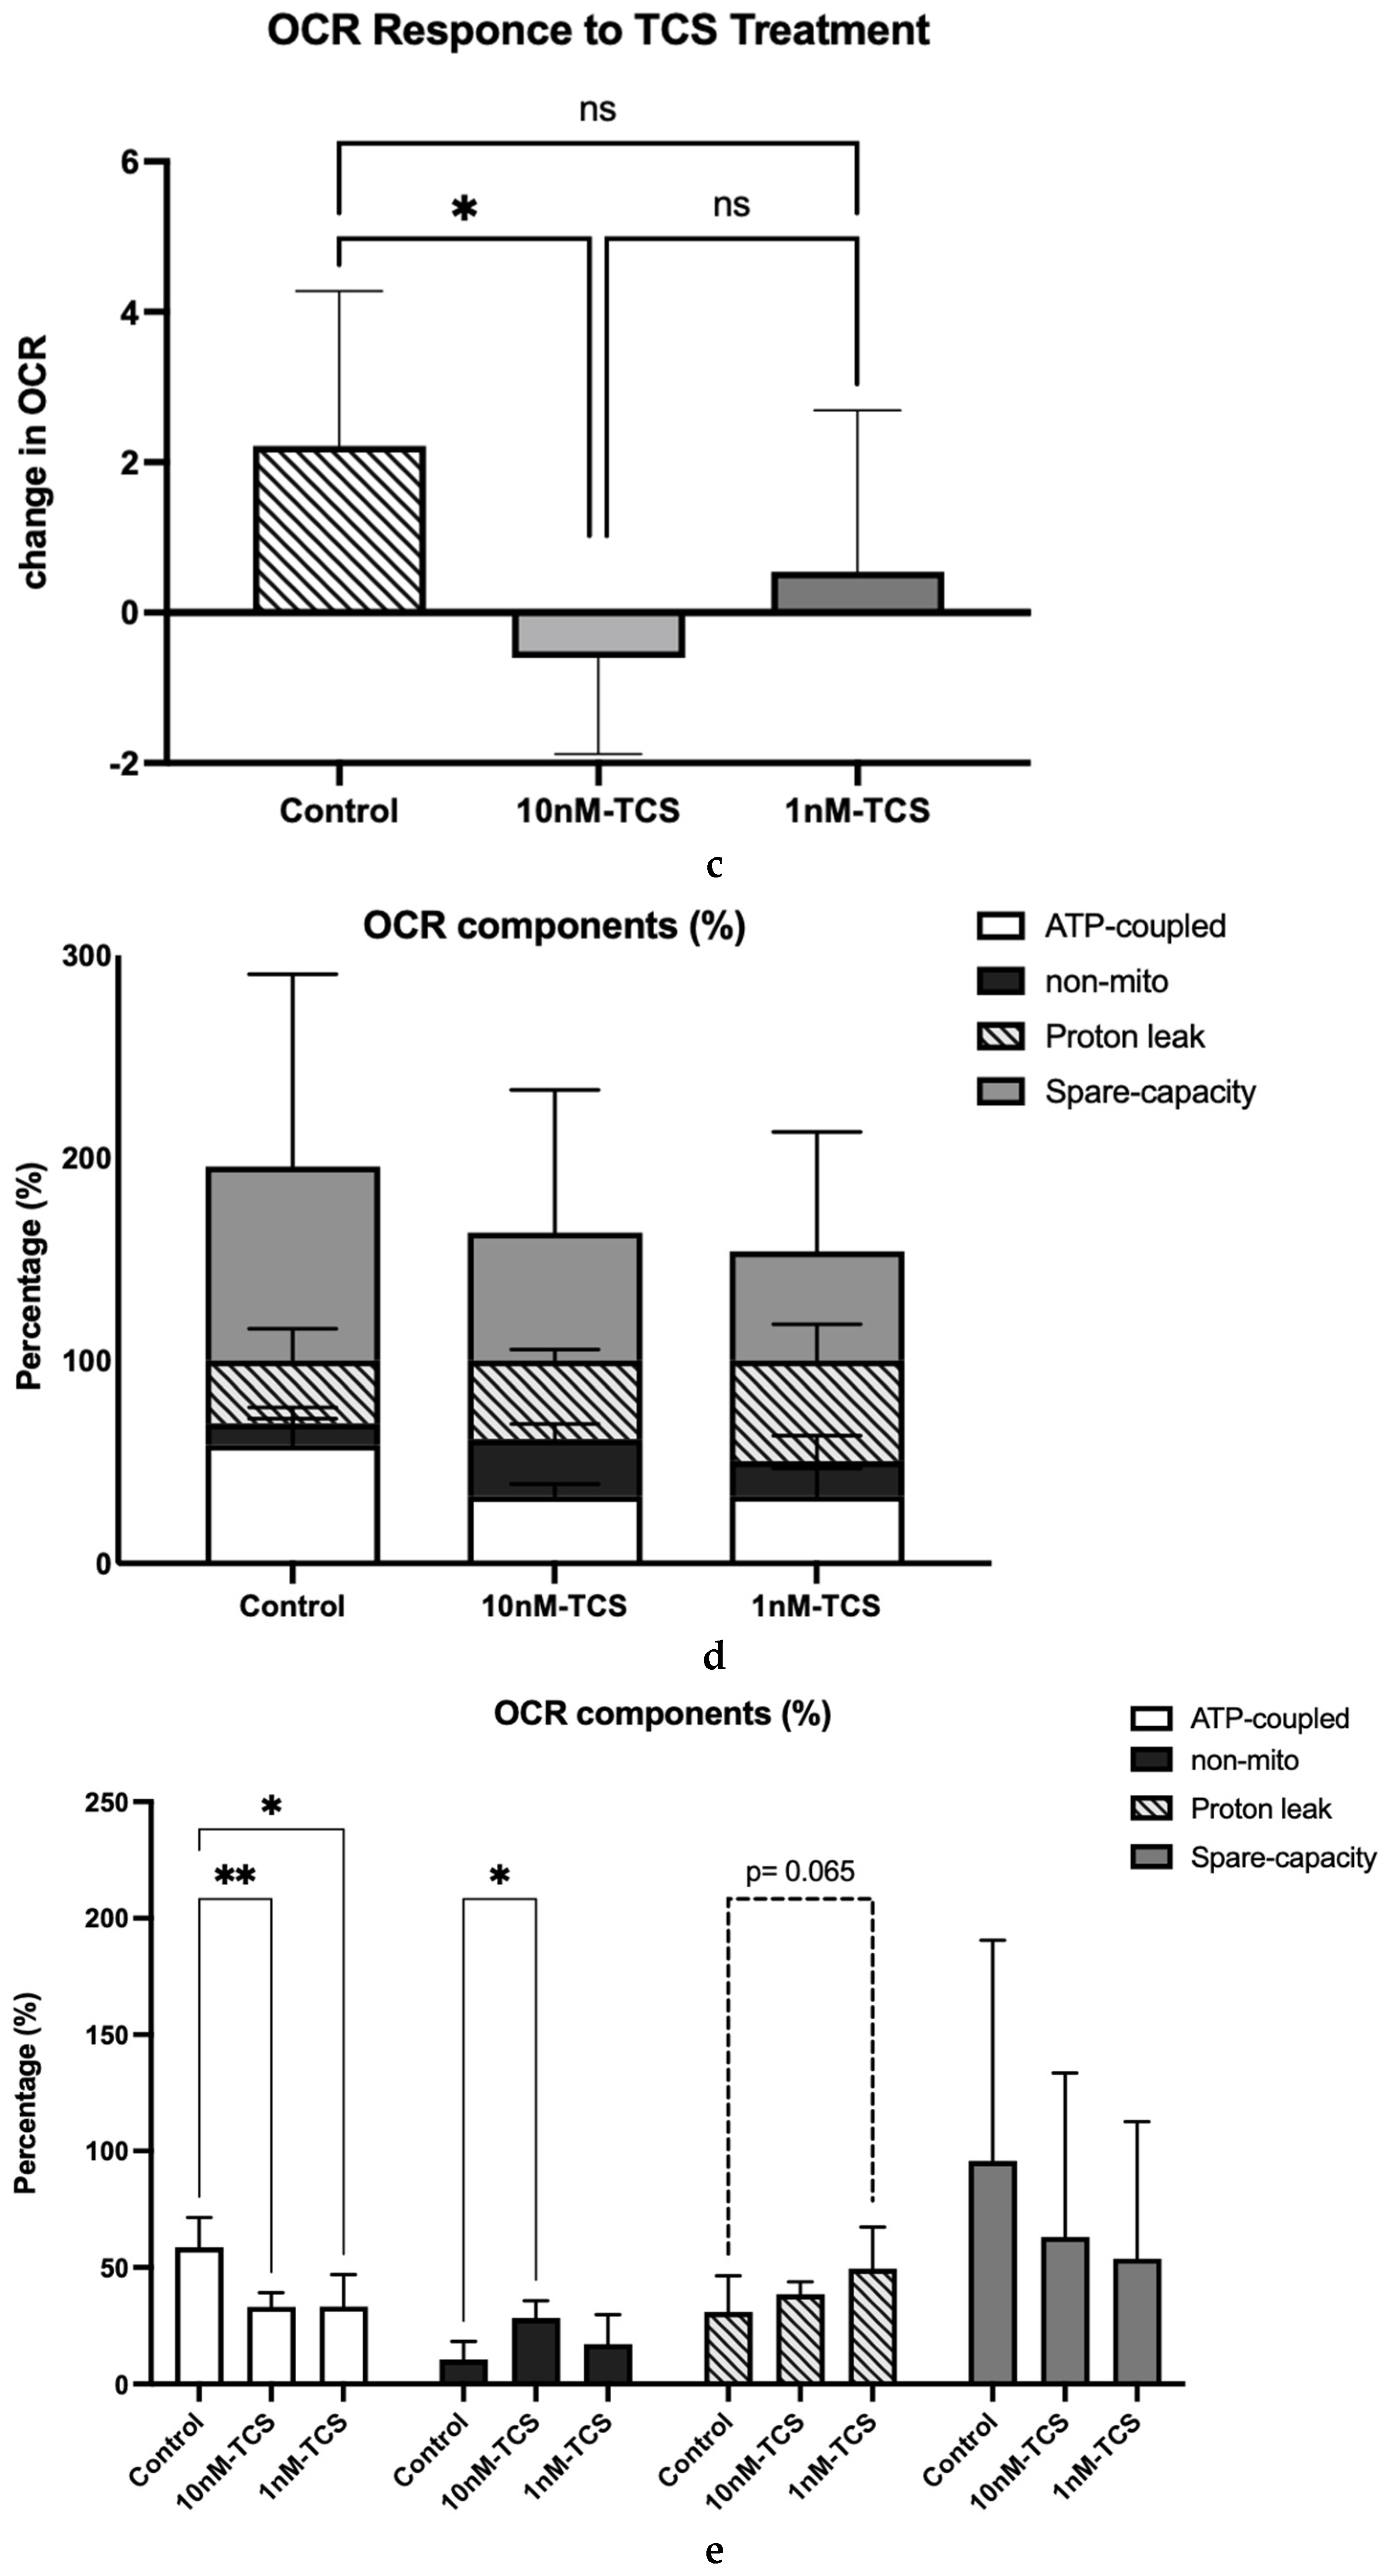
2.9. Determination of Mitochondrial Function Using Oxygen Consumption Rate
2.10. Statistical Analysis
3. Results
4. Discussion
5. Conclusions
Author Contributions
Funding
Institutional Review Board Statement
Informed Consent Statement
Data Availability Statement
Acknowledgments
Conflicts of Interest
References
- Iyer, A.P.; Xue, J.; Honda, M.; Robinson, M.; Kumosani, T.A.; Abulnaja, K.; Kannan, K. Urinary Levels of Triclosan and Triclocarban in Several Asian Countries, Greece and the USA: Association with Oxidative Stress. Environ. Res. 2018, 160, 91–96. [Google Scholar] [CrossRef] [PubMed]
- Chalew, T.E.A.; Halden, R.U. Environmental Exposure of Aquatic and Terrestrial Biota to Triclosan and Triclocarban. J. Am. Water Resour. Assoc. 2009, 45, 4–13. [Google Scholar] [CrossRef]
- Fair, P.A.; Lee, H.-B.; Adams, J.; Darling, C.; Pacepavicius, G.; Alaee, M.; Bossart, G.D.; Henry, N.; Muir, D. Occurrence of Triclosan in Plasma of Wild Atlantic Bottlenose Dolphins (Tursiops Truncatus) and in Their Environment. Environ. Pollut. 2009, 157, 2248–2254. [Google Scholar] [CrossRef] [PubMed]
- Houten, S.M.; Wanders, R.J.A. A General Introduction to the Biochemistry of Mitochondrial Fatty Acid β-Oxidation. J. Inherit. Metab. Dis. 2010, 33, 469–477. [Google Scholar] [CrossRef]
- Olaniyan, L.W.B.; Mkwetshana, N.; Okoh, A.I. Triclosan in Water, Implications for Human and Environmental Health. SpringerPlus 2016, 5, 1639. [Google Scholar] [CrossRef]
- Calafat, A.M.; Ye, X.; Wong, L.Y.; Reidy, J.A.; Needham, L.L. Urinary Concentrations of Triclosan in the U.S. Population: 2003-2004. Environ. Health Perspect. 2008, 116, 303–307. [Google Scholar] [CrossRef] [PubMed]
- Xue, J.; Wu, Q.; Sakthivel, S.; Pavithran, P.V.; Vasukutty, J.R.; Kannan, K. Urinary Levels of Endocrine-Disrupting Chemicals, Including Bisphenols, Bisphenol A Diglycidyl Ethers, Benzophenones, Parabens, and Triclosan in Obese and Non-Obese Indian Children. Environ. Res. 2015, 137, 120–128. [Google Scholar] [CrossRef] [PubMed]
- Azzouz, A.; Rascón, A.J.; Ballesteros, E. Simultaneous Determination of Parabens, Alkylphenols, Phenylphenols, Bisphenol A and Triclosan in Human Urine, Blood and Breast Milk by Continuous Solid-Phase Extraction and Gas Chromatography–Mass Spectrometry. J. Pharm. Biomed. Anal. 2016, 119, 16–26. [Google Scholar] [CrossRef]
- Pirard, C.; Sagot, C.; Deville, M.; Dubois, N.; Charlier, C. Urinary Levels of Bisphenol A, Triclosan and 4-Nonylphenol in a General Belgian Population. Environ. Int. 2012, 48, 78–83. [Google Scholar] [CrossRef]
- Arbuckle, T.E.; Marro, L.; Davis, K.; Fisher, M.; Ayotte, P.; Bélanger, P.; Dumas, P.; LeBlanc, A.; Bérubé, R.; Gaudreau, É.; et al. Exposure to Free and Conjugated Forms of Bisphenol A and Triclosan among Pregnant Women in the MIREC Cohort. Environ. Health Perspect. 2015, 123, 277–284. [Google Scholar] [CrossRef]
- Allmyr, M.; Harden, F.; Toms, L.-M.L.; Mueller, J.F.; McLachlan, M.S.; Adolfsson-Erici, M.; Sandborgh-Englund, G. The Influence of Age and Gender on Triclosan Concentrations in Australian Human Blood Serum. Sci. Total Environ. 2008, 393, 162–167. [Google Scholar] [CrossRef]
- Adolfsson-Erici, M.; Pettersson, M.; Parkkonen, J.; Sturve, J. Triclosan, a Commonly Used Bactericide Found in Human Milk and in the Aquatic Environment in Sweden. Chemosphere 2002, 46, 1485–1489. [Google Scholar] [CrossRef] [PubMed]
- Dayan, A.D. Risk Assessment of Triclosan [Irgasan®] in Human Breast Milk. Food Chem. Toxicol. 2007, 45, 125–129. [Google Scholar] [CrossRef]
- Bever, C.S.; Rand, A.A.; Nording, M.; Taft, D.; Kalanetra, K.M.; Mills, D.A.; Breck, M.A.; Smilowitz, J.T.; German, J.B.; Hammock, B.D. Effects of Triclosan in Breast Milk on the Infant Fecal Microbiome. Chemosphere 2018, 203, 467–473. [Google Scholar] [CrossRef] [PubMed]
- Geens, T.; Neels, H.; Covaci, A. Distribution of Bisphenol-A, Triclosan and n-Nonylphenol in Human Adipose Tissue, Liver and Brain. Chemosphere 2012, 87, 796–802. [Google Scholar] [CrossRef] [PubMed]
- Li, J.; Zhou, L.; Huang, S.; Duan, T.; Xie, J.; Li, X.; Deng, L.; Zeng, C.; Jing, F.; Zhu, S.; et al. The Effect of Endocrine-Disrupting Chemicals in Follicular Fluid: The Insights from Oocyte to Fertilization. Environ. Int. 2024, 191, 108957. [Google Scholar] [CrossRef]
- Mínguez-Alarcón, L.; Christou, G.; Messerlian, C.; Williams, P.L.; Carignan, C.C.; Souter, I.; Ford, J.B.; Calafat, A.M.; Hauser, R.; Keller, M.G.; et al. Urinary Triclosan Concentrations and Diminished Ovarian Reserve among Women Undergoing Treatment in a Fertility Clinic. Fertil. Steril. 2017, 108, 312–319. [Google Scholar] [CrossRef]
- Jurewicz, J.; Wielgomas, B.; Radwan, M.; Karwacka, A.; Klimowska, A.; Dziewirska, E.; Korczak, K.; Zajdel, R.; Radwan, P.; Hanke, W. Triclosan Exposure and Ovarian Reserve. Reprod. Toxicol. 2019, 89, 168–172. [Google Scholar] [CrossRef]
- Marques, A.C.; Mariana, M.; Cairrao, E. Triclosan and Its Consequences on the Reproductive, Cardiovascular and Thyroid Levels. Int. J. Mol. Sci. 2022, 23, 11427. [Google Scholar] [CrossRef]
- Park, H.J.; Song, B.S.; Kim, J.W.; Yang, S.G.; Kim, S.U.; Koo, D.B. Exposure of Triclosan in Porcine Oocyte Leads to Superoxide Production and Mitochondrial-Mediated Apoptosis during in Vitro Maturation. Int. J. Mol. Sci. 2020, 21, 3050. [Google Scholar] [CrossRef]
- Zhao, N.; Xu, A.; Yang, J.; Zhao, J.; Xie, J.; Li, B.; Duan, J.; Cao, G. Triclosan Caused Oocyte Meiotic Arrest by Modulating Oxidative Stress, Organelle Dysfunctions, Autophagy, and Apoptosis in Pigs. Animals 2025, 15, 802. [Google Scholar] [CrossRef] [PubMed]
- Fu, J.; Gong, Z.; Bae, S. Ecotoxicogenomic Analysis of Zebrafish Embryos Exposed to Triclosan and Mixture Triclosan and Methyl Triclosan Using Suppression Subtractive Hybridization and Next-Generation Sequencing. J. Hazard. Mater. 2021, 414, 125450. [Google Scholar] [CrossRef]
- Liu, F.; Zhang, Y.; Wang, F. Environmental Relevant Concentrations of Triclosan Affected Developmental Toxicity, Oxidative Stress, and Apoptosis in Zebrafish Embryos. Environ. Toxicol. 2022, 37, 848–857. [Google Scholar] [CrossRef] [PubMed]
- Teplova, V.V.; Belosludtsev, K.N.; Kruglov, A.G. Mechanism of Triclosan Toxicity: Mitochondrial Dysfunction Including Complex II Inhibition, Superoxide Release and Uncoupling of Oxidative Phosphorylation. Toxicol. Lett. 2017, 275, 108–117. [Google Scholar] [CrossRef]
- Dong, G.; Sun, R.; Zhang, R.; Qin, Y.; Lu, C.; Wang, X.; Xia, Y.; Du, G. Preimplantation Triclosan Exposure Alters Uterine Receptivity through Affecting Tight Junction Protein. Biol. Reprod. 2022, 107, 349–357. [Google Scholar] [CrossRef]
- Yang, Y.; Ni, D.; Wang, L.; Shi, X.; Zhang, X.; Zhou, L.; Ji, J.; Zhao, C.; Shen, R.; Ling, X.; et al. Triclosan Has a Strong Influence on the Development of Mouse Preimplantation Embryo via Activating miR-134/Nanog Axis. Toxicology 2022, 481, 153349. [Google Scholar] [CrossRef] [PubMed]
- Krisher, R.L. The Effect of Oocyte Quality on Development. J. Anim. Sci. 2004, 82 (Suppl. 13), E14–E23. [Google Scholar] [CrossRef]
- Keefe, D.; Kumar, M.; Kalmbach, K. Oocyte Competency Is the Key to Embryo Potential. Fertil. Steril. 2015, 103, 317–322. [Google Scholar] [CrossRef]
- Gardner, D.K.; Leese, H.J. Assessment of Embryo Viability Prior to Transfer by the Noninvasive Measurement of Glucose Uptake. J. Exp. Zool. 1987, 242, 103–105. [Google Scholar] [CrossRef]
- Houghton, F.D.; Thompson, J.G.; Kennedy, C.J.; Leese, H.J. Oxygen Consumption and Energy Metabolism of the Early Mouse Embryo. Mol. Reprod. Dev. 1996, 44, 476–485. [Google Scholar] [CrossRef]
- Guerif, F.; McKeegan, P.; Leese, H.J.; Sturmey, R.G. A Simple Approach for COnsumption and RElease (CORE) Analysis of Metabolic Activity in Single Mammalian Embryos. PLoS ONE 2013, 8, 67834. [Google Scholar] [CrossRef] [PubMed]
- Houghton, F.D.; Hawkhead, J.A.; Humpherson, P.G.; Hogg, J.E.; Balen, A.H.; Rutherford, A.J.; Leese, H.J. Non-Invasive Amino Acid Turnover Predicts Human Embryo Developmental Capacity. Hum. Reprod. 2002, 17, 999–1005. [Google Scholar] [CrossRef] [PubMed]
- Brison, D.R.; Houghton, F.D.; Falconer, D.; Roberts, S.A.; Hawkhead, J.; Humpherson, P.G.; Lieberman, B.A.; Leese, H.J. Identification of Viable Embryos in IVF by Non-Invasive Measurement of Amino Acid Turnover. Hum. Reprod. 2004, 19, 2319–2324. [Google Scholar] [CrossRef]
- Martin, K.L. Nutritional and Metabolic Requirements of Early Cleavage Stage Embryos and Blastocysts. Hum. Fertil. 2000, 3, 247–254. [Google Scholar] [CrossRef]
- Leese, H.J. What Does an Embryo Need? Hum. Fertil. 2003, 6, 180–185. [Google Scholar] [CrossRef] [PubMed]
- Lopes, A.S.; Greve, T.; Callesen, H. Quantification of Embryo Quality by Respirometry. Theriogenology 2007, 67, 21–31. [Google Scholar] [CrossRef]
- Ottosen, L.D.M.; Hindkjær, J.; Lindenberg, S.; Ingerslev, H.J. Murine Pre-Embryo Oxygen Consumption and Developmental Competence. J. Assist. Reprod. Genet. 2007, 24, 359–365. [Google Scholar] [CrossRef]
- Nagaraj, R.; Sharpley, M.S.; Chi, F.; Braas, D.; Zhou, Y.; Kim, R.; Clark, A.T.; Banerjee, U. Nuclear Localization of Mitochondrial TCA Cycle Enzymes as a Critical Step in Mammalian Zygotic Genome Activation. Cell 2017, 168, 210–223.e11. [Google Scholar] [CrossRef]
- Barker, D.J.P. The Origins of the Developmental Origins Theory. J. Intern. Med. 2007, 261, 412–417. [Google Scholar] [CrossRef]
- Watkins, A.J.; Wilkins, A.; Cunningham, C.; Perry, V.H.; Seet, M.J.; Osmond, C.; Eckert, J.J.; Torrens, C.; Cagampang, F.R.A.; Cleal, J.; et al. Low Protein Diet Fed Exclusively during Mouse Oocyte Maturation Leads to Behavioural and Cardiovascular Abnormalities in Offspring. J. Physiol. 2008, 586, 2231–2244. [Google Scholar] [CrossRef]
- Watkins, A.J.; Lucas, E.S.; Torrens, C.; Cleal, J.K.; Green, L.; Osmond, C.; Eckert, J.J.; Gray, W.P.; Hanson, M.A.; Fleming, T.P. Maternal Low-Protein Diet during Mouse Pre-Implantation Development Induces Vascular Dysfunction and Altered Renin-Angiotensin-System Homeostasis in the Offspring. Br. J. Nutr. 2010, 103, 1762–1770. [Google Scholar] [CrossRef] [PubMed]
- Eckert, J.J.; Porter, R.; Watkins, A.J.; Burt, E.; Brooks, S.; Leese, H.J.; Humpherson, P.G.; Cameron, I.T.; Fleming, T.P. Metabolic Induction and Early Responses of Mouse Blastocyst Developmental Programming Following Maternal Low Protein Diet Affecting Life-Long Health. PLoS ONE 2012, 7, e52791. [Google Scholar] [CrossRef]
- Ménézo, Y.J.; Hérubel, F. Mouse and Bovine Models for Human IVF. Reprod. Biomed. Online 2002, 4, 170–175. [Google Scholar] [CrossRef] [PubMed]
- Santos, R.R.; Schoevers, E.J.; Roelen, B.A. Usefulness of Bovine and Porcine IVM/IVF Models for Reproductive Toxicology. Reprod. Biol. Endocrinol. 2014, 12, 117. [Google Scholar] [CrossRef]
- Muller, B.; Lewis, N.; Adeniyi, T.; Leese, H.J.; Brison, D.R.; Sturmey, R.G. Application of Extracellular Flux Analysis for Determining Mitochondrial Function in Mammalian Oocytes and Early Embryos. Sci. Rep. 2019, 9, 16778. [Google Scholar] [CrossRef] [PubMed]
- Orsi, N.M.; Leese, H.J. Amino Acid Metabolism of Preimplantation Bovine Embryos Cultured with Bovine Serum Albumin or Polyvinyl Alcohol. Theriogenology 2004, 61, 561–572. [Google Scholar] [CrossRef]
- Zhang, C.; Barron, L.; Sturzenbaum, S. The Transportation, Transformation and (Bio)Accumulation of Pharmaceuticals in the Terrestrial Ecosystem. Sci. Total Environ. 2021, 781, 146684. [Google Scholar] [CrossRef]
- Darnerud, P.O.; Atuma, S.; Aune, M.; Bjerselius, R.; Glynn, A.; Grawé, K.P.; Becker, W. Dietary Intake Estimations of Organohalogen Contaminants (Dioxins, PCB, PBDE and Chlorinated Pesticides, e.g., DDT) Based on Swedish Market Basket Data. Food Chem. Toxicol. 2006, 44, 1597–1606. [Google Scholar] [CrossRef]
- Rashid, H.; Alqahtani, S.S.; Alshahrani, S. Diet: A Source of Endocrine Disruptors. Endocr. Metab. Immune Disord. Drug Targets 2020, 20, 633–645. [Google Scholar] [CrossRef]
- Dionisio, K.L.; Phillips, K.; Price, P.S.; Grulke, C.M.; Williams, A.; Biryol, D.; Hong, T.; Isaacs, K.K. The Chemical and Products Database, a Resource for Exposure-Relevant Data on Chemicals in Consumer Products. Sci. Data 2018, 5, 180125. [Google Scholar] [CrossRef]
- Weatherly, L.M.; Gosse, J.A. Triclosan Exposure, Transformation, and Human Health Effects. J. Toxicol. Environ. Health Part B 2017, 20, 447–469. [Google Scholar] [CrossRef] [PubMed]
- Bedoux, G.; Roig, B.; Thomas, O.; Dupont, V.; Le Bot, B. Occurrence and Toxicity of Antimicrobial Triclosan and By-Products in the Environment. Environ. Sci. Pollut. Res. 2012, 19, 1044–1065. [Google Scholar] [CrossRef] [PubMed]
- Shrestha, P.; Zhang, Y.; Chen, W.-J.; Wong, T.-Y. Triclosan: Antimicrobial Mechanisms, Antibiotics Interactions, Clinical Applications, and Human Health. J. Environ. Sci. Health C Toxicol. Carcinog. 2020, 38, 245–268. [Google Scholar] [CrossRef]
- Zhu, W.; Zhang, H.; Tong, C.; Xie, C.; Fan, G.; Zhao, S.; Yu, X.; Tian, Y.; Zhang, J.; Zhu, W.; et al. Environmental Exposure to Triclosan and Semen Quality. Int. J. Environ. Res. Public Health 2016, 13, 224. [Google Scholar] [CrossRef]
- Zhu, W.; Zhou, W.; Huo, X.; Zhao, S.; Gan, Y.; Wang, B.; Cheng, W.; Ouyang, F.; Wang, W.; Tian, Y.; et al. Triclosan and Female Reproductive Health: A Preconceptional Cohort Study. Epidemiology 2019, 30 (Suppl. 1), S24–S31. [Google Scholar] [CrossRef]
- Wang, C.F.; Tian, Y. Reproductive Endocrine-Disrupting Effects of Triclosan: Population Exposure, Present Evidence and Potential Mechanisms. Environ. Pollut. 2015, 206, 195–201. [Google Scholar] [CrossRef]
- Kim, M.J.; Park, H.J.; Lee, S.; Kang, H.G.; Jeong, P.S.; Park, S.H.; Park, Y.H.; Lee, J.H.; Lim, K.S.; Lee, S.H.; et al. Effect of Triclosan Exposure on Developmental Competence in Parthenogenetic Porcine Embryo during Preimplantation. Int. J. Mol. Sci. 2020, 21, 5790. [Google Scholar] [CrossRef]
- Du, Y.; Wang, B.; Cai, Z.; Zhang, H.; Wang, B.; Liang, W.; Zhou, G.; Ouyang, F.; Wang, W. The Triclosan-Induced Shift from Aerobic to Anaerobic Metabolism Link to Increased Steroidogenesis in Human Ovarian Granulosa Cells. Ecotoxicol. Environ. Saf. 2021, 220, 112389. [Google Scholar] [CrossRef] [PubMed]
- Chen, W.; Yang, X.; Wang, B.; Wang, L.; Yu, X. The Effects and Possible Mechanisms of Triclosan on Steroidogenesis in Primary Rat Granulosa Cells. Reprod. Toxicol. 2019, 83, 28–37. [Google Scholar] [CrossRef]
- Arismendi, D.; Alanis, C.; Richter, P.; Paredes, A.H. Effect of Triclosan Exposure on Ovarian Hormones, Trace Elements and Growth in Female Rats. Chemosphere 2022, 307, 135964. [Google Scholar] [CrossRef]
- Cao, X.-Y.; Hua, X.; Xiong, J.-W.; Zhu, W.-T.; Zhang, J.; Chen, L. Impact of Triclosan on Female Reproduction through Reducing Thyroid Hormones to Suppress Hypothalamic Kisspeptin Neurons in Mice. Front. Mol. Neurosci. 2018, 11, 6. [Google Scholar] [CrossRef] [PubMed]
- Vandenberg, L.N.; Colborn, T.; Hayes, T.B.; Heindel, J.J.; Jacobs, D.R.; Lee, D.-H.; Shioda, T.; Soto, A.M.; vom Saal, F.S.; Welshons, W.V.; et al. Hormones and Endocrine-Disrupting Chemicals: Low-Dose Effects and Nonmonotonic Dose Responses. Endocr. Rev. 2012, 33, 378–455. [Google Scholar] [CrossRef] [PubMed]
- Vandenberg, L.N. Non-Monotonic Dose Responses in Studies of Endocrine Disrupting Chemicals: Bisphenol a as a Case Study. Former. Nonlinearity Biol. 2014, 12, 259–276. [Google Scholar] [CrossRef]
- Downs, S.M.; Humpherson, P.G.; Leese, H.J. Pyruvate Utilization by Mouse Oocytes Is Influenced by Meiotic Status and the Cumulus Oophorus. Mol. Reprod. Dev. 2002, 62, 113–123. [Google Scholar] [CrossRef]
- Johnson, M.T.; Freeman, E.A.; Gardner, D.K.; Hunt, P.A. Oxidative Metabolism of Pyruvate Is Required for Meiotic Maturation of Murine Oocytes In Vivo1. Biol. Reprod. 2007, 77, 2–8. [Google Scholar] [CrossRef]
- Roberts, R.; Stark, J.; Iatropoulou, A.; Becker, D.L.; Franks, S.; Hardy, K. Energy Substrate Metabolism of Mouse Cumulus-Oocyte Complexes: Response to Follicle-Stimulating Hormone Is Mediated by the Phosphatidylinositol 3-Kinase Pathway and Is Associated with Oocyte Maturation1. Biol. Reprod. 2004, 71, 199–209. [Google Scholar] [CrossRef]
- Ajao, C.; Andersson, M.A.; Teplova, V.V.; Nagy, S.; Gahmberg, C.G.; Andersson, L.C.; Hautaniemi, M.; Kakasi, B.; Roivainen, M.; Salkinoja-Salonen, M. Mitochondrial Toxicity of Triclosan on Mammalian Cells. Toxicol. Rep. 2015, 2, 624–637. [Google Scholar] [CrossRef]
- Lopes, A.S.; Lane, M.; Thompson, J.G. Oxygen Consumption and ROS Production Are Increased at the Time of Fertilization and Cell Cleavage in Bovine Zygotes. Hum. Reprod. 2010, 25, 2762–2773. [Google Scholar] [CrossRef]
- Leese, H.J.; Brison, D.R.; Sturmey, R.G. The Quiet Embryo Hypothesis: 20 Years On. Front. Physiol. 2022, 13, 899485. [Google Scholar] [CrossRef]
- Comhaire, F.H. Towards More Objectivity in Diagnosis and Management of Male Infertility; International journal of andrology; Supplement; Blackwell Scientific: Oxford, UK, 1987. [Google Scholar]
- Pizzorno, J. Environmental Toxins and Infertility. Integr. Med. 2018, 17, 8–11. [Google Scholar]


| Total Number of COCs Assessed for Nuclear Status | Treatment Group | |||
|---|---|---|---|---|
| Control | DMSO | TCS (10 nM) | TCS (1 nM) | |
| 352 | 85 | 99 | 87 | 81 |
| Amino Acids | Treatment | |||||||
|---|---|---|---|---|---|---|---|---|
| Control | DMSO | TCS (10 nM) | TCS (1 nM) | |||||
| Mean | SD | Mean | SD | Mean | SD | Mean | SD | |
| Asp | 0.068 | ±0.147 | 0.113 | ±0.237 | 0.043 | ±0.273 | 0.025 | ±0.178 |
| Glu | −1.031 | ±0.771 | −1.083 | ±0.727 | −1.209 | ±0.943 | −1.32 | ±0.745 |
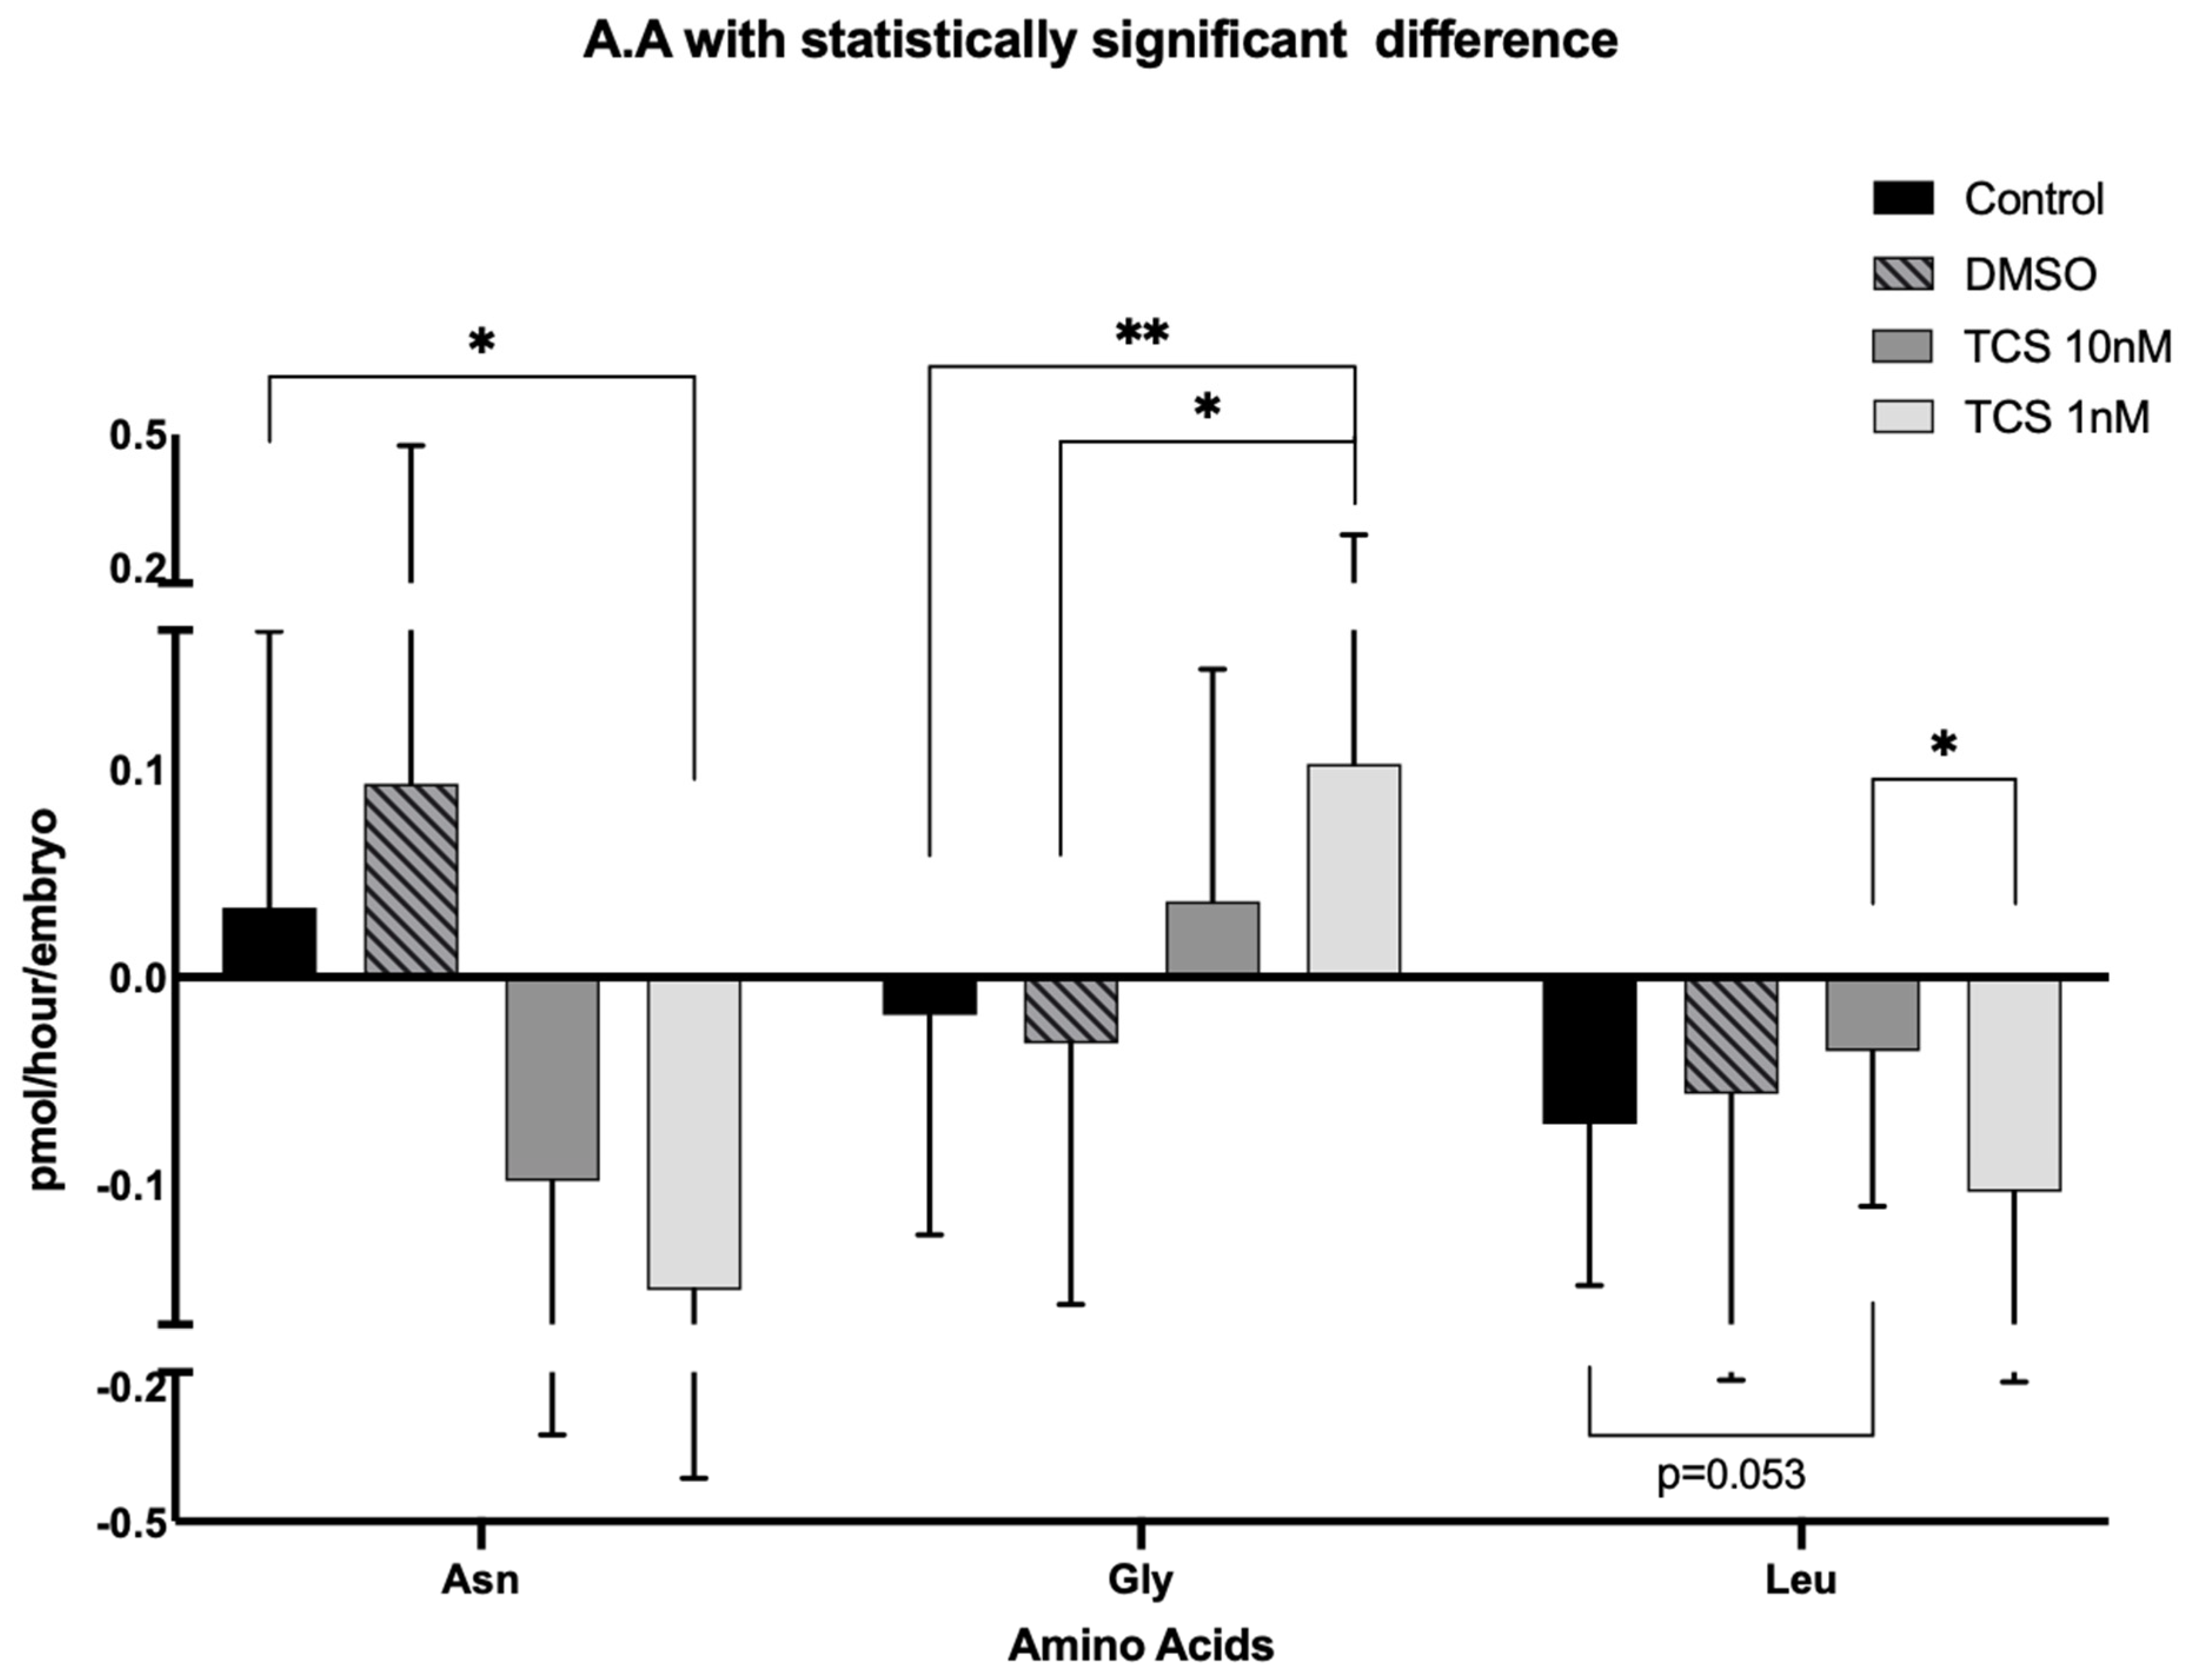
| Asn * | 0.035 | ±0.139 | 0.093 | ±0.382 | −0.113 | ±0.201 | −0.15 | ±0.253 |
| Ser | −0.086 | ±0.079 | −0.098 | ±0.111 | −0.074 | ±0.069 | −0.091 | ±0.220 |
| His | −0.059 | ±0.160 | 0.073 | ±0.287 | −0.042 | ±0.104 | −0.099 | ±0.152 |
| Gln | 0.179 | ±0.484 | 0.656 | ±1.018 | 0.274 | ±0.646 | 0.254 | ±1.228 |
| Gly * | −0.013 | ±0.109 | −0.032 | ±0.125 | 0.036 | ±0.111 | 0.102 | ±0.173 |
| Thr | −0.016 | ±0.088 | −0.02 | ±0.075 | −0.033 | ±0.105 | 0.038 | ±0.234 |
| Arg | −0.729 | ±0.556 | −0.742 | ±0.697 | −0.669 | ±0.449 | −0.455 | ±1.117 |
| Ala | 0.865 | ±0.492 | 0.765 | ±0.576 | 0.748 | ±0.650 | 0.981 | ±0.713 |
| Tyr | −0.016 | ±0.053 | −0.034 | ±0.056 | −0.017 | ±0.053 | −0.009 | ±0.071 |
| Trp | −0.032 | ±0.049 | −0.026 | ±0.057 | −0.034 | ±0.062 | −0.061 | ±0.075 |
| Met | −0.031 | ±0.027 | −0.03 | ±0.043 | −0.018 | ±0.024 | −0.029 | ±0.025 |
| Val | −0.037 | ±0.055 | −0.039 | ±0.072 | −0.029 | ±0.056 | −0.032 | ±0.059 |
| Phe | −0.013 | ±0.025 | −0.012 | ±0.042 | −0.006 | ±0.026 | −0.011 | ±0.029 |
| Iso | −0.03 | ±0.040 | −0.028 | ±0.06 | −0.028 | ±0.040 | −0.034 | ±0.047 |
| Leu * | −0.086 | ±0.071 | −0.056 | ±0.128 | −0.027 | ±0.078 | −0.103 | ±0.086 |
| Lys | 0.215 | ±0.274 | 0.383 | ±0.462 | 0.262 | ±0.300 | 0.261 | ±0.276 |
Disclaimer/Publisher’s Note: The statements, opinions and data contained in all publications are solely those of the individual author(s) and contributor(s) and not of MDPI and/or the editor(s). MDPI and/or the editor(s) disclaim responsibility for any injury to people or property resulting from any ideas, methods, instructions or products referred to in the content. |
© 2025 by the authors. Licensee MDPI, Basel, Switzerland. This article is an open access article distributed under the terms and conditions of the Creative Commons Attribution (CC BY) license (https://creativecommons.org/licenses/by/4.0/).
Share and Cite
Papachristofi, V.; McKeegan, P.J.; Leese, H.J.; Rotchell, J.M.; Sturmey, R.G. Oocyte Exposure to Low Levels of Triclosan Has a Significant Impact on Subsequent Embryo Physiology. Int. J. Environ. Res. Public Health 2025, 22, 1031. https://doi.org/10.3390/ijerph22071031
Papachristofi V, McKeegan PJ, Leese HJ, Rotchell JM, Sturmey RG. Oocyte Exposure to Low Levels of Triclosan Has a Significant Impact on Subsequent Embryo Physiology. International Journal of Environmental Research and Public Health. 2025; 22(7):1031. https://doi.org/10.3390/ijerph22071031
Chicago/Turabian StylePapachristofi, Vasiliki, Paul J. McKeegan, Henry J. Leese, Jeanette M. Rotchell, and Roger G. Sturmey. 2025. "Oocyte Exposure to Low Levels of Triclosan Has a Significant Impact on Subsequent Embryo Physiology" International Journal of Environmental Research and Public Health 22, no. 7: 1031. https://doi.org/10.3390/ijerph22071031
APA StylePapachristofi, V., McKeegan, P. J., Leese, H. J., Rotchell, J. M., & Sturmey, R. G. (2025). Oocyte Exposure to Low Levels of Triclosan Has a Significant Impact on Subsequent Embryo Physiology. International Journal of Environmental Research and Public Health, 22(7), 1031. https://doi.org/10.3390/ijerph22071031