


A Data-Driven Analysis of Work-Related Accidents in the Brazilian Mining Sector (2019–2022)


Abstract
1. Introduction
2. Materials and Methods
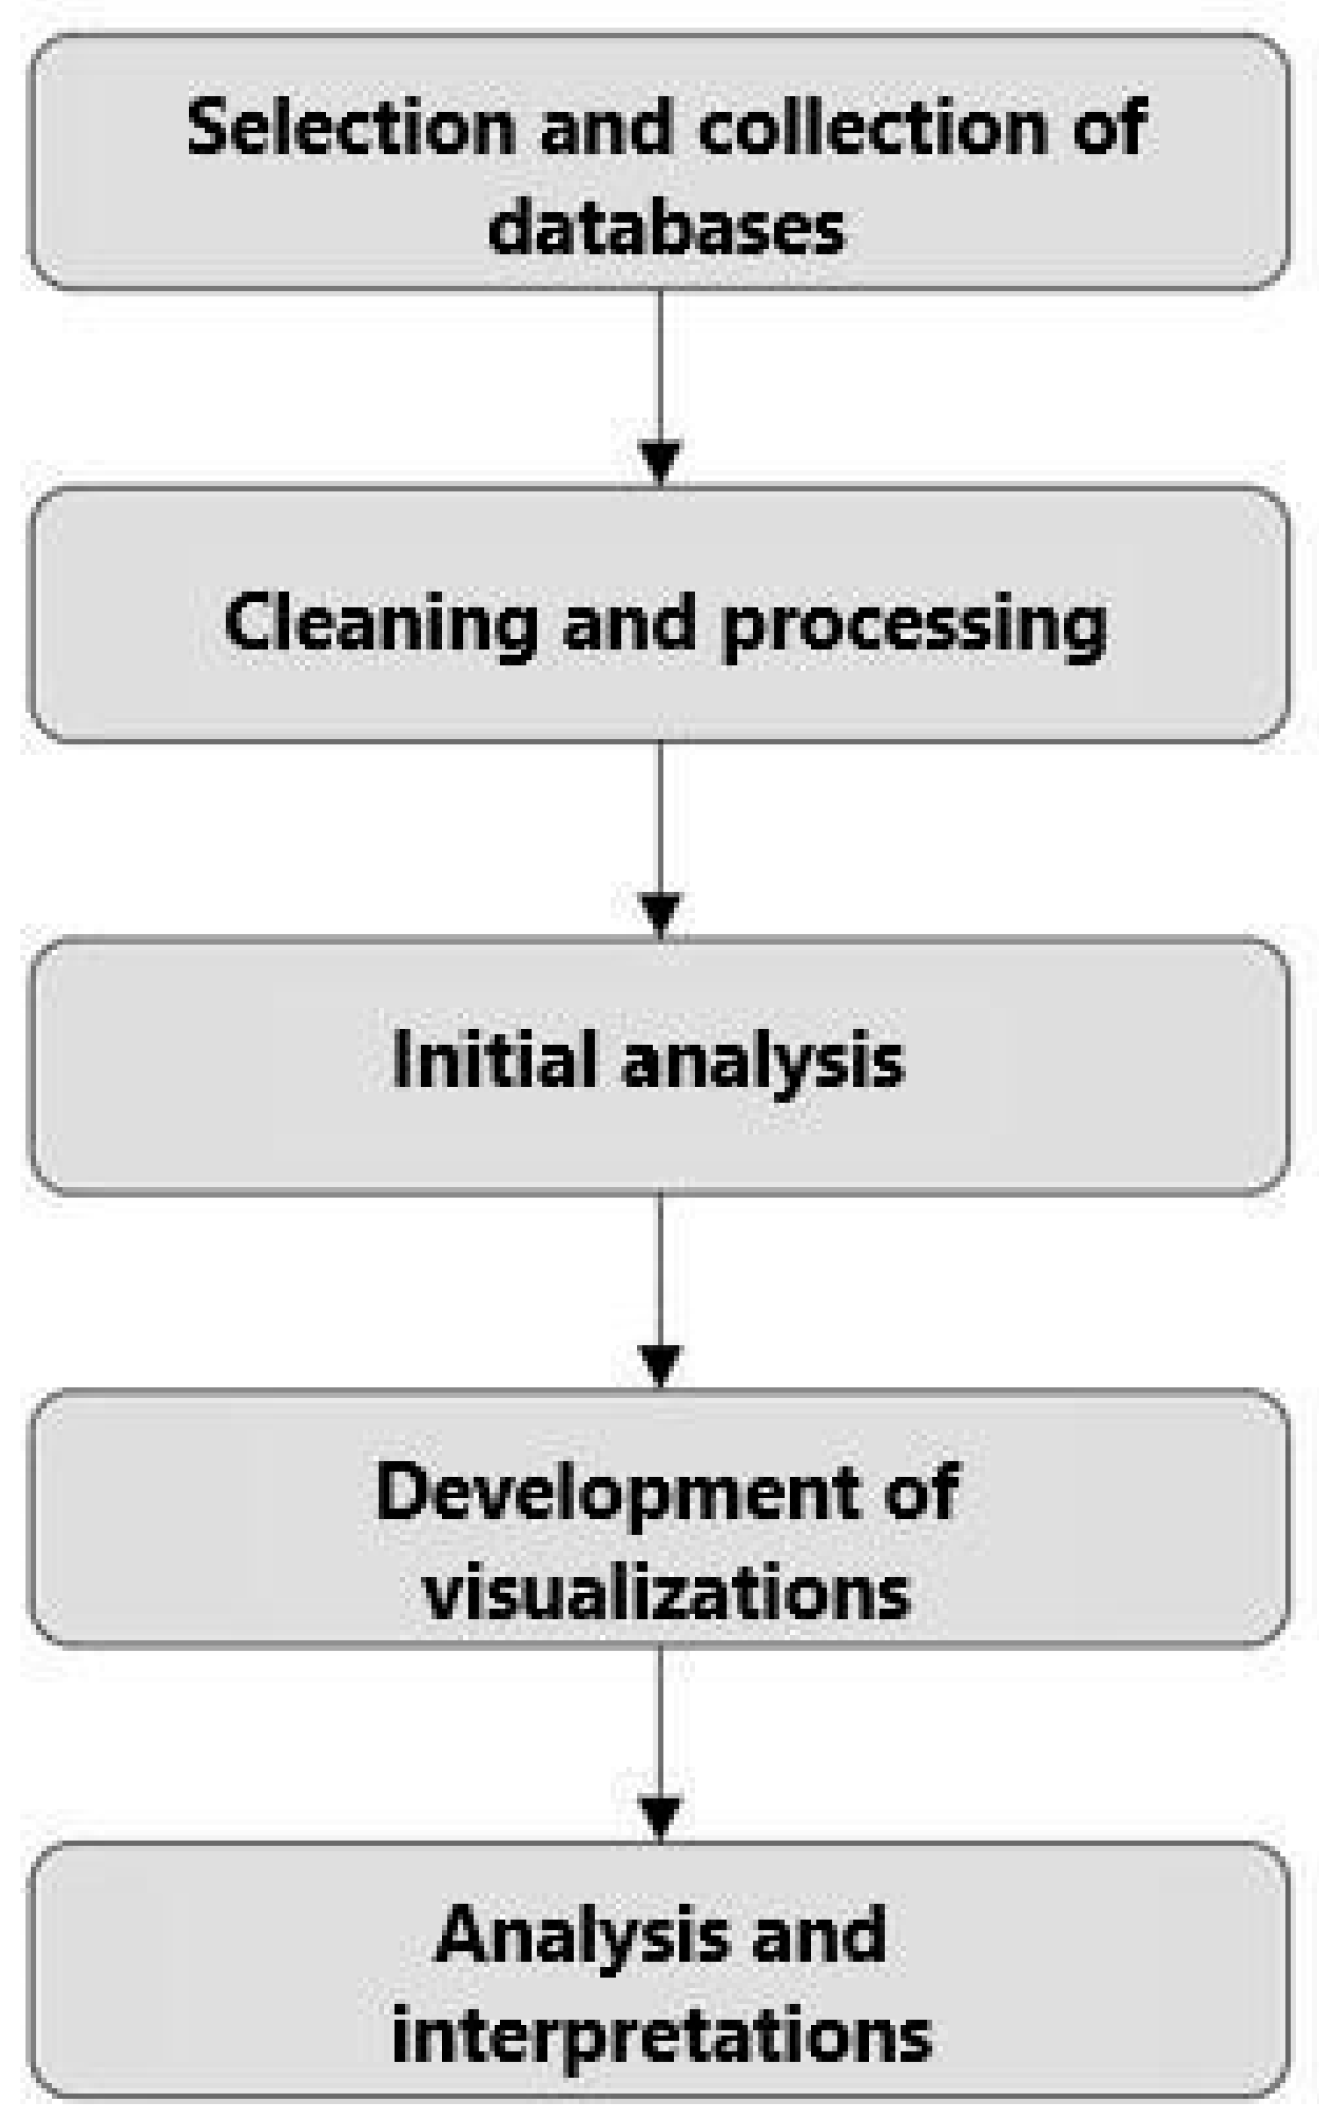
- Selection and database collection: This step involved identifying and selecting which sources were going to be used. The reliability of the sources and the relevance of the data for analysis were verified, including the dates of the information, how they were categorized, and finally, extracting the data.
- Data cleaning and processing: After the selection, the data were prepared for analysis. This process included data cleaning, aimed at correcting inconsistencies, handling missing values, and removing duplicates, ensuring quality and reliability for the analysis.
- Initial analysis: To preliminarily understand the data, initial handling was conducted to better comprehend how each dataset behaved individually.
- Development of visualizations: This stage involved creating various charts and tables, using Python graphing libraries such as Matplotlib, as well as other software, like Power BI. The objective was to validate and choose the best way to visualize the data among several possible options.
- Analysis and interpretations: The generated visualizations were analyzed to extract significant insights regarding accidents and fatalities in the mining sector. This analysis focused on identifying risk areas, critical periods, and common types of accidents, providing a solid foundation for future discussions and in-depth studies.
2.1. Database Selection
2.2. Data Cleaning and Processing
2.3. Initial Analysis
2.3.1. Categorization
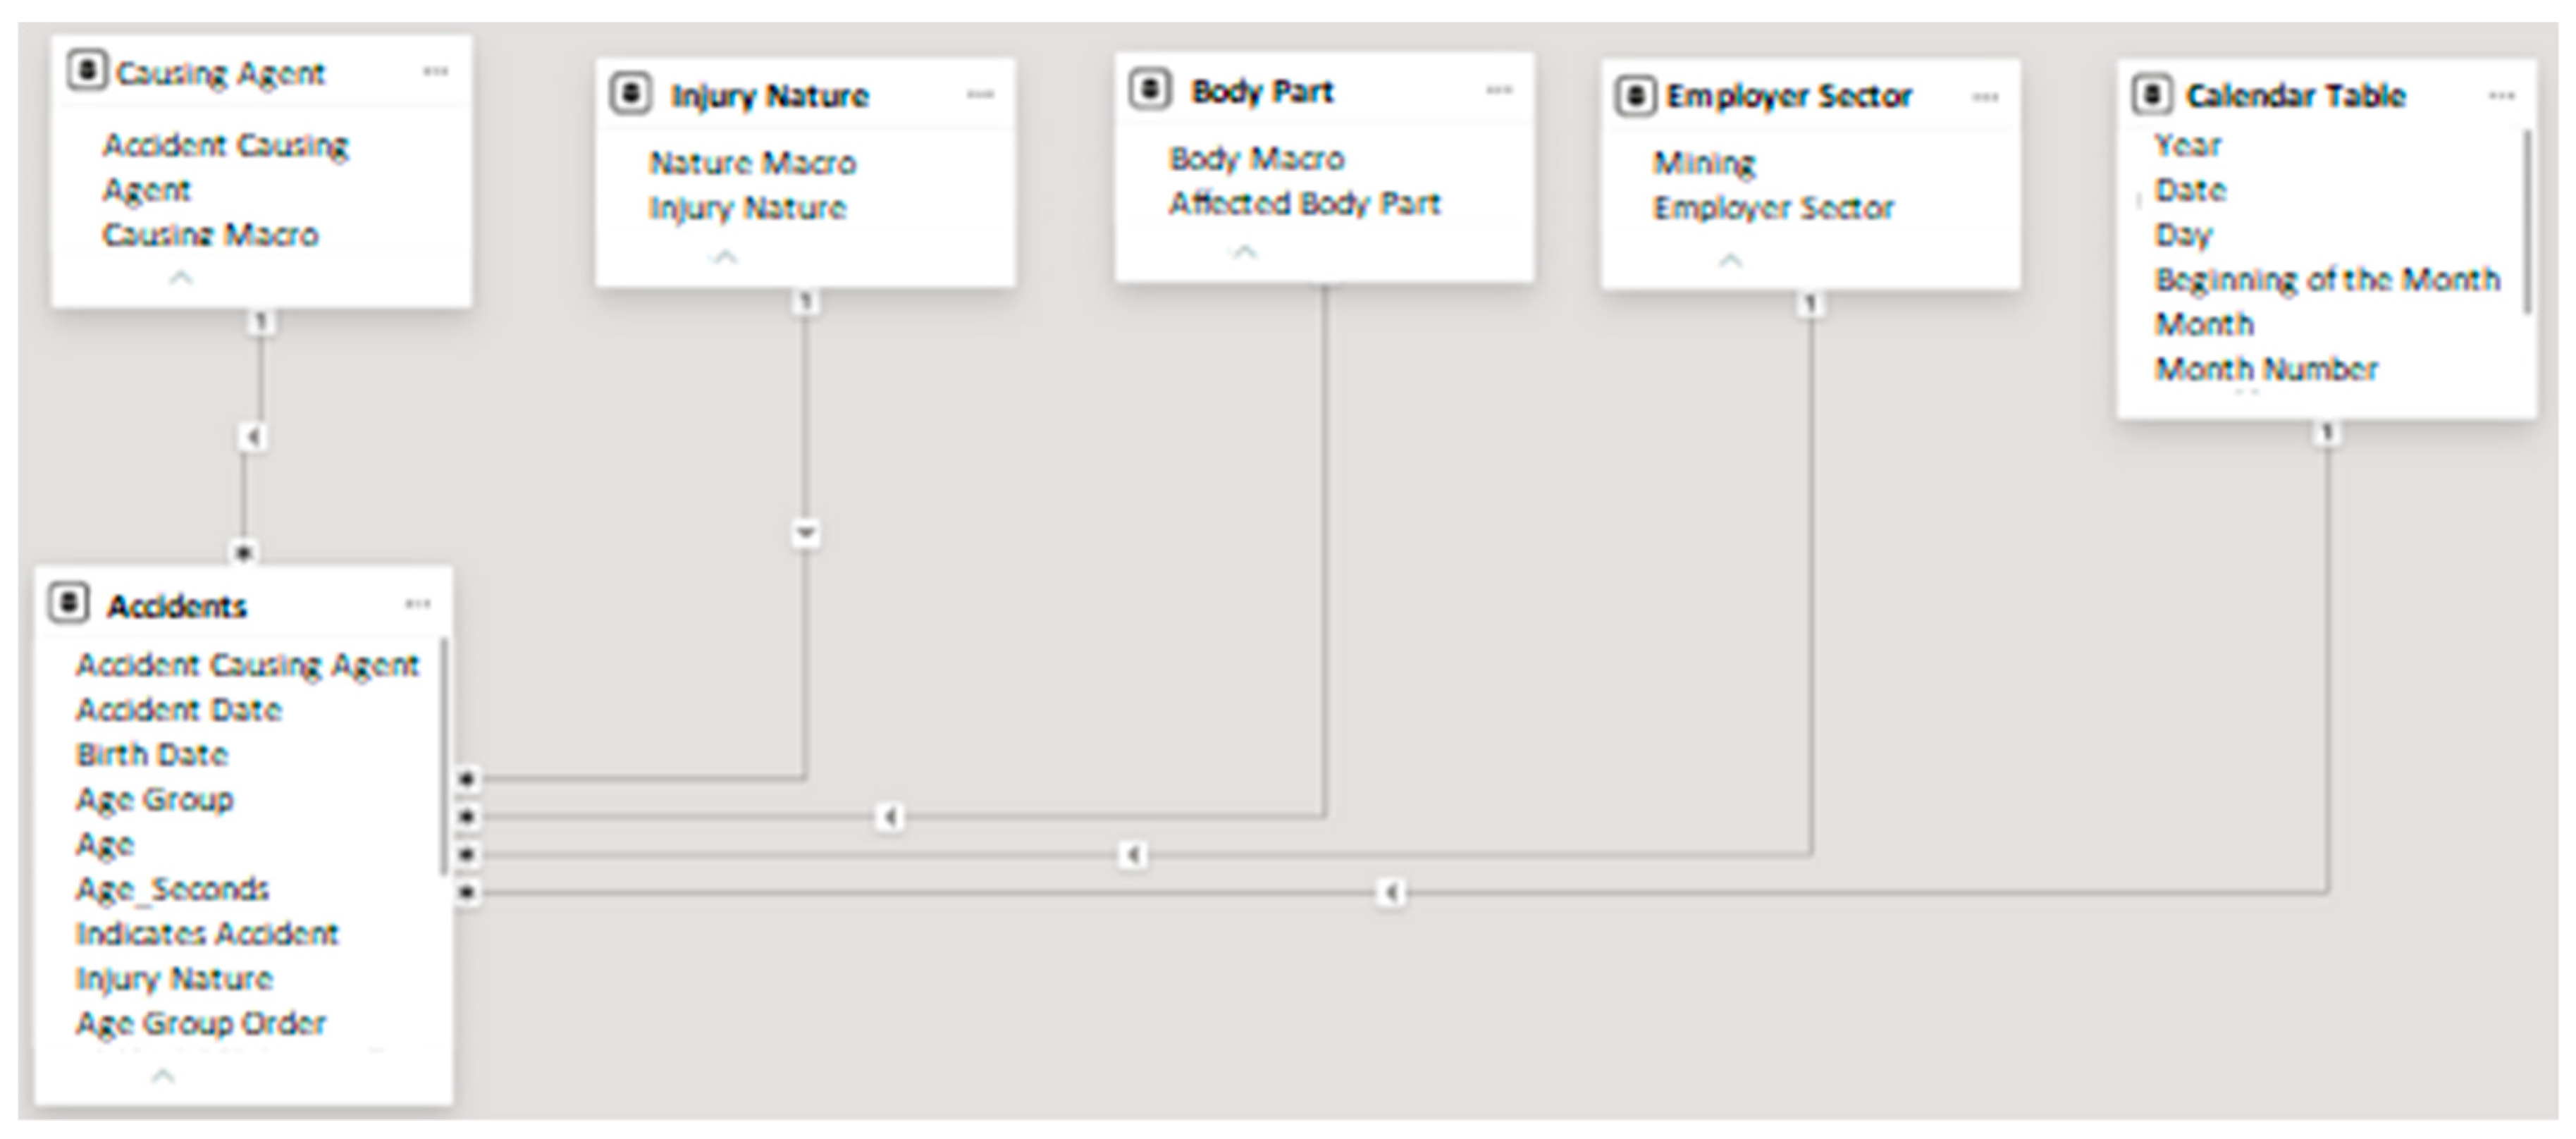
2.3.2. Table Relationship
3. Results and Discussion
3.1. Brazilian Mining Sector Overview
3.2. Brumadinho Disaster
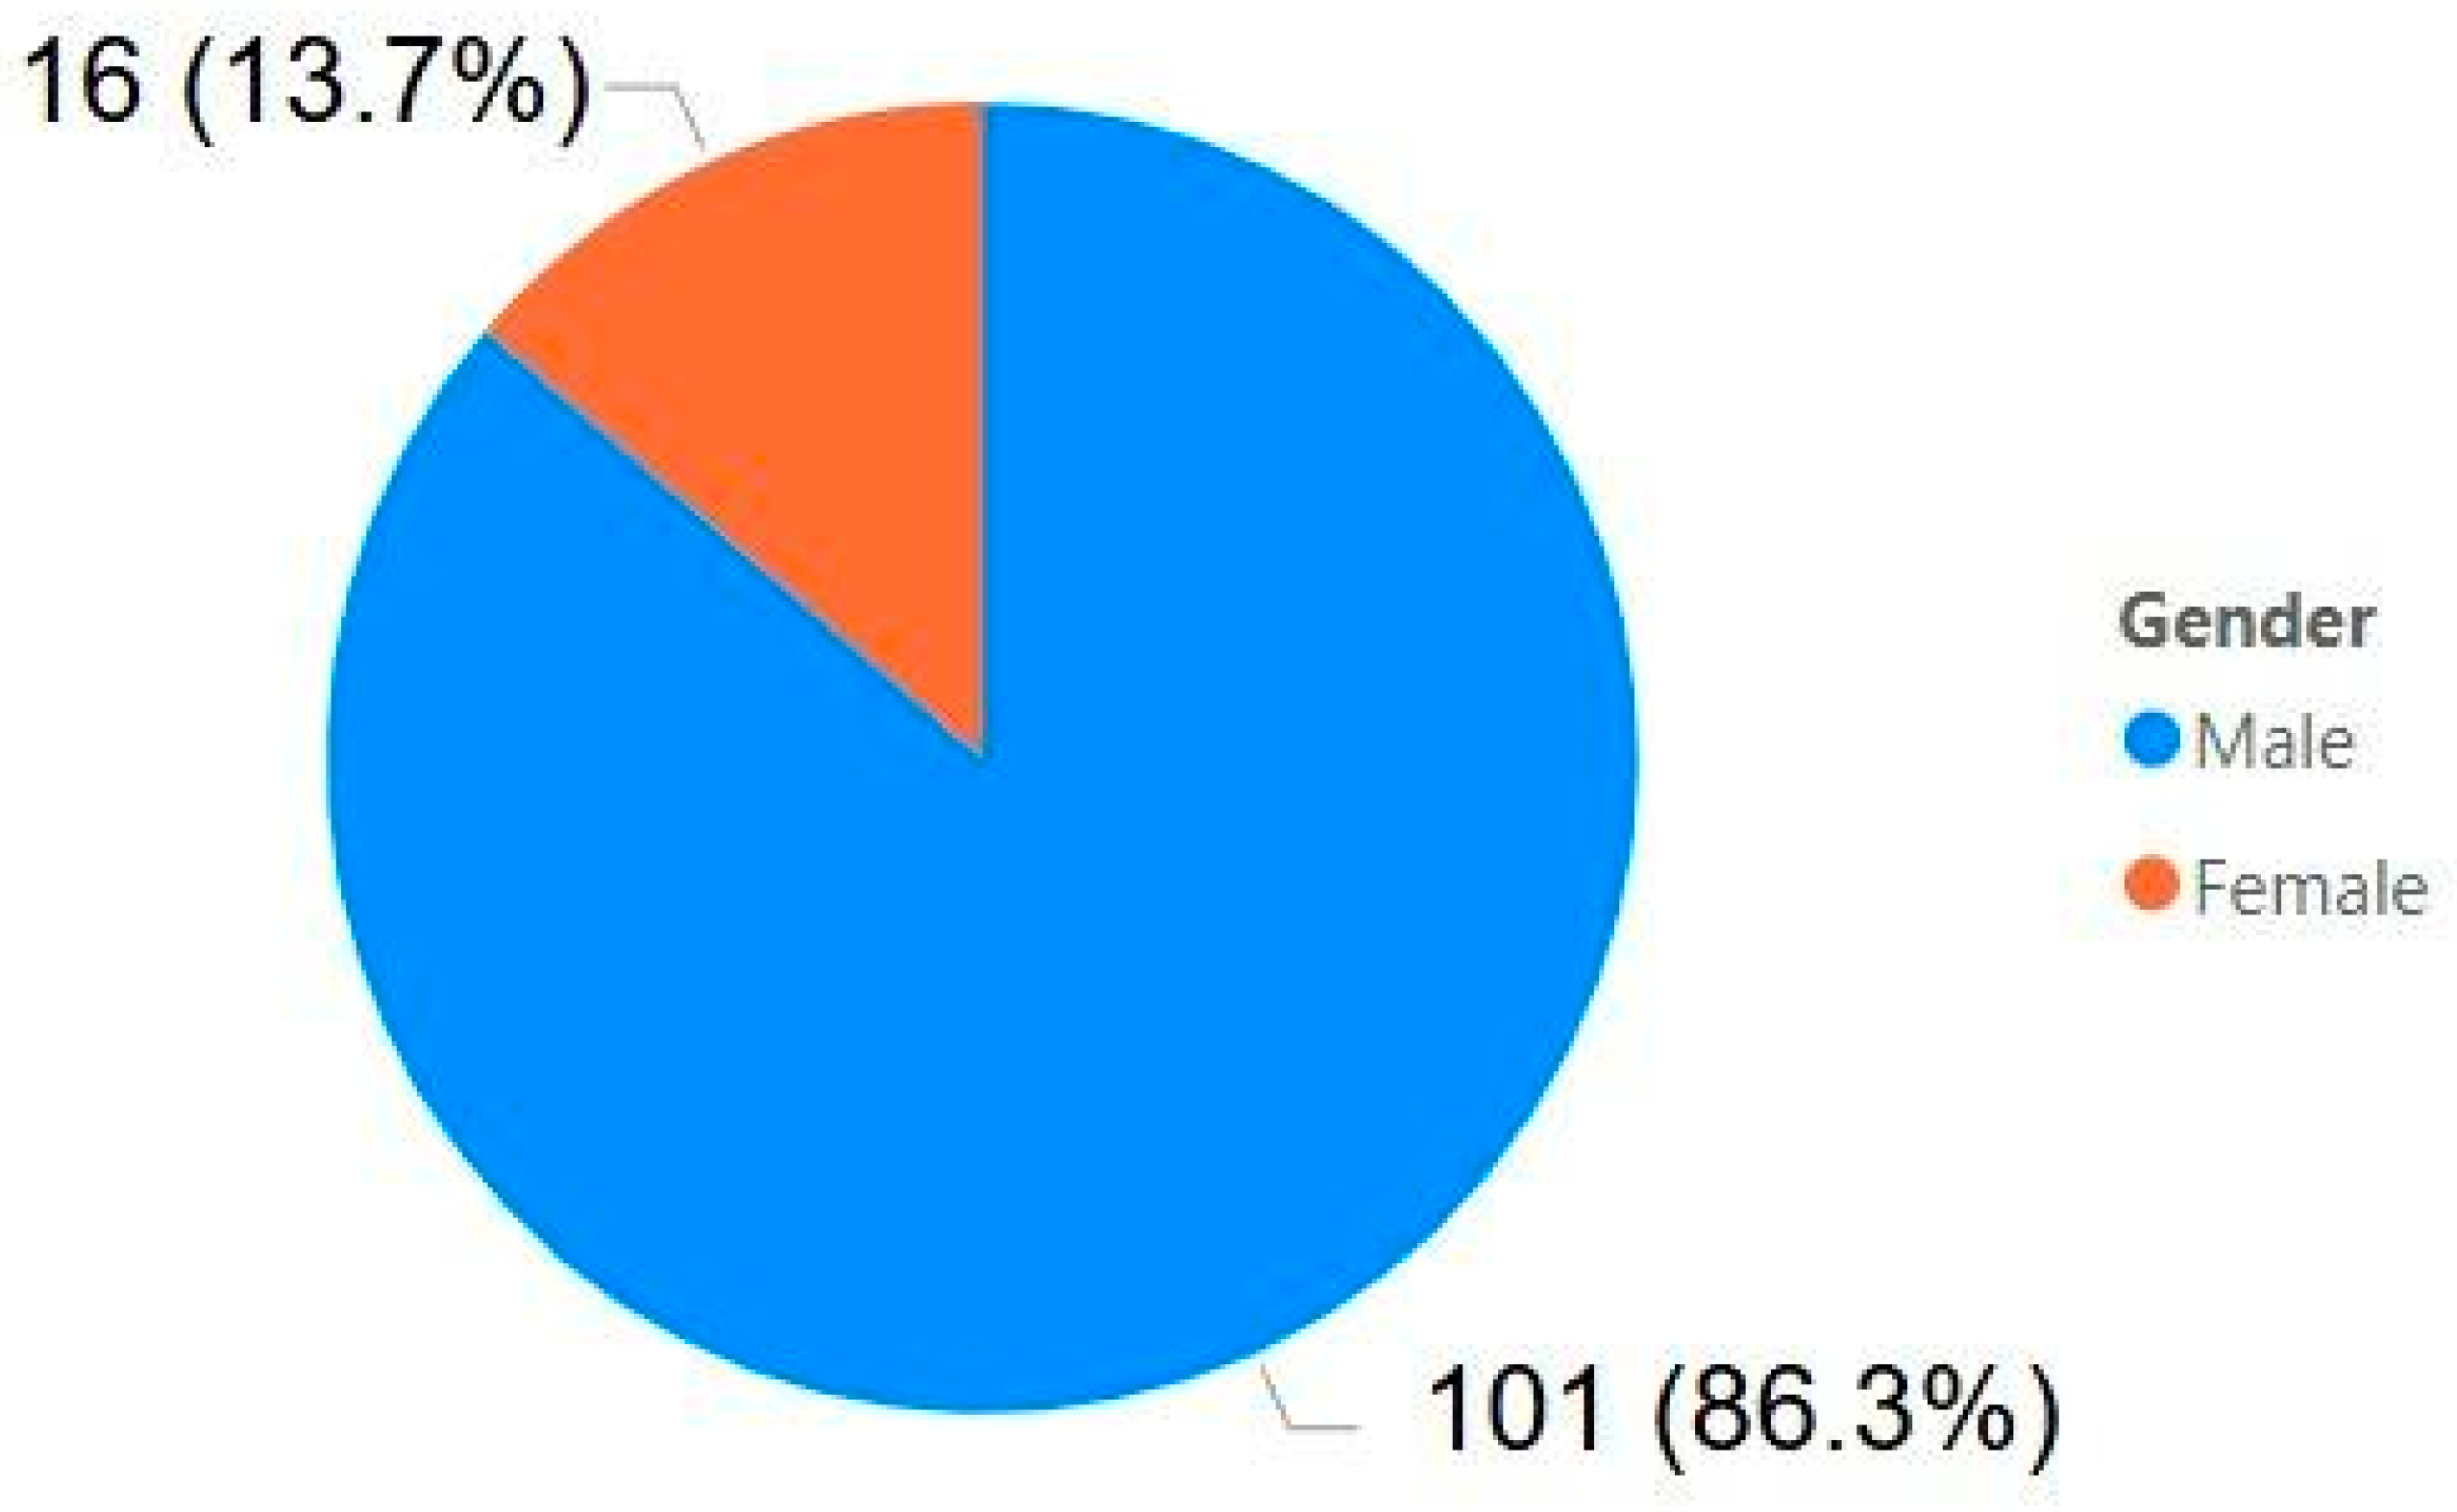
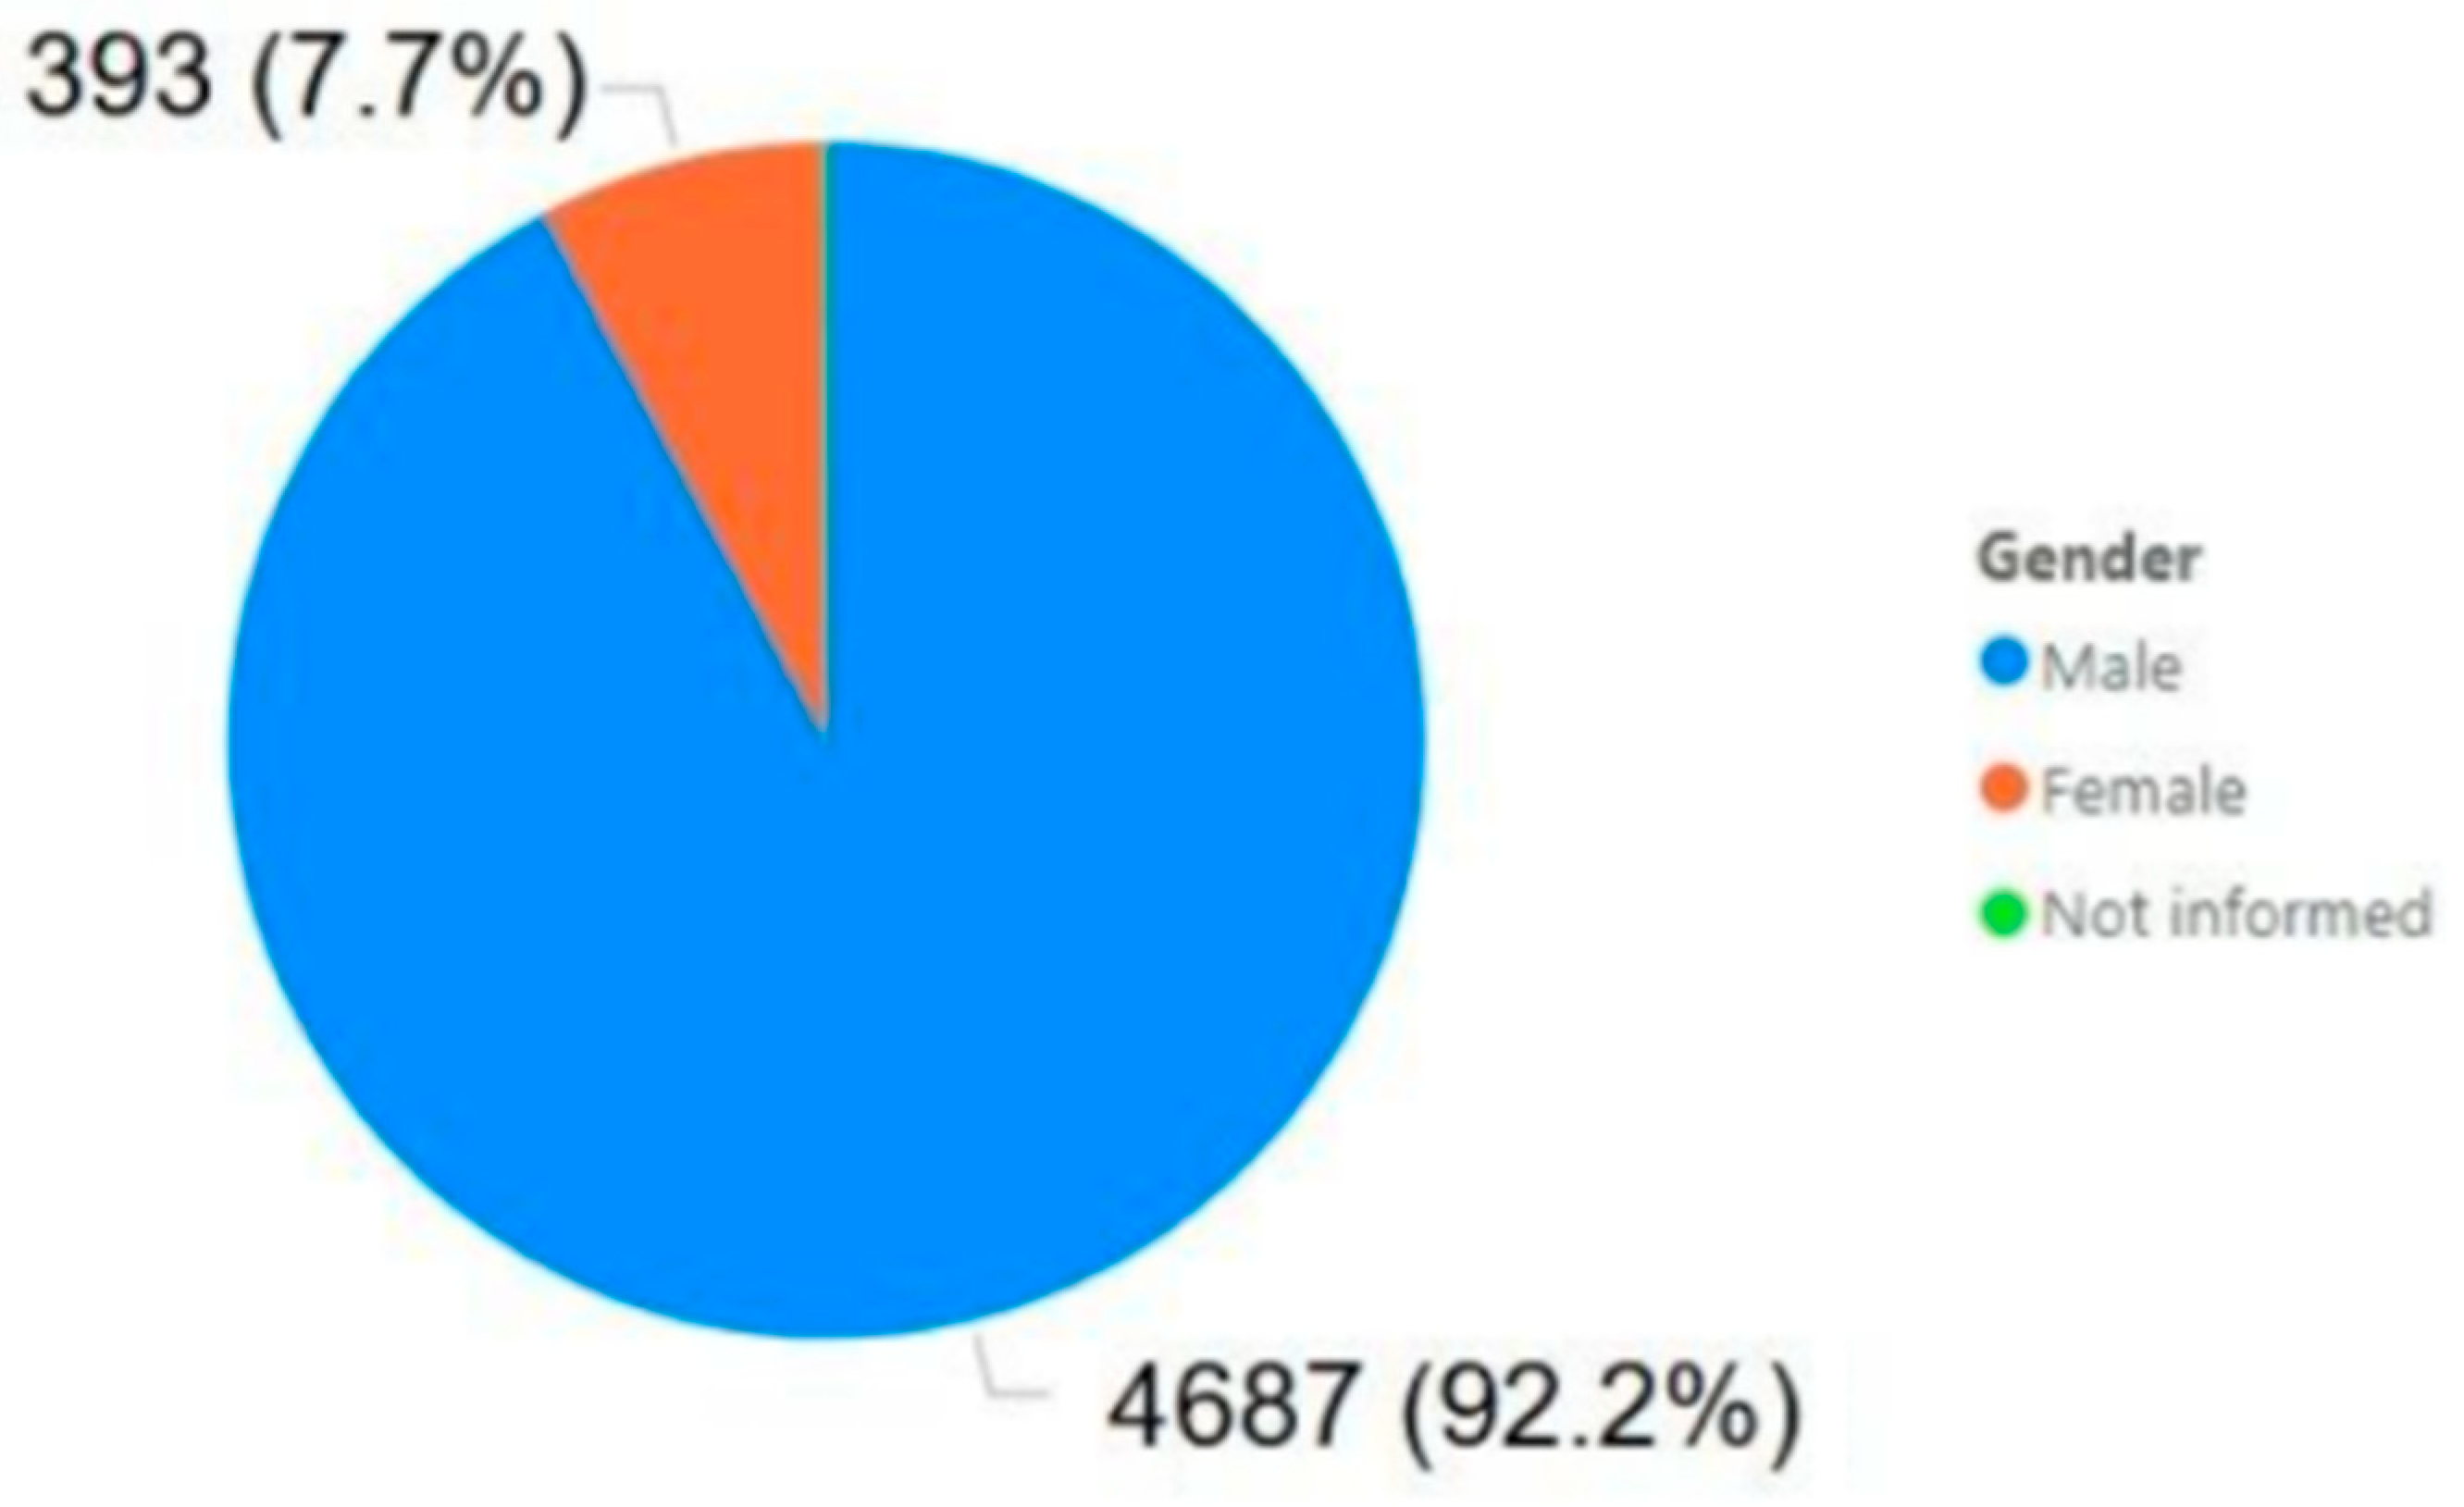
3.3. Accidents by Gender
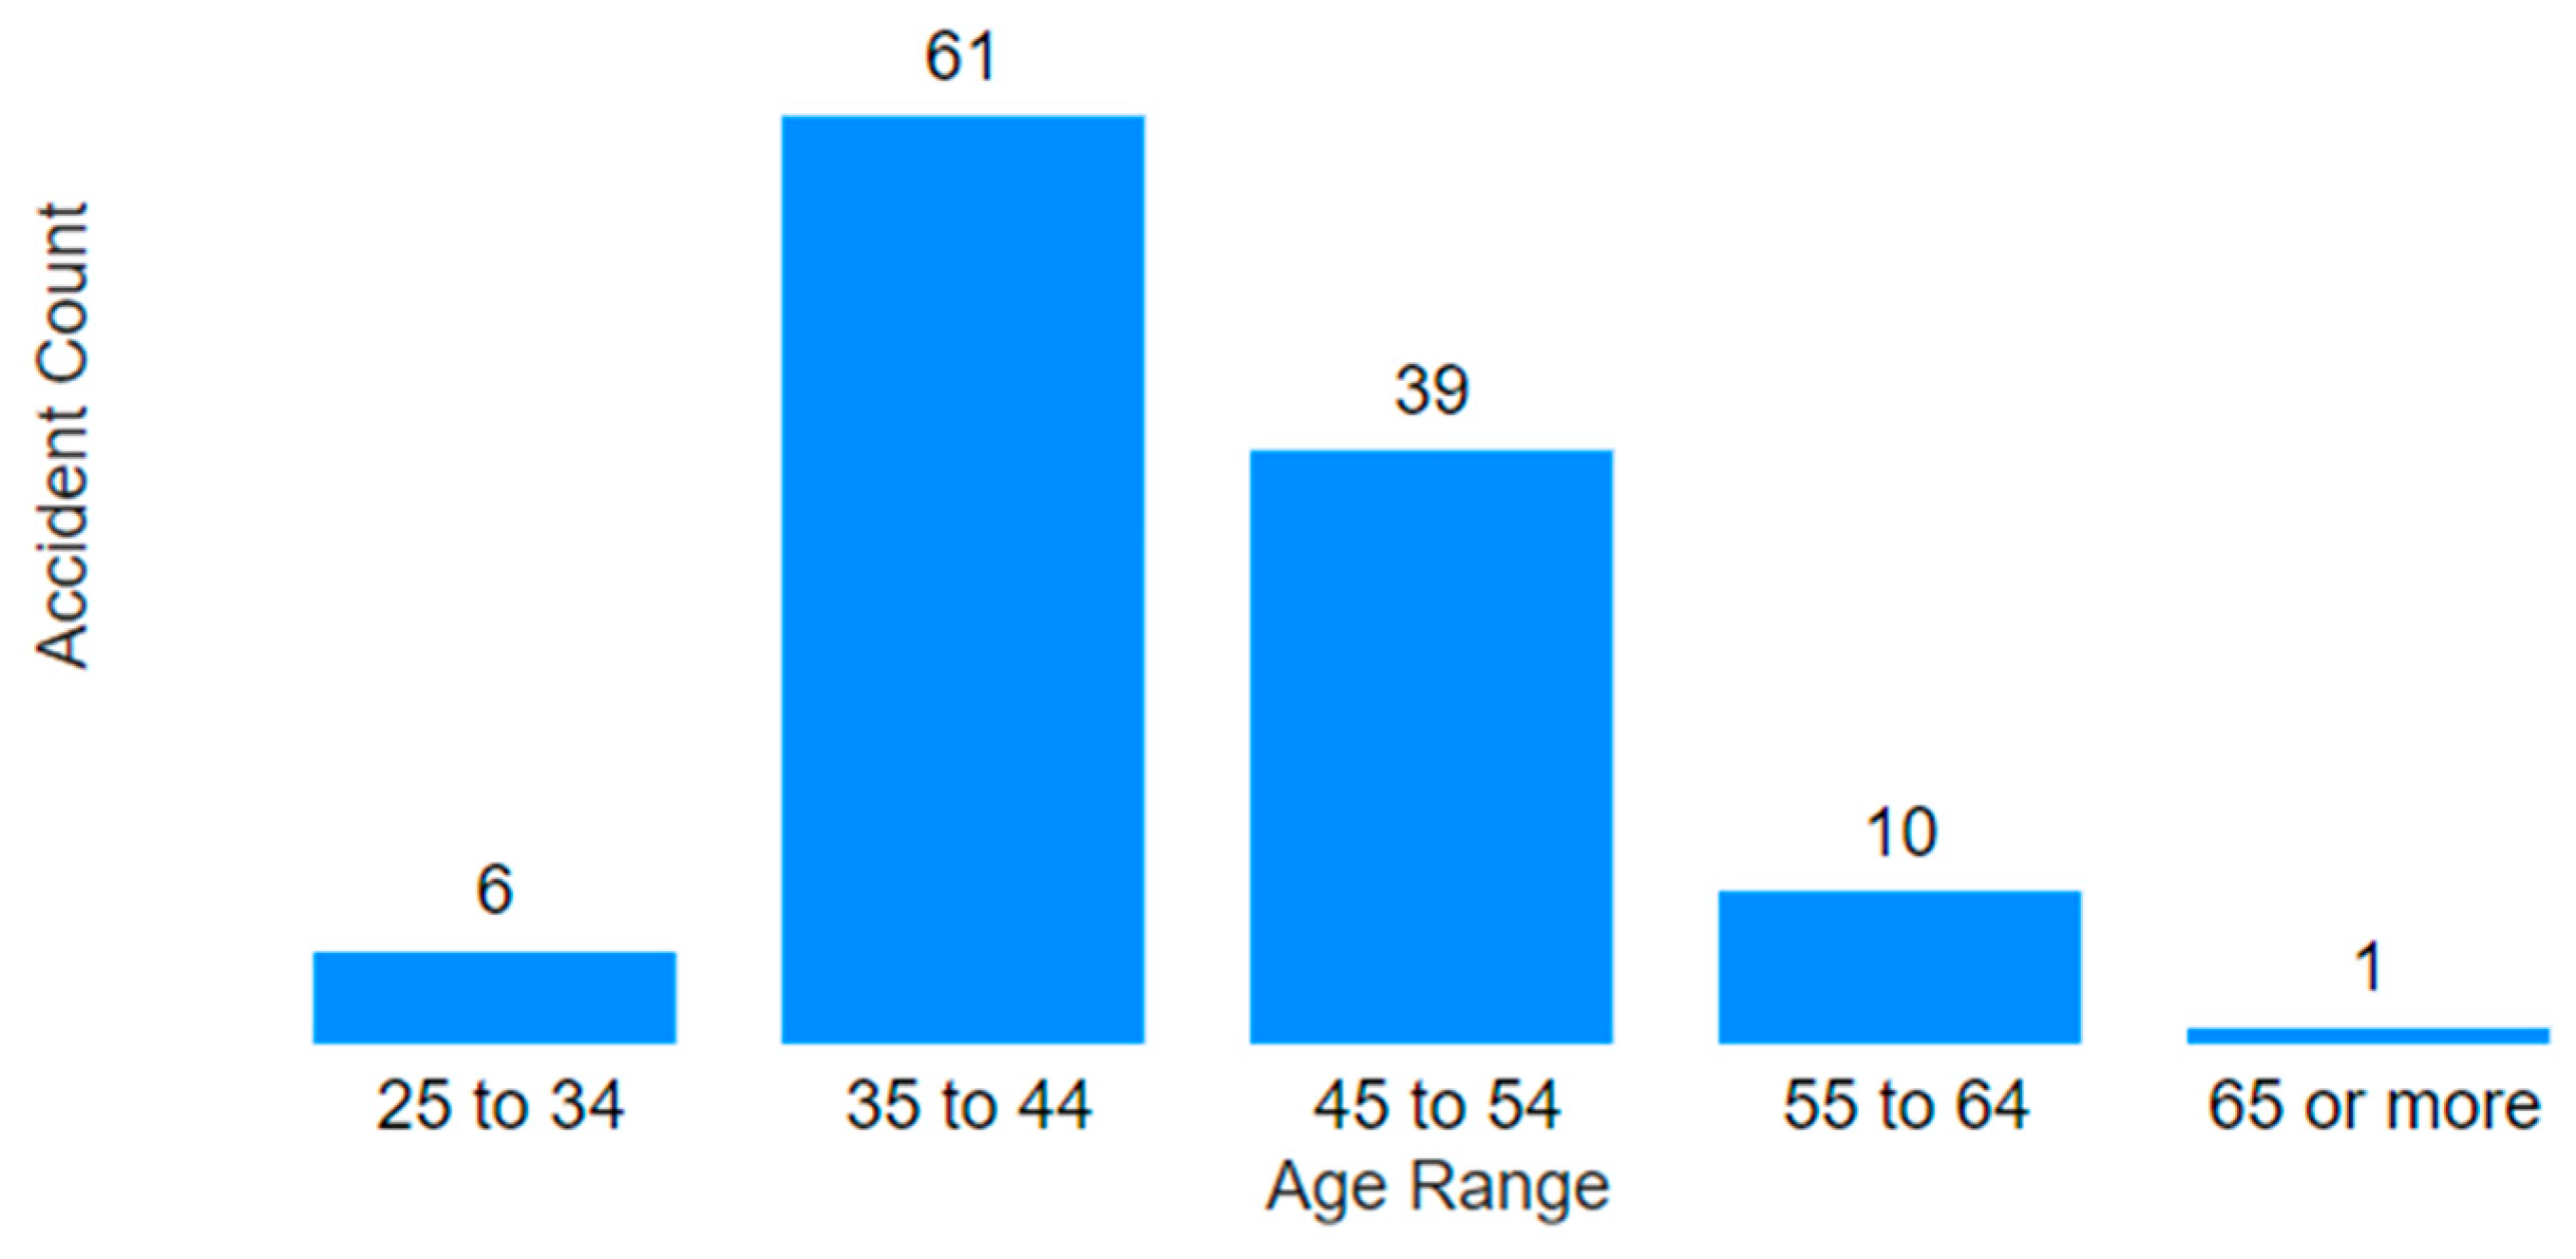
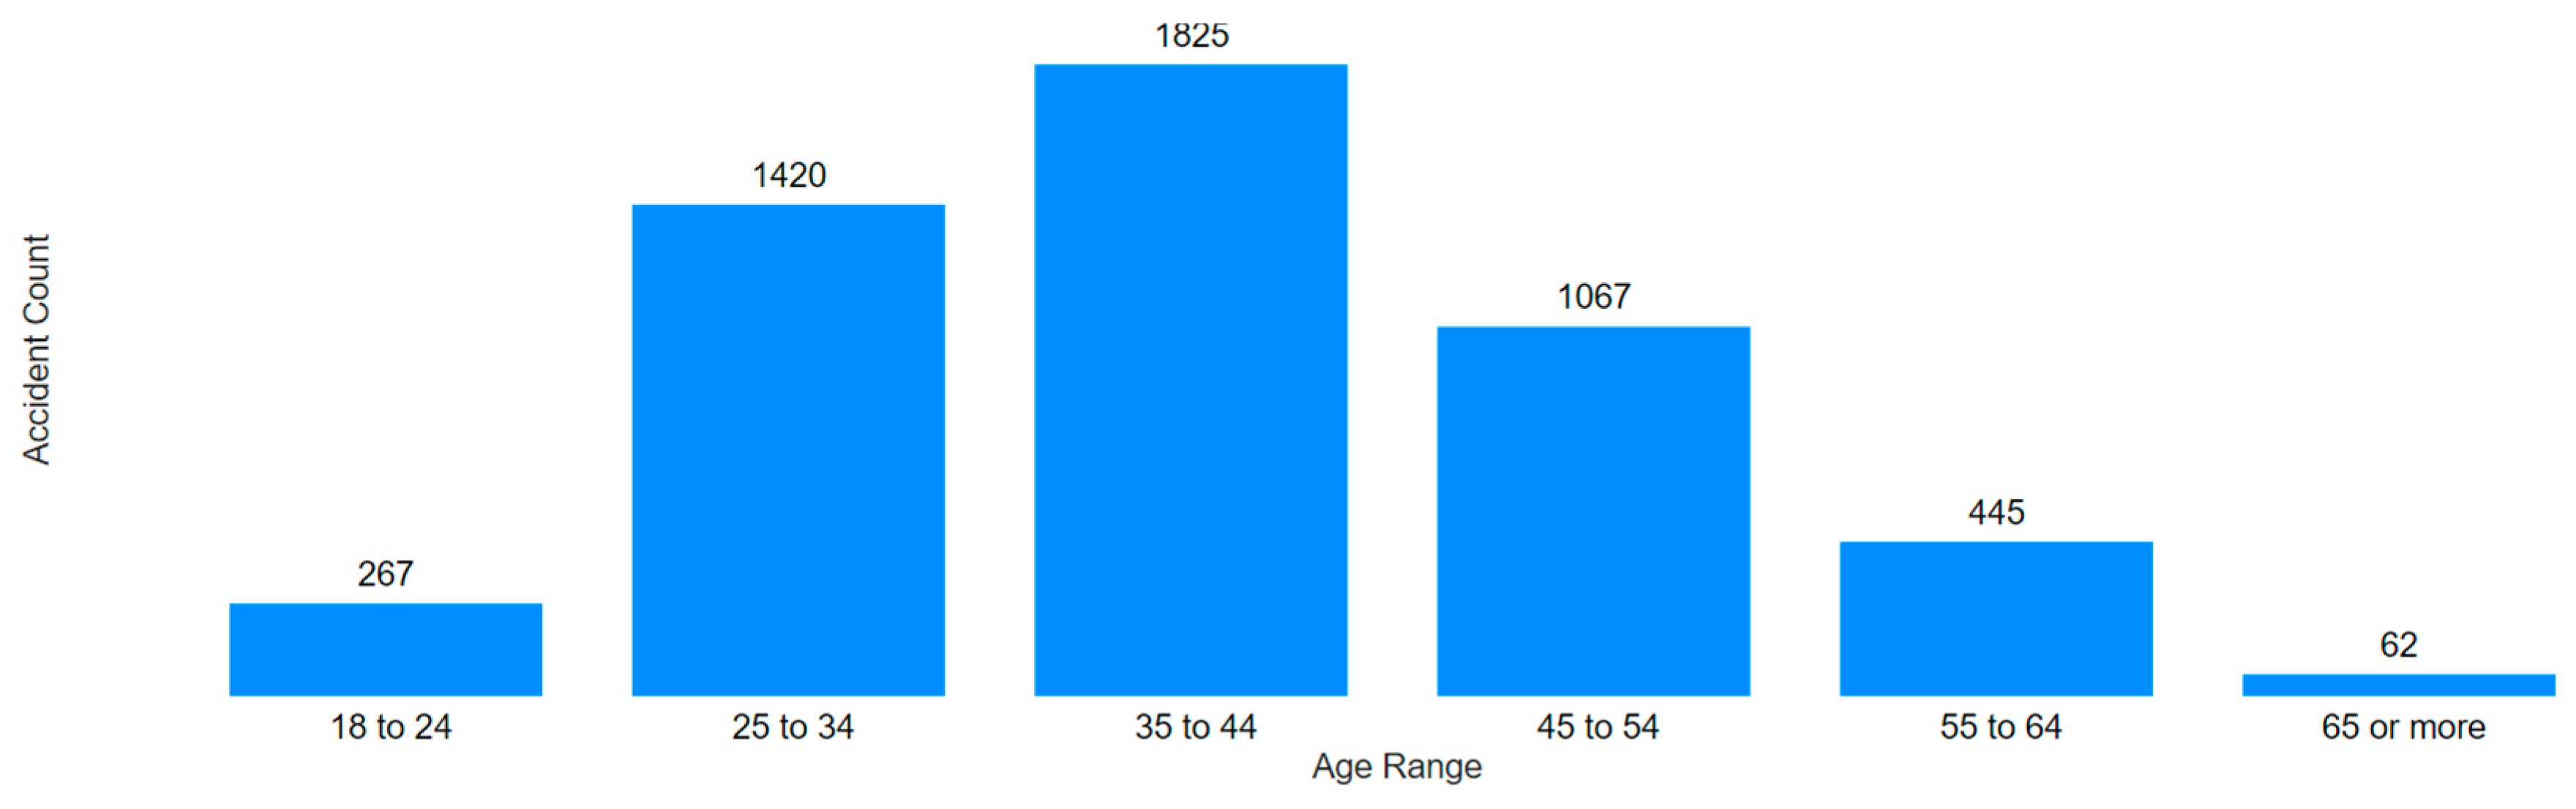
3.4. Age Analysis
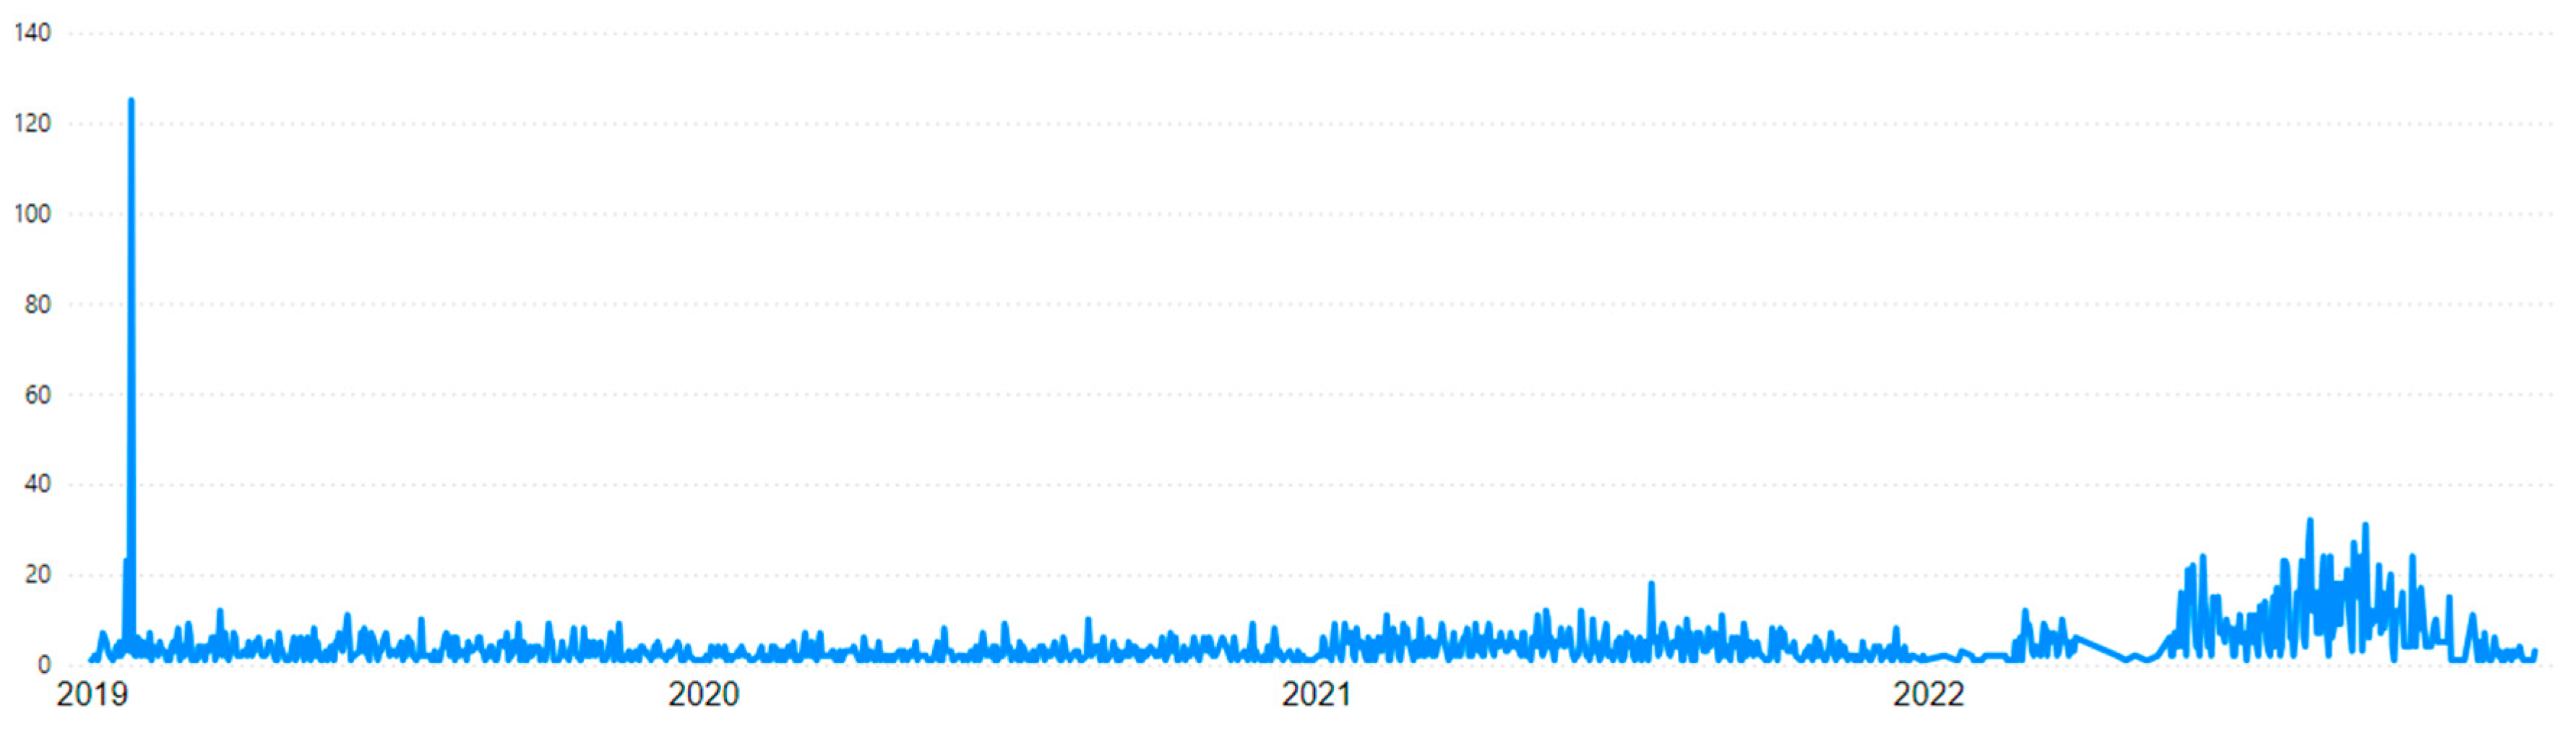
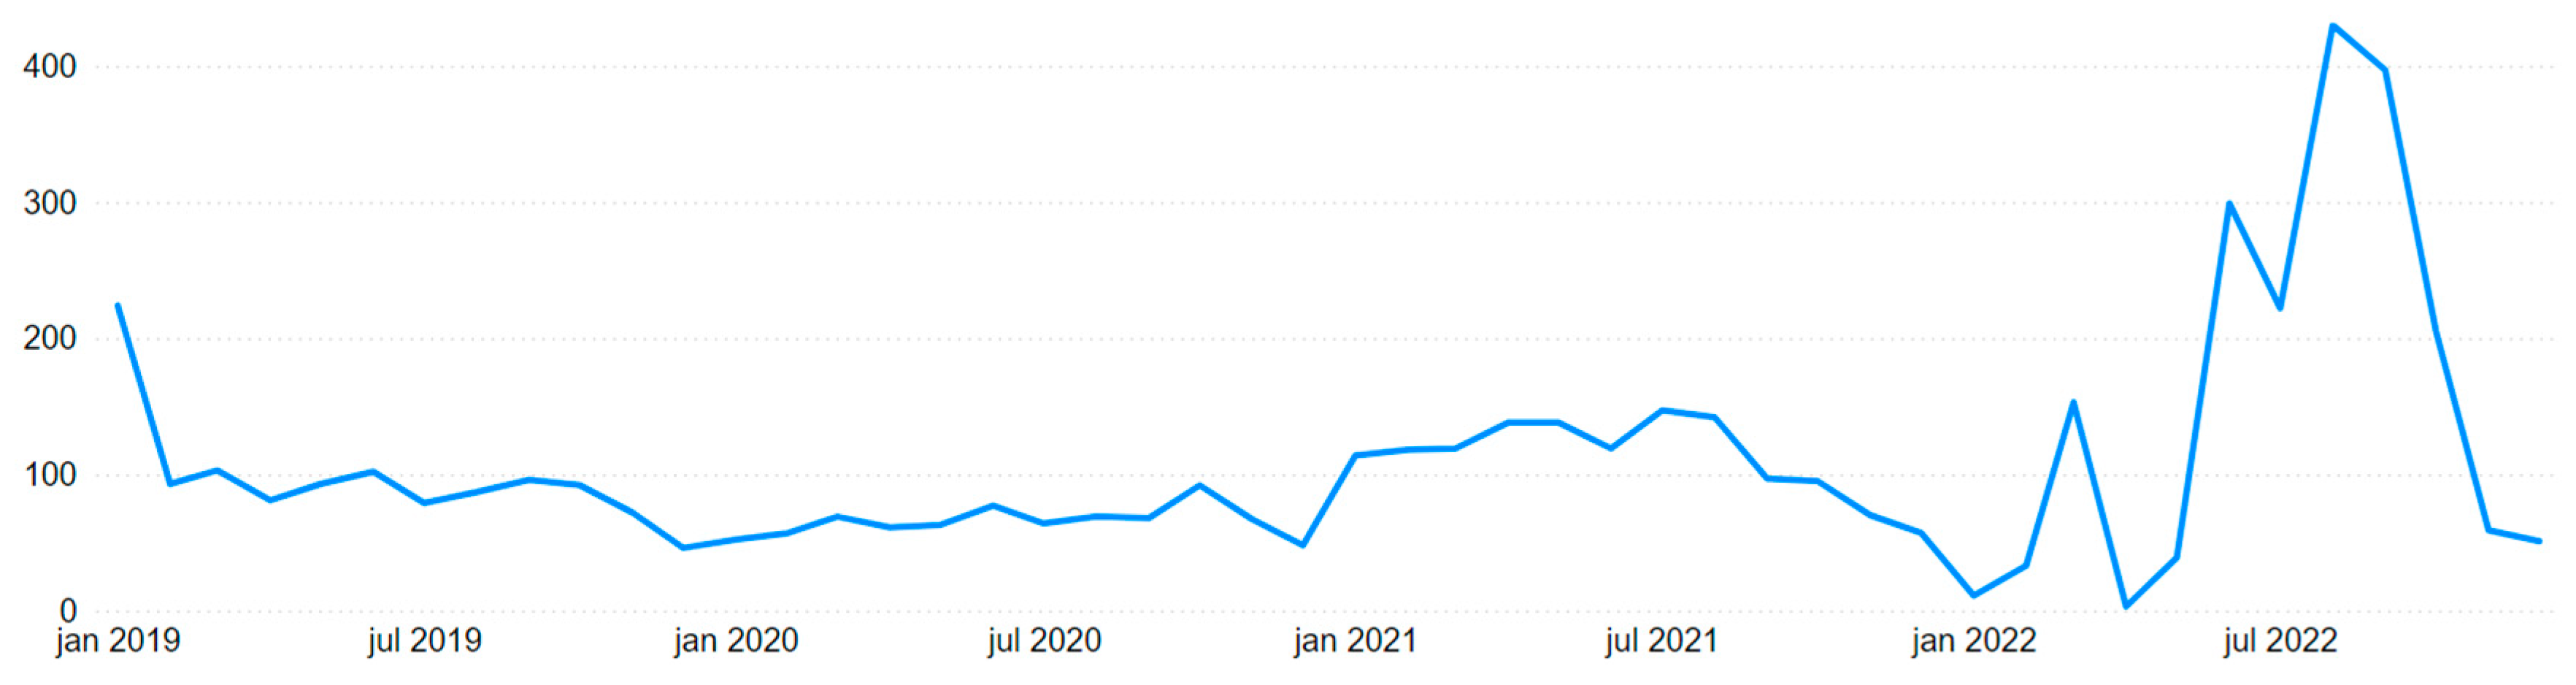
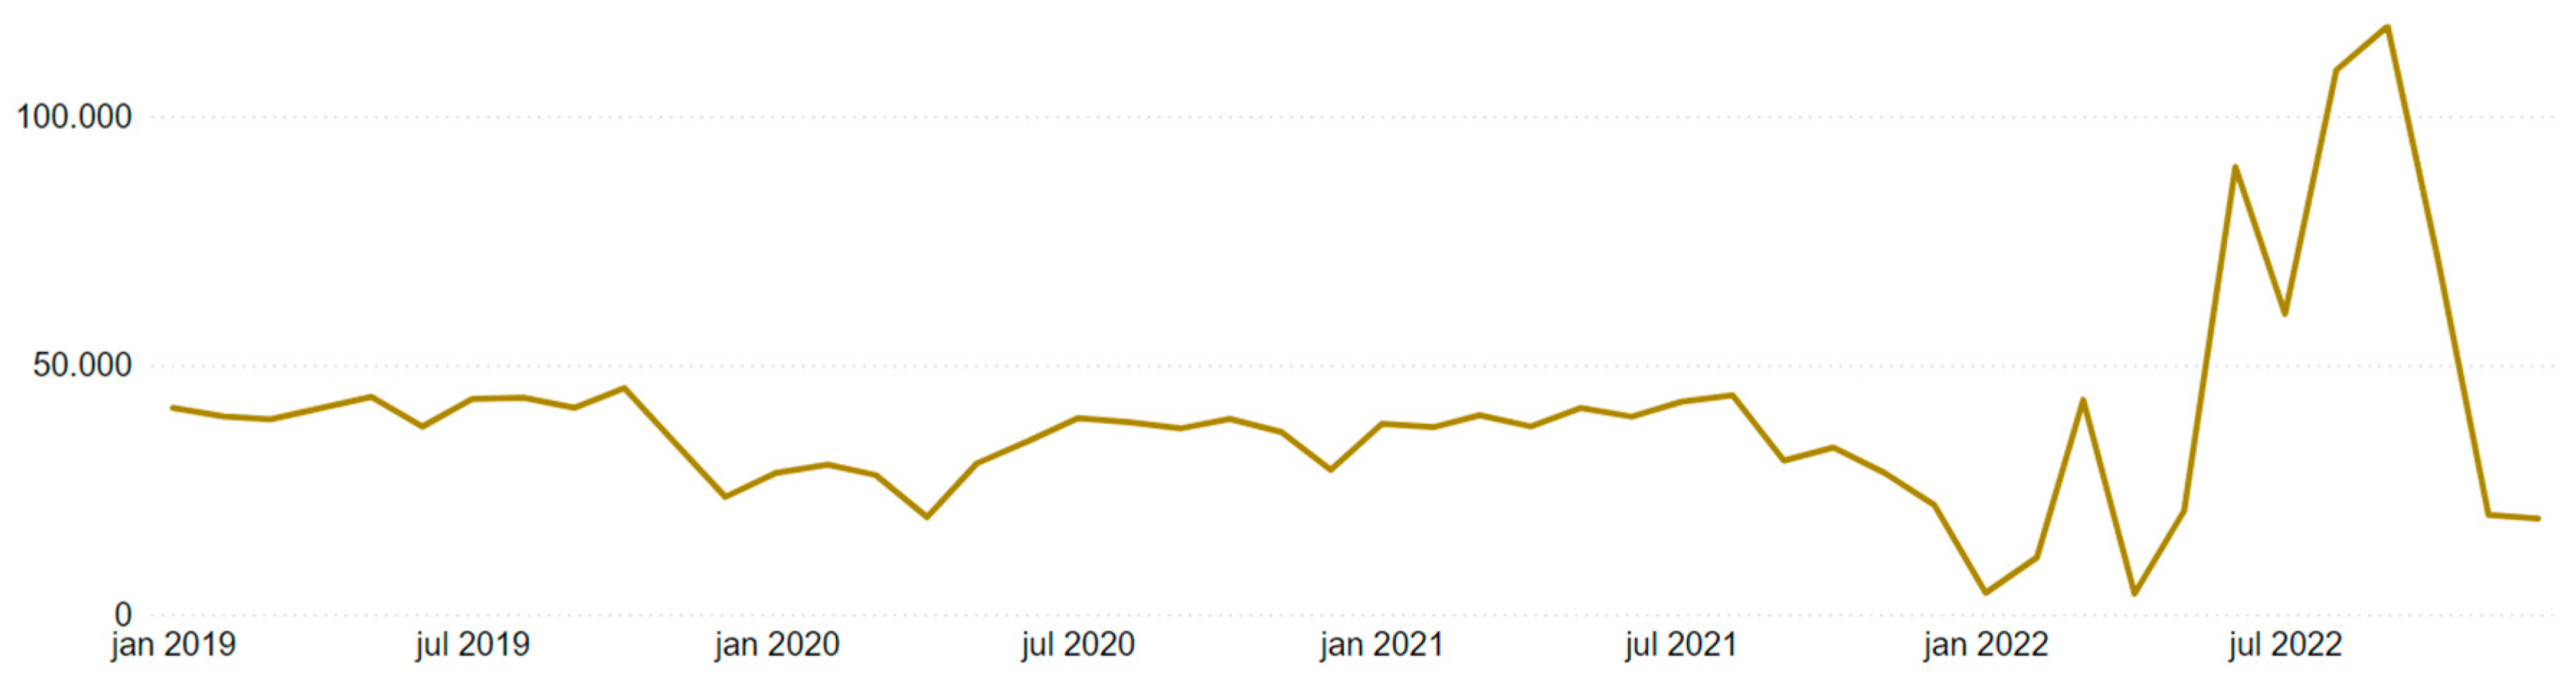
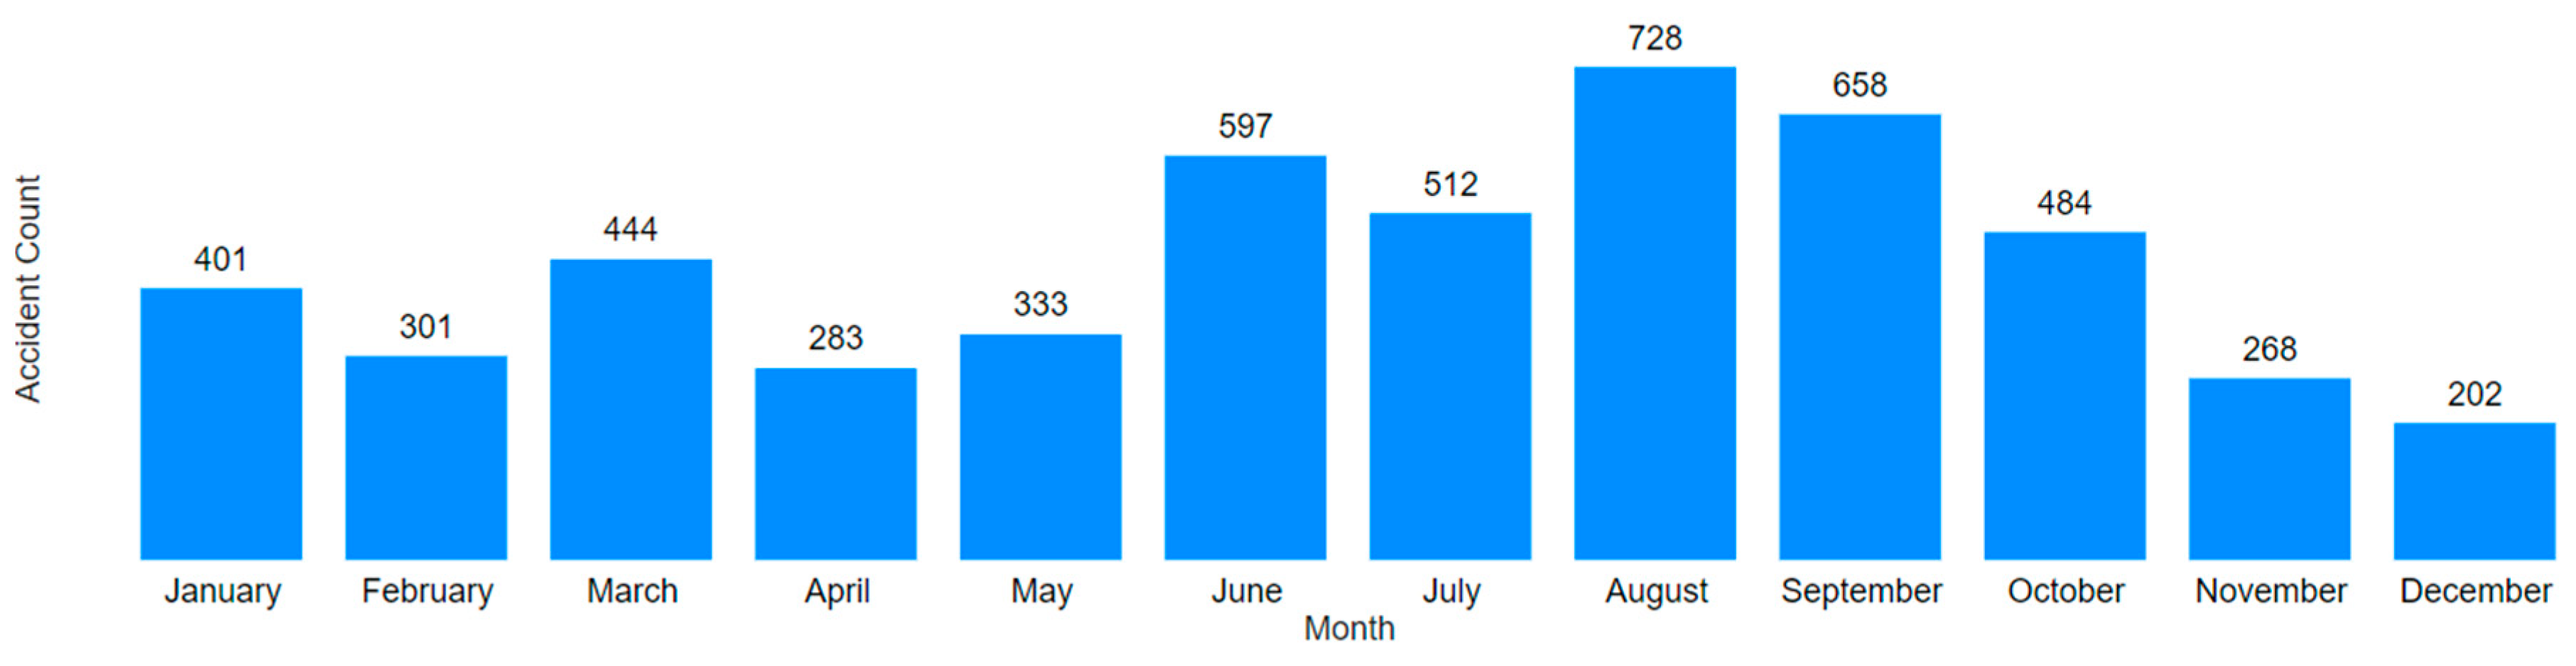
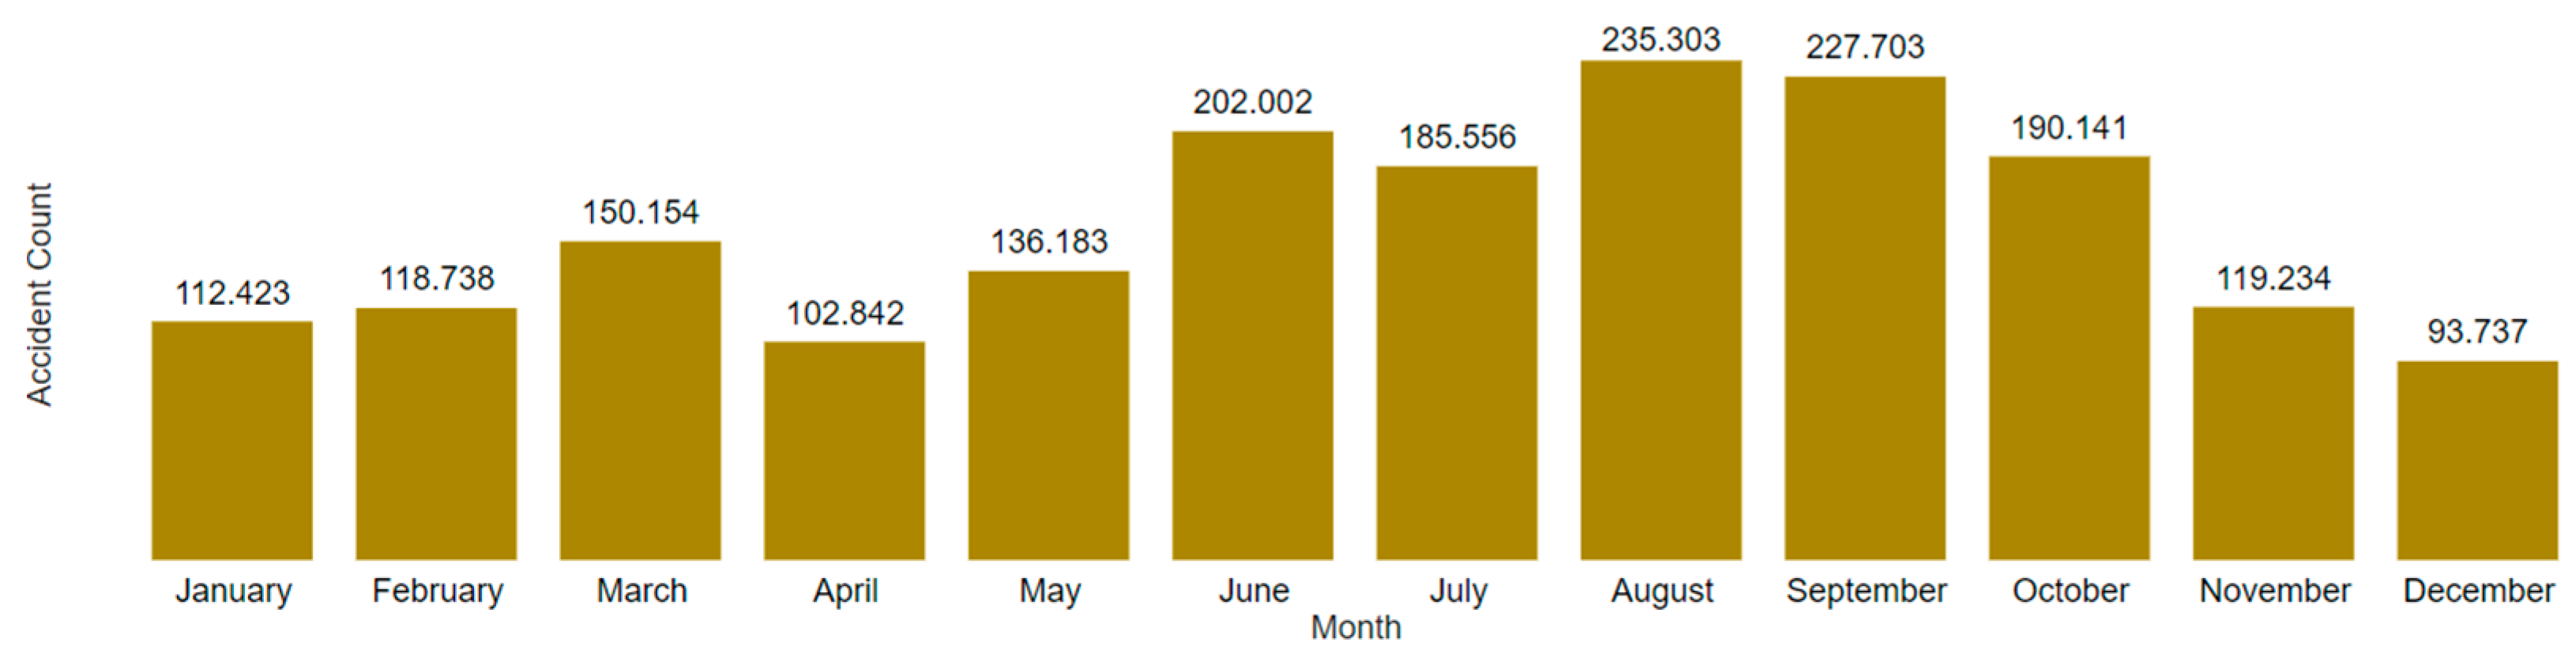
3.5. Temporal Analysis
4. Conclusions
Author Contributions
Funding
Institutional Review Board Statement
Informed Consent Statement
Data Availability Statement
Conflicts of Interest
Appendix A
References
- Onifade, M.; Adebisi, J.A.; Shivute, A.P.; Genc, B. Challenges and Applications of Digital Technology in the Mineral Industry. Resour. Policy 2023, 85, 103978. [Google Scholar] [CrossRef]
- Pireddu, A.; Innocenti, A.; Lusuardi, L.M.; Santalucia, V.; Simeoni, C. The Impact and Effectiveness of Virtual Reality Applied to the Safety Training of Workers in Open-Cast Mining. Int. J. Environ. Res. Public Health 2025, 22, 151. [Google Scholar] [CrossRef] [PubMed]
- Altındiş, B.; Bayram, F. Data Mining Implementations for Determining Root Causes and Precautions of Occupational Accidents in Underground Hard Coal Mining. Saf. Health Work 2024, 15, 427–434. [Google Scholar] [CrossRef] [PubMed]
- Sanmiquel, L.; Bascompta, M.; Rossell, J.M.; Anticoi, H.F.; Guash, E. Analysis of Occupational Accidents in Underground and Surface Mining in Spain Using Data-Mining Techniques. Int. J. Environ. Res. Public Health 2018, 15, 462. [Google Scholar] [CrossRef] [PubMed]
- SmartLab SmartLab de Trabalho Decente. Available online: https://smartlabbr.org/ (accessed on 14 February 2025).
- Owen, J.R. Social License and the Fear of Mineras Interruptus. Geoforum 2016, 77, 102–105. [Google Scholar] [CrossRef]
- Cruz, T.L.; Matlaba, V.J.; Mota, J.A.; Filipe dos Santos, J. Measuring the Social License to Operate of the Mining Industry in an Amazonian Town: A Case Study of Canaã Dos Carajás, Brazil. Resour. Policy 2021, 74, 101892. [Google Scholar] [CrossRef]
- INSS Comunicação de Acidente de Trabalho, Plano de Dados Abertos 2021/2023. Available online: https://dados.gov.br/dados/conjuntos-dados/inss-comunicacao-de-acidente-de-trabalho-cat1 (accessed on 15 February 2025).
- Connolly, T.M.; Begg, C.E. Database Systems: A Practical Approach to Design, Implementation, and Management, 6th ed.; Pearson: London, UK, 2014. [Google Scholar]
- Elmasri, E.; Navathe, S. Fundamentals of Database Systems, 7th ed.; Pearson: London, UK, 2015. [Google Scholar]
- Brasil Norma Regulamentadora NR-01: Disposições Gerais e Gerenciamento de Riscos Ocupacionais. Available online: https://www.gov.br/trabalho-e-emprego/pt-br/acesso-a-informacao/participacao-social/conselhos-e-orgaos-colegiados/comissao-tripartite-partitaria-permanente/normas-regulamentadora/normas-regulamentadoras-vigentes/NR01atualizada2024I.pdf (accessed on 15 February 2025).
- Brasil Norma Regulamentadora No 17–Ergonomia. Available online: https://www.gov.br/trabalho-e-emprego/pt-br/acesso-a-informacao/participacao-social/conselhos-e-orgaos-colegiados/comissao-tripartite-partitaria-permanente/normas-regulamentadora/normas-regulamentadoras-vigentes/nr-17-atualizada-2023.pdf (accessed on 15 February 2025).
- Freitas, I.B. de Saúde e Segurança Do Trabalhador Na Rede de Frio de Imunobiológicos. In Rede de Frio: Gestão, Especificidades e Atividades; Editora Fiocruz: Rio de Janeiro, Brazil, 2017; pp. 275–295. [Google Scholar]
- Microsoft. How Visuals Cross-Filter Each Other in a Power BI Report; Microsoft Learn: Redmond, WA, USA, 2024; Available online: https://learn.microsoft.com/en-us/power-bi/consumer/end-user-interactions (accessed on 9 June 2025).
- Instituto Brasileiro de Mineração Desempenho Da Mineração Tem queda Em 2022, Mas Setor Cria Mais Empregos e Aumentará Investimentos Para US$ 50 Bi Até 2027. Available online: https://ibram.org.br/noticia/desempenho-da-mineracao-tem-queda-em-2022-mas-setor-cria-mais-empregos-e-aumentara-investimentos-para-us-50-bi-ate-2027/ (accessed on 17 February 2025).
- Instituto Brasileiro de Geografia e Estatística. Em 2023, Número de Sindicalizados Cai Para 8,4 Milhões, o Menor Desde; IBGE: Rio de Janeiro, Brazil, 2012. [Google Scholar]
- International Council on Mining and Metals. Safety Performance Report: Benchmarking Progress of ICMM Company Members in 2022; ICMM: London, UK, 2023. [Google Scholar]
- AVABRUM. A Tragédia-Crime. Available online: https://avabrum.org.br/a-tragedia-crime/ (accessed on 17 February 2025).
- Polignano, M.V.; Lemos, R.S. Rompimento Da Barragem Da Vale Em Brumadinho: Impactos Socioambientais Na Bacia Do Rio Paraopeba. Cienc. Cult. 2020, 72, 37–43. [Google Scholar] [CrossRef]
- BRASIL Nova Política Nacional de Segurança de Barragens Que Impõe Maior Responsabilidade Às Mineradoras, é Sancionada. Available online: https://www.gov.br/planalto/pt-br/acompanhe-o-planalto/noticias/2020/09/nova-politica-nacional-de-seguranca-de-barragens-que-impoe-maior-responsabilidade-as-mineradoras-e-sancionada (accessed on 17 February 2025).
- BRASIL Lei nº 14.066, de 30 de setembro de 2020. Diário Oficial da União, Brasília, DF, 1 out. 2020. Available online: https://www.planalto.gov.br/ccivil_03/_Ato2019-2022/2020/Lei/L14066.htm (accessed on 11 June 2025).
- Mckinsey & Company Mulheres Na Mineração: A Diversidade Ganhando Quilate. Available online: https://www.mckinsey.com.br/our-insights/all-insights/mulheres-na-mineracao-a-diversidade-ganhando-quilate (accessed on 17 February 2025).
- Instituto Brasileiro de Mineração Avanço Da Participação Feminina Na Mineração é Destaque Na Celebração Do Dia Internacional Da Mulher. Available online: https://ibram.org.br/noticia/avanco-da-participacao-feminina-na-mineracao-e-destaque-na-celebracao-do-dia-internacional-da-mulher/ (accessed on 17 February 2025).
- Hogg, R.V.; McKean, J.W.; Craig, A.T. Introduction to Mathematical Statistics, Global ed.; Pearson: London, UK, 2019. [Google Scholar]
- Heimann, S.; Johansson, K.; Franklin, W.T. Gender in industrial mine work and organizations. A review of an expanding research field. Extr. Ind. Soc. 2023, 16, 101371. [Google Scholar] [CrossRef]
- Fontaneda, I.; López, M.Á.C.; Alcántara, Ó.J.G.; Ritzel, D.O. Gender differences in lost work days due to occupational accidents. Saf. Sci. 2019, 120, 723–731. [Google Scholar] [CrossRef]
- Tian, J.; Wang, Y.; Gao, S. Analysis of Mining-Related Injuries in Chinese Coal Mines and Related Risk Factors: A Statistical Research Study Based on a Meta-Analysis. Int. J. Environ. Res. Public Health 2022, 19, 16249. [Google Scholar] [CrossRef] [PubMed]
- DIEESE. Possíveis Impactos Do Encerramento Das Atividades Ligadas à Extração de Carvão Na Região Sul Do Brasil: Uma Estimativa a Partir Da Matriz Insumo-Produto; DIEESE: São Paulo, Brazil, 2022; ISBN 9788587326959. [Google Scholar]
- Nolte, J.; Hanoch, Y. Adult Age Differences in Risk Perception and Risk Taking. Curr. Opin. Psychol. 2024, 55, 101746. [Google Scholar] [CrossRef] [PubMed]
- Wänke, M.; Schwarz, N.; Bless, H. The Availability Heuristic Revisited: Experienced Ease of Retrieval in Mundane Frequency Estimates. Acta Psychol. 1995, 89, 83–90. [Google Scholar] [CrossRef]
- Qiu, Z.; Liu, Q.; Li, X.; Zhang, Y. Why Do Workers Generate Biased Risk Perceptions? An Analysis of Anchoring Effects and Influential Factors in Workers’ Assessment of Unsafe Behavior. Saf. Health Work 2024, 15, 300–309. [Google Scholar] [CrossRef] [PubMed]
- Laflamme, L.; Menckel, E.; Lundholm, L. The age-related risk of occupational accidents: The case of Swedish iron-ore miners. Accid. Anal. Prev. 1996, 28, 349–357. [Google Scholar] [CrossRef] [PubMed]
- Ivaz, J.; Fedajev, A.N.; Petrović, D.V.; Stojadinović, S.S.; Zlatanović, D.M.; Stojković, P.Z.; Stajić, M.S.; Radovanović, M.B. Towards safer mines: Analyzing occupational health and safety perceptions and injury patterns in Serbian underground mining. WORK 2025, 81, 2530–2546. [Google Scholar] [CrossRef] [PubMed]
- Ghosh, A.K.; Bhattacherjee, A.; Chau, N. Relationships between working conditions and individual characteristics and occupational injuries: A case-control study among coal miners in India. J. Occup. Health 2004, 46, 470–478. [Google Scholar] [CrossRef] [PubMed]


| Causal Agent Category | Agent Type | Description |
|---|---|---|
| Entrapment | Physical | Entrapment of limbs or the entire body between objects or resulting from collapses. |
| Storage | Physical | Includes containers (barrels, boxes, crates, etc.), equipment (tanks, silos, barns, etc.), and storage facilities. |
| Friction/Abrasion | Physical | Abrasions from various sources (handling of equipment, vibrations, compressions, etc.). |
| Ceramics | Physical | Objects made of ceramic materials such as dishes, bricks, glassware, and others. |
| Fuels/Oils/Flammables | Chemical | Alcohol, gasoline, paraffin, and other oils. |
| Building/Structure | Physical | Accidents caused by structures where workers may pass through or work on, including scaffolding, ladders, bridges, viaducts, excavations, etc. |
| Energies | Physical | Includes accidents caused by exposure to different forms of energy, such as electrical, thermal, or mechanical, including electric shocks or exposure to extreme temperatures. |
| Exertion | Ergonomic | Accidents in this category are related to injuries caused by excessive physical exertion, such as lifting, pushing, or pulling heavy objects. |
| Tools | Physical | Includes incidents involving the use of manual or mechanical tools. |
| Machinery | Physical | Accidents related to large machinery or other heavy equipment used in various operations. |
| Furniture | Physical | Includes accidents associated with furniture and accessories. |
| Other Equipment | Physical | A collection of various types of equipment that do not fit into other categories, including electrical and lighting equipment. |
| Pollution | Chemical | Refers to accidents caused by exposure to environmental pollutants, such as noise, air, and water pollution. |
| Product/Material | Physical | Includes incidents related to the handling or exposure to various final/intermediate products or raw materials. |
| Fall/Impact | Physical | Accidents resulting from falls or impacts, including people falling or colliding with or from objects. |
| Reflex | Ergonomic | Categorizes accidents that occur as reactions to involuntary or voluntary movements that result in injury. |
| Unclassified | N/A | Not classified. |
| Living Being | Biological | Includes accidents involving animals or other living organisms, such as bites, attacks, or parasitism. |
| Aggressive Substance | Chemical | Includes incidents of exposure to substances that can cause direct harm, such as acids, alkalis, or toxic compounds. |
| Vehicle | Physical | Accidents related to the use or handling of vehicles of any type, motorized or not. |
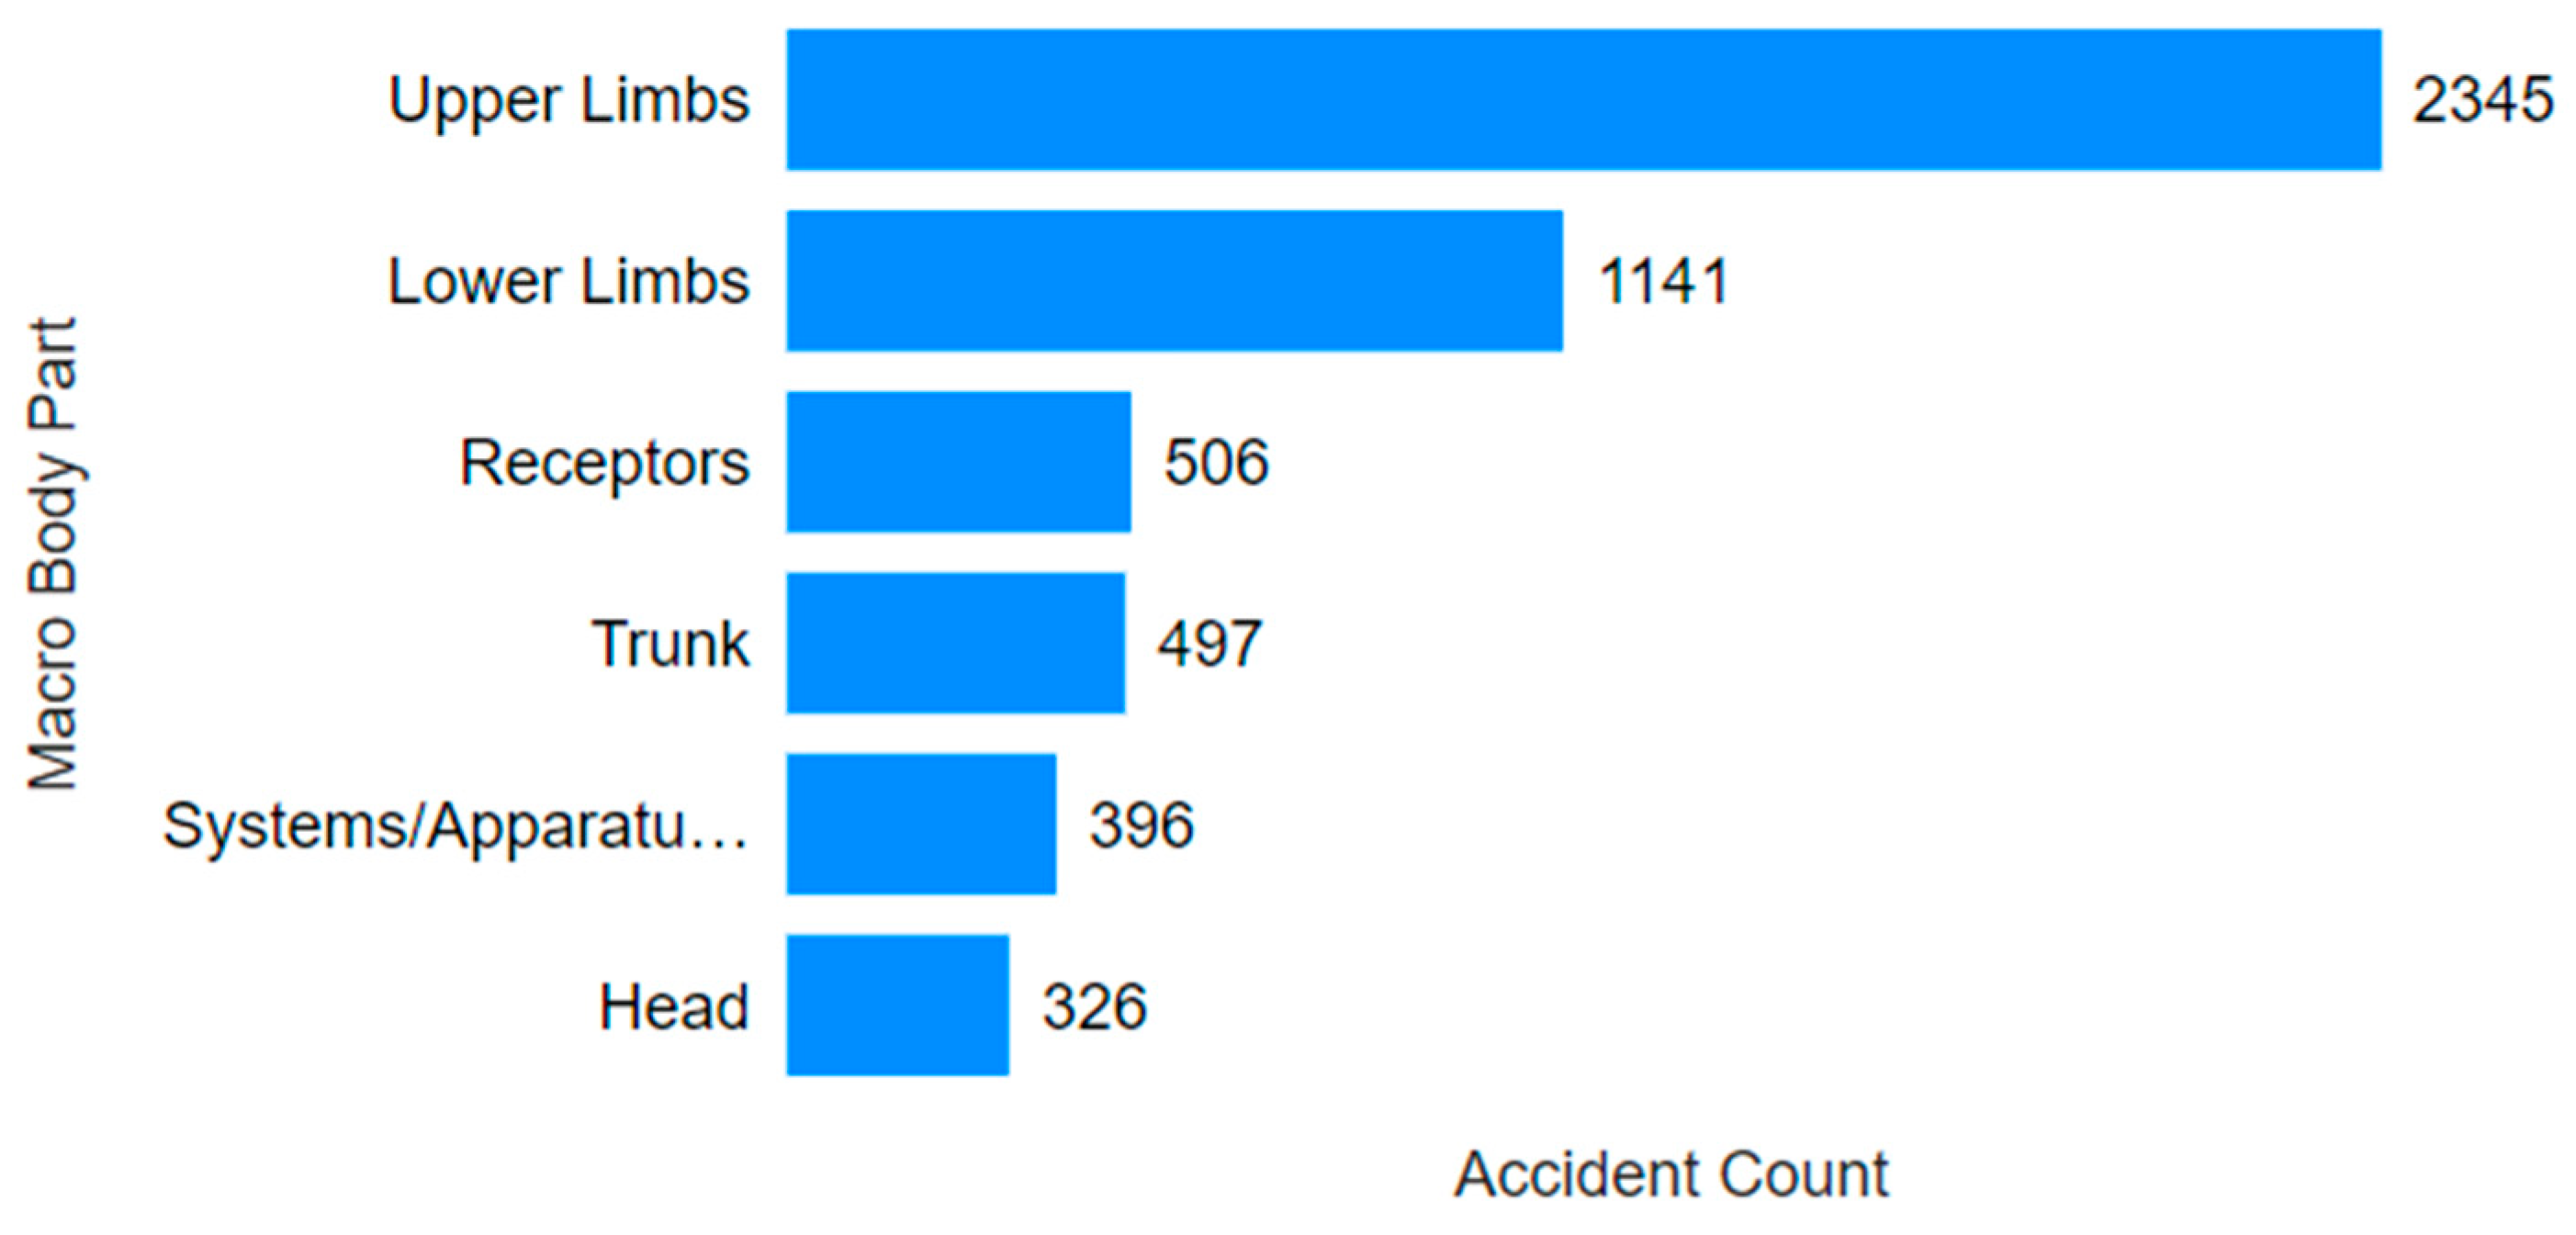
| Affected Body Parts Category | Description |
|---|---|
| Head | Includes all injuries to the head, covering the skull, brain, and multiple parts of the head. |
| Upper Limbs | Includes injuries to the upper limbs, including shoulders, arms, forearms, elbows, hands, and fingers. |
| Lower Limbs | Covers all injuries to the lower limbs, including thighs, knees, legs, ankles, and toes. |
| Trunk | Includes injuries to the abdomen, back, chest, hips, and pelvis, considering both the external surface and internal organs. |
| Systems/Apparatuses | Includes injuries affecting entire bodily systems, such as the respiratory, digestive, circulatory, urinary, musculoskeletal, and nervous systems. |
| Receptors | Includes injuries to sensory organs, such as eyes, ears, nose, and mouth. |
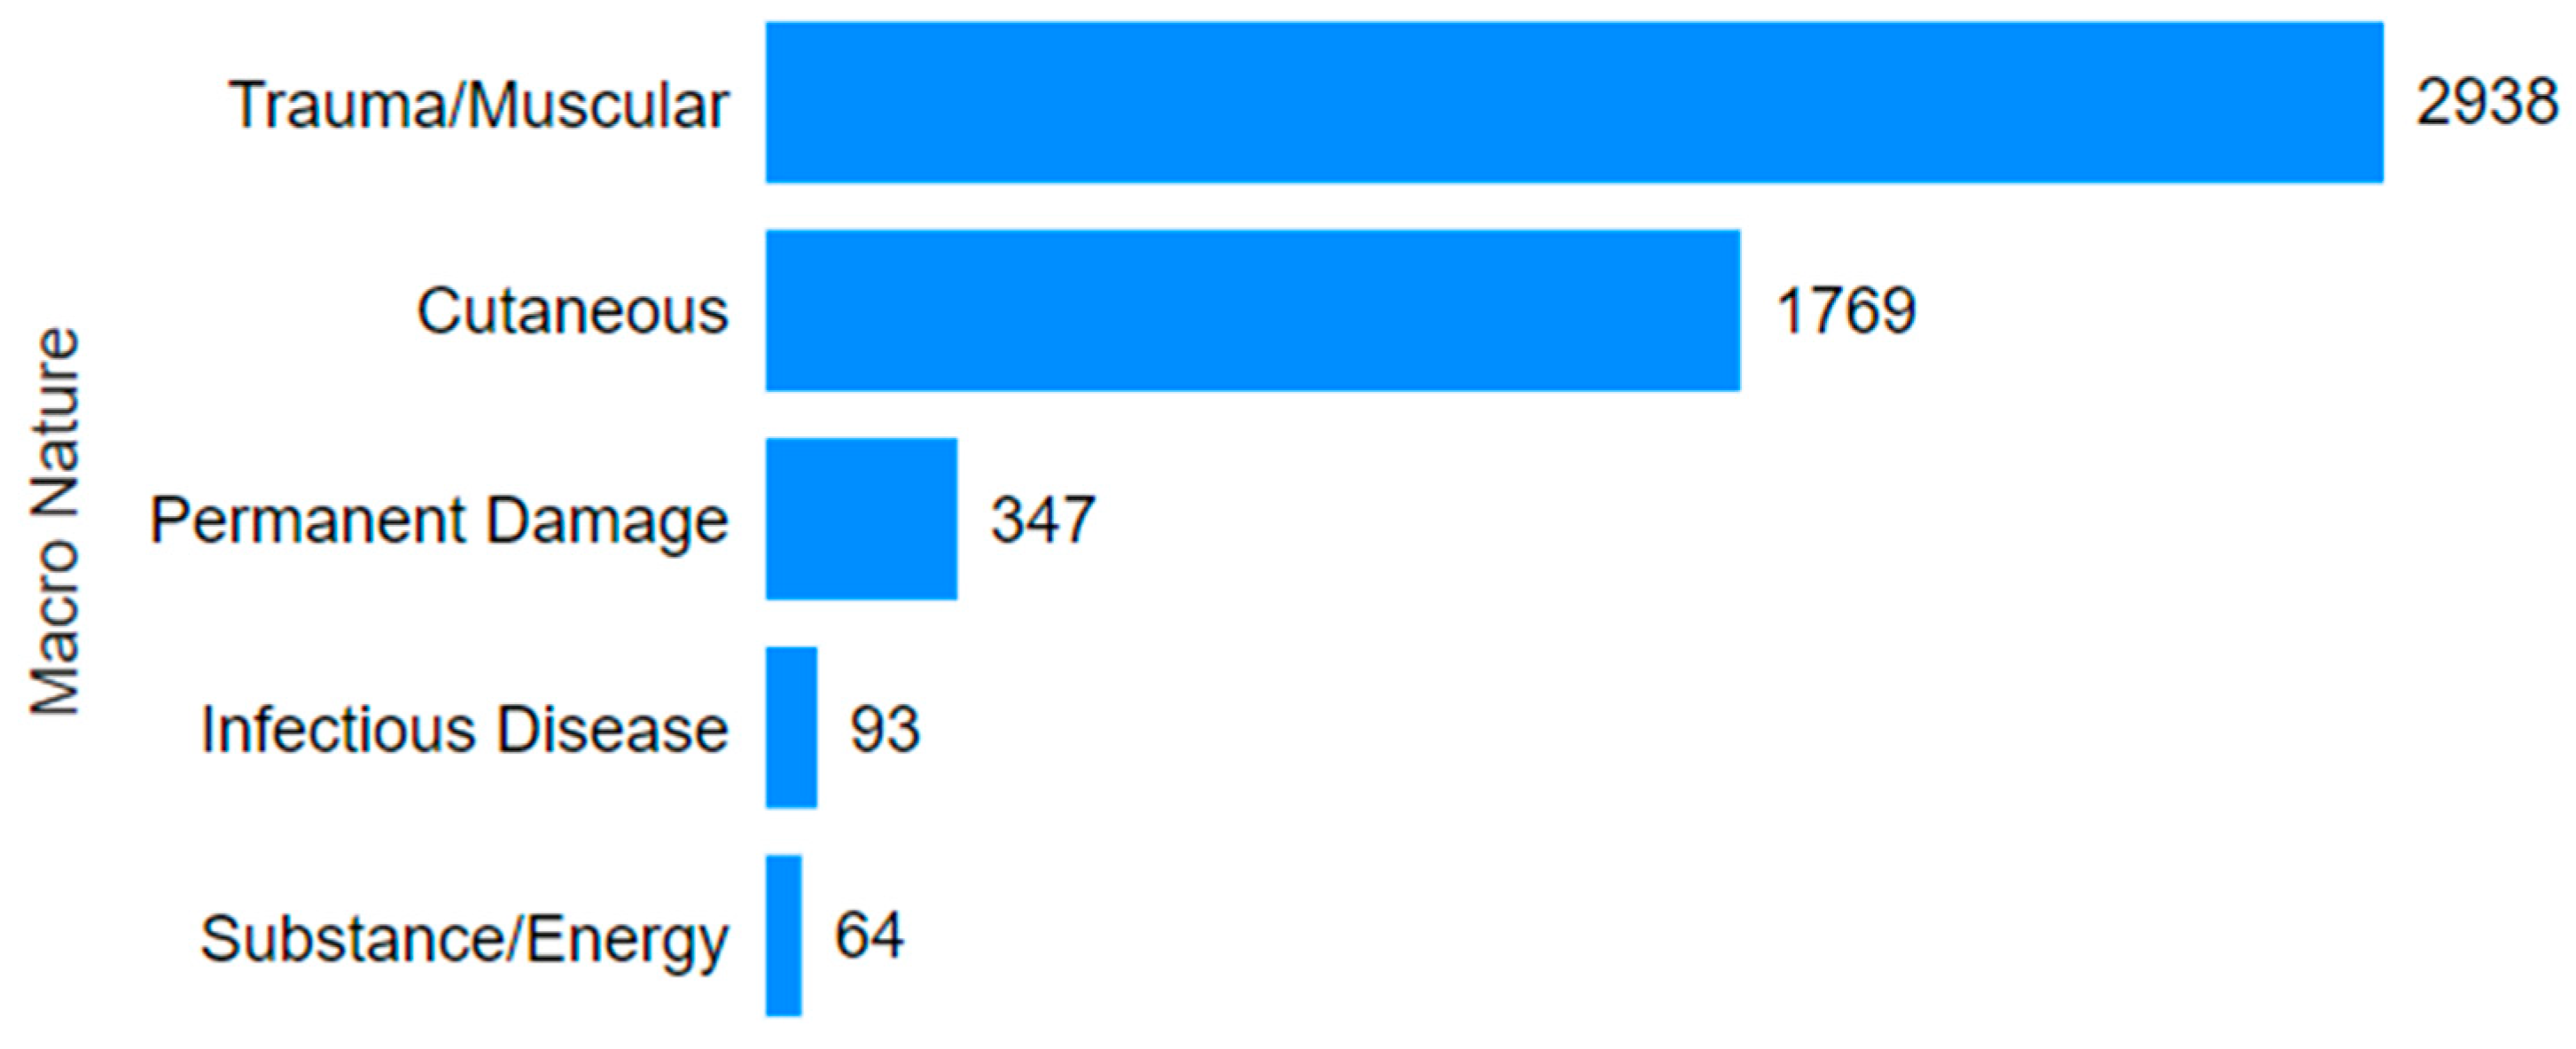
| Nature of the Injury Category | Description |
|---|---|
| Trauma/Muscular | Includes fractures, bruises, crush injuries, strains, sprains, dislocations, inflammations of joints, tendons, or muscles, and immediate injuries. |
| Infectious Disease | Covers contagious or infectious diseases and unspecified general morbid conditions. |
| Cutaneous | Groups cuts, lacerations, abrasions, thermal burns or scalds, dermatoses, and chemical burns. |
| Permanent Damage | Includes multiple injuries, loss or impairment of senses, such as hearing or vision, amputations, and conditions resulting in permanent loss of function or sensation. |
| Substance/Energy | Includes electric shocks, poisonings, immediate or delayed effects of radiation, pneumoconiosis, and other effects of harmful substances or energies. |
| Breathlessness | This category is dedicated to asphyxia, strangulation, drowning, and other conditions that impair adequate breathing. |
| Mining Sector Employer |
|---|
| Extraction of Minerals |
| Extraction of Ores |
| Extraction of Precious Metal Ores |
| Extraction of Non-Metallic Minerals Not Specified |
| Manufacture of Non-Metallic Mineral Products |
| Extraction of Aluminum Ores |
| Extraction of Minerals for Fertilizer Production |
| Extraction of Iron Ore |
| Extraction of Non-Ferrous Metallic Minerals |
| Support Activities for Mineral Extraction |
| Extraction of Coal |
| Extraction of Manganese Ore |
| Extraction of Radioactive Minerals |
| Extraction of Tin Ore |
| Age Group (Years) | Age Group Order |
|---|---|
| Up to 17 | 1 |
| 18 to 24 | 2 |
| 25 to 34 | 3 |
| 35 to 44 | 4 |
| 45 to 54 | 5 |
| 55 to 64 | 6 |
| 65 or more | 7 |
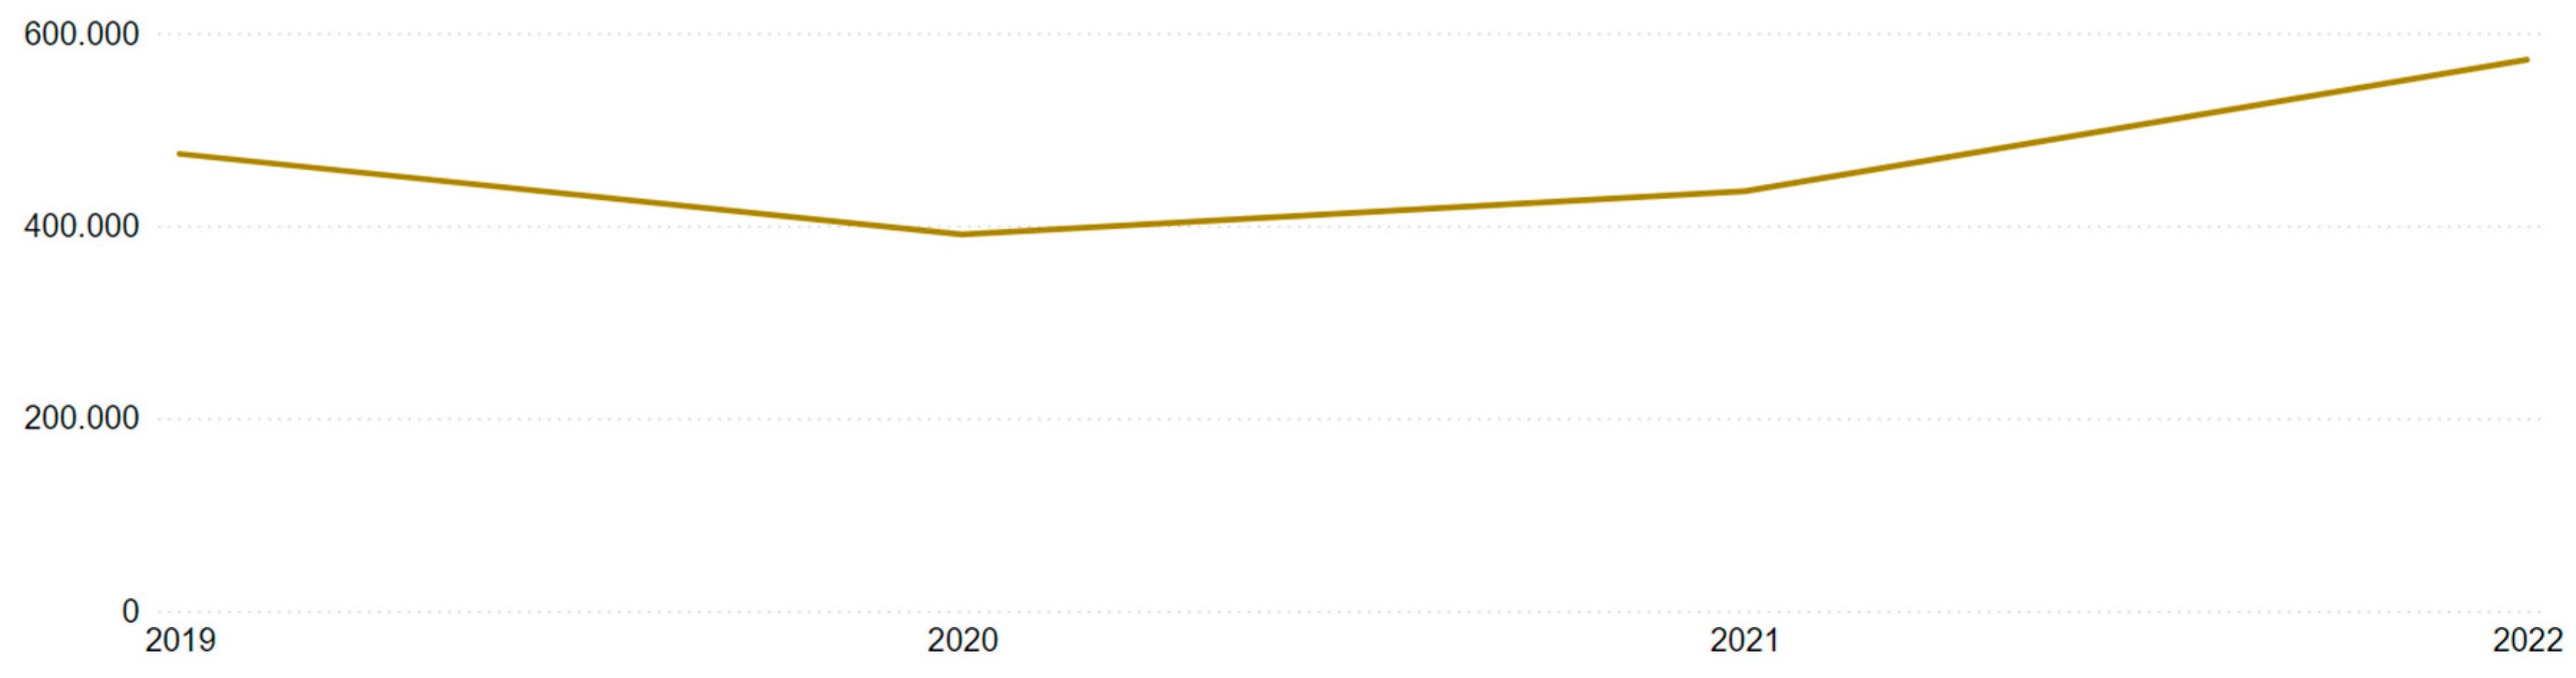
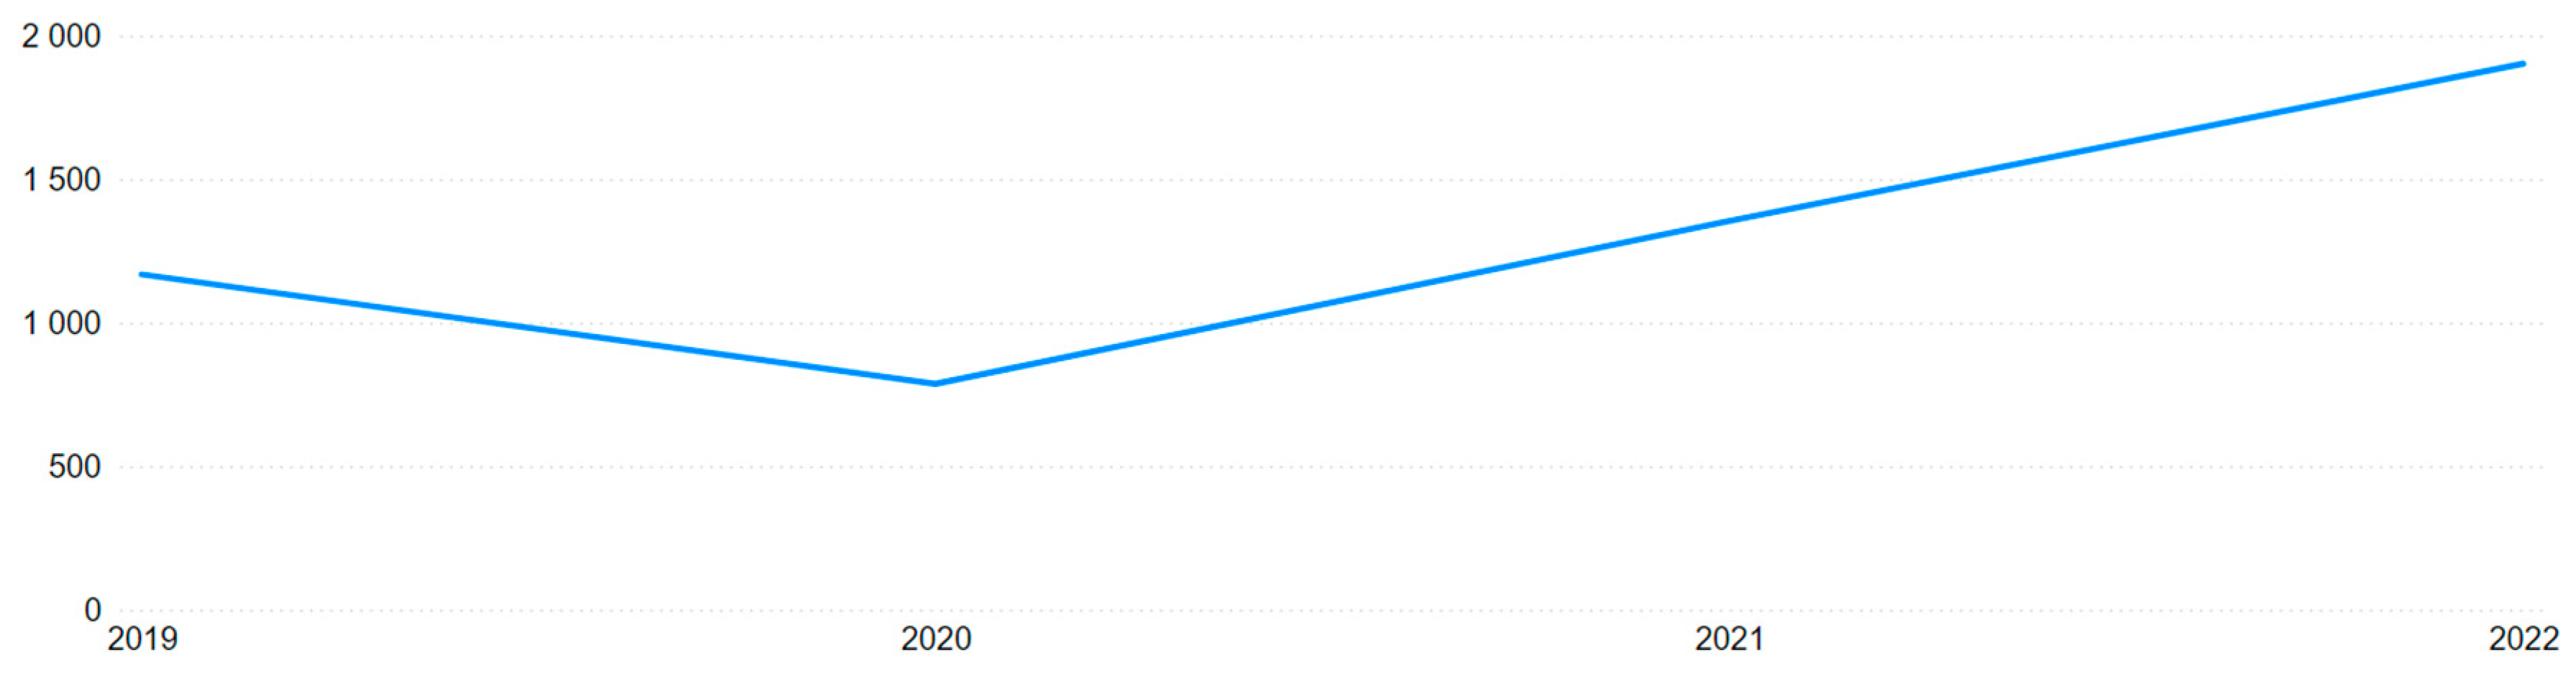
| Year | Brazil | Mining |
|---|---|---|
| 2019 | 474,597 | 1168 |
| 2020 | 391,107 | 787 |
| 2021 | 435,939 | 1354 |
| 2022 | 572,373 | 1902 |
| Total | 1,874,016 | 5211 |
Disclaimer/Publisher’s Note: The statements, opinions and data contained in all publications are solely those of the individual author(s) and contributor(s) and not of MDPI and/or the editor(s). MDPI and/or the editor(s) disclaim responsibility for any injury to people or property resulting from any ideas, methods, instructions or products referred to in the content. |
© 2025 by the authors. Licensee MDPI, Basel, Switzerland. This article is an open access article distributed under the terms and conditions of the Creative Commons Attribution (CC BY) license (https://creativecommons.org/licenses/by/4.0/).
Share and Cite
Oliveira, J.; Ayres da Silva, A.L.M. A Data-Driven Analysis of Work-Related Accidents in the Brazilian Mining Sector (2019–2022). Int. J. Environ. Res. Public Health 2025, 22, 939. https://doi.org/10.3390/ijerph22060939
Oliveira J, Ayres da Silva ALM. A Data-Driven Analysis of Work-Related Accidents in the Brazilian Mining Sector (2019–2022). International Journal of Environmental Research and Public Health. 2025; 22(6):939. https://doi.org/10.3390/ijerph22060939
Chicago/Turabian StyleOliveira, João, and Anna Luiza Marques Ayres da Silva. 2025. "A Data-Driven Analysis of Work-Related Accidents in the Brazilian Mining Sector (2019–2022)" International Journal of Environmental Research and Public Health 22, no. 6: 939. https://doi.org/10.3390/ijerph22060939
APA StyleOliveira, J., & Ayres da Silva, A. L. M. (2025). A Data-Driven Analysis of Work-Related Accidents in the Brazilian Mining Sector (2019–2022). International Journal of Environmental Research and Public Health, 22(6), 939. https://doi.org/10.3390/ijerph22060939