
Adaptation of the Copenhagen Burnout Inventory in Latvia: Psychometric Data and Factor Analysis


Abstract
1. Introduction
2. Materials and Methods
2.1. Description of the Tool
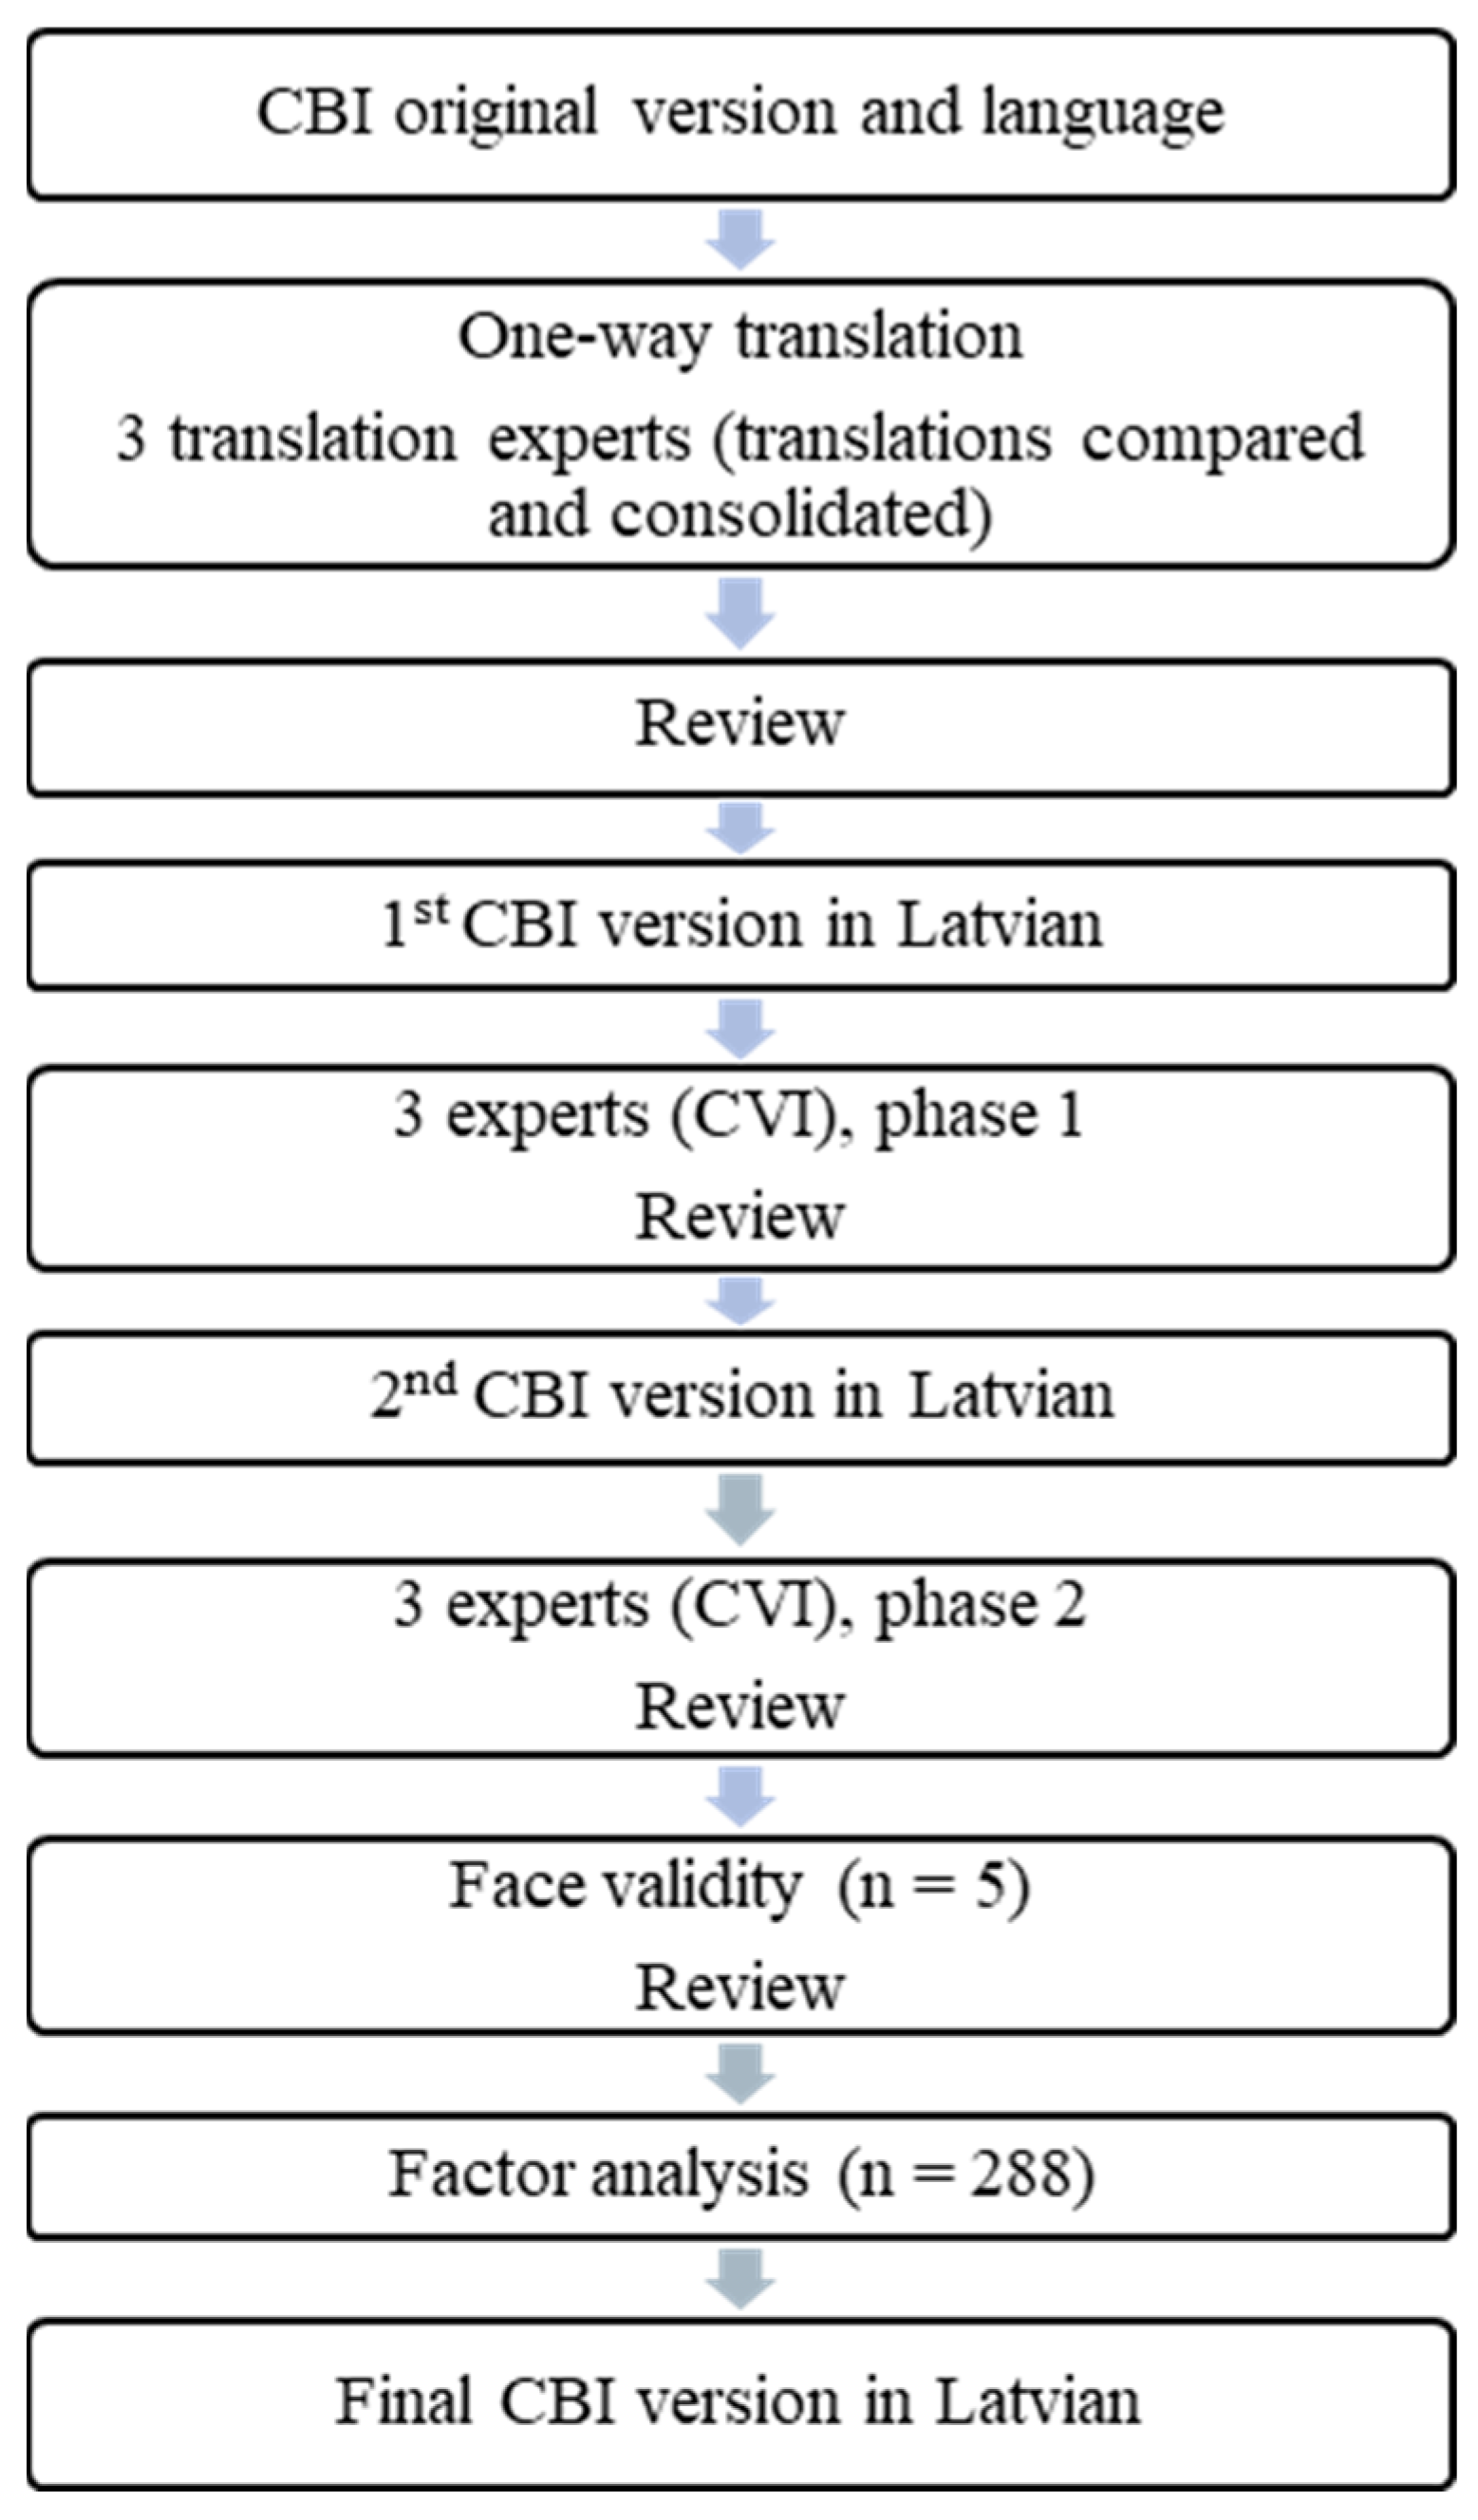
2.2. Method
2.3. Data Analysis and Statistics
2.4. Participants
2.5. Ethical Considerations
3. Results
4. Discussion
5. Conclusions
Author Contributions
Funding
Institutional Review Board Statement
Informed Consent Statement
Data Availability Statement
Conflicts of Interest
Abbreviations
| ICD 11 | International Classification of Diseases |
| MBI | Maslach Burnout Inventory |
| CBI | Copenhagen Burnout Inventory |
| e.g., | exempli gratia |
| CVI | Content Validity Index |
| IBM SPSS | Statistical Package for the Social Sciences |
| AMOS | Association for Morbid Obesity Support |
| M | Mean |
| SD | Standard Deviation |
| EFA | Exploratory Factor Analysis |
| KMO | Kaiser–Meyer–Olkin |
| CFA | Confirmatory Factor Analysis |
| CFI | Comparative Fir Index |
| TLI | Tucker–Lewis Index |
| RMSEA | Root Mean Square Error of Approximation |
| PEK | Pētījuma Ētikas komitēja |
| FVI | Face Validity Index |
| SRMR | Standardised Root Mean Square Residual |
| NNFI | Bentler–Bonett Non-normed Fit Index |
| RNI | Relative-Noncentrality Index |
| NFI | Bentler–Bonett Normed Fit Index |
| RFI | Bollen’s Relative Fit Index |
| IFI | Bollen’s Incremental Fit Index |
| PNFI | Parsimony Normed Fit Index |
| SE | Standard Error |
| CR | Composite Reliability |
| AVE | Average Variance Extracted |
| PRB | Personal-related burnout |
| WRB | Work-related burnout |
| CRB | Client-related burnout |
References
- Khammissa, R.A.; Nemutandani, S.; Feller, G.; Lemmer, J.; Feller, L. Burnout Phenomenon: Neurophysiological Factors, Clinical Features, and Aspects of Management. J. Int. Med. Res. 2022, 50, 03000605221106428. [Google Scholar] [CrossRef] [PubMed]
- Edú-Valsania, S.; Laguía, A.; Moriano, J.A. Burnout: A Review of Theory and Measurement. Int. J. Environ. Res. Public Health 2022, 19, 1780. [Google Scholar] [CrossRef]
- Maslach, C.; Leiter, M.P. Understanding the Burnout Experience: Recent Research and Its Implications for Psychiatry. World Psychiatry 2016, 15, 103–111. [Google Scholar] [CrossRef] [PubMed]
- Schaufeli, W.B.; Maslach, C.; Marek, T. (Eds.) Professional Burnout: Recent Developments in Theory and Research; Taylor & Francis: Washington, DC, USA, 1993. [Google Scholar]
- Burn-Out an “Occupational Phenomenon”: International Classification of Diseases. World Health Organization. Available online: https://www.who.int/news/item/28-05-2019-burn-out-an-occupational-phenomenon-international-classification-of-diseases (accessed on 17 December 2024).
- Allam, Z.; Malik, A.; George, S. The Relationship Between Emotional Exhaustion, Depersonalization, Personal Accomplishment, and Job Satisfaction: An Empirical Study in Saudi Arabia. J. Asian Financ. Econ. Bus. 2021, 8, 1109–1117. [Google Scholar] [CrossRef]
- Gaspar, T.; Botelho-Guedes, F.; Cerqueira, A.; Baban, A.; Rus, C.; Gaspar-Matos, M. Burnout as a Multidimensional Phenomenon: How Can Workplaces Be Healthy Environments? J. Public Health 2024. [Google Scholar] [CrossRef]
- De Hert, S. Burnout in Healthcare Workers: Prevalence, Impact and Preventative Strategies. Local Reg. Anesth. 2020, 13, 171–183. [Google Scholar] [CrossRef]
- Madigan, D.J.; Kim, L.E.; Glandorf, H.L.; Kavanagh, O. Teacher Burnout and Physical Health: A Systematic Review. Int. J. Educ. Res. 2023, 119, 102173. [Google Scholar] [CrossRef]
- Ratcliff, M. Social Workers, Burnout, and Self-Care: A Public Health Issue. Del. J. Public Health 2024, 10, 26–29. [Google Scholar] [CrossRef]
- Wang, J.; Wang, W.; Laureys, S.; Di, H. Burnout Syndrome in Healthcare Professionals Who Care for Patients with Prolonged Disorders of Consciousness: A Cross-Sectional Survey. BMC Health Serv. Res. 2020, 20, 841. [Google Scholar] [CrossRef]
- Obschonka, M.; Pavez, I.; Kautonen, T.; Kibler, E.; Salmela-Aro, K.; Wincent, J. Job Burnout and Work Engagement in Entrepreneurs: How the Psychological Utility of Entrepreneurship Drives Healthy Engagement. J. Bus. Ventur. 2023, 38, 106272. [Google Scholar] [CrossRef]
- Ministru Kabineta Gada 26. Maija Rīkojums Nr. 359 “Sabiedrības Veselības Pamatnostādnes 2021–2027. Gadam”. Latvijas Vēstnesis. 2022. Available online: https://likumi.lv/ta/id/332751 (accessed on 25 November 2024).
- State oh Health in the, EU. Latvia. Country Health Profile. 2021. Available online: https://health.ec.europa.eu/system/files/2021-12/2021_chp_lv_english.pdf (accessed on 16 December 2024).
- Lonska, J.; Mietule, I.; Litavniece, L.; Arbidane, I.; Vanadzins, I.; Matisane, L.; Paegle, L. Work–Life Balance of the Employed Population During the Emergency Situation of COVID-19 in Latvia. Front. Psychol. 2021, 12, 682459. [Google Scholar] [CrossRef] [PubMed]
- Matisāne, L.; Akūlova, L.; Paegle, L.; Matisāne, M.; Vanadziņš, I. The Experience and Perception of Occupational Health and Safety Expert Work During the COVID-19 Pandemic—A Qualitative Study Among Latvian Occupational Health and Safety Experts. Sustainability 2024, 16, 9924. [Google Scholar] [CrossRef]
- Araujo, E.C.; Stella, L.M.; Irina, M.; James, B. World Bank Reimbursable Advisory Services: Support to Develop a Health System Strategy for Priority Disease Areas in Latvia Human Resources Review. 2020. Available online: https://www.vmnvd.gov.lv/lv/media/280/download (accessed on 2 December 2024).
- Institute of Economics of the Latvian Academy of Sciences. Demographic Situation and Development of Demographic Policy in Latvia. 2024. Available online: https://china-cee.eu/2025/01/03/latvia-political-briefing-demographic-situation-and-development-of-demographic-policy-in-latvia/ (accessed on 2 December 2024).
- Nagle, E.; Cerela-Boltunova, O.; Blumberga, S.; Mihailova, S.; Griskevica, I. The Burnout and Professional Deformation of Latvian Healthcare Workers during the COVID-19 Pandemic at the Traumatology and Orthopaedics Hospital. Soc. Sci. 2023, 12, 175. [Google Scholar] [CrossRef]
- Cerela-Boltunova, O.; Nagle, E.; Circenis, K. Moral Distress of Anesthesia and Intensive Care Nurses in Latvia. AANA J. 2024, 92, 247–255. [Google Scholar]
- Valaine, L.; Ancāne, G.; Utināns, A.; Briģis, Ģ. Mental Health and Associated Demographic and Occupational Factors among Health Care Workers during the COVID-19 Pandemic in Latvia. Medicina 2021, 57, 1381. [Google Scholar] [CrossRef]
- Niklass, M. Burnout During the COVID Pandemic: A Case of the Social Services Sector in Latvia. In Proceedings of the 2021 International Conference “Economic Science For Rural Development”, Jelgava, Latvia, 11–14 May 2021; pp. 576–584. [Google Scholar] [CrossRef]
- Gabriel, K.P.; Aguinis, H. How to Prevent and Combat Employee Burnout and Create Healthier Workplaces during Crises and Beyond. Bus. Horiz. 2022, 65, 183–192. [Google Scholar] [CrossRef]
- Williamson, K.; Lank, P.M.; Cheema, N.; Hartman, N.; Lovell, E.O.; Emergency Medicine Education Research Alliance (EMERA). Comparing the Maslach Burnout Inventory to Other Well-Being Instruments in Emergency Medicine Residents. J. Grad. Med. Educ. 2018, 10, 532–536. [Google Scholar] [CrossRef]
- Wang, A.; Duan, Y.; Norton, P.G.; Leiter, M.P.; Estabrooks, C.A. Validation of the Maslach Burnout Inventory-General Survey 9-Item Short Version: Psychometric Properties and Measurement Invariance across Age, Gender, and Continent. Front. Psychol. 2024, 15, 1439470. [Google Scholar] [CrossRef]
- Mind Garden. Tools for Positive Transformation. Available online: https://www.mindgarden.com/315-mbi-human-services-survey-medical-personnel (accessed on 19 November 2024).
- López-Gómez, E.; González-Fernández, R.; Khampirat, B. Psychometric Study of the Maslach Burnout Inventory-Student Survey on Thai University Students. Sci. Rep. 2025, 15, 1802. [Google Scholar] [CrossRef]
- Cruchinho, P.; López-Franco, M.D.; Capelas, M.L.; Almeida, S.; Bennett, P.M.; da Silva, M.M.; Teixeira, G.; Nunes, E.; Lucas, P.; Gaspar, F. Translation, Cross-Cultural Adaptation, and Validation of Measurement Instruments: A Practical Guideline for Novice Researchers. J. Multidiscip. Healthc. 2024, 17, 2701–2728. [Google Scholar] [CrossRef]
- Barton, M.A.; Lall, M.D.; Johnston, M.M.; Lu, D.W.; Nelson, L.S.; Bilimoria, K.Y.; Reisdorff, E.J. Reliability and Validity Support for an Abbreviated Copenhagen Burnout Inventory Using Exploratory and Confirmatory Factor Analysis. J. Am. Coll. Emerg. Physicians Open 2022, 3, e12797. [Google Scholar] [CrossRef] [PubMed]
- Kristensen, T.S.; Borritz, M.; Villadsen, E.; Christensen, K.B. The Copenhagen Burnout Inventory: A New Tool for the Assessment of Burnout. Work Stress 2005, 19, 192–207. [Google Scholar] [CrossRef]
- Fadare, O.O.; Andreski, M.; Witry, M.J. Validation of the Copenhagen Burnout Inventory in Pharmacists. Innov. Pharm. 2021, 12, 4. [Google Scholar] [CrossRef] [PubMed]
- Alahmari, M.A.; Al Moaleem, M.M.; Hamdi, B.A.; Hamzi, M.A.; Aljadaani, A.T.; Khormi, F.A.; Darraj, M.A.; Shrwani, R.J.; AlOmar, A.A.; Tahhah, M.K.; et al. Prevalence of Burnout in Healthcare Specialties: A Systematic Review Using Copenhagen and Maslach Burnout Inventories. Med. Sci. Monit. 2022, 28, e938798-1–e938798-19. [Google Scholar] [CrossRef]
- Montgomery, A.P.; Azuero, A.; Patrician, P.A. Psychometric Properties of Copenhagen Burnout Inventory among Nurses. Res. Nurs. Health 2021, 44, 308–318. [Google Scholar] [CrossRef]
- Klein, A.; Taieb, O.; Xavier, S.; Baubet, T.; Reyre, A. The Benefits of Mindfulness-Based Interventions on Burnout among Health Professionals: A Systematic Review. EXPLORE 2020, 16, 35–43. [Google Scholar] [CrossRef]
- Cohen, C.; Pignata, S.; Bezak, E.; Tie, M.; Childs, J. Workplace Interventions to Improve Well-Being and Reduce Burnout for Nurses, Physicians and Allied Healthcare Professionals: A Systematic Review. BMJ Open 2023, 13, e071203. [Google Scholar] [CrossRef]
- Luna, D.; Figuerola-Escoto, R.P.; Sienra-Monge, J.J.L.; Hernández-Roque, A.; Soria-Magaña, A.; Hernández-Corral, S.; Toledano-Toledano, F. Burnout and Its Relationship with Work Engagement in Healthcare Professionals: A Latent Profile Analysis Approach. Healthcare 2023, 11, 3042. [Google Scholar] [CrossRef]
- Fiorilli, C. Copenhagen Burnout Inventory (CBI): A Validation Study in an Italian Teacher Group. TPM—Test. Psychom. Methodol. Appl. Psychol. 2015, 4, 537–551. [Google Scholar] [CrossRef]
- Papaefstathiou, E.; Tsounis, A.; Malliarou, M.; Sarafis, P. Translation and Validation of the Copenhagen Burnout Inventory amongst Greek Doctors. Health Psychol. Res. 2019, 7, 15–20. [Google Scholar] [CrossRef]
- Khan, J.A.; Raman, A.M.; Sambamoorthy, N.; Prashanth, K. Research Methodology (Methods, Approaches And Techniques), 1st ed.; San International Scientific Publications: Tamil Nadu, India, 2023. [Google Scholar] [CrossRef]
- Taherdoost, H. Validity and Reliability of the Research Instrument; How to Test the Validation of a Questionnaire/Survey in a Research. SSRN Electron. J. 2016, 5, 28–36. [Google Scholar] [CrossRef]
- Todorovic, J.; Terzic-Supic, Z.; Divjak, J.; Stamenkovic, Z.; Mandic-Rajcevic, S.; Kocic, S.; Ukropina, S.; Markovic, R.; Radulovic, O.; Arnaut, A.; et al. Validation of the Study Burnout Inventory and the Copenhagen Burnout Inventory for the Use among Medical Students. Int. J. Occup. Med. Environ. Health 2021, 34, 737–745. [Google Scholar] [CrossRef] [PubMed]
- D’amico, A.; Geraci, A.; Tarantino, C. The relationship between perceived emotional intelligence, work engagement, job satisfaction, and burnout in Italian school teachers: An exploratory study. Psychol. Top. 2020, 29, 63–84. [Google Scholar] [CrossRef]
- Perumalswami, C.R.; Takenoshita, S.; Tanabe, A.; Kanda, R.; Hiraike, H.; Okinaga, H.; Jagsi, R.; Nomura, K. Workplace resources, mentorship, and burnout in early career physician-scientists: A cross sectional study in Japan. BMC Med. Educ. 2020, 20, 178. [Google Scholar] [CrossRef]
- Li, H.; Dance, E.; Poonja, Z.; Aguilar, L.S.; Colmers-Gray, I. Agreement between the Maslach Burnout Inventory and the Copenhagen Burnout Inventory among Emergency Physicians and Trainees. Acad. Emerg. Med. 2024, 31, 1243–1255. [Google Scholar] [CrossRef]
- Jeon, G.-S.; You, S.-J.; Kim, M.-G.; Kim, Y.-M.; Cho, S.-I. Psychometric properties of the Korean version of the Copenhagen Burnout Inventory in Korean homecare workers for older adults. PLoS ONE 2019, 14, e0221323. [Google Scholar] [CrossRef]
- Lynn, M. Determination and Quantification of Content Validity Index. Nurs. Res. 1986, 35, 382–386. [Google Scholar] [CrossRef]
- ITC: Guidelines for Translating and Adapting Tests. 2017. Available online: https://www.intestcom.org/files/guideline_test_adaptation_2ed.pdf (accessed on 18 October 2024).
- Račevska, M. Psiholoģisko Testu un Aptauju Konstruēšana un Adaptācija; RaKa: Riga, Latvia, 2005. [Google Scholar]
- World Medical Association. World Medical Association Declaration of Helsinki: Ethical Principles for Medical Research Involving Human Subjects. JAMA 2013, 310, 2191. [Google Scholar] [CrossRef]
- Chatani, Y.; Nomura, K.; Hiraike, H.; Tsuchiya, A.; Okinaga, H. Multiple Physical Symptoms Are Useful to Identify High Risk Individuals for Burnout: A Study on Faculties and Hospital Workers in Japan. Int. J. Environ. Res. Public Health 2021, 18, 3246. [Google Scholar] [CrossRef]
- Pachi, A.; Sikaras, C.; Ilias, I.; Panagiotou, A.; Zyga, S.; Tsironi, M.; Baras, S.; Tsitrouli, L.A.; Tselebis, A. Depression and Sense of Coherence in Nurses during the Pandemic Crisis. Healthcare 2022, 10, 134. [Google Scholar] [CrossRef]
- Grech, M.; Grech, S. An Evaluation of Burnout among Foundation Doctors in Malta—A Cross-Sectional Observational Study. Health 2021, 13, 705–716. [Google Scholar] [CrossRef]
- Martins, V.; Serrão, C.; Teixeira, A.; Castro, L.; Duarte, I. The Mediating Role of Life Satisfaction in the Relationship between Depression, Anxiety, Stress and Burnout among Portuguese Nurses during COVID-19 Pandemic. BMC Nurs. 2022, 21, 188. [Google Scholar] [CrossRef] [PubMed]
- Braithwaite, J.; Herkes, J.; Ludlow, K.; Testa, L.; Lamprell, G. Association between Organisational and Workplace Cultures, and Patient Outcomes: Systematic Review. BMJ Open 2017, 7, e017708. [Google Scholar] [CrossRef] [PubMed]
- Dhaimade, P.A.; Dhusia, A.H.; Jain, A.A.; Shemna, S.S.; Dubey, P.N. Prevalence of Occupational Burnout among Resident Doctors Working in Public Sector Hospitals in Mumbai. Indian J. Community Med. 2019, 44, 352. [Google Scholar] [CrossRef]
- Circenis, K.; Deklava, L.; Millere, I.; Paparde, A.; Kacare, K. Fatigue and Burnout among Latvian Nurses. Glob. J. Psychol. Res. New Trends Issues 2017, 7, 111–116. [Google Scholar] [CrossRef]
- Adam, D.; Berschick, J.; Schiele, J.K.; Bogdanski, M.; Schröter, M.; Steinmetz, M.; Koch, A.K.; Sehouli, J.; Reschke, S.; Stritter, W.; et al. Interventions to Reduce Stress and Prevent Burnout in Healthcare Professionals Supported by Digital Applications: A Scoping Review. Front. Public Health 2023, 11, 1231266. [Google Scholar] [CrossRef]
- Creedy, D.K.; Sidebotham, M.; Gamble, J.; Pallant, J.; Fenwick, J. Prevalence of Burnout, Depression, Anxiety and Stress in Australian Midwives: A Cross-Sectional Survey. BMC Pregnancy Childbirth 2017, 17, 13. [Google Scholar] [CrossRef]
- Aiello, E.N.; Fiabane, E.; Margheritti, S.; Magnone, S.; Bolognini, N.; Miglioretti, M.; Giorgi, I. Psychometric Properties of the Copenhagen Burnout Inventory (CBI) in Italian Physicians. Med. Lav. Work Environ. Health 2022, 113, e2022037. [Google Scholar] [CrossRef]
- Alonazi, O.; Alshowkan, A.; Shdaifat, E. The Relationship between Psychological Resilience and Professional Quality of Life among Mental Health Nurses: A Cross-Sectional Study. BMC Nurs. 2023, 22, 184. [Google Scholar] [CrossRef]
- Izdebski, Z.; Kozakiewicz, A.; Białorudzki, M.; Dec-Pietrowska, J.; Mazur, J. Occupational Burnout in Healthcare Workers, Stress and Other Symptoms of Work Overload during the COVID-19 Pandemic in Poland. Int. J. Environ. Res. Public Health 2023, 20, 2428. [Google Scholar] [CrossRef]

| Item Nr. | Experts 1. Phase | Item Nr. | Experts 2. Phase | ||||||||
|---|---|---|---|---|---|---|---|---|---|---|---|
| Ex.1. | Ex.2. | Ex.3. | SUM | CVI | Ex.1. | Ex.2. | Ex.3. | SUM | CVI | ||
| Personal burnout | Personal burnout | ||||||||||
| 1. | 1 | 1 | 0 | 2 | 0.67 | 1. | 1 | 1 | 1 | 3 | 1 |
| 2. | 1 | 1 | 1 | 3 | 1 | 2. | 1 | 1 | 1 | 3 | 1 |
| 3. | 1 | 1 | 1 | 3 | 1 | 3. | 1 | 1 | 1 | 3 | 1 |
| 4. | 1 | 1 | 1 | 3 | 1 | 4. | 1 | 1 | 1 | 3 | 1 |
| 5. | 1 | 1 | 0 | 2 | 0.67 | 5. | 0 | 1 | 1 | 2 | 0.67 |
| 6. | 1 | 1 | 1 | 3 | 1 | 6. | 1 | 1 | 1 | 3 | 1 |
| Work-related burnout | Work-related burnout | ||||||||||
| 7. | 1 | 1 | 1 | 3 | 1 | 7. | 0 | 1 | 1 | 3 | 0.67 |
| 8. | 1 | 1 | 0 | 2 | 0.67 | 8. | 1 | 1 | 0 | 2 | 0.67 |
| 9. | 1 | 1 | 1 | 3 | 1 | 9. | 1 | 1 | 1 | 3 | 1 |
| 10. | 1 | 1 | 1 | 3 | 1 | 10. | 1 | 1 | 1 | 3 | 1 |
| 11. | 0 | 1 | 0 | 1 | 0.33 | 11. | 1 | 1 | 0 | 2 | 0.67 |
| 12. | 1 | 0 | 0 | 1 | 0.33 | 12. | 1 | 1 | 0 | 2 | 0.67 |
| 13. | 0 | 1 | 1 | 2 | 0.67 | 13. | 1 | 1 | 1 | 3 | 1 |
| Client-related burnout | Client-related burnout | ||||||||||
| 14. | 0 | 1 | 1 | 2 | 0.67 | 14. | 1 | 1 | 0 | 2 | 0.67 |
| 15. | 1 | 1 | 1 | 3 | 1 | 15. | 1 | 1 | 1 | 3 | 1 |
| 16. | 1 | 1 | 1 | 3 | 1 | 16. | 1 | 1 | 1 | 3 | 1 |
| 17. | 1 | 1 | 1 | 3 | 1 | 17. | 1 | 1 | 1 | 3 | 1 |
| 18. | 1 | 1 | 0 | 1 | 0.33 | 18. | 1 | 1 | 1 | 3 | 1 |
| 19. | 1 | 1 | 1 | 3 | 1 | 19. | 1 | 1 | 1 | 3 | 1 |
| CVI (items) | 0.807 | CVI (items) | 0.896 | ||||||||
| CVI (Ex.) | 0.84 | 0.95 | 0.68 | 0.823 | CVI (Ex.) | 0.895 | 1 | 0.789 | 0.895 | ||
| Items | Activities | Never/Almost Never (0%) Nekad/Gandrīz Nekad (0%) | Seldom (25%) Reti (25%) | Sometimes (50%) Dažreiz (50%) | Often (75%) Bieži (75%) | Always (100%) Vienmēr (100%) |
|---|---|---|---|---|---|---|
| Personal burnout | ||||||
| 1. | How often do you feel tired? (Cik bieži Jūs jūtaties izmocīts?) | |||||
| 2. | How often are you physically exhausted? (Cik bieži Jūs esat fiziski izsmelts?) | |||||
| 3. | How often are you emotionally exhausted? (Cik bieži Jūs esat emocionāli izsmelts?) | |||||
| 4. | How often do you think: “I can’t take it anymore?” (Cik bieži domājat: “Es to vairs nevaru izturēt?”) | |||||
| 5. | How often do you feel worn out? (Cik bieži jūtaties noguris?) | |||||
| 6. | How often do you feel weak and susceptible to illness? (Cik bieži Jūs jūtaties vājš un uzņēmīgs pret slimībām?) | |||||
| Work-related burnout | ||||||
| 7. | Do you feel worn out at the end of the working day? (Vai darba dienas beigās Jūs jūtaties noguris?) | |||||
| 8. | Are you exhausted in the morning at the thought of another day at work? (Vai no rīta Jūs jūtaties izsmelts, domājot par kārtējo darba dienu?) | |||||
| 9. | Do you feel that every working hour is tiring for you? (Vai jums šķiet, ka katra darba stunda ir nogurdinoša? ) | |||||
| 10. | Do you have enough energy for family and friends during leisure time? (Vai Jums ir pietiekami daudz enerģijas ģimenei un draugiem brīvajā laikā?) | |||||
| 11. | Is your work emotionally exhausting? (Vai jūsu darbs ir Jūs emocionāli izsmeļ?) | |||||
| 12. | Does your work frustrate you? (Vai jūsu darbs Jūs aizkaitina?) | |||||
| 13. | Do you feel burnt out because of your work? (Vai Jūs jūtaties izdedzis/izdegusi?) | |||||
| Client-related burnout | ||||||
| 14. | Do you find it hard to work with clients? (Vai darbs ar klientiem sagādā Jums grūtības?) | |||||
| 15. | Does it drain your energy to work with clients? (Vai darbā ar klientiem Jūs jūtat enerģijas izsīkumu?) | |||||
| 16. | Do you find it frustrating to work with clients? Vai darbs ar klientiem Jums sagādā vilšanos? | |||||
| 17. | Do you feel that you give more than you get back when you work with clients? (Vai jūtat, ka, strādājot ar klientiem, dodat vairāk nekā saņemat pretī?) | |||||
| 18. | Are you tired of working with clients? (Vai Jūs esat noguris no darba ar klientiem?) | |||||
| 19. | Do you sometimes wonder how long you will be able to continue working with clients? (Vai Jūs dažreiz domājat, cik ilgi vēl spēsiet turpināt strādāt ar klientiem?) | |||||
| Question | n = 288 |
|---|---|
| Gender | Female—282 (97.8%) Male—5 (1.75%) Do not wish to specify—1 (0.35%) |
| Region of workplace | Riga region—165 (57.15%) Kurzeme region—31 (10.85%) Latgale region—24 (8.3%) Vidzeme region—49 (17.05%) Zemgale region—19 (6.65%) |
| Family status | Married—144 (50%) Single—59 (20.55%) Divorced—41 (14.15%) Widowed—5 (1.75%) Cohabiting—37 (12.85%) Single with child—2 (0.7%) |
| Education | Vocational secondary education—31 (10.95%) First level professional higher education—67 (23.15%) Second level professional higher education or Bachelor’s degree—149 (51.65%) Master’s degree—39 (13.55%) Doctoral degree—2 (0.7%) |
| Position | Medical assistant—2 (0.7%) Nurse—234 (81.3%) Physician assistant—21 (7.35%) Physician—7 (2.35%) Medical resident—6 (2.1%) Physiotherapist—3 (1.05%) Midwife—9 (3.05%) Nurse assistant—2 (0.7%) Dental hygienist—1 (0.35%) Radiologist—3 (1.05%) |
| Department profile | Outpatient department—86 (29.9%) Intensive care unit—30 (10.4%) Anaesthesia department—30 (10.4%) Therapeutic department—40 (13.9%) Surgery—20 (6.9%) Rehabilitation—8 (2.8%) Paediatrics—10 (3.5%) Diagnostic department—8 (2.8%) Admissions, EMS—10 (3.5%) Psychiatry—26 (9.0%) Dentistry—2 (0.7%) Social care—6 (2.1%) Operating theatre—4 (1.4%) Home care—2 (0.7%) Mental health care—2 (0.7%) Administration—4 (1.4%) |
| Total workload | Up to 0.25 workload (10 h per week)—2 (0.7%) 0.25–0.5 workload (10–20 h per week)—5 (1.75%) 0.5–0.75 workload (20–30 h per week)—59 (20.55%) 0.75–1.0 workload (30–40 h per week)—140 (48.5%) 1.0–1.25 h (40–50 h per week)—45 (15.65%) 1.25–1.5 h (50–60 h per week)—37 (12.85%) |
| Working hours | Daily work—119 (41.35%) Shift work—89 (30.95%) Both daily and shift work—80 (27.7%) |
| Work environment | Outpatient care—89 (30.95%) Inpatient care—171 (59.35%) Home care—3 (1.05%) Both outpatient and inpatient care—15 (5.25%) EMS—6 (2.1%) Management—1 (0.35%) School nurse—3 (1.05%) |
| Workload in the last month | Very low—6 (2.1%) Low—12 (4.2%) Moderate—89 (30.9%) High—121 (42%) Very high—60 (20.8%) |
| Items | M | SD | Corrected Item-Total Correlation | Item-Rest Correlation | Squared Multiple Correlation | Cronbach’s Alpha if Item Deleted | Scale’s Mean | Cronbach’s Alpha Based on Dimensions |
|---|---|---|---|---|---|---|---|---|
| Personal-related burnout | ||||||||
| 1 | 60.24 | 22.940 | 0.850 | 0.803 | 0.770 | 0.895 | 58.9 | 0.920 |
| 2 | 59.72 | 23.362 | 0.787 | 0.738 | 0.693 | 0.903 | ||
| 3 | 63.89 | 22.042 | 0.765 | 0.725 | 0.636 | 0.906 | ||
| 4 | 53.13 | 24.494 | 0.775 | 0.741 | 0.612 | 0.905 | ||
| 5 | 67.19 | 22.568 | 0.806 | 0.755 | 0.664 | 0.901 | ||
| 6 | 49.13 | 26.630 | 0.670 | 0.660 | 0.481 | 0.922 | ||
| Work-related burnout | ||||||||
| 7 | 73.09 | 22.298 | 0.628 | 0.688 | 0.522 | 0.748 | 56.0 | 0.791 |
| 8 | 54.34 | 28.206 | 0.711 | 0.758 | 0.633 | 0.724 | ||
| 9 | 46.18 | 25.784 | 0.785 | 0.809 | 0.700 | 0.712 | ||
| 10 | 48.09 | 25.507 | −0.489 | −0.504 | 0.271 | 0.914 | ||
| 11 | 64.06 | 25.682 | 0.739 | 0.704 | 0.599 | 0.722 | ||
| 12 | 48.78 | 27.738 | 0.769 | 0.781 | 0.655 | 0.712 | ||
| 13 | 57.47 | 29.080 | 0.757 | 0.776 | 0.640 | 0.712 | ||
| Client-related burnout | ||||||||
| 14 | 41.84 | 23.019 | 0.629 | 0.568 | 0.476 | 0.876 | 48.9 | 0.884 |
| 15 | 48.96 | 24.136 | 0.778 | 0.765 | 0.672 | 0.853 | ||
| 16 | 39.76 | 22.168 | 0.700 | 0.616 | 0.530 | 0.866 | ||
| 17 | 60.42 | 28.539 | 0.525 | 0.501 | 0.366 | 0.898 | ||
| 18 | 50.52 | 24.951 | 0.815 | 0.757 | 0.722 | 0.846 | ||
| 19 | 51.39 | 27.965 | 0.789 | 0.737 | 0.660 | 0.850 | ||
| Items | Factor | ||||
|---|---|---|---|---|---|
| 1 | 2 | 3 | h2 | Uniqueness | |
| Personal-related burnout | |||||
| 1 | 0.785 | 0.248 | 0.317 | 0.778 | 0.182 |
| 2 | 0.789 | 0.153 | 0.295 | 0.733 | 0.261 |
| 3 | 0.705 | 0.207 | 0.340 | 0.656 | 0.371 |
| 4 | 0.813 | 0.230 | 0.084 | 0.720 | 0.331 |
| 5 | 0.709 | 0.254 | 0.340 | 0.683 | 0.273 |
| 6 | 0.702 | 0.302 | −0.002 | 0.583 | 0.516 |
| Work-related burnout | |||||
| 7 | 0.641 | 0.204 | 0.383 | 0.599 | 0.458 |
| 8 | 0.725 | 0.363 | 0.129 | 0.675 | 0.342 |
| 9 | 0.738 | 0.387 | 0.193 | 0.732 | 0.261 |
| 10 | −0.520 | 0.103 | −0.575 | 0.612 | 0.651 |
| 11 | 0.636 | 0.361 | 0.158 | 0.559 | 0.404 |
| 12 | 0.657 | 0.541 | 0.015 | 0.725 | 0.223 |
| 13 | 0.736 | 0.341 | 0.185 | 0.692 | 0.328 |
| Client-related burnout | |||||
| 14 | 0.246 | 0.795 | −0.029 | 0.694 | 0.536 |
| 15 | 0.419 | 0.704 | 0.281 | 0.750 | 0.267 |
| 16 | 0.205 | 0.787 | 0.166 | 0.689 | 0.428 |
| 17 | 0.110 | 0.400 | 0.698 | 0.658 | 0.267 |
| 18 | 0.346 | 0.631 | 0.537 | 0.806 | 0.682 |
| 19 | 0.339 | 0.691 | 0.402 | 0.753 | 0.280 |
| Eigenvalue after rotation | 7.047 | 3.991 | 2.059 | ||
| % of variance | 37,088 | 21,007 | 10,639 | ||
| Items | Factor | |||
|---|---|---|---|---|
| 1 | 2 | h2 | Uniqueness | |
| Personal-related burnout | ||||
| 1 | 0.815 | 0.336 | 0.777 | 0.212 |
| 2 | 0.821 | 0.239 | 0.732 | 0.274 |
| 3 | 0.747 | 0.300 | 0.648 | 0.374 |
| 4 | 0.785 | 0.263 | 0.686 | 0.345 |
| 5 | 0.747 | 0.346 | 0.677 | 0.336 |
| 6 | 0.650 | 0.309 | 0.519 | 0.519 |
| Work-related burnout | ||||
| 7 | 0.696 | 0.307 | 0.578 | 0.463 |
| 8 | 0.701 | 0.401 | 0.652 | 0.374 |
| 9 | 0.727 | 0.440 | 0.722 | 0.312 |
| 10 | −0.654 | −0.052 | 0.431 | 0.677 |
| 11 | 0.621 | 0.404 | 0.549 | 0.492 |
| 12 | 0.591 | 0.544 | 0.645 | 0.383 |
| 13 | 0.727 | 0.393 | 0.683 | 0.341 |
| Client-related burnout | ||||
| 14 | 0.162 | 0.770 | 0.620 | 0.547 |
| 15 | 0.414 | 0.761 | 0.750 | 0.274 |
| 16 | 0.171 | 0.808 | 0.683 | 0.459 |
| 17 | 0.244 | 0.560 | 0.373 | 0.684 |
| 18 | 0.413 | 0.750 | 0.733 | 0.266 |
| 19 | 0.367 | 0.775 | 0.736 | 0.284 |
| Eigenvalue after rotation | 7.281 | 4.911 | ||
| % of variance | 38,321 | 25,850 | ||
| Component | 1 | 2 | 3 |
|---|---|---|---|
| 1 | 0.781 | 0.521 | 0.344 |
| 2 | −0.567 | 0.822 | 0.042 |
| 3 | 0.261 | 0.228 | −0.938 |
| 95% Confidence Intervals | |||||
|---|---|---|---|---|---|
| Type | SRMR | RMSEA | Lower | Upper | RMSEA p |
| Classical | 0.048 | 0.064 | 0.055 | 0.074 | 0.008 |
| Robust | 0.041 | 0.139 | 0.129 | 0.150 | <0.001 |
| Scaled | 0.041 | 0.090 | 0.081 | 0.098 | <0.001 |
| Comparative Fit Index (CFI) | 0.997 |
| Tucker–Lewis Index (TLI) | 0.997 |
| Bentler–Bonett Non-normed Fit Index (NNFI) | 0.997 |
| Relative-Noncentrality Index (RNI) | 0.997 |
| Bentler–Bonett Normed Fit Index (NFI) | 0.994 |
| Bollen’s Relative Fit Index (RFI) | 0.994 |
| Bollen’s Incremental Fit Index (IFI) | 0.997 |
| Parsimony Normed Fit Index (PNFI) | 0.866 |
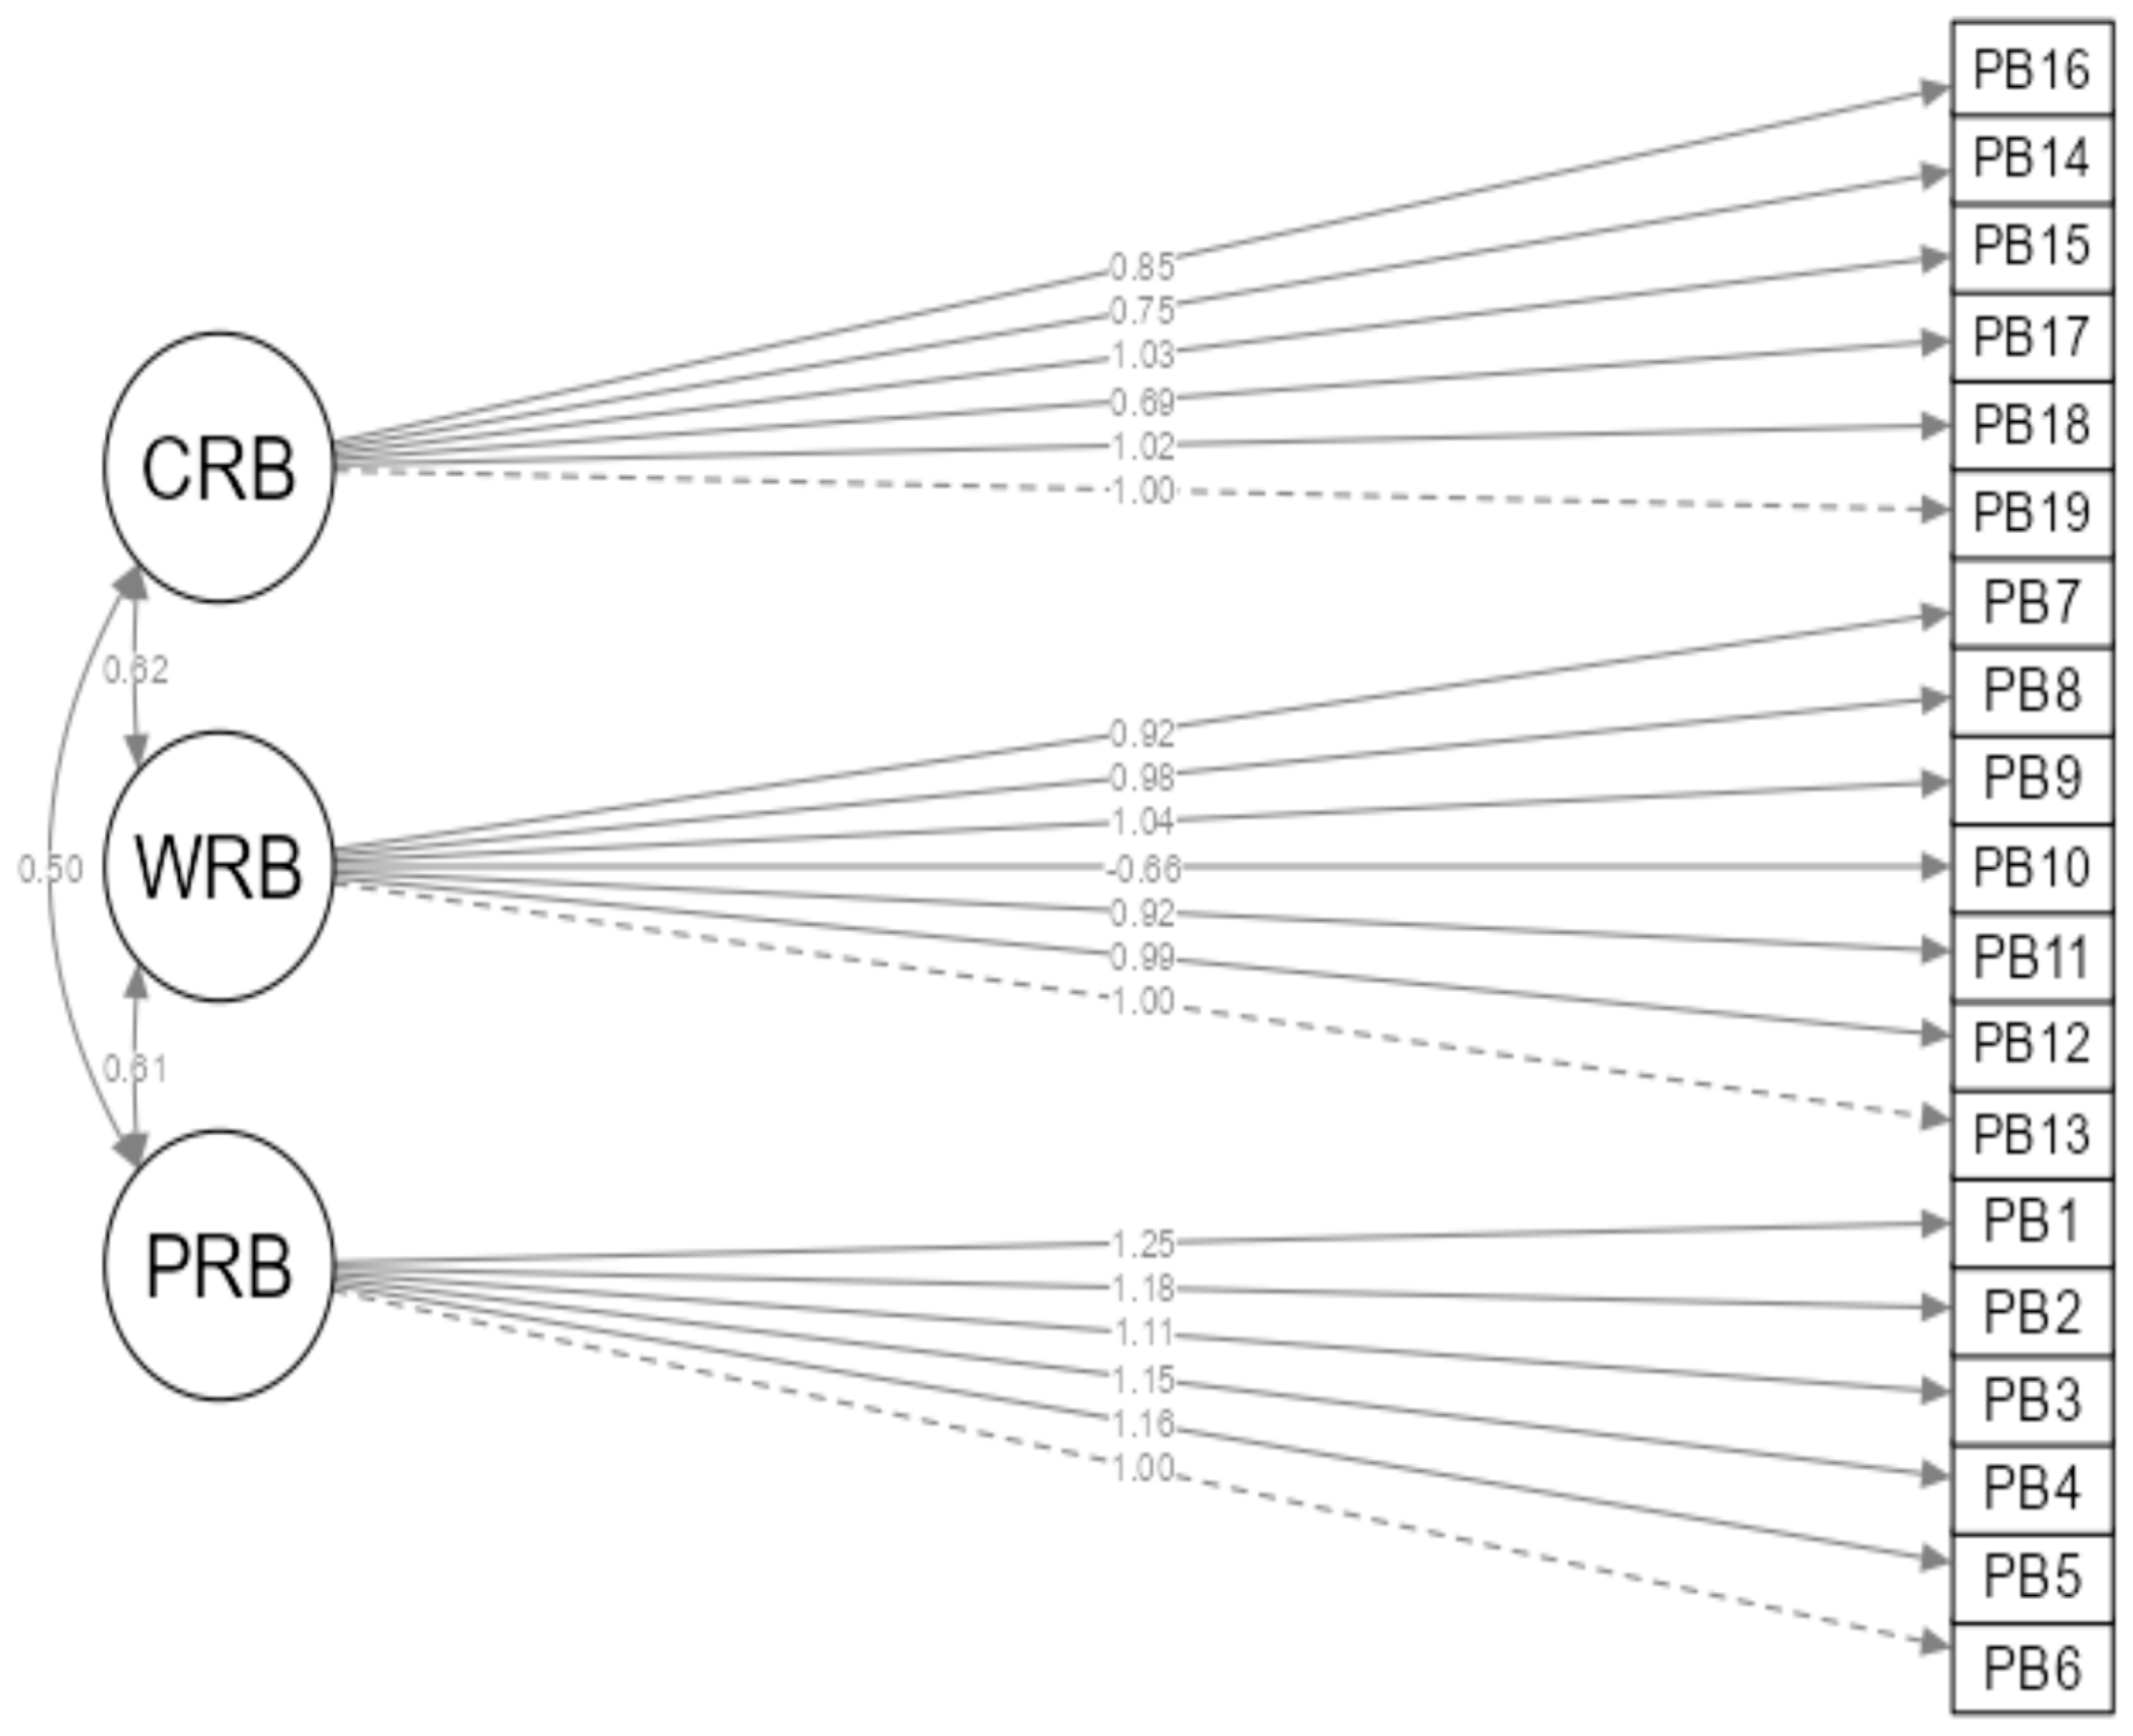
| 95% Confidence Intervals | ||||||||||
|---|---|---|---|---|---|---|---|---|---|---|
| Latent | Observed | Estimate | SE | Lower | Upper | β | z | p | CR | AVE |
| PRB | 1 | 1.252 | 0.0451 | 1.164 | 1.340 | 0.956 | 27.8 | <0.001 | 0.91 | 0.64 |
| 2 | 1.177 | 0.0396 | 1.099 | 1.254 | 0.898 | 29.7 | <0.001 | |||
| 3 | 1.112 | 0.0406 | 1.032 | 1.191 | 0.848 | 27.4 | <0.001 | |||
| 4 | 1.153 | 0.0403 | 1.075 | 1.232 | 0.880 | 28.6 | <0.001 | |||
| 5 | 1.155 | 0.0371 | 1.082 | 1.128 | 0.882 | 31.1 | <0.001 | |||
| 6 | 1.000 | 0.0000 | 1.000 | 1.000 | 0.763 | |||||
| WRB | 7 | 0.919 | 0.0239 | 0.872 | 0.966 | 0.797 | 38.5 | <0.001 | 0.88 | 0.60 |
| 8 | 0.984 | 0.0250 | 0.935 | 1.033 | 0.853 | 39.3 | <0.001 | |||
| 9 | 1.043 | 0.0200 | 1.003 | 1.082 | 0.904 | 52.2 | <0.001 | |||
| 10 | −0.660 | 0.0422 | −0.743 | −0.578 | −0.572 | −15.6 | <0.001 | |||
| 11 | 0.918 | 0.0244 | 0.870 | 0.966 | 0.796 | 37.6 | <0.001 | |||
| 12 | 0.985 | 0.0236 | 0.939 | 1.032 | 0.854 | 41.7 | <0.001 | |||
| 13 | 1.000 | 0.0000 | 1.000 | 1.000 | 0.867 | |||||
| CRB | 14 | 0.746 | 0.0330 | 0.681 | 0.811 | 0.669 | 22.6 | <0.001 | 0.87 | 0.58 |
| 15 | 1.031 | 0.0204 | 0.991 | 1.071 | 0.925 | 50.5 | <0.001 | |||
| 16 | 0.846 | 0.0348 | 0.777 | 0.914 | 0.758 | 24.3 | <0.001 | |||
| 17 | 0.693 | 0.0429 | 0.609 | 0.777 | 0.621 | 16.2 | <0.001 | |||
| 18 | 1.023 | 0.0219 | 0.980 | 1.066 | 0.917 | 46.6 | <0.001 | |||
| 19 | 1.000 | 0.0000 | 1.000 | 1.000 | 0.897 | |||||
Disclaimer/Publisher’s Note: The statements, opinions and data contained in all publications are solely those of the individual author(s) and contributor(s) and not of MDPI and/or the editor(s). MDPI and/or the editor(s) disclaim responsibility for any injury to people or property resulting from any ideas, methods, instructions or products referred to in the content. |
© 2025 by the authors. Licensee MDPI, Basel, Switzerland. This article is an open access article distributed under the terms and conditions of the Creative Commons Attribution (CC BY) license (https://creativecommons.org/licenses/by/4.0/).
Share and Cite
Cerela-Boltunova, O.; Millere, I.; Trups-Kalne, I. Adaptation of the Copenhagen Burnout Inventory in Latvia: Psychometric Data and Factor Analysis. Int. J. Environ. Res. Public Health 2025, 22, 761. https://doi.org/10.3390/ijerph22050761
Cerela-Boltunova O, Millere I, Trups-Kalne I. Adaptation of the Copenhagen Burnout Inventory in Latvia: Psychometric Data and Factor Analysis. International Journal of Environmental Research and Public Health. 2025; 22(5):761. https://doi.org/10.3390/ijerph22050761
Chicago/Turabian StyleCerela-Boltunova, Olga, Inga Millere, and Ingrida Trups-Kalne. 2025. "Adaptation of the Copenhagen Burnout Inventory in Latvia: Psychometric Data and Factor Analysis" International Journal of Environmental Research and Public Health 22, no. 5: 761. https://doi.org/10.3390/ijerph22050761
APA StyleCerela-Boltunova, O., Millere, I., & Trups-Kalne, I. (2025). Adaptation of the Copenhagen Burnout Inventory in Latvia: Psychometric Data and Factor Analysis. International Journal of Environmental Research and Public Health, 22(5), 761. https://doi.org/10.3390/ijerph22050761