

The Direct Effects of Air Pollutant Exposure from Industrial Complexes on Chronic Respiratory Diseases in Local Residents: A Population-Based Cohort Study

Abstract
1. Introduction
2. Method
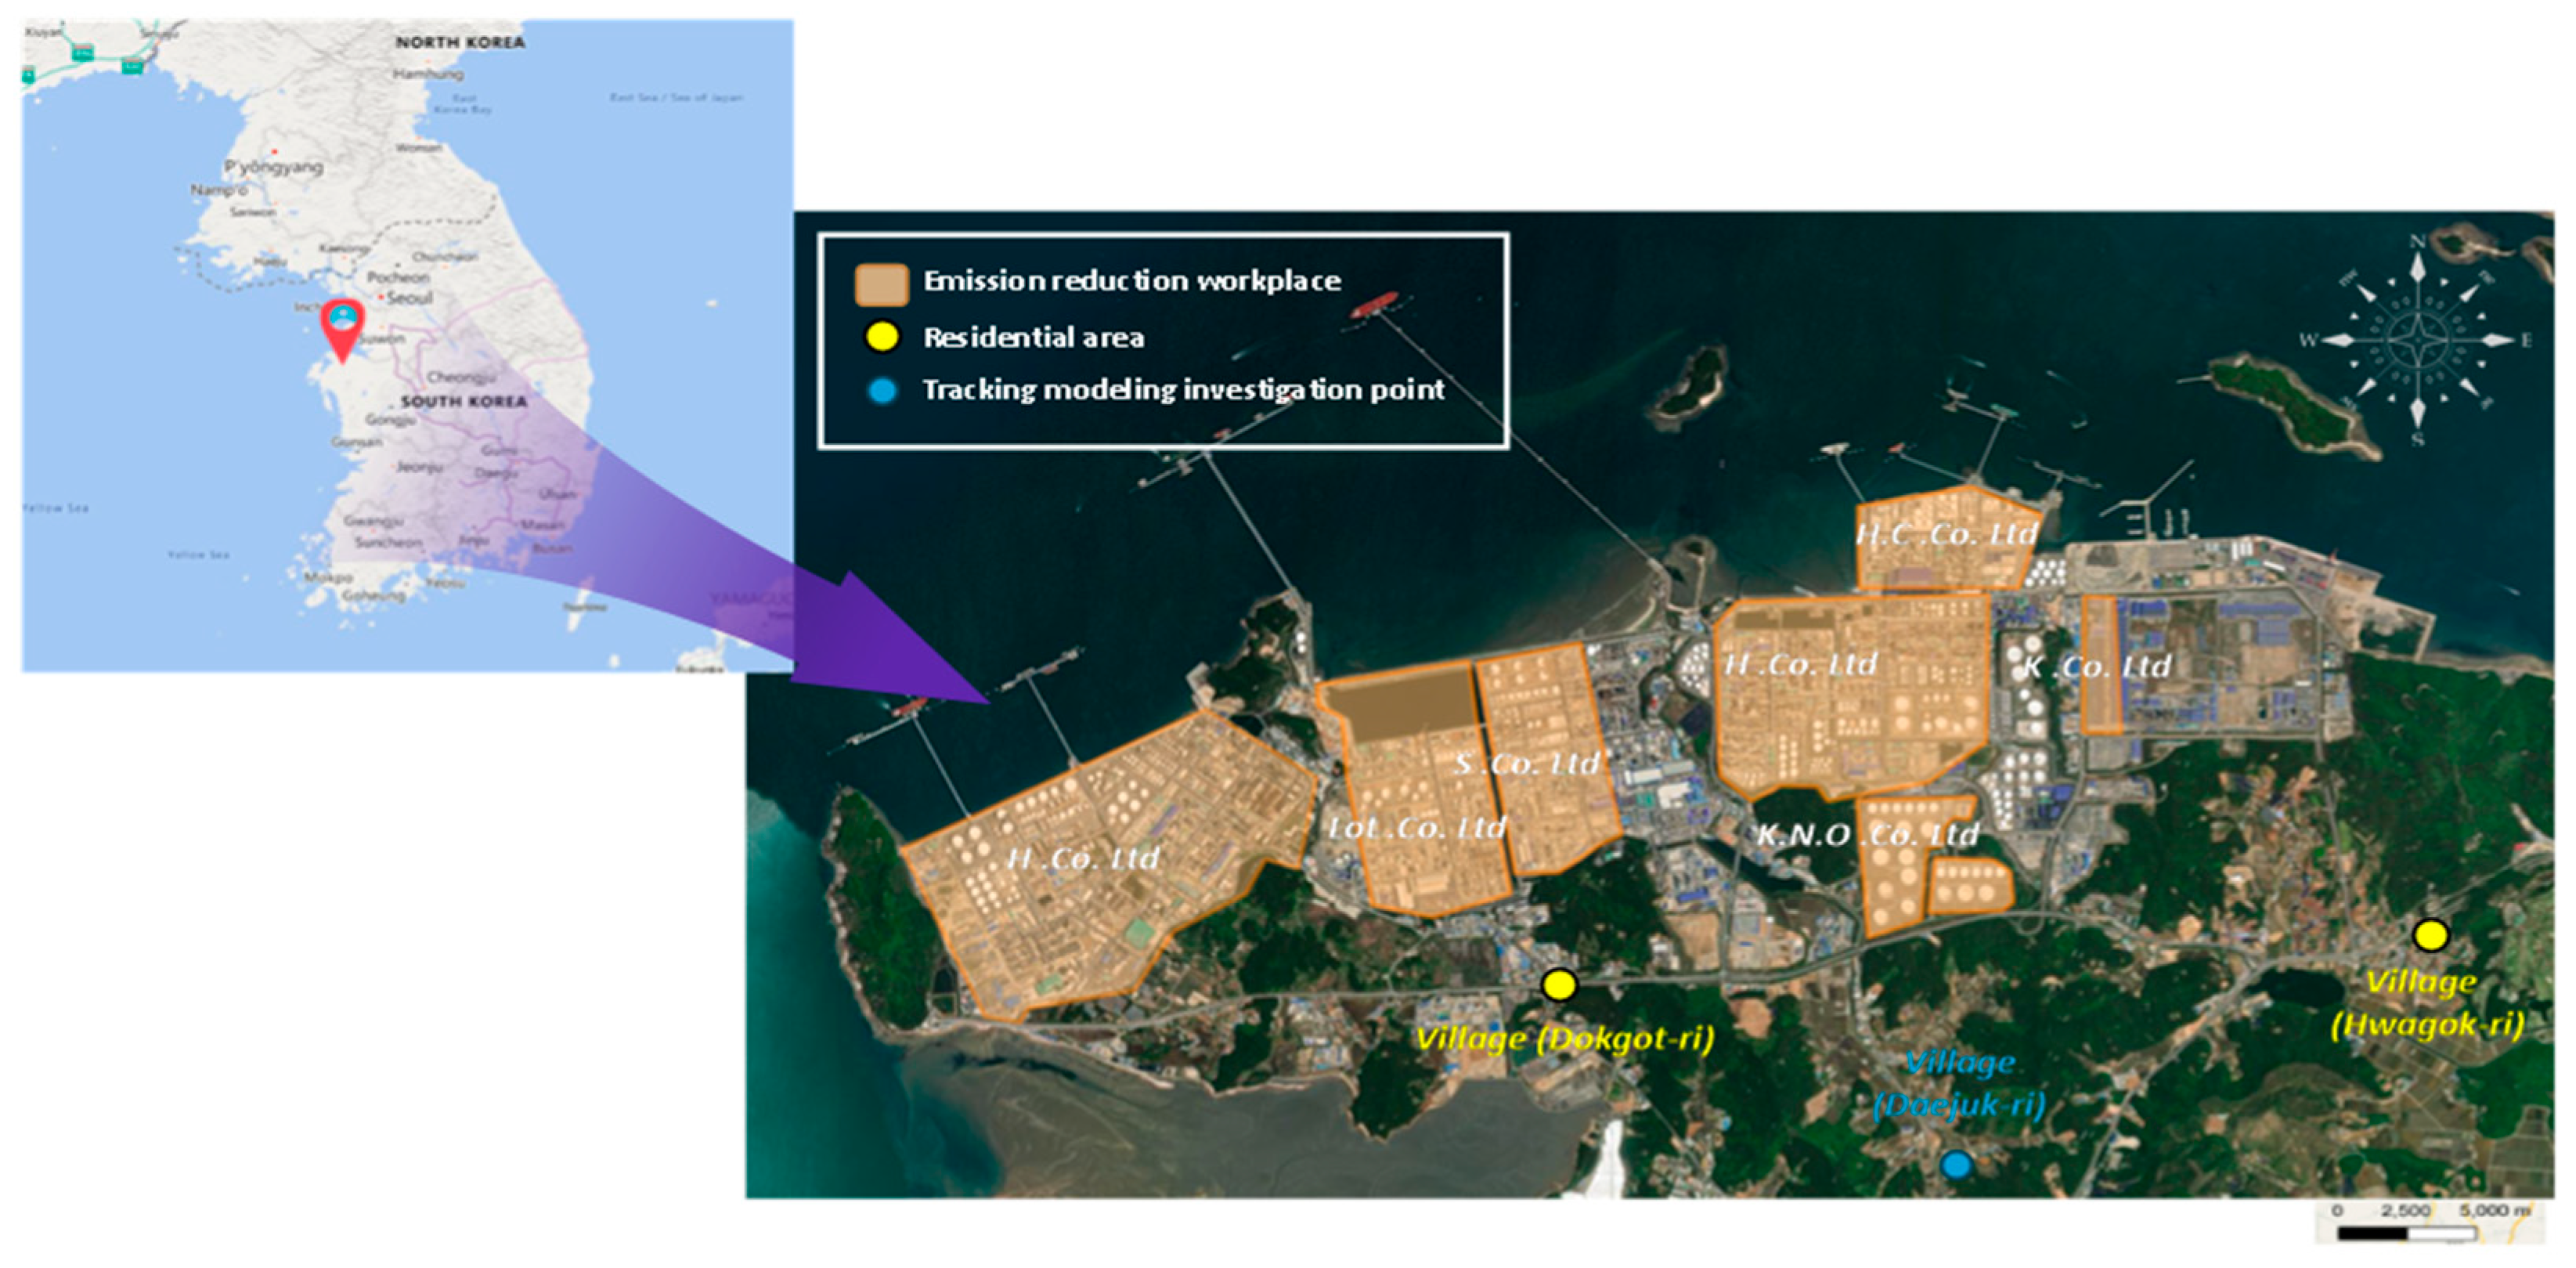
2.1. Study Area
2.2. Air Pollution Monitoring
2.3. Sample Analysis Method
2.3.1. Sample Collection
2.3.2. Sample Analysis
2.4. Establishment of a Standardization Technique for Monitoring Emission Concentrations
2.5. Statistical Analysis
2.6. Moving Window Positive Matrix Factorization
- -
- X: n × m matrix (n: number of samples, m: number of chemical species analyzed).
- -
- G: n × p matrix (n: number of samples, p: number of pollutants) which represents the emission amount for a specific pollutant source, i.e., the contribution of the pollutant source to the receptor.
- -
- F: p × m matrix (p: number of pollutants, m: number of chemical species analyzed) which contains information on the emission source and is often called a pollutant source classification table (Source Profile).
- -
- E: the residual matrix, which can be expressed as the following equation.
3. Results
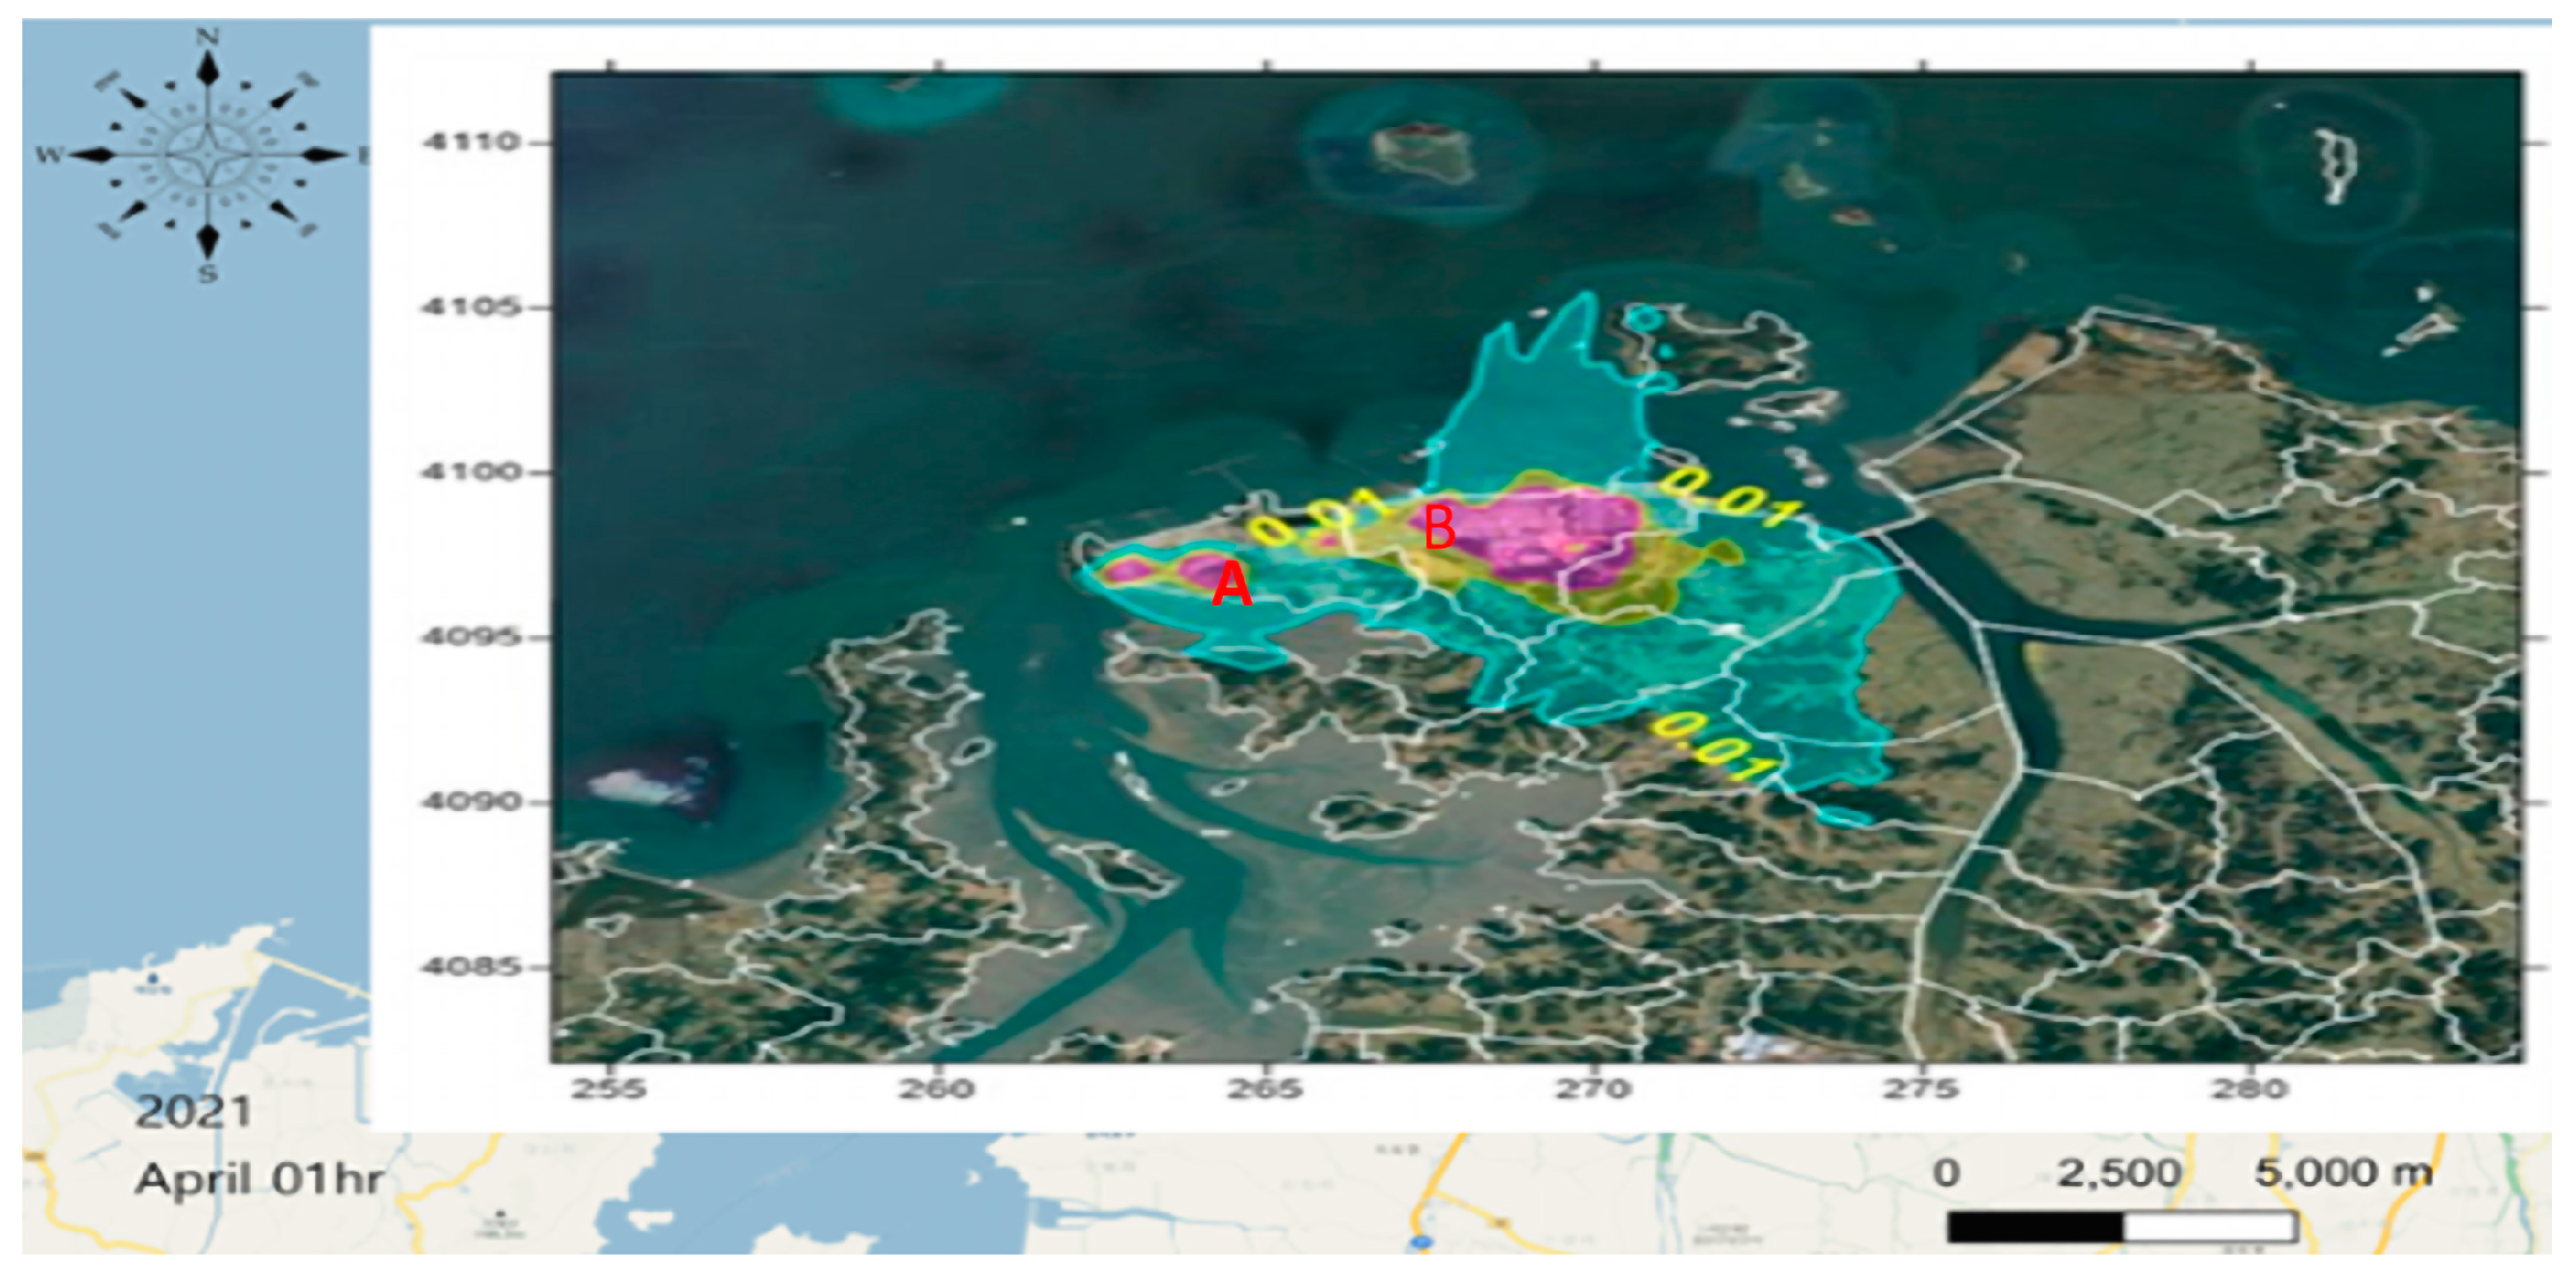
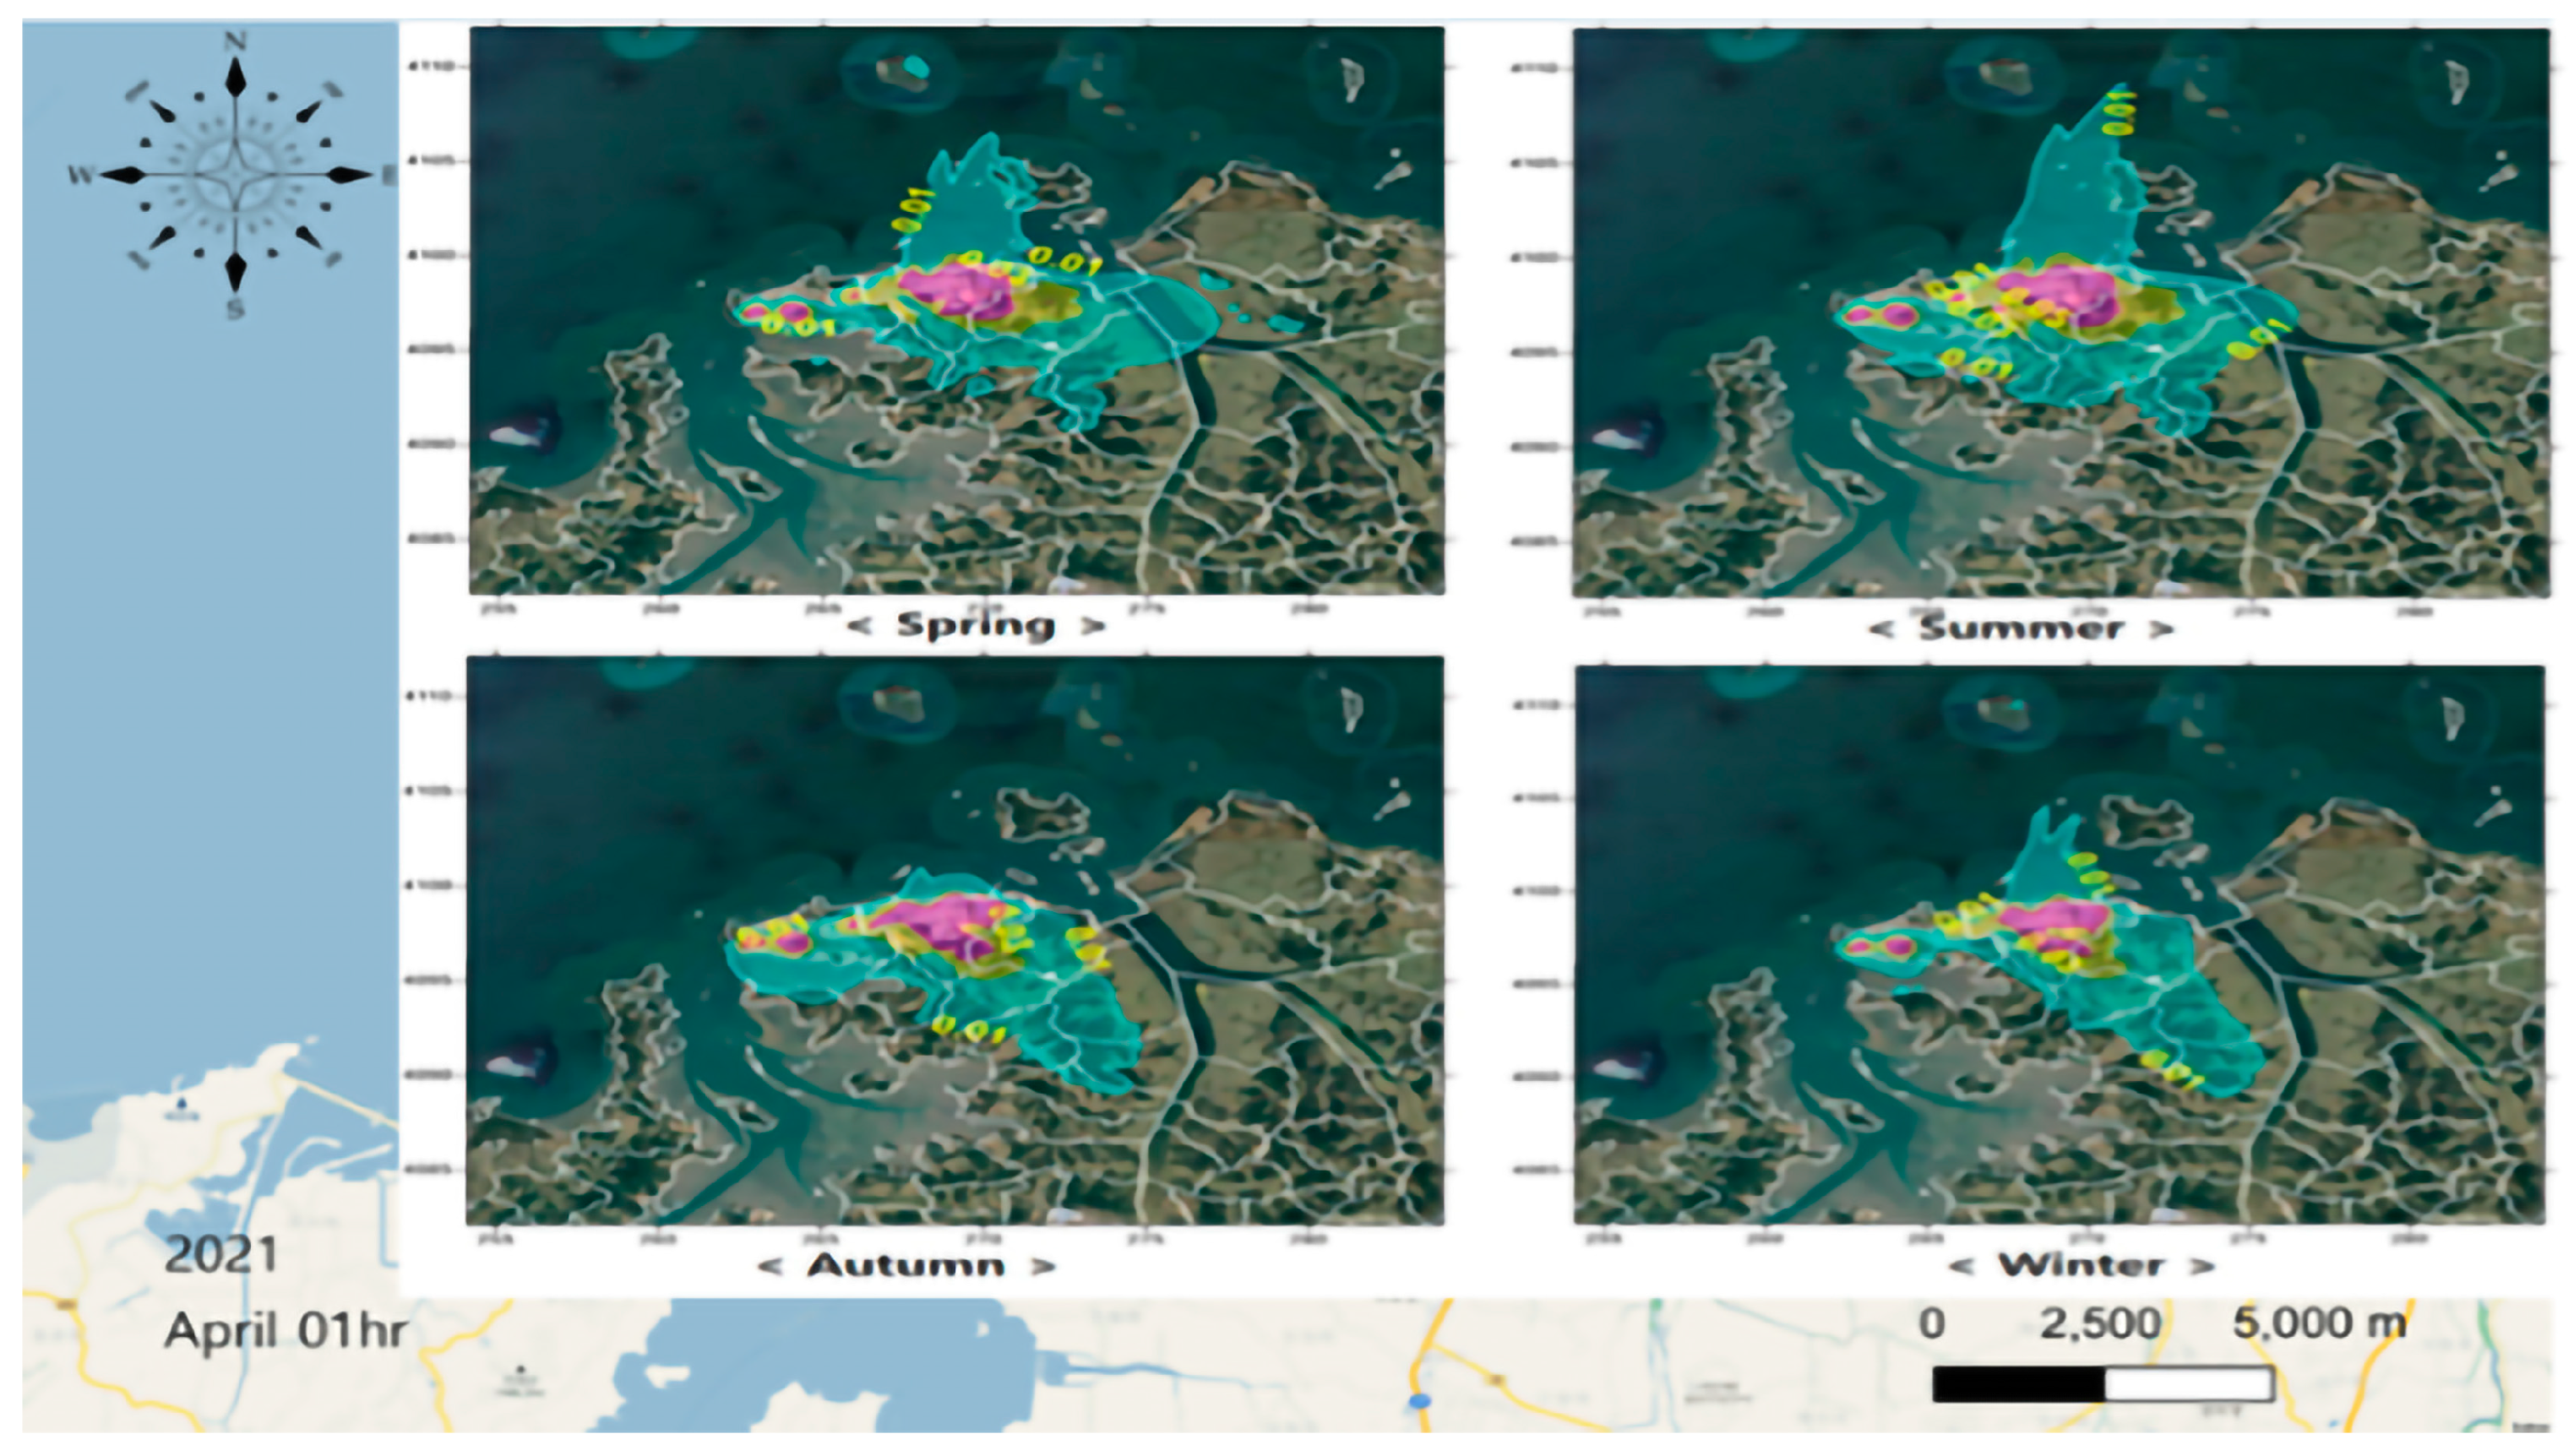
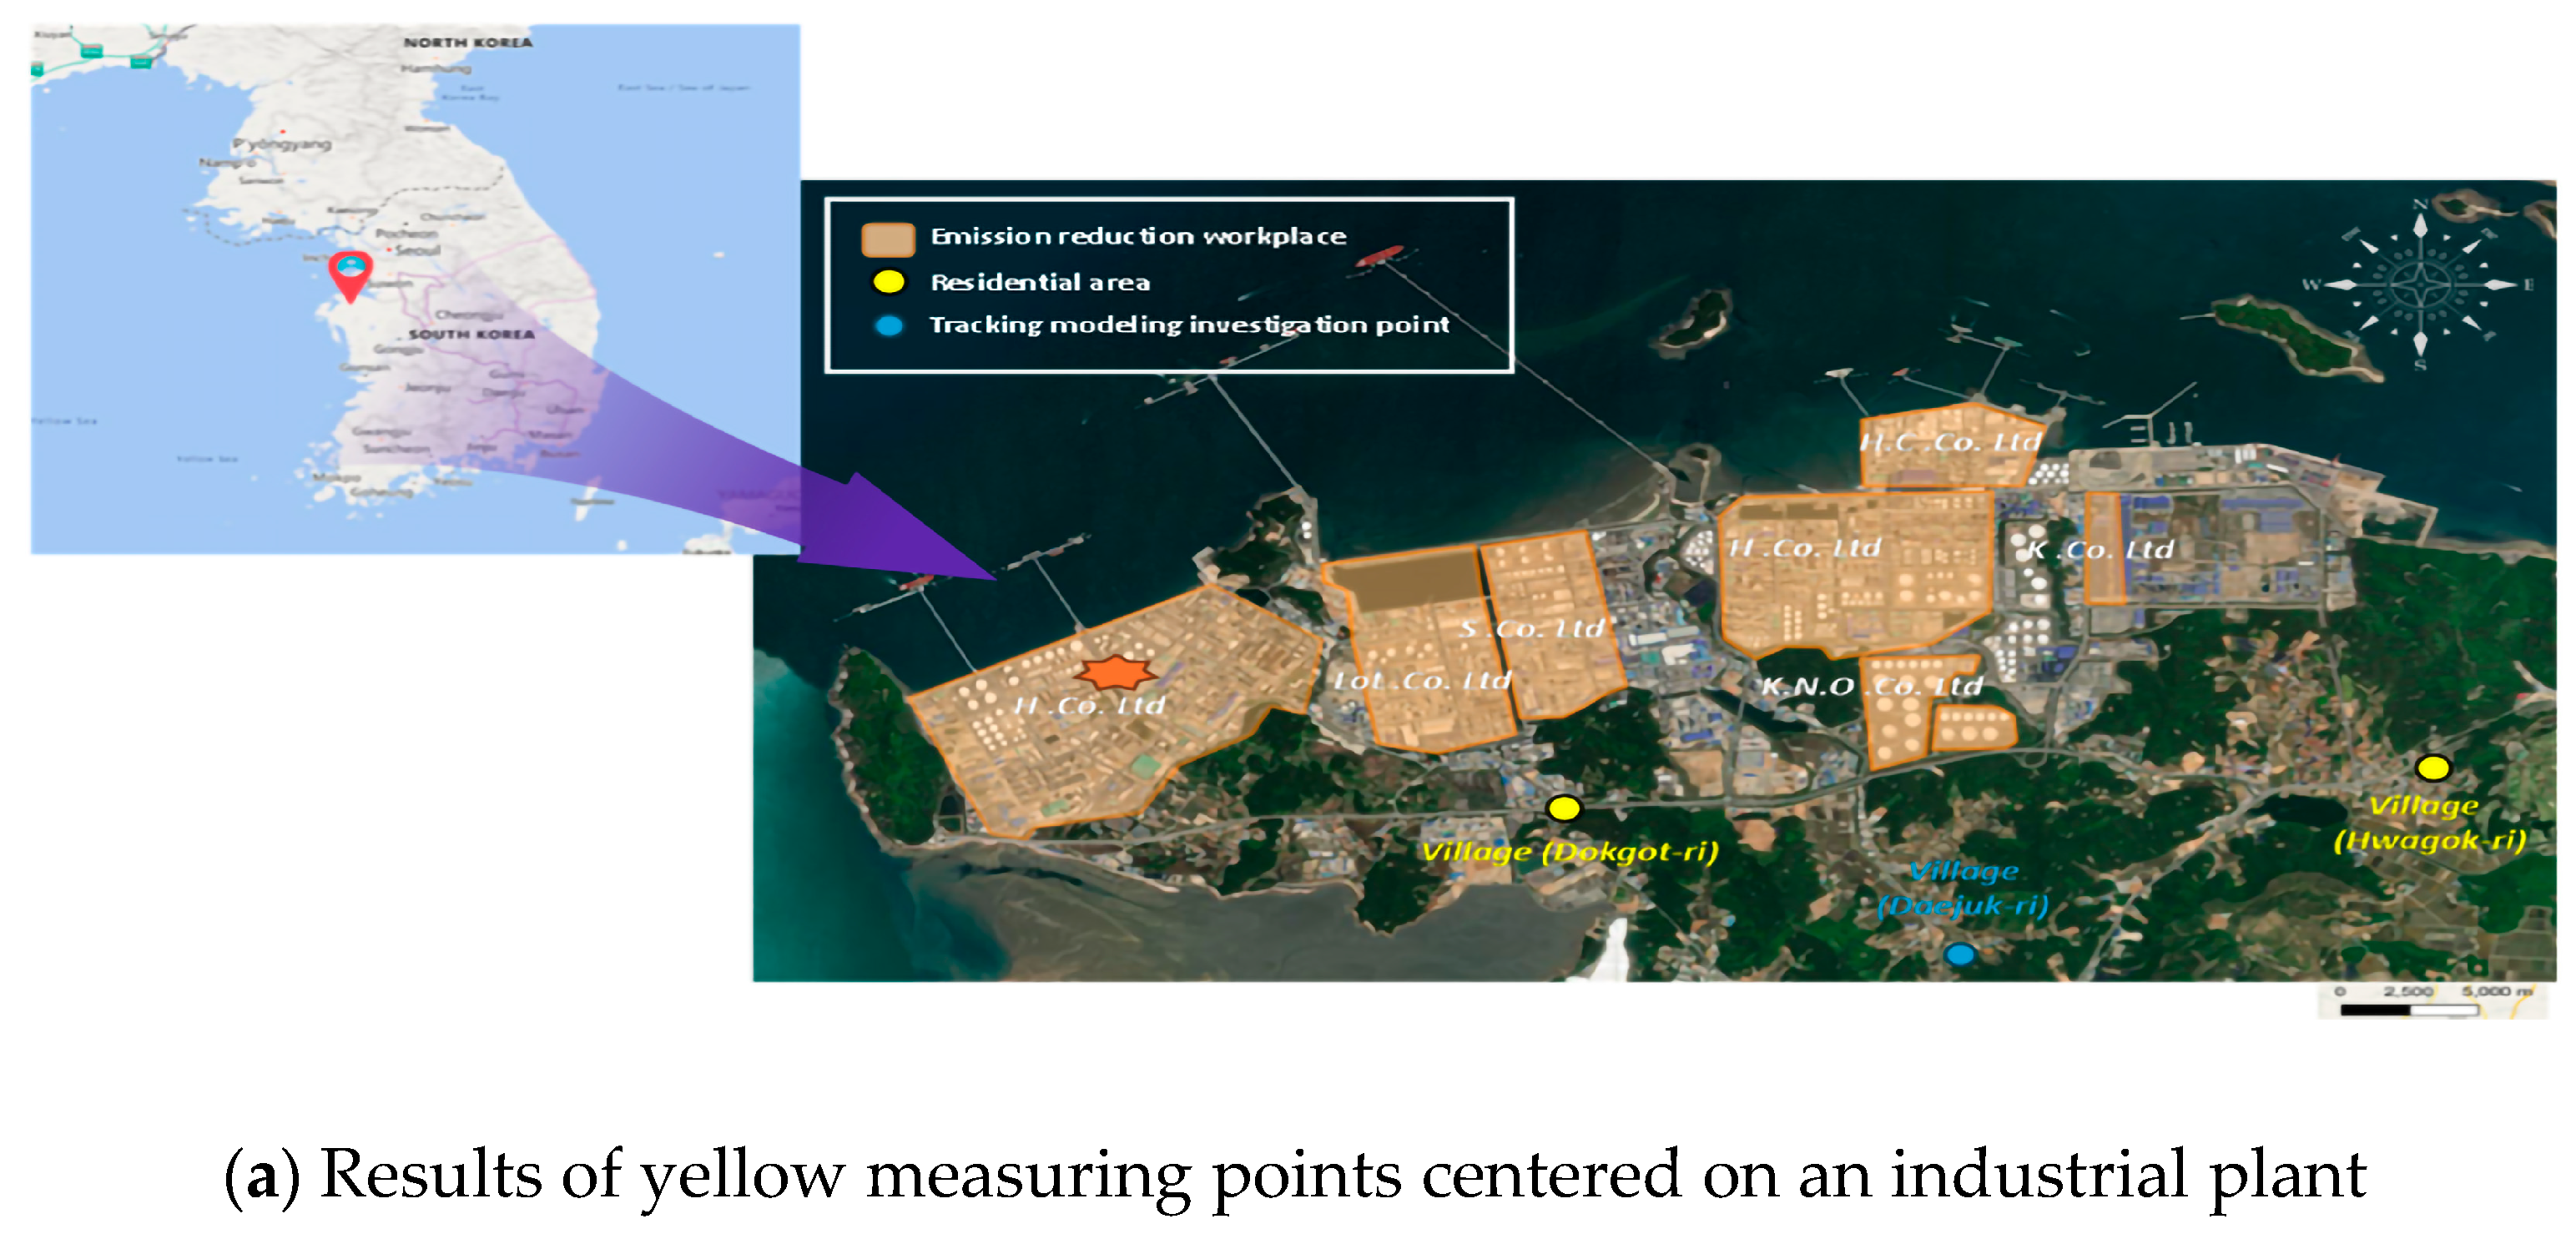
3.1. Measurement Results Using the Air Diffusion Model in the Industrial Plant and Surrounding Areas
3.2. Characteristics of the Area Surrounding the Plant
3.3. Results of a Cohort Analysis of Health Insurance Data from Industrial Complexes (Dokgotri and Hwagok-ri)
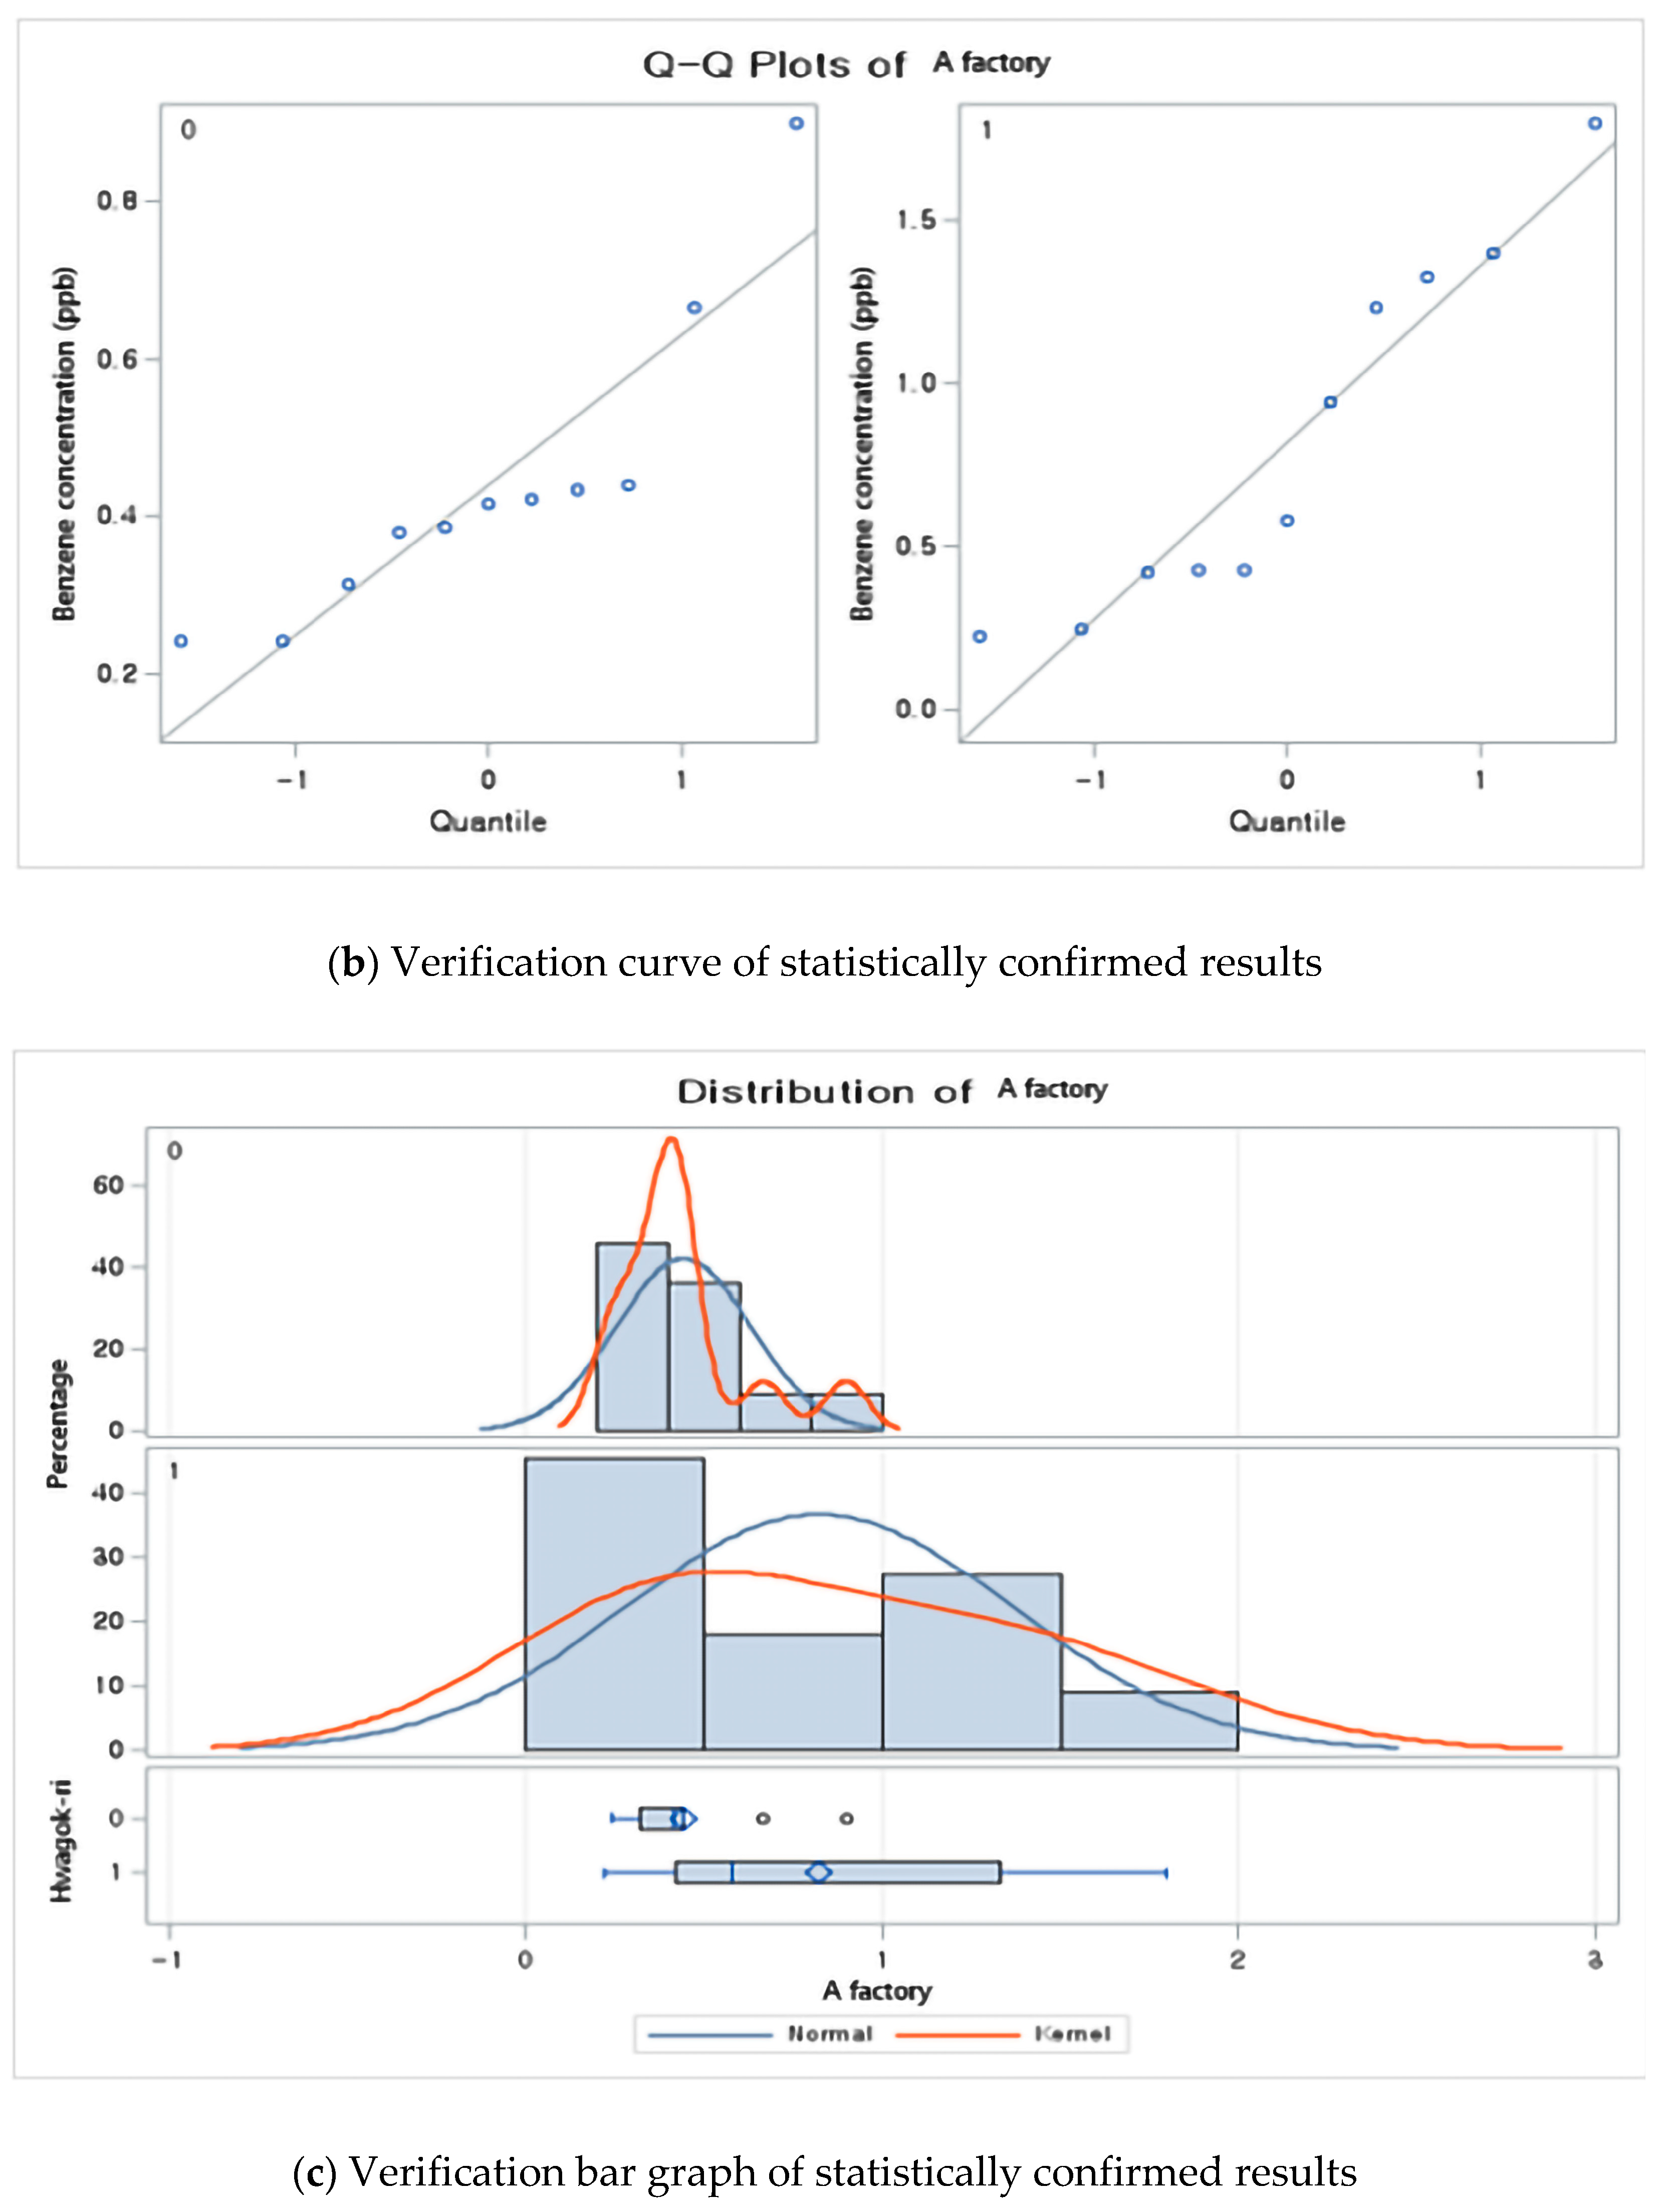
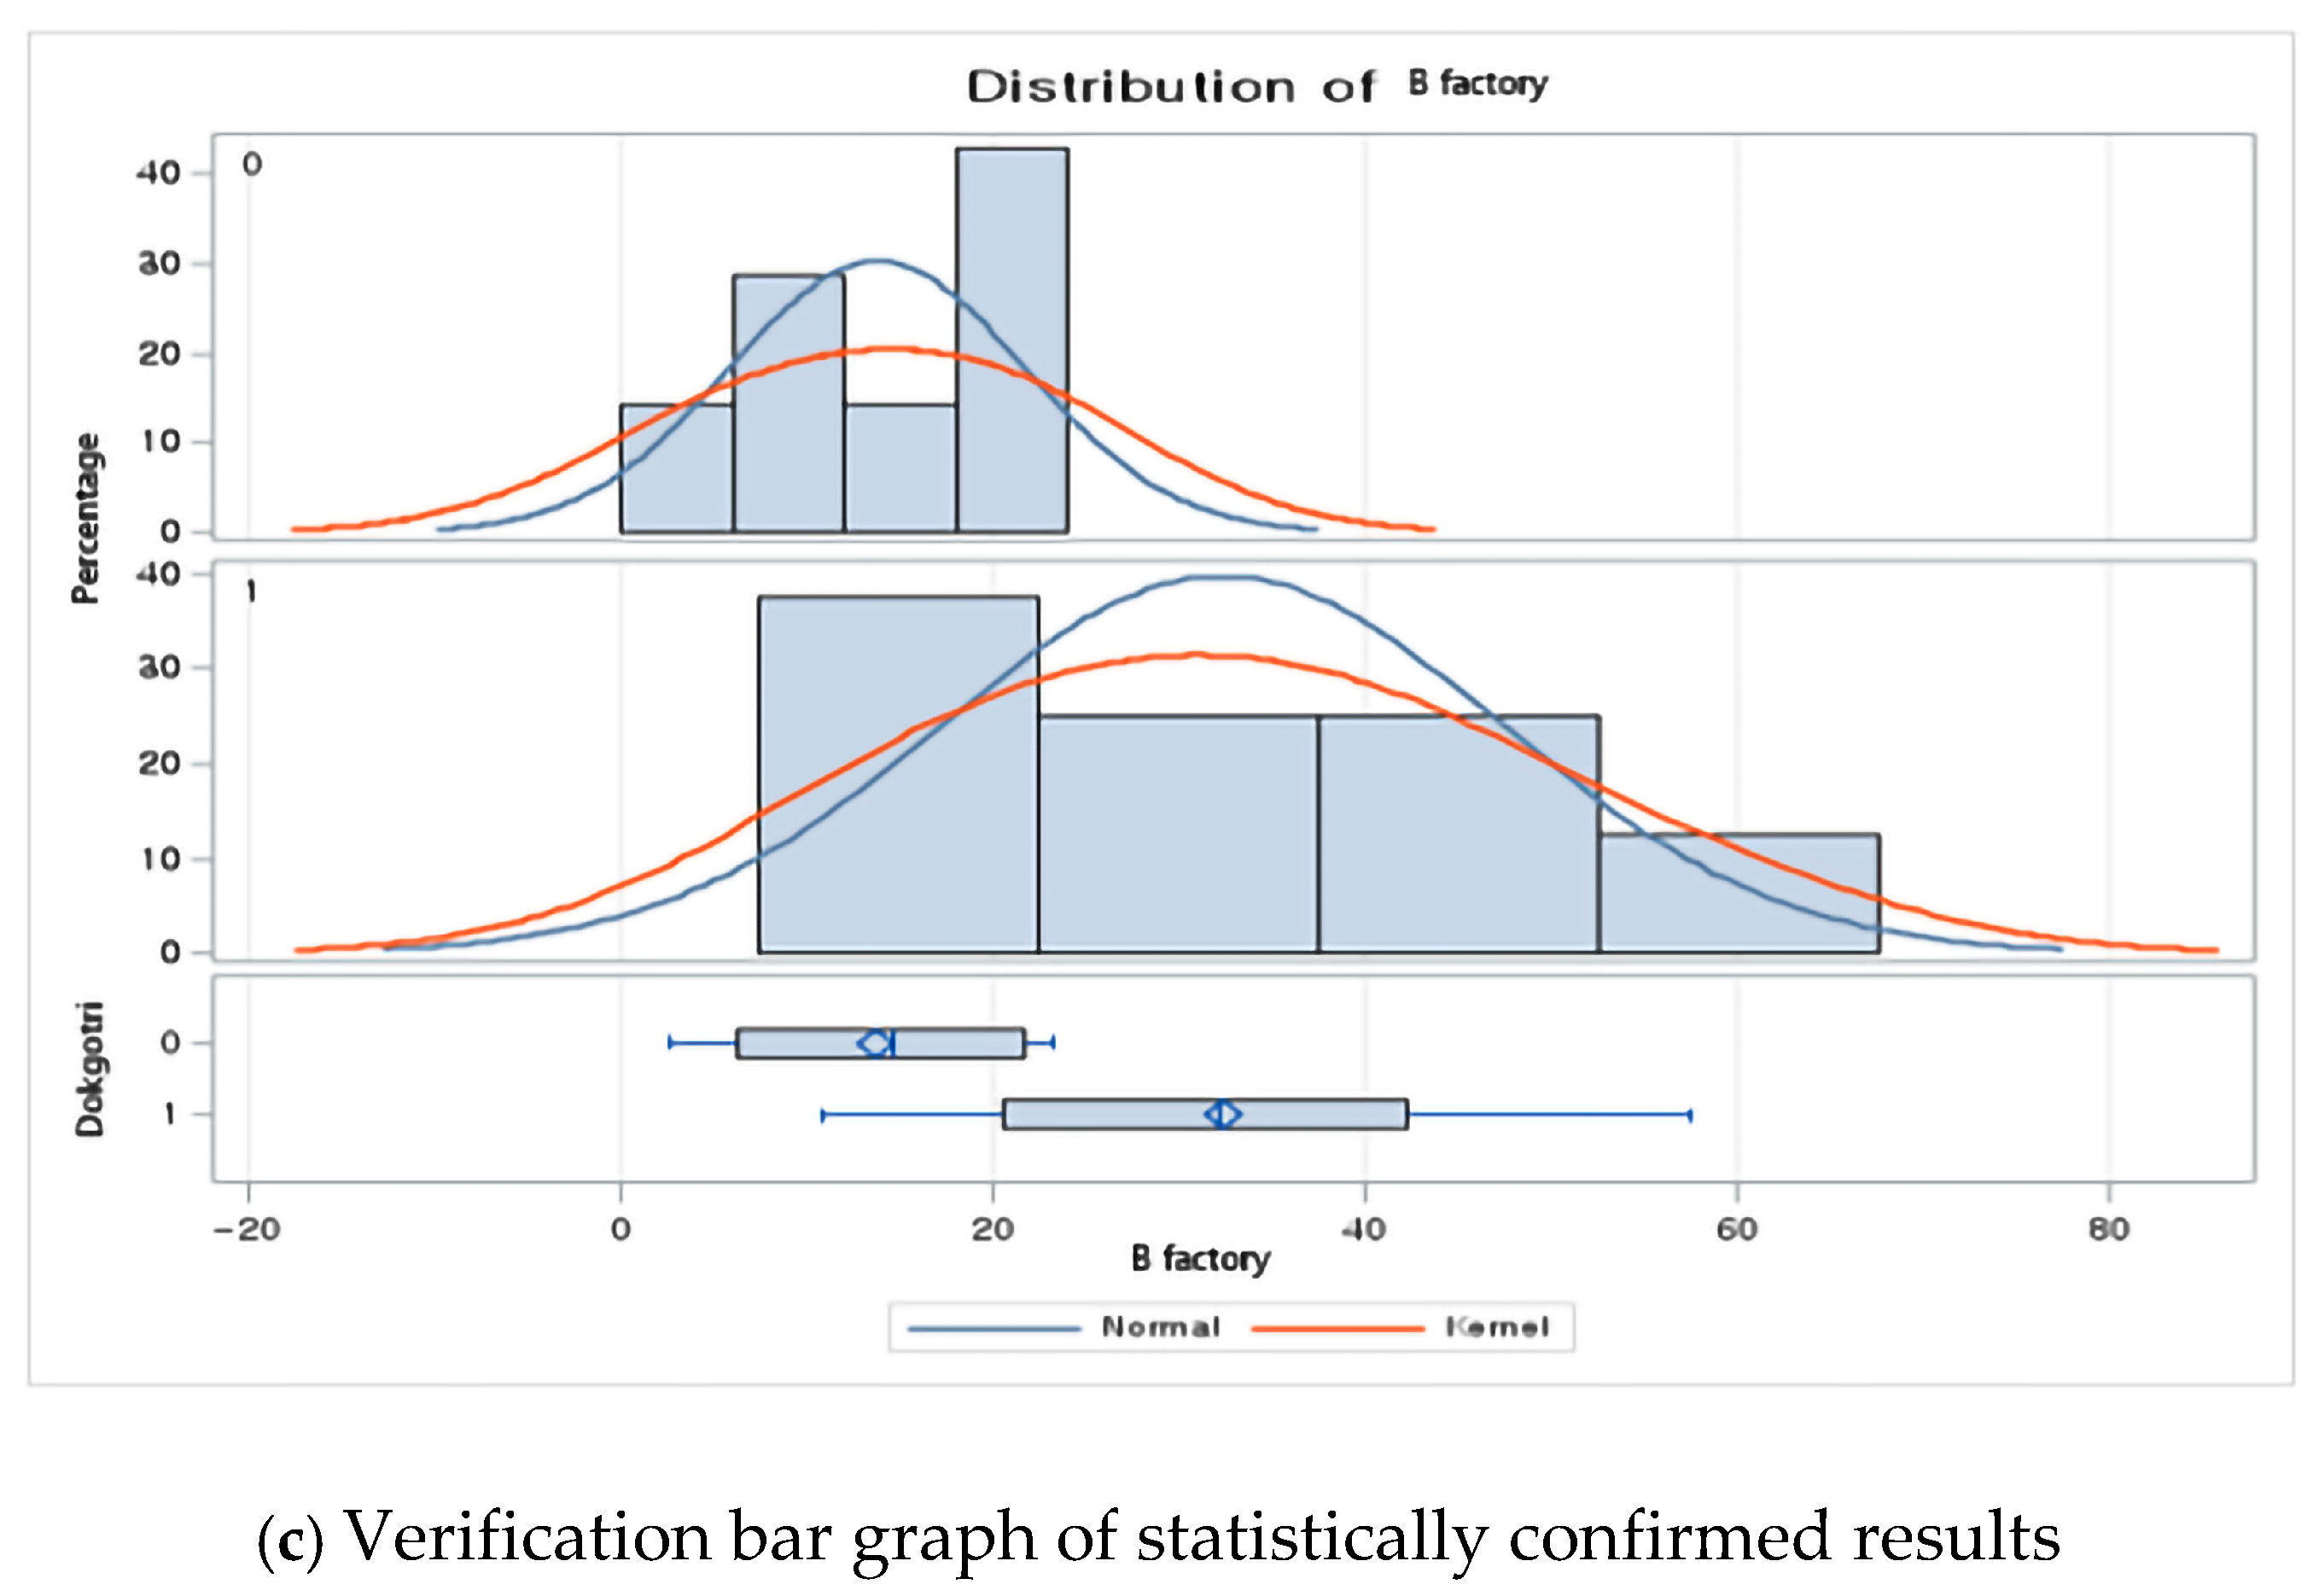
3.4. Results of Workplace Emissions Correlation and Contribution Priorities
4. Discussion
5. Conclusions
Funding
Institutional Review Board Statement
Informed Consent Statement
Data Availability Statement
Conflicts of Interest
References
- Lee, K.H.; Moon, C.S.; Woo, K.S.; Kang, T.S.; Chung, E.K.; Son, B.S. Simultaneous exposure to heavy metals among residents in the industrial complex: Korean national cohort study. Int. J. Environ. Res. Public Health 2015, 12, 5905–5917. [Google Scholar] [CrossRef] [PubMed]
- Kim, S.Y.; Park, E.J.; Song, S.H.; Lee, C.W.; Kwon, J.T.; Park, E.Y.; Kim, B.M. Toluene concentrations in the blood and risk of thyroid cancer among residents living near national industrial complexes in South Korea: A population-based cohort study. Environ. Int. 2021, 146, 106304. [Google Scholar] [CrossRef]
- Rondinelli, D.A.; Vastag, G. Assessing South Korea’s Globalization Strategy and the International Competitiveness of the Seoul Metropolitan Area. Compet. Change 1997, 2, 299–329. [Google Scholar] [CrossRef]
- Bae, S.H.; Choi, J.H.; Kim, G.B.; Song, S.H.; Ha, M.A.; Kwon, H.J. Evaluation of the exposure to environmental pollutants emanating from national industrial complexes. Environ. Health Toxicol. 2018, 33, e2018007. [Google Scholar] [CrossRef]
- Sung, J.H.; Oh, I.B.; Kim, A.R.; Lee, J.H.; Sim, C.S.; Yoo, C.I.; Park, S.J.; Kim, G.B.; Kim, Y.H. Environmental and body concentrations of heavy metals at sites near and distant from industrial complexes in Ulsan, Korea. J. Korean Med. Sci. 2018, 33, e33. [Google Scholar] [CrossRef] [PubMed]
- Lee, J.T.; Shin, D.C.; Chung, Y. Air pollution and daily mortality in Seoul and Ulsan, Korea. Environ. Health Perspect. 1999, 107, 149–154. [Google Scholar] [CrossRef] [PubMed]
- Alyasi, H.S.; Isaifan, R. A review on pollution emissions and impact from waste treatment and disposal facilities. J. Environ. Toxicol. Stud. 2018, 2, 1–9. [Google Scholar] [CrossRef]
- Mohammed, A.S.; Kapri, A.; Goel, R. Heavy metal pollution: Source, impact, and remedies. In Biomanagement of Metal-Contaminated Soils; Springer: Dordrecht, The Netherlands, 2011; pp. 1–28. [Google Scholar] [CrossRef]
- Chukwuemekaa, I.S.; Njoku, V.O.; Arinze, C.; Chizoruo, I.F.; Blessing, E.N. A review: Effects of air, water and land dumpsite on human health and analytical methods for determination of pollutants. Anal. Methods Environ. Chem. J. 2021, 4, 80–106. [Google Scholar] [CrossRef]
- Harrison, R.M.; Yin, J. Particulate matter in the atmosphere: Which particle properties are important for its effects on health? Sci. Total Environ. 2000, 249, 85–101. [Google Scholar] [CrossRef]
- Hsu, C.Y.; Chiang, H.C.; Chen, M.J.; Chuang, C.Y.; Tsen, C.M.; Fang, G.C.; Tsai, Y.I.; Chen, N.T.; Lin, T.Y.; Lin, S.L.; et al. Ambient PM2.5 in the residential area near industrial complexes: Spatiotemporal variation, source apportionment, and health impact. Sci. Total Environ. 2017, 590, 204–214. [Google Scholar] [CrossRef]
- Neuparth, T.; Moreira, S.M.; Santos, M.M.; Reis-Henriques, M.A. Review of oil and HNS accidental spills in Europe: Identifying major environmental monitoring gaps and drawing priorities. Mar. Pollut. Bull. 2012, 64, 1085–1095. [Google Scholar] [CrossRef] [PubMed]
- Gray, W.B.; Shimshack, J.P. The effectiveness of environmental monitoring and enforcement: A review of the empirical evidence. Rev. Environ. Econ. Policy 2011, 5, 3–24. [Google Scholar] [CrossRef]
- Guttikunda, S.K.; Goel, R.; Pant, P. Nature of air pollution, emission sources, and management in the Indian cities. Atmos. Environ. 2014, 95, 501–510. [Google Scholar] [CrossRef]
- Chithra, V.S.; Nagendra, S.M.S. Chemical and morphological characteristics of indoor and outdoor particulate matter in an urban environment. Atmos. Environ. 2013, 77, 579–587. [Google Scholar] [CrossRef]
- Dholakia, H.H.; Purohit, P.; Rao, S.; Garg, A. Impact of current policies on future air quality and health outcomes in Delhi, India. Atmos. Environ. 2013, 75, 241–248. [Google Scholar] [CrossRef]
- Kim, K.H.; Lee, J.H.; Jang, M.S. Metals in airborne particulate matter from the first and second industrial complex area of Taejon city, Korea. Environ. Pollut. 2002, 118, 41–51. [Google Scholar] [CrossRef]
- Choi, G.H.; Kang, C.H.; Lee, J.H.; Kim, J.Y.; Youn, Y.H.; Lee, S.R. The chemical composition of fine and coarse particles in relation with the Asian Dust events. Atmos. Environ. 2003, 37, 753–765. [Google Scholar] [CrossRef]
- Ho, K.F.; Lee, S.C.; Chan, C.K.; Yu, J.C.; Chow, J.C.; Yao, X.H. Characterization of chemical species in PM2. 5 and PM10 aerosols in Hong Kong. Atmos. Environ. 2003, 37, 31–39. [Google Scholar] [CrossRef]
- Kim, N.S.; Lee, B.K. National estimates of blood lead, cadmium, and mercury levels in the Korean general adult population. Epidemiology 2011, 22, S247. [Google Scholar] [CrossRef]
- Guohao, L.; Wei, W.; Shao, X.; Nie, L.; Wang, H.; Yan, X.; Zhang, R. A comprehensive classification method for VOC emission sources to tackle air pollution based on VOC species reactivity and emission amounts. J. Environ. Sci. 2018, 67, 78–88. [Google Scholar] [CrossRef]
- Watson, J.G.; Chow, J.C.; Fujita, E.M. Review of volatile organic compound source apportionment by chemical mass balance. Atmos. Environ. 2001, 35, 1567–1584. [Google Scholar]
- Wei, W.; Cheng, S.; Li, G.; Wang, G.; Wang, H. Characteristics of volatile organic compounds (VOCs) emitted from a petroleum refinery in Beijing, China. Atmos. Environ. 2014, 89, 358–366. [Google Scholar] [CrossRef]
- Hsu, C.Y.; Chiang, H.C.; Shie, R.H.; Ku, C.H.; Lin, T.Y.; Chen, M.J.; Chen, N.T.; Chen, Y.C. Ambient VOCs in residential areas near a large-scale petrochemical complex: Spatiotemporal variation, source apportionment and health risk. Environ. Pollut. 2018, 240, 95–104. [Google Scholar] [CrossRef]
- Hwang, I.J.; Lee, T.J.; Kim, T.O.; Bae, G.N. Characteristics of air pollutant emissions and distribution for particulate matter concentration of air pollution networks in Gyeongsangbuk-do. J. Korean Soc. Atmos. Environ. 2021, 37, 536–551. [Google Scholar] [CrossRef]
- Hwang, I.J.; Kim, T.O. Chemical characteristics of ambient PM2. 5 at industrial complex in Gyeongbuk area. J. Korean Soc. Atmos. Environ. 2019, 35, 336–345. [Google Scholar] [CrossRef]
- Civan, M.Y.; Elbir, T.; Seyfioglu, R.; Kuntasal, Ö.O.; Bayram, A.; Doğan, G.; Yurdakul, S.; Andiç, Ö.; Müezzinoğlu, A.; Sofuoglu, S.C.; et al. Spatial and temporal variations in atmospheric VOCs, NO2, SO2, and O3 concentrations at a heavily industrialized region in Western Turkey, and assessment of the carcinogenic risk levels of benzene. Atmos. Environ. 2015, 103, 102–113. [Google Scholar] [CrossRef]
- Cai, C.; Geng, F.; Tie, X.; Yu, Q.; An, J. Characteristics and source apportionment of VOCs measured in Shanghai, China. Atmos. Environ. 2010, 44, 5005–5014. [Google Scholar] [CrossRef]
- Geng, F.; Tie, X.; Xu, J.; Zhou, G.; Peng, L.; Gao, W.; Tang, X.; Zhao, C. Characterizations of ozone, NOx, and VOCs measured in Shanghai, China. Atmos. Environ. 2008, 42, 6873–6883. [Google Scholar] [CrossRef]
- Guo, H.; Wang, T.; Simpson, I.J.; Blake, D.R.; Yu, X.M.; Kwok, Y.H.; Li, Y.S. Source contributions to ambient VOCs and CO at a rural site in eastern China. Atmos. Environ. 2004, 38, 4551–4560. [Google Scholar] [CrossRef]
- Wen, M.; Deng, W.; Huang, J.; Zhang, S.; Lin, Q.; Wang, C.; Ma, S.; Wang, W.; Zhang, X.; Li, G.; et al. Atmospheric VOCs in an industrial coking facility and the surrounding area: Characteristics, spatial distribution and source apportionment. J. Environ. Sci. 2024, 138, 660–670. [Google Scholar] [CrossRef]
- Kim, S.H.; Seo, D.J.; Kim, H.R.; Park, J.H.; Lee, K.W.; Bae, S.J.; Song, H.M. Estimation and Analysis of VOCs Emissions from Painting and Printing Facilities in Industrial Complexes of Gwangju. J. Environ. Sci. Int. 2020, 29, 479–494. [Google Scholar] [CrossRef]
- Kim, M.H.; Kim, S.M. Estimation of air pollutant emissions by tractor utilization in Korea. Agriculture 2023, 13, 1811. [Google Scholar] [CrossRef]
- To, T.; Zhu, J.; Larsen, K.; Simatovic, J.; Feldman, L.; Ryckman, K.; Gershon, A.; Lougheed, M.D.; Licskai, C.; Chen, H.; et al. Progression from asthma to chronic obstructive pulmonary disease. Is air pollution a risk factor? Am. J. Respir. Crit. Care Med. 2016, 194, 429–438. [Google Scholar] [CrossRef]
- Fisher, J.E.; Loft, S.; Ulrik, C.S.; Raaschou-Nielsen, O.; Hertel, O.; Tjønneland, A.; Overvad, K.; Nieuwenhuijsen, M.J.; Andersen, Z.J. Physical activity, air pollution, and the risk of asthma and chronic obstructive pulmonary disease. Am. J. Respir. Crit. Care Med. 2016, 194, 855–865. [Google Scholar] [CrossRef] [PubMed]
- Lin, Y.C.; Zhang, Y.L.; Song, W.; Yang, X.; Fan, M.Y. Specific sources of health risks caused by size-resolved PM-bound metals in a typical coal-burning city of northern China during the winter haze event. Sci. Total Environ. 2020, 734, 138651. [Google Scholar] [CrossRef] [PubMed]
- Oge, M.; Ozkan, D.; Celik, M.B.; Gok, M.S.; Karaoglanli, A.C. An overview of utilization of blast furnace and steelmaking slag in various applications. Mater. Today Proc. 2019, 11, 516–525. [Google Scholar] [CrossRef]
- Fang, G.C.; Lin, S.J.; Chang, S.Y.; Chou, C.C.K. Effect of typhoon on atmospheric particulates in autumn in central Taiwan. Atmos. Environ. 2009, 43, 6039–6048. [Google Scholar] [CrossRef]
- Hsu, C.Y.; Chiang, H.C.; Lin, S.L.; Chen, M.J.; Lin, T.Y.; Chen, Y.C. Elemental characterization and source apportionment of PM10 and PM2.5 in the western coastal area of central Taiwan. Sci. Total Environ. 2016, 541, 1139–1150. [Google Scholar] [CrossRef]
- Braubach, M.; Jacobs, D.E.; Ormamdy, D. Environmental Burden of Disease Associated with Inadequate Housing: A Method Guide to the Quantification of Health Effects of Selected Housing Risks in the WHO European Region. World Health Organization. Regional Office for Europe, 2011. Available online: https://iris.who.int/handle/10665/108587 (accessed on 1 January 2011).
- Raw, M.; Anderson, P.; Batra, A.; Dubois, G.; Harrington, P.; Hirsch, A.; Houezec, J.L.; McNeill, A.; Milner, D.; Poetschke, L.; et al. WHO Europe evidence based recommendations on the treatment of tobacco dependence. Tob. Control 2002, 11, 44. [Google Scholar] [CrossRef]
- Zhong, M.; Wang, T.; Zhao, W.; Huang, J.; Wang, B.; Blaney, L.; Bu, Q.; Yu, G. Emerging organic contaminants in Chinese surface water: Identification of priority pollutants. Engineering 2022, 11, 111–125. [Google Scholar] [CrossRef]
- Eom, S.Y.; Choi, J.H.; Bae, S.H.; Lim, J.A.; Kim, G.B.; Yu, S.D.; Kim, Y.H.; Lim, H.S.; Son, B.S.; Paek, D.Y.; et al. Health effects of environmental pollution in population living near industrial complex areas in Korea. Environ. Health Toxicol. 2018, 33, e2018004. [Google Scholar] [CrossRef] [PubMed]
- Bae, S.H.; Kim, H.C.; Ye, B.j.; Choi, W.J.; Hong, Y.S.; Ha, M.A. Causal inference in environmental epidemiology. Environ. Health Toxicol. 2017, 32, e2017015. [Google Scholar] [CrossRef] [PubMed]
- Kelly, F.J.; Fussell, J.C. Improving indoor air quality, health and performance within environments where people live, travel, learn and work. Atmos. Environ. 2019, 200, 90–109. [Google Scholar] [CrossRef]
- Hooper, L.G.; Kaufman, J.D. Ambient air pollution and clinical implications for susceptible populations. Ann. Am. Thorac. Soc. 2018, 15, S64–S68. [Google Scholar] [CrossRef]
- O’Neill, M.S.; Breton, C.V.; Devlin, R.B.; Utell, M.J. Air pollution and health: Emerging information on susceptible populations. Air Qual. Atmos. Health 2012, 5, 189–201. [Google Scholar] [CrossRef]
- Bravo, M.A.; Son, J.; Freitas, C.U.; Gouveia, N.; Bell, M.L. Air pollution and mortality in São Paulo, Brazil: Effects of multiple pollutants and analysis of susceptible populations. J. Expo. Sci. Environ. Epidemiol. 2016, 26, 150–161. [Google Scholar] [CrossRef] [PubMed]
- Lee, H.j.; Park, S.U.; Mayer, H.l. Statistical characteristics of air quality index DAQx*-specific air pollutants differentiated by types of air quality monitoring stations: A case study of Seoul, Republic of Korea. Sustainability 2023, 15, 8599. [Google Scholar] [CrossRef]
- Hussam, A.; Alauddin, M.; Khan, A.H.; Chowdhury, D.; Bibi, H.; Bhattacharjee, M.; Sultana, S. Solid phase microextraction: Measurement of volatile organic compounds (VOCs) in Dhaka city air pollution. J. Environ. Sci. Health Part A 2002, 37, 1223–1239. [Google Scholar] [CrossRef]
- Choi, J.Y.; Kim, S.Y.; Kim, T.k.; Lee, C.w.; Kim, S.j.; Chung, H.m. Ambient air pollution and the risk of neurological diseases in residential areas near multi-purposed industrial complexes of korea: A population-based cohort study. Environ. Res. 2023, 219, 115058. [Google Scholar] [CrossRef]
- Brown, S.G.; Eberly, S.; Paatero, P.; Norris, G.A. Methods for estimating uncertainty in PMF solutions: Examples with ambient air and water quality data and guidance on reporting PMF results. Sci. Total Environ. 2015, 518, 626–635. [Google Scholar] [CrossRef]
- Baek, S.O.; Choi, J.S.; Hwang, S.M. A quantitative estimation of source contributions to the concentrations of atmospheric suspended particulate matter in urban, suburban, and industrial areas of Korea. Environ. Int. 1997, 23, 205–213. [Google Scholar] [CrossRef]
- Saraga, D.E.; Maggos, T.E.; Sfetsos, A.; Tolis, E.I.; Andronopoulos, S.; Bartzis, J.G.; Vasilakos, C. PAHs sources contribution to the air quality of an office environment: Experimental results and receptor model (PMF) application. Air Qual. Atmos. Health 2010, 3, 225–234. [Google Scholar] [CrossRef]
- Su, Y.C.; Chen, W.H.; Fan, C.L.; Tong, Y.H.; Weng, T.H.; Chen, S.P.; Kuo, C.P.; Wang, J.L.; Chang, J.S. Source apportionment of volatile organic compounds (VOCs) by positive matrix factorization (PMF) supported by model simulation and source markers using petrochemical emissions as a showcase. Environ. Pollut. 2019, 254, 112848. [Google Scholar] [CrossRef]
- Saeedi, M.; Malekmohammadi, B.; Tajalli, S. Interaction of benzene, toluene, ethylbenzene, and xylene with human’s body: Insights into characteristics, sources and health risks. J. Hazard. Mater. Adv. 2024, 16, 100459. [Google Scholar] [CrossRef]
- Liao, Q.; Du, R.; Ma, R.; Liu, X.; Yan, Z.; Zhang, Z.; Ji, P.; Xiao, M.; Cui, Y.; Xing, X.; et al. Association between exposure to a mixture of benzene, toluene, ethylbenzene, xylene, and styrene (BTEXS) and small airways function: A cross-sectional study. Environ. Res. 2022, 212, 113488. [Google Scholar] [CrossRef]
- Bahadar, H.; Mostafalou, S.; Abdollahi, M. Current understandings and perspectives on non-cancer health effects of benzene: A global concern. Toxicol. Appl. Pharmacol. 2014, 276, 83–94. [Google Scholar] [CrossRef]


| Parameter | Condition | ||||
|---|---|---|---|---|---|
| Column | HP-INNOWAX (60 m × 0.25 mm I.D × 0.25 μm, filmthickness) | ||||
| Carrier Gas flow | He at 0.9 mL/min. | ||||
| Injection mode | Split (5:1) | ||||
| Injection volume | 2 μL | ||||
| Injection port temp | 250 °C | ||||
| Transferline temp | 260 °C | ||||
| Oven temp. program | initial temp (°C) | initial time (min) | rate (°C/min) | temp (°C) | time (min) |
| 35 | 0 | 5 | 190 | 0 | |
| 30 | 250 | 3 | |||
| Modeling Period | WRF Modeling | 1 January 2021 (UTC+09)–1 January 2021 (UTC+09) |
| CALMET/CALPUFF Modeling | 1 January 2021 (UTC+09)–1 January 2021 (UTC+09) |
| Contents (Item) | Details | |
| Modeling Area (30 km × 30 km) | ||
| Grid origin (Reference Point) | UTM-X (km) | 254.123 |
| UTM-Y (km) | 4082.131 | |
| Grid spacing (ΔX) (m) | 300 | |
| Domain Size | Nx (No. of x grid Cells) | 100 |
| Ny (No. of y grid Cells) | 100 | |
| Projection | Universal Transverse Mercator (UTM) | |
| UTM zone | 52 (Northern) | |
| No. of Vertical layers | 8 | |
| Cell face heights (m) | 0, 20, 50, 100, 200, 300, 500, 1000, 3000 | |
| Bias | −1, −1, −1, −0.8, 0, 0.5, 1, 1 | |
| Time zone | UTC+0900 | |
| Hwagok-ri | N | Business Site A (Red Left) | |
|---|---|---|---|
| Mean ± S.D. | Pr > |t| | ||
| Average High | 11 | 0.82 ± 0.46 | 0.0403 |
| Average Low | 11 | 0.44 ± 0.31 | |
| Dokgotri | N | Business Site B (Red Right) | |
|---|---|---|---|
| Mean ± S.D. | Pr > |t| | ||
| Average High | 8 | 32.29 ± 19.73 | 0.0115 |
| Average Low | 7 | 13.79 ± 6.47 | |
| Control Area | Exposed Area | * p-Value | |||
|---|---|---|---|---|---|
| Low | Medium | High | |||
| Total (people) | 21,636 | 7222 | 4212 | ||
| Gender | Man | 11,874 (54.88) | 3884 (53.78) | 2380 (56.51) | 0.01826 |
| Female | 9762 (45.12) | 3338 (46.22) | 1832 (43.49) | ||
| Age (years) | Average | 30.00 ± 19.85 | 29.22 ± 20.10 | 32.13 ± 21.07 | 0.00001 |
| under 20 years old | 6938 (32.07) | 2576 (35.67) | 1216 (28.87) | 0.00001 | |
| 20–39 years old | 8152 (37.68) | 2418 (33.48) | 1512 (35.90) | ||
| 40–64 years old | 5144 (23.78) | 1786 (24.73) | 1094 (25.97) | ||
| 65 years or older | 1402 (6.48) | 442 (6.12) | 390 (9.26) | ||
| ** Income quartile, n (%) | 1st quartile | 4548 (21.39) | 830 (11.62) | 844 (20.26) | 0.00001 |
| 2nd quartile | 5268 (28.53) | 996 (13.94) | 1038 (24.92) | ||
| 3rd quartile | 5918 (28.53) | 1274 (17.83) | 1160 (27.84) | ||
| quartile | 5012 (24.16) | 4044 (56.61) | 1124 (26.98) | ||
| Control Area | Exposed Area | * p-Value | |||
|---|---|---|---|---|---|
| Low (3) | Medium (2) | High (1) | |||
| Acute upper respiratory infections (J00–J06) | 13,796 | 4318 | 2842 | ||
| Number of subjects (persons, %) | No | 2386 (17.29) | 684 (15.84) | 564 (19.85) | p > 0.0001 |
| Result of occurrence | Yes | 11,410 (82.71) | 3634 (84.16) | 564 (19.85) | |
| Other diseases of upper respiratory tract (J30–J39) | 20,488 | 6734 | 4032 | ||
| Number of subjects (persons, %) | No | 13,018 (63.54) | 4132 (61.36) | 2532 (62.80) | 0.0056 |
| Result of occurrence | Yes | 7470 (36.46) | 2602 (38.64) | 1500 (37.20) | |
| Other acute lower respiratory infections (J20–J22) | 15,280 | 4628 | 3132 | ||
| Number of subjects (persons, %) | No | 3140 (20.55) | 980 (21.18) | 704 (22.48) | 0.0489 |
| Result of occurrence | Yes | 12,140 (79.45) | 3648 (78.82) | 2428 (77.52) | |
| Chronic lower respiratory diseases (J40–J47) | 20,860 | 6900 | 4062 | ||
| Number of subjects (persons, %) | No | 12,624 (60.52) | 4350 (63.04) | 2618 (64.45) | p > 0.0001 |
| Result of occurrence | Yes | 8236 (39.48) | 2550 (36.96) | 1444 (35.55) | |
| Asthma (J45) | 20,772 | 6894 | 4036 | ||
| Number of subjects (persons, %) | No | 16,930 (81.50) | 5660 (82.10) | 3292 (81.57) | 0.5363 |
| Result of occurrence | Yes | 3842 (18.50) | 1234 (17.90) | 744 (18.43) | |
| Control Area | Exposed Area | * p-Value | |||
|---|---|---|---|---|---|
| Low (3) | Medium (2) | High (1) | |||
| Chronic rhinitis (J31) | 18,602 | 5974 | 3666 | ||
| Number of subjects (persons, %) | No | 5694 (30.61) | 1702 (28.49) | 1106 (30.17) | 0.00798 |
| Result of occurrence | Yes | 12,908 (69.39) | 4272 (71.51) | 2560 (69.83) | |
| Diseases of the respiratory system (J00–J99) | 10,290 | 3024 | 2138 | ||
| Number of subjects (persons, %) | No | 644 (6.26) | 154 (5.09) | 168 (7.86) | 0.00028 |
| Result of occurrence | Yes | 9646 (93.74) | 2870 (94.91) | 1970 (92.14) | |
| Cough (R05) | 21,538 | 7194 | 4196 | ||
| Number of subjects (persons, %) | No | 20,126 (93.44) | 6740 (93.69) | 3954 (94.23) | 0.1518 |
| Result of occurrence | Yes | 1412 (6.56) | 454 (6.31) | 242 (5.77) | |
| Chemical | Factor1 | Contribution Ratio | Factor2 | Contribution Ratio | Factor3 | Contribution Ratio | Factor4 | Contribution Ratio | Factor5 | Contribution Ratio | Factor6 | Contribution Ratio |
|---|---|---|---|---|---|---|---|---|---|---|---|---|
| Vinylchloride | 0.000 | 0.0 | 0.000 | 0.0 | 0.000 | 0.0 | 0.000 | 0.0 | 0.377 | 2.7 | 0.003 | 0.0 |
| Benzene | 4.843 | 36.4 | 3.568 | 9.2 | 0.762 | 23.1 | 1.254 | 20.9 | 2.656 | 19.2 | 0.000 | 0.0 |
| Toluene | 0.000 | 0.0 | 14.918 | 38.5 | 0.000 | 0.0 | 0.000 | 0.0 | 2.566 | 18.5 | 10.482 | 47.0 |
| Ethylbenzene | 0.837 | 6.3 | 0.427 | 1.1 | 0.878 | 26.6 | 0.067 | 1.1 | 0.883 | 6.4 | 0.013 | 0.1 |
| P-xylene | 0.980 | 7.4 | 0.000 | 0.0 | 0.000 | 0.0 | 0.196 | 3.3 | 0.005 | 0.0 | 0.363 | 1.6 |
| M-xylene | 0.000 | 0.0 | 0.434 | 1.1 | 0.000 | 0.0 | 1.487 | 24.7 | 0.430 | 3.1 | 0.272 | 1.2 |
| Tvocs | 6.658 | 50.0 | 19.374 | 50.0 | 1.657 | 50.3 | 3.004 | 50.0 | 6.922 | 50.0 | 11.147 | 50.0 |
Disclaimer/Publisher’s Note: The statements, opinions and data contained in all publications are solely those of the individual author(s) and contributor(s) and not of MDPI and/or the editor(s). MDPI and/or the editor(s) disclaim responsibility for any injury to people or property resulting from any ideas, methods, instructions or products referred to in the content. |
© 2025 by the author. Licensee MDPI, Basel, Switzerland. This article is an open access article distributed under the terms and conditions of the Creative Commons Attribution (CC BY) license (https://creativecommons.org/licenses/by/4.0/).
Share and Cite
Kim, H.-H. The Direct Effects of Air Pollutant Exposure from Industrial Complexes on Chronic Respiratory Diseases in Local Residents: A Population-Based Cohort Study. Int. J. Environ. Res. Public Health 2025, 22, 666. https://doi.org/10.3390/ijerph22050666
Kim H-H. The Direct Effects of Air Pollutant Exposure from Industrial Complexes on Chronic Respiratory Diseases in Local Residents: A Population-Based Cohort Study. International Journal of Environmental Research and Public Health. 2025; 22(5):666. https://doi.org/10.3390/ijerph22050666
Chicago/Turabian StyleKim, Ho-Hyun. 2025. "The Direct Effects of Air Pollutant Exposure from Industrial Complexes on Chronic Respiratory Diseases in Local Residents: A Population-Based Cohort Study" International Journal of Environmental Research and Public Health 22, no. 5: 666. https://doi.org/10.3390/ijerph22050666
APA StyleKim, H.-H. (2025). The Direct Effects of Air Pollutant Exposure from Industrial Complexes on Chronic Respiratory Diseases in Local Residents: A Population-Based Cohort Study. International Journal of Environmental Research and Public Health, 22(5), 666. https://doi.org/10.3390/ijerph22050666