
Work-Related Musculoskeletal Disorder Prevalence by Body Area Among Nurses in Asia: Systematic Review and Meta-Analysis


Abstract
1. Introduction
2. Materials and Methods
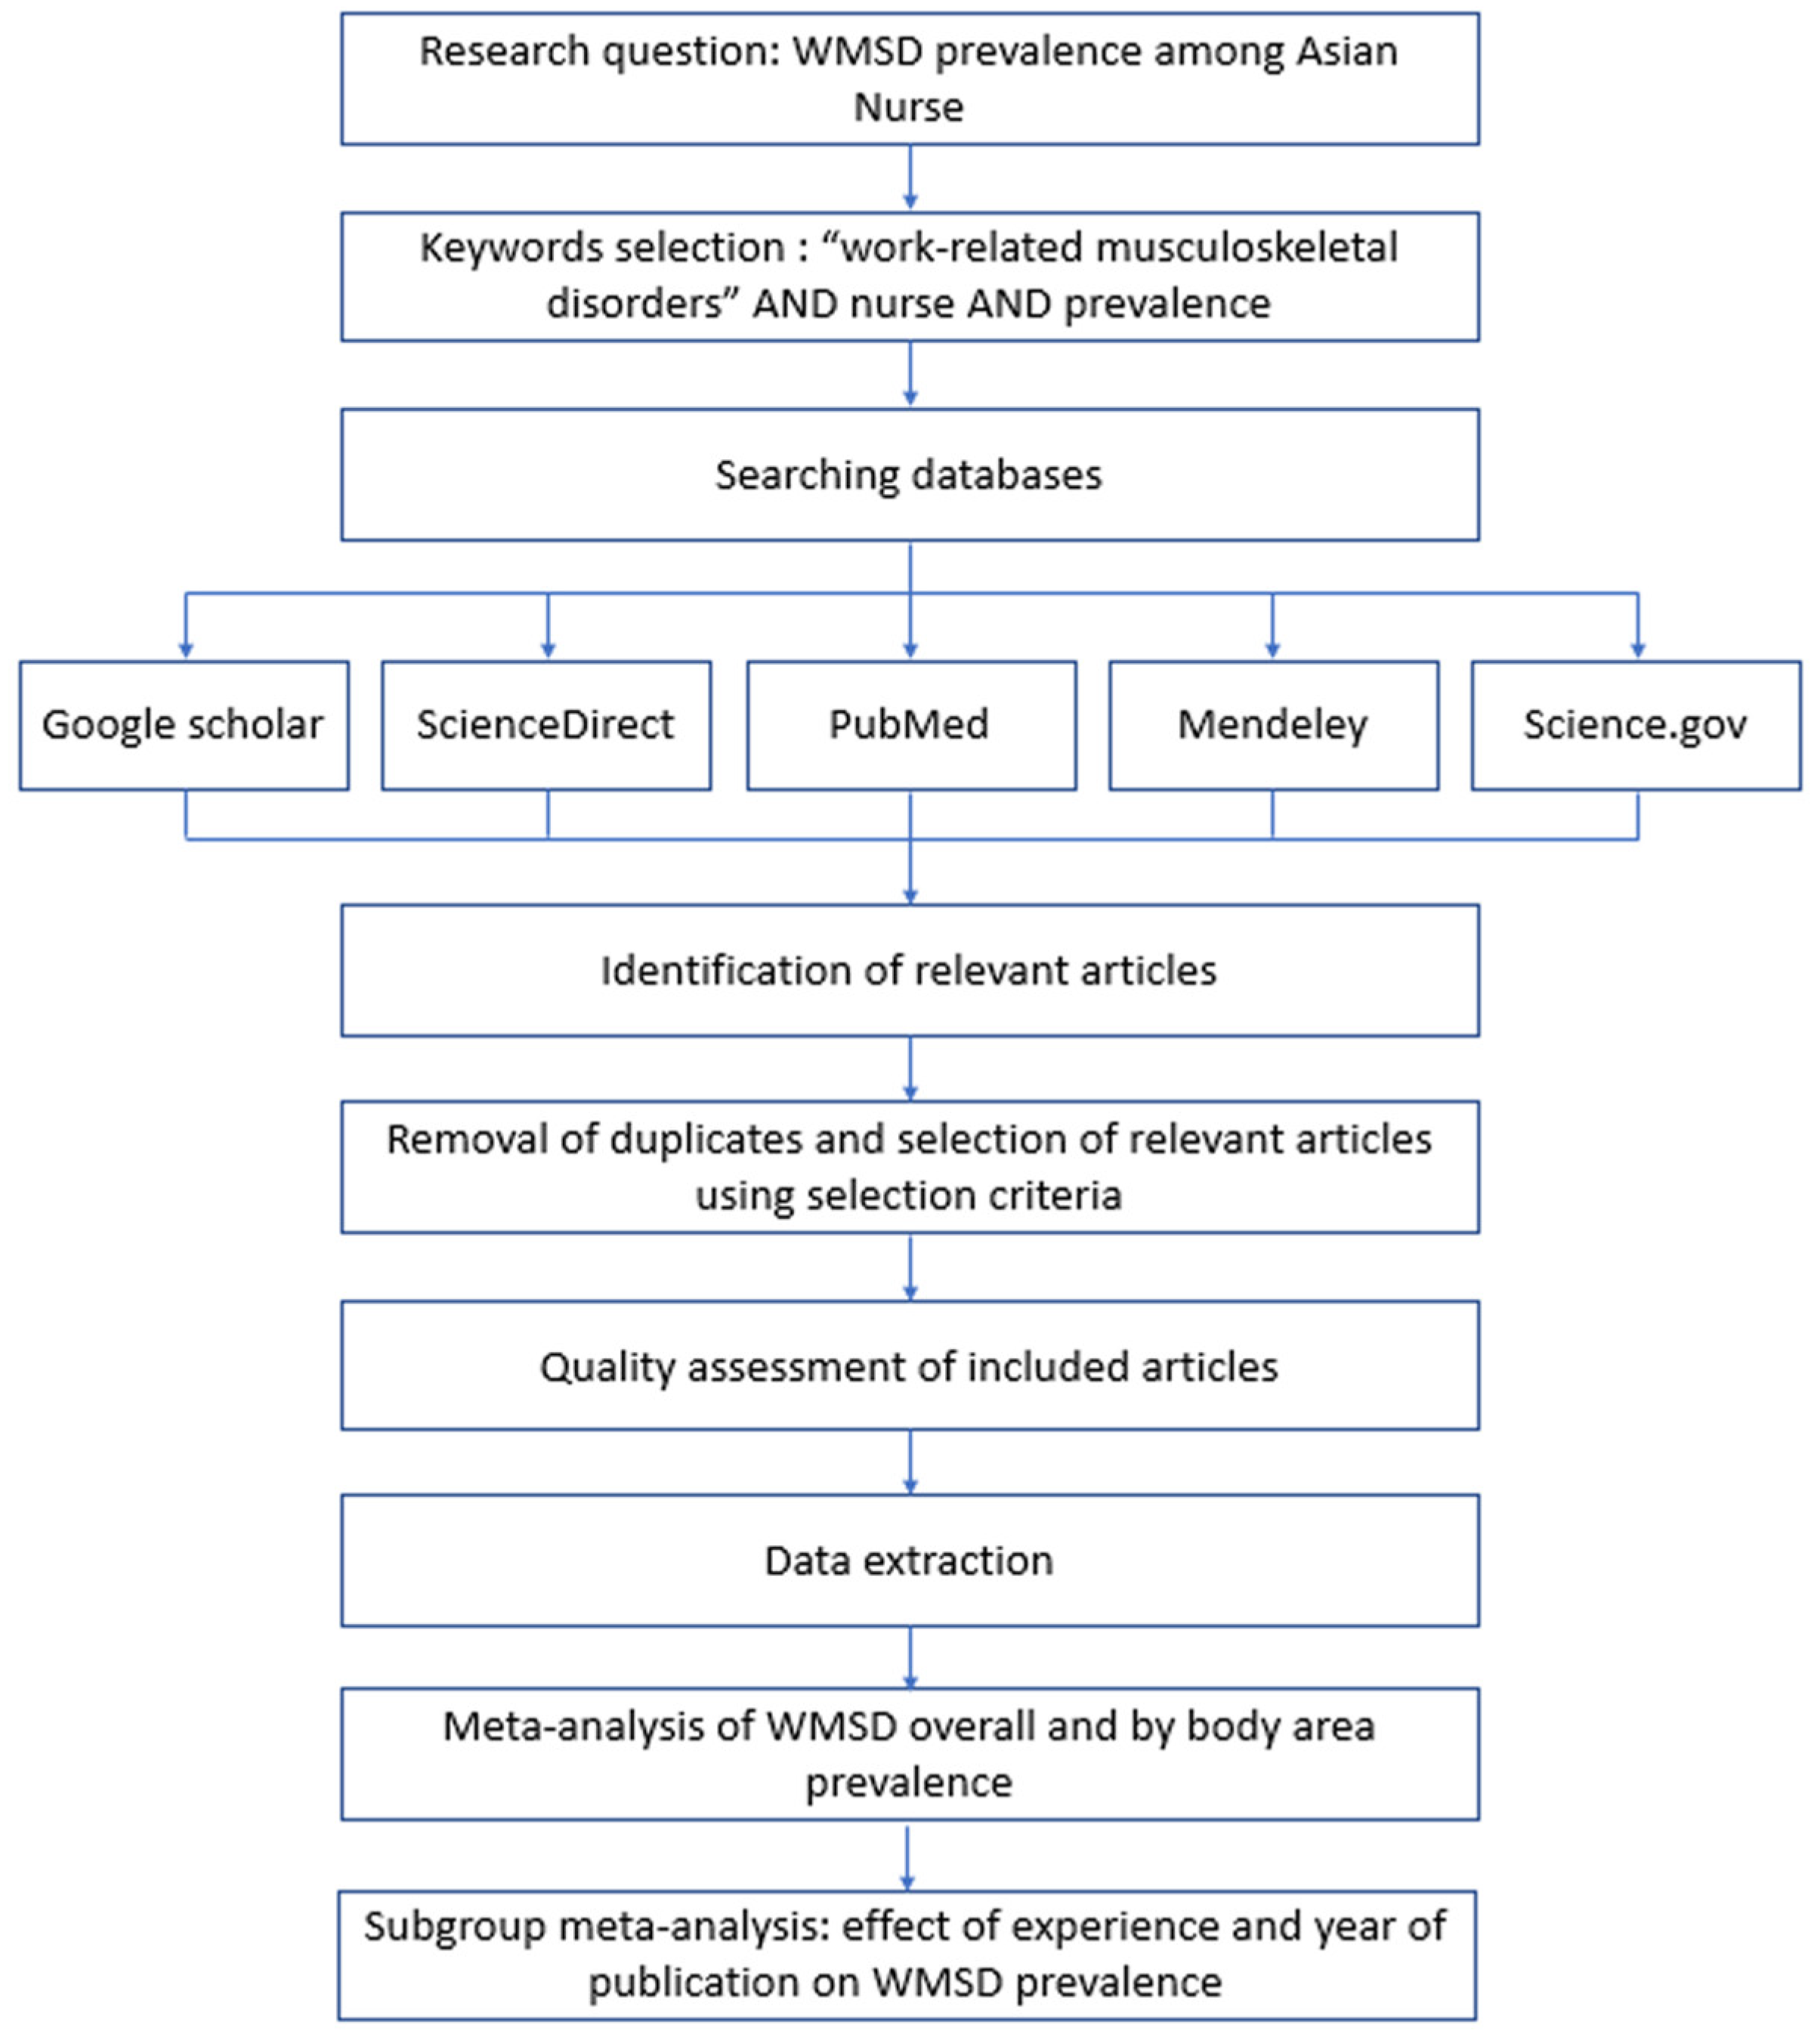
2.1. Search Strategy
2.2. Quality Assessment
2.3. Data Extraction
2.4. Statistical Analysis
3. Results
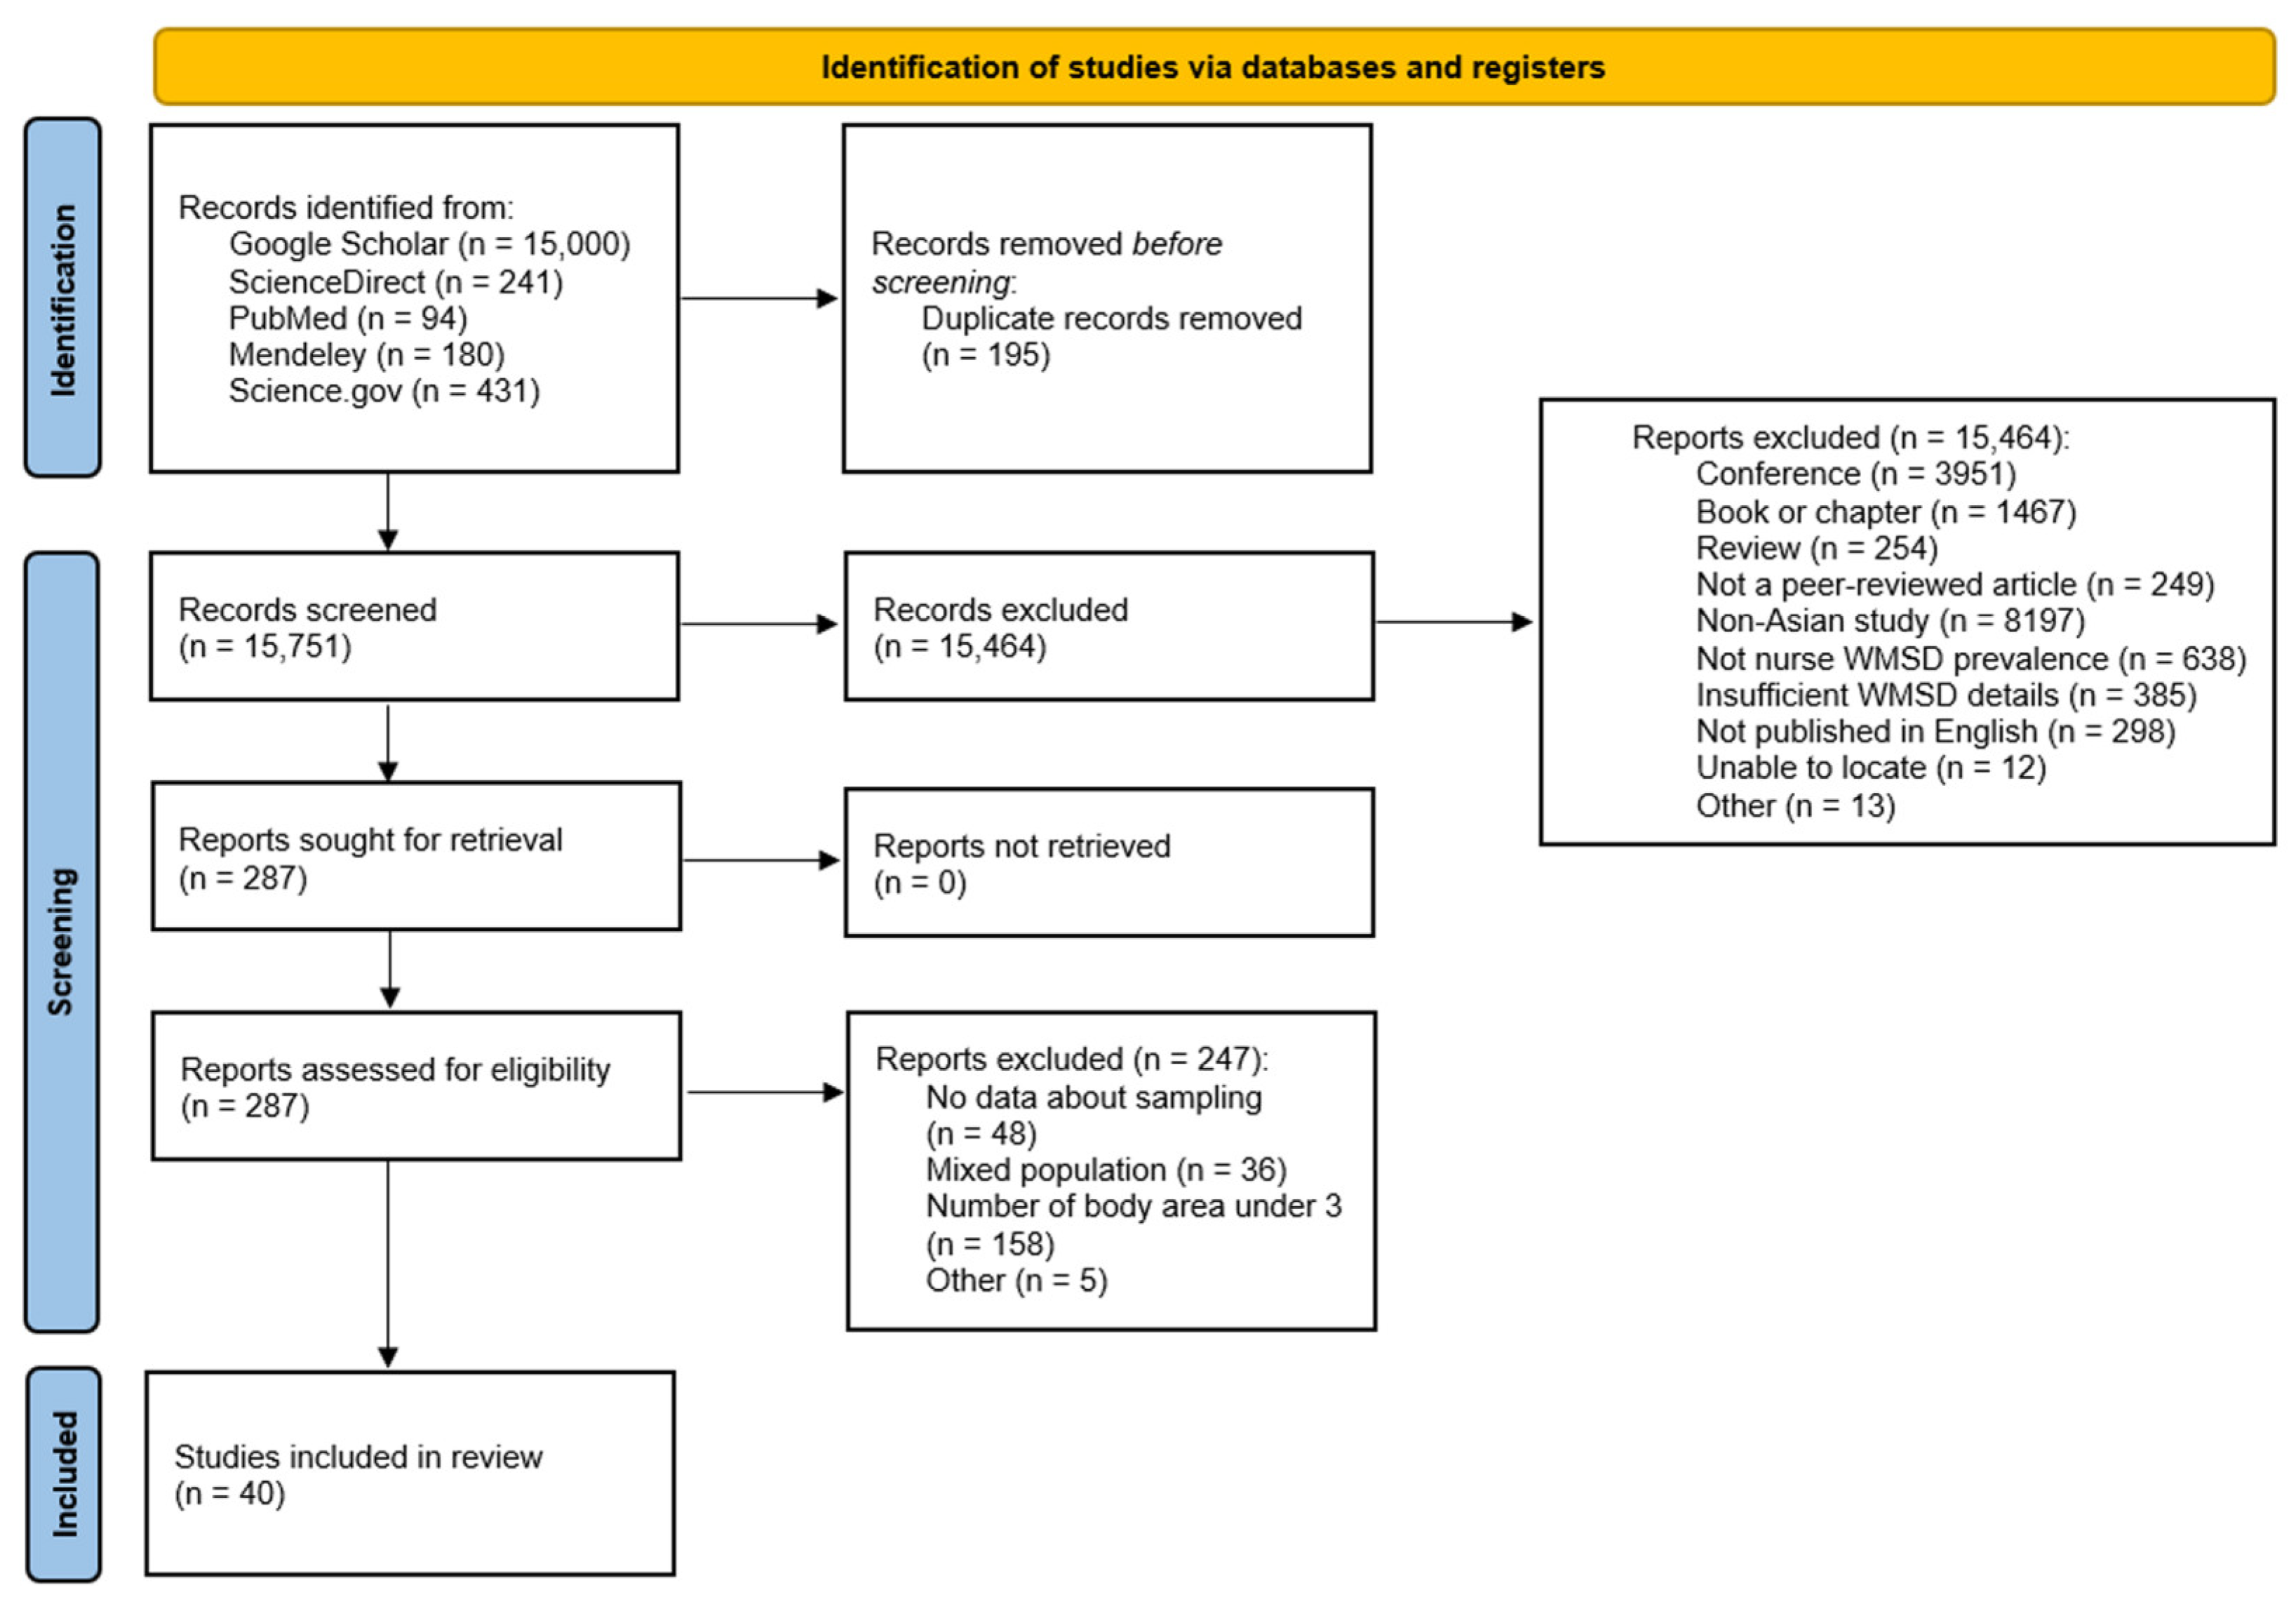
3.1. Search Results
3.2. Quality Appraisal
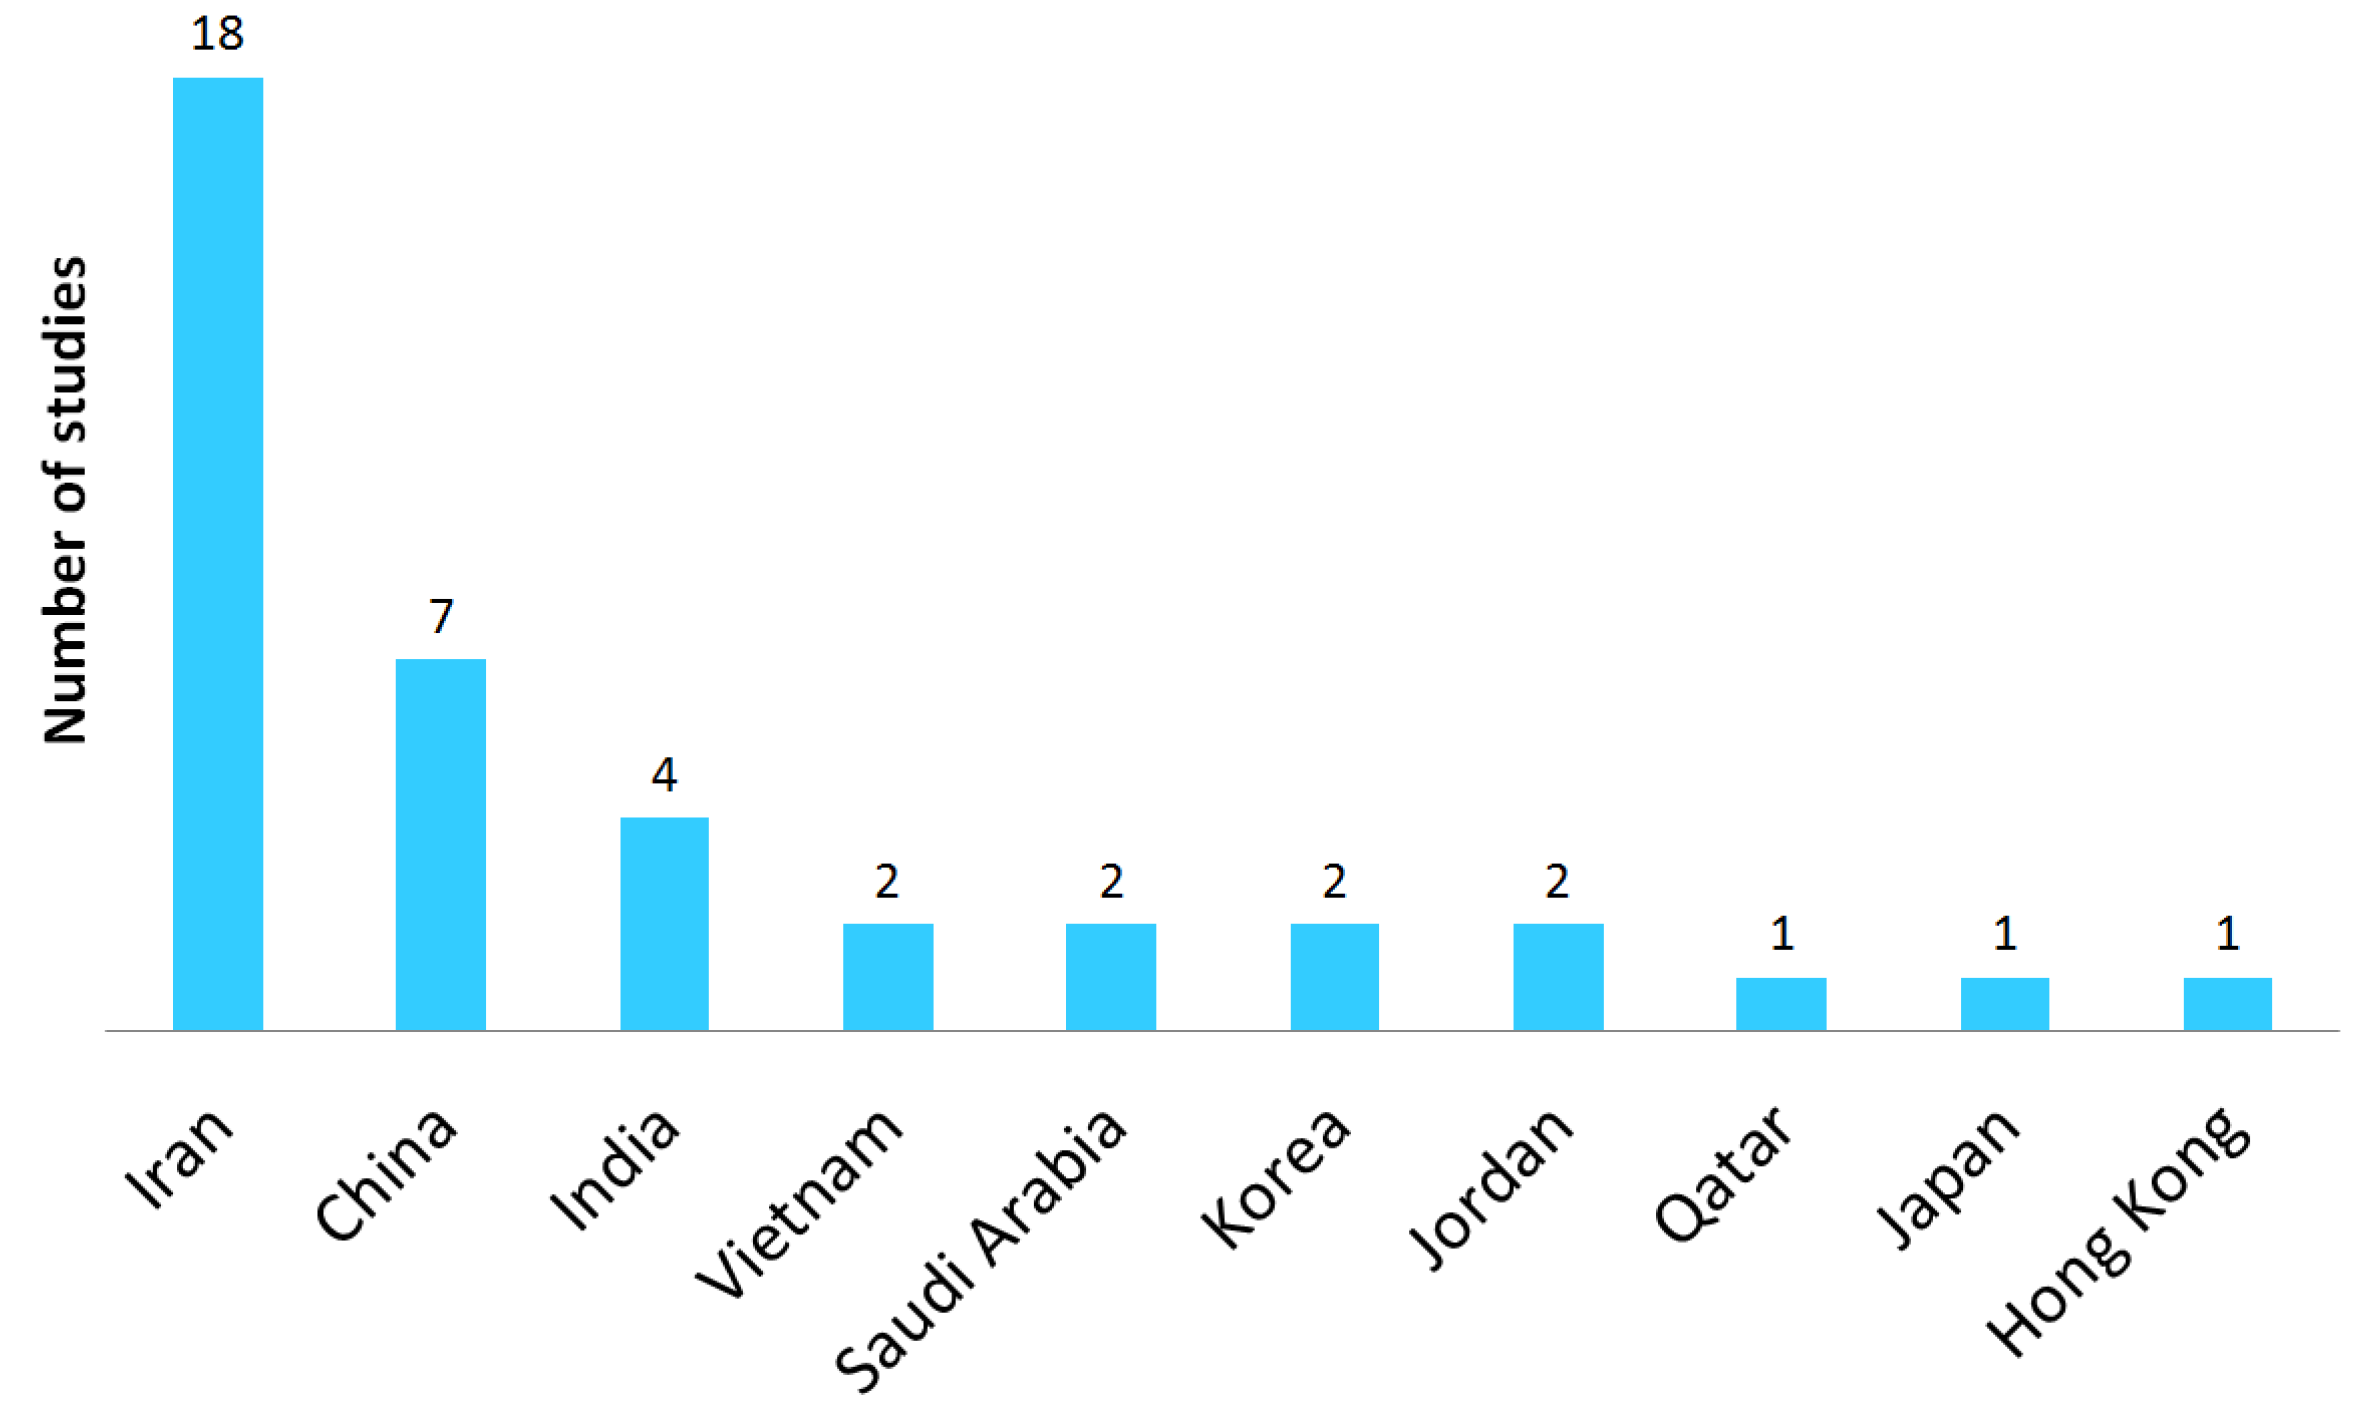
3.3. Study Characteristics

| 1. Were the Aims/Objectives of the Study Clear? | 2. Was the Study Design Appropriate for the Stated Aim(s)? | 3. Was the Sample Size Justified? | 4. Was the Target/Reference Population Clearly Defined? (Is It Clear Who the Research Was About?) | 5. Was the Sample Frame Taken from an Appropriate Population Base so That It Closely Represented the Target/Reference Population Under Investigation? | 6. Was the Selection Process Likely to Select Subjects/Participants that Were Representative of the Target/Reference Population Under Investigation? | 7. Were Measures Undertaken to Address and Categorize Non-Responders? | 8. Were the Risk Factors and Outcome Variables Measured Appropriate to the Aims of the Study? | 9. Were the Risk Factors and Outcome Variables Measured Correctly Using Instruments/Measurements that Had been Trialed, Piloted or Published Previously? | 10. Is It Clear What was Used to Determined Statistical Significance and/or Precision Estimates? (e.g., p Values, CIs) | 11. Were the Methods (Including Statistical Methods) Sufficiently Described to Enable Them to Be Repeated? | 12. Were the Basic Data Adequately Described? | 13. Does the Response Rate Raise Concerns About Non-Response Bias? | 14. If Appropriate, Was Information About Non-Responders Described? | 15. Were the Results Internally Consistent? | 16. Were the Results for the Analyses Described in the Methods Presented? | 17. Were the Authors’ Discussions and Conclusions Justified by the Results? | 18. Were the Limitations of the Study Discussed? | 19. Were there Any Funding Sources or Conflicts of Interest that May Have Affected the Authors’ Interpretation of the Results? | 20. Was Ethical Approval or the Consent of Participants Attained? | Yes | No | Yes (%) | Risk of Bias | |
|---|---|---|---|---|---|---|---|---|---|---|---|---|---|---|---|---|---|---|---|---|---|---|---|---|
| Abedini et al., 2013 [31] | Yes | Yes | Yes | Yes | Yes | Yes | No | Yes | Yes | Yes | Yes | Yes | No | NA | Yes | Yes | Yes | No | No | Yes | 15 | 4 | 84% | Low |
| Akbari et al., 2017 [32] | Yes | Yes | Yes | Yes | Yes | Yes | No | Yes | Yes | Yes | Yes | Yes | No | NA | Yes | Yes | Yes | Yes | No | Yes | 16 | 3 | 89% | Low |
| Almhdawi et al., 2020 [55] | Yes | Yes | Yes | Yes | Yes | Yes | No | Yes | Yes | Yes | Yes | Yes | No | NA | Yes | Yes | Yes | Yes | No | Yes | 16 | 3 | 89% | Low |
| Almhdawi et al., 2021 [17] | Yes | Yes | Yes | Yes | Yes | Yes | No | Yes | Yes | Yes | Yes | Yes | No | NA | Yes | Yes | Yes | No | No | Yes | 15 | 4 | 84% | Low |
| Anap et al., 2013 [10] | Yes | Yes | Yes | Yes | Yes | Yes | No | Yes | Yes | No | Yes | Yes | No | NA | Yes | Yes | Yes | No | No | Yes | 14 | 5 | 79% | Medium |
| Arsalani et al., 2014 [33] | Yes | Yes | No | Yes | Yes | Yes | No | Yes | Yes | Yes | Yes | Yes | No | NA | Yes | Yes | Yes | Yes | No | Yes | 15 | 4 | 84% | Low |
| Asghari et al., 2019 [34] | Yes | Yes | Yes | Yes | Yes | Yes | No | Yes | Yes | Yes | Yes | Yes | No | NA | Yes | Yes | Yes | No | No | Yes | 15 | 4 | 84% | Low |
| Attar, 2014 [58] | Yes | Yes | Yes | Yes | Yes | Yes | No | Yes | Yes | Yes | Yes | Yes | No | NA | Yes | Yes | Yes | No | No | Yes | 15 | 4 | 84% | Low |
| Attarchi et al., 2014 [35] | Yes | Yes | No | Yes | Yes | Yes | No | Yes | Yes | Yes | Yes | Yes | No | NA | Yes | Yes | Yes | No | No | Yes | 14 | 5 | 79% | Medium |
| Barzideh et al., 2013 [36] | Yes | Yes | Yes | Yes | Yes | Yes | No | Yes | Yes | Yes | Yes | Yes | No | NA | Yes | Yes | Yes | No | No | Yes | 15 | 4 | 84% | Low |
| Behera et al., 2023 [52] | Yes | Yes | No | Yes | Yes | Yes | No | Yes | Yes | Yes | Yes | Yes | No | NA | Yes | Yes | Yes | Yes | No | Yes | 15 | 4 | 84% | Low |
| Chandralekha et al., 2022 [53] | Yes | Yes | Yes | Yes | Yes | Yes | No | Yes | Yes | Yes | Yes | Yes | No | NA | Yes | Yes | Yes | Yes | No | Yes | 16 | 3 | 89% | Low |
| Choobineh et al., 2006 [13] | Yes | Yes | No | Yes | Yes | Yes | No | Yes | Yes | Yes | Yes | Yes | No | NA | Yes | Yes | Yes | No | No | Yes | 14 | 5 | 79% | Medium |
| Choobineh et al., 2010 [37] | Yes | Yes | No | Yes | Yes | Yes | No | Yes | Yes | Yes | Yes | Yes | No | NA | Yes | Yes | Yes | No | No | Yes | 14 | 5 | 79% | Medium |
| Dhas et al., 2023 [61] | Yes | Yes | Yes | Yes | Yes | Yes | No | Yes | Yes | Yes | Yes | Yes | No | NA | Yes | Yes | Yes | Yes | No | Yes | 16 | 3 | 89% | Low |
| Farrokhi et al., 2016 [38] | Yes | Yes | No | Yes | Yes | Yes | No | Yes | Yes | Yes | Yes | Yes | No | NA | Yes | Yes | Yes | No | No | Yes | 14 | 5 | 79% | Medium |
| Goswami et al., 2013 [54] | Yes | Yes | No | Yes | Yes | Yes | No | Yes | Yes | No | Yes | Yes | No | NA | Yes | Yes | Yes | No | No | Yes | 13 | 6 | 74% | Medium |
| Heidari et al., 2018 [39] | Yes | Yes | Yes | Yes | Yes | Yes | No | Yes | Yes | Yes | Yes | Yes | No | NA | Yes | Yes | Yes | Yes | No | Yes | 16 | 3 | 89% | Low |
| Heidari et al., 2019 [40] | Yes | Yes | Yes | Yes | Yes | Yes | No | Yes | Yes | Yes | Yes | Yes | No | NA | Yes | Yes | Yes | Yes | No | Yes | 16 | 3 | 89% | Low |
| Hou et al., 2006 [47] | Yes | Yes | No | Yes | Yes | Yes | No | Yes | Yes | Yes | Yes | Yes | No | NA | Yes | Yes | Yes | Yes | No | Yes | 15 | 4 | 84% | Low |
| Kee et al., 2007 [56] | Yes | Yes | No | Yes | Yes | Yes | No | Yes | Yes | Yes | Yes | Yes | No | NA | Yes | Yes | Yes | No | No | Yes | 14 | 5 | 79% | Medium |
| Lin et al., 2020 [19] | Yes | Yes | Yes | Yes | Yes | Yes | No | Yes | Yes | Yes | Yes | Yes | No | NA | Yes | Yes | Yes | Yes | No | Yes | 16 | 3 | 89% | Low |
| Mahmoudifar et al., 2017 [41] | Yes | Yes | No | Yes | Yes | Yes | No | Yes | Yes | Yes | Yes | Yes | No | NA | Yes | Yes | Yes | No | No | Yes | 14 | 5 | 79% | Medium |
| Mai et al., 2022 [60] | Yes | Yes | Yes | Yes | Yes | Yes | No | Yes | Yes | Yes | Yes | Yes | No | NA | Yes | Yes | Yes | Yes | No | Yes | 16 | 3 | 89% | Low |
| Mehrdad et al., 2010 [42] | Yes | Yes | No | Yes | Yes | Yes | No | Yes | Yes | Yes | Yes | Yes | No | NA | Yes | Yes | Yes | Yes | No | Yes | 15 | 4 | 84% | Low |
| Mirmohammadi et al., 2014 [43] | Yes | Yes | Yes | Yes | Yes | Yes | No | Yes | Yes | Yes | Yes | Yes | No | NA | Yes | Yes | Yes | No | No | Yes | 15 | 4 | 84% | Low |
| Nasiri-Ziba et al., 2017 [44] | Yes | Yes | No | Yes | Yes | Yes | No | Yes | Yes | Yes | Yes | Yes | No | NA | Yes | Yes | Yes | No | No | Yes | 14 | 5 | 79% | Medium |
| Nguyen et al., 2020 [16] | Yes | Yes | No | Yes | Yes | Yes | No | Yes | Yes | Yes | Yes | Yes | No | NA | Yes | Yes | Yes | Yes | No | Yes | 15 | 4 | 84% | Low |
| Pahlevan et al., 2014 [45] | Yes | Yes | No | Yes | Yes | Yes | No | Yes | Yes | Yes | Yes | Yes | No | NA | Yes | Yes | Yes | Yes | No | Yes | 15 | 4 | 84% | Low |
| Shafizadeh, 2011 [18] | Yes | Yes | No | Yes | Yes | Yes | No | Yes | Yes | Yes | Yes | Yes | No | NA | Yes | Yes | Yes | No | No | Yes | 14 | 5 | 79% | Medium |
| Smith et al., 2004 [48] | Yes | Yes | No | Yes | Yes | Yes | No | Yes | Yes | Yes | Yes | Yes | No | NA | Yes | Yes | Yes | No | No | Yes | 14 | 5 | 79% | Medium |
| Smith et al., 2004 [49] | Yes | Yes | No | Yes | Yes | Yes | No | Yes | Yes | Yes | Yes | Yes | No | NA | Yes | Yes | Yes | Yes | No | Yes | 15 | 4 | 84% | Low |
| Smith et al., 2005 [57] | Yes | Yes | No | Yes | Yes | Yes | No | Yes | Yes | Yes | Yes | Yes | No | NA | Yes | Yes | Yes | Yes | No | Yes | 15 | 4 | 84% | Low |
| Smith et al., 2006 [12] | Yes | Yes | No | Yes | Yes | Yes | No | Yes | Yes | Yes | Yes | Yes | No | NA | Yes | Yes | Yes | No | No | Yes | 14 | 5 | 79% | Medium |
| Taghinejad et al., 2016 [46] | Yes | Yes | No | Yes | Yes | Yes | No | Yes | Yes | Yes | Yes | Yes | No | NA | Yes | Yes | Yes | No | No | Yes | 14 | 5 | 79% | Medium |
| Tariah et al., 2020 [59] | Yes | Yes | No | Yes | Yes | Yes | No | Yes | Yes | No | Yes | Yes | No | NA | Yes | Yes | Yes | No | No | Yes | 13 | 6 | 74% | Medium |
| Yan et al., 2018 [50] | Yes | Yes | No | Yes | Yes | Yes | No | Yes | Yes | Yes | Yes | Yes | No | NA | Yes | Yes | Yes | Yes | No | Yes | 15 | 4 | 84% | Low |
| Yang et al., 2020 [51] | Yes | Yes | No | Yes | Yes | Yes | No | Yes | Yes | Yes | Yes | Yes | No | NA | Yes | Yes | Yes | Yes | No | Yes | 15 | 4 | 84% | Low |
| Yao et al., 2019 [11] | Yes | Yes | No | Yes | Yes | Yes | No | Yes | Yes | Yes | Yes | Yes | No | NA | Yes | Yes | Yes | Yes | No | Yes | 15 | 4 | 84% | Low |
| Yeung et al., 2005 [62] | Yes | Yes | No | Yes | Yes | Yes | No | Yes | Yes | Yes | Yes | Yes | No | NA | Yes | Yes | Yes | Yes | No | Yes | 15 | 4 | 84% | Low |
| Authors | Country | GDP (Billion USD) | N | Response Rate (%) | Male/Female (%) | Age (Year) | Experience (Year) | BMI | Nurse-to-Bed Ratio |
|---|---|---|---|---|---|---|---|---|---|
| Abedini et al., 2013 [31] | Iran | 401.5 | 400 | 100.0% | 10.2%/89.8% | 30.78 ± 6.44 | 6.92 ± 5.75 | 22.78 ± 2.97 | 1.33 |
| Akbari et al., 2017 [32] | Iran | 401.5 | 220 | 98.3% | 55.9%/44.1% | 34.69 ± 6.69 | 10.72 ± 6.09 | 21.74 ± 2.95 | 1.33 |
| Almhdawi et al., 2020 [55] | Jordan | 50.81 | 597 | 79.6% | 47.3%/52.7% | 32.1 ± 5.7 | 9.3 ± 5.4 | 25.1 ± 3.8 | 0.82 |
| Almhdawi et al., 2021 [17] | Jordan | 50.81 | 597 | 79.6% | 47.2%/52.8% | 32.1 ± 5.71 | 9.28 ± 5.41 | 25.1 ± 3.77 | 0.82 |
| Anap et al., 2013 [10] | India | 3500 | 228 | 89.1% | - | 31.4 | 11.5 | 24.06 | 0.6 |
| Arsalani et al., 2014 [33] | Iran | 401.5 | 520 | 92.0% | 20.6%/79.4% | 35.46 | 11.81 | - | 1.33 |
| Asghari et al., 2019 [34] | Iran | 401.5 | 147 | - | 19.7%/80.3% | 34.6 ± 6.6 | 11.2 ± 6.5 | 24.4 ± 2.9 | 1.33 |
| Attar, 2014 [58] | Saudi Arabia | 1068 | 200 | 100.0% | 4.5%/95.5% | 34.9 ± 8.1 | 7.8 | - | 3.03 |
| Attarchi et al., 2014 [35] | Iran | 401.5 | 454 | 80.6% | 24%/76% | 23.2 ± 6.1 | 8.5 ± 3.8 | 24.2 ± 4 | 1.33 |
| Barzideh et al., 2013 [36] | Iran | 401.5 | 385 | - | 81.8%/18.2% | 32.10 ± 7.3 | 8.4 ± 7.03 | - | 1.33 |
| Behera et al., 2023 [52] | India | 3500 | 173 | 70.2% | 0%/100% | 21 ± 1.4 | - | 21 ± 0.8 | 0.6 |
| Chandralekha et al., 2022 [53] | India | 3500 | 207 | - | 0%/100% | 27.7 ± 7.3 | 3.9 ± 4.8 | - | 0.6 |
| Choobineh et al., 2006 [13] | Iran | 401.5 | 641 | 100.0% | 15.3%/84.7% | 32.03 ± 8.02 | 8.71 ± 7.77 | 23.01 ± 3.29 | 1.33 |
| Choobineh et al., 2010 [37] | Iran | 401.5 | 375 | 80.0% | 33.6%/66.4% | 31.5 ± 8.4 | 8.6 ± 7.6 | 22.83 ± 3.35 | 1.33 |
| Dhas et al., 2023 [61] | Qatar | 213 | 127 | - | 0%/100% | 35.6 ± 6.12 | 13.0 ± 6.5 | - | 7.36 |
| Farrokhi et al., 2016 [38] | Iran | 401.5 | 250 | - | 19.2%/80.8% | 34.56 ± 6.63 | 10.3 ± 6.17 | 19.9 ± 2.5 | 1.33 |
| Goswami et al., 2013 [54] | India | 3500 | 40 | 100.0% | 4.5%/95.5% | 27.18 ± 4.1 | - | 22.16 ± 252 | 0.6 |
| Heidari et al., 2018 [39] | Iran | 401.5 | 300 | - | 29.7%/70.3% | 30.6 ± 4.4 | 12 | - | 1.33 |
| Heidari et al., 2019 [40] | Iran | 401.5 | 300 | 100.0% | 29.6%/70.3% | 37 | 12 | - | 1.33 |
| Hou et al., 2006 [47] | China | 17,790 | 3950 | 93.0% | 0%/100% | 27.63 | - | - | 0.8 |
| Kee et al., 2007 [56] | Korea | 1713 | 162 | 100.0% | 0%/100% | 29.9 ± 6.3 | 7.8 ± 6.0 | - | 0.76 |
| Lin et al., 2020 [19] | China | 17,790 | 1803 | 82.7% | 0.9%/99.1% | 36.63 ± 11.24 | 11.61 ± 9.33 | - | 0.8 |
| Mahmoudifar et al., 2017 [41] | Iran | 401.5 | 100 | - | 31%/69% | - | - | - | 1.33 |
| Mai et al., 2022 [60] | Vietnam | 429.7 | 225 | - | 10.7%/89.3% | 35.00 ± 6.39 | 11.9 | 20.51 | 0.44 |
| Mehrdad et al., 2010 [42] | Iran | 401.5 | 317 | 91.0% | 13.3%/86.7% | 33.7 ± 7.7 | 10.01 ± 7.6 | 23.26 ± 3.3 | 1.33 |
| Mirmohammadi et al., 2014 [43] | Iran | 401.5 | 120 | - | 33.6%/66.4% | - | - | - | 1.33 |
| Nasiri-Ziba et al., 2017 [44] | Iran | 401.5 | 133 | - | 22.6%/77.4% | 29.13 ± 6.8 | 5.84 ± 6 | 23.6 ± 2.7 | 1.33 |
| Nguyen et al., 2020 [16] | Vietnam | 429.7 | 1179 | 92.2% | 18.7%/81.3% | 32.5 ± 8.6 | 7.55 | - | 0.44 |
| Pahlevan et al., 2014 [45] | Iran | 401.5 | 286 | 89.0% | 25.9%/74.1% | 34.1 ± 7.5 | 7.3 ± 10.1 | - | 1.33 |
| Shafizadeh, 2011 [18] | Iran | 401.5 | 161 | 82.6% | 13%/87% | 34.9 | 9.32 | - | 1.33 |
| Smith et al., 2004 [48] | China | 17,790 | 282 | 92.0% | 0%/100% | 34.0 ± 9.2 | 13.8 ± 9.5 | - | 0.8 |
| Smith et al., 2004 [49] | China | 17,790 | 180 | 84.1% | 0%/100% | 32.7 ± 7.9 | - | - | 0.8 |
| Smith et al., 2005 [57] | Korea | 1713 | 330 | 97.9% | - | - | - | - | 0.76 |
| Smith et al., 2006 [12] | Japan | 4213 | 844 | 74.0% | - | 32.9 ± 8.8 | 10.0 ± 8.8 | - | 0.91 |
| Taghinejad et al., 2016 [46] | Iran | 401.5 | 135 | 90.0% | 41.5%/58.5% | 35.76 ± 8.34 | - | - | 1.33 |
| Tariah et al., 2020 [59] | Saudi Arabia | 1068 | 94 | 63.0% | 2.1%/97.9% | 34.7 | - | 24.12 ± 4.05 | 3.03 |
| Yan et al., 2018 [50] | China | 17,790 | 1973 | 90.4% | 2.1%/97.9% | 30.73 ± 6.58 | 9.01 ± 7.03 | 20.6 ± 3.11 | 0.8 |
| Yang et al., 2020 [51] | China | 17,790 | 679 | 70.7% | 11.5%/88.5% | 28.2 ± 4.5 | 6.6 ± 5.0 | - | 0.8 |
| Yao et al., 2019 [11] | China | 17,790 | 692 | 86.5% | 5.3%/94.7% | 28.3 | 6.9 | - | 0.8 |
| Yeung et al., 2005 [62] | Hong Kong | 392.1 | 97 | 100.0% | 0%/100% | 35.0 ± 7.0 | 13.5 ± 7.1 | - | 1.61 |
| Total | - | 19,903 | 88.3 ± 10.3% | 13.3%/86.7% | 31.3 ± 3.4 | 9.4 ± 2.0 | 22.5 ± 1.8 | 1.29 ± 1.14 |
| Authors | Country | N | WMSD Prevalence by Body Area | WMSD Overall Prevalence | ||||||||
|---|---|---|---|---|---|---|---|---|---|---|---|---|
| Neck | Upper Back | Lower Back | Shoulders | Elbows | Wrists | Hips | Knees | Ankles | ||||
| Abedini et al., 2013 [31] | Iran | 400 | 42.2% | 38.8% | 71.5% | 42.0% | 21.0% | 64.5% | 16.5% | 35.5% | 68.2% | 88.2% |
| Akbari et al., 2017 [32] | Iran | 220 | 50.0% | 42.7% | 69.1% | 45.0% | 31.8% | 38.2% | 32.7% | 42.7% | 29.0% | 79.5% |
| Almhdawi et al., 2020 [55] | Jordan | 597 | 77.4% | 22.3% | 37.5% | 28.5% | 91.0% | |||||
| Almhdawi et al., 2021 [17] | Jordan | 597 | 61.1% | 47.2% | 46.7% | 13.9% | 27.3% | 91.0% | ||||
| Anap et al., 2013 [10] | India | 228 | 31.1% | 10.5% | 48.2% | 34.6% | 1.9% | 1.6% | 29.0% | 7.6% | 81.0% | |
| Arsalani et al., 2014 [33] | Iran | 520 | 27.0% | 40.0% | 35.0% | 88.0% | ||||||
| Asghari et al., 2019 [34] | Iran | 147 | 44.9% | 32.7% | 61.9% | 33.3% | 19.0% | 31.3% | 23.8% | 60.5% | 55.8% | 92.5% |
| Attar, 2014 [58] | Saudi Arabia | 200 | 20.0% | 65.7% | 29.0% | 3.0% | 10.0% | 16.5% | 21.0% | 41.5% | 85.0% | |
| Attarchi et al., 2014 [35] | Iran | 454 | 44.0% | 47.0% | 57.4% | 42.0% | 24.2% | 37.1% | 19.3% | 48.4% | 32.5% | |
| Barzideh et al., 2013 [36] | Iran | 385 | 48.6% | 54.0% | 61.8% | 45.5% | 15.8% | 48.1% | 29.1% | 59.7% | 54.8% | 89.9% |
| Behera et al., 2023 [52] | India | 173 | 67.0% | 62.0% | 79.0% | 82.0% | 76.0% | |||||
| Chandralekha et al., 2022 [53] | India | 207 | 43.5% | 55.1% | 43.0% | 81.2% | ||||||
| Choobineh et al., 2006 [13] | Iran | 641 | 36.4% | 46.4% | 54.9% | 39.8% | 17.9% | 39.3% | 29.3% | 48.4% | 52.1% | 84.4% |
| Choobineh et al., 2010 [37] | Iran | 375 | 51.9% | 54.6% | 60.6% | 51.7% | 22.9% | 47.1% | 30.7% | 58.1% | 59.0% | 85.7% |
| Dhas et al., 2023 [61] | Qatar | 127 | 35.4% | 29.1% | 55.1% | 33.9% | 7.9% | 17.3% | 11.9% | 15.0% | 15.7% | 90.7% |
| Farrokhi et al., 2016 [38] | Iran | 250 | 58.2% | 75.6% | 42.0% | 15.4% | 40.0% | 64.0% | 29.4% | 87.6% | ||
| Goswami et al., 2013 [54] | India | 40 | 27.5% | 6.7% | 47.5% | 17.5% | 5.0% | 15.0% | 5.0% | 20.0% | 12.5% | |
| Heidari et al., 2018 [39] | Iran | 300 | 55.0% | 28.3% | 83.3% | 25.6% | 16.3% | 33.6% | 71.0% | 83.3% | 46.0% | |
| Heidari et al., 2019 [40] | Iran | 300 | 55.0% | 28.3% | 88.3% | 25.6% | 16.3% | 33.6% | 83.3% | 46.0% | ||
| Hou et al., 2006 [47] | China | 3950 | 12.2% | 8.0% | 32.9% | 17.1% | 2.5% | 10.5% | 7.0% | 6.8% | 22.3% | 91.6% |
| Kee et al., 2007 [56] | Korea | 162 | 17.3% | 12.9% | 23.4% | 27.2% | 7.4% | 21.6% | 9.9% | 24.7% | 17.3% | 56.8% |
| Lin et al., 2020 [19] | China | 1803 | 62.4% | 32.9% | 60.4% | 85.8% | 53.3% | 62.2% | 41.7% | 59.7% | 47.3% | |
| Mahmoudifar et al., 2017 [41] | Iran | 100 | 40.0% | 37.0% | 55.0% | 38.0% | 8.0% | 11.0% | 29.0% | 41.0% | 30.0% | |
| Mai et al., 2022 [60] | Vietnam | 225 | 61.8% | 35.1% | 65.3% | 61.8% | 24.0% | 34.2% | 29.3% | 42.2% | 16.4% | 87.6% |
| Mehrdad et al., 2010 [42] | Iran | 317 | 46.3% | 43.5% | 73.2% | 48.6% | 16.6% | 42.2% | 28.8% | 68.7% | 39.3% | |
| Mirmohammadi et al., 2014 [43] | Iran | 120 | 28.2% | 17.3% | 18.2% | |||||||
| Nasiri-Ziba et al., 2017 [44] | Iran | 133 | 41.4% | 42.1% | 34.3% | 11.3% | 35.3% | 46.6% | 29.3% | |||
| Nguyen et al., 2020 [16] | Vietnam | 1179 | 43.5% | 31.6% | 44.3% | 29.0% | 9.1% | 16.4% | 5.9% | 20.0% | 8.5% | 74.4% |
| Pahlevan et al., 2014 [45] | Iran | 286 | 65.4% | 33.6% | 66.1% | 46.8% | 13.6% | 36.4% | 20.3% | 59.4% | 36.4% | 93.7% |
| Shafizadeh, 2011 [18] | Iran | 161 | 62.7% | 41.6% | 48.4% | 44.1% | 14.3% | 49.7% | 25.5% | 54.0% | 37.9% | 90.0% |
| Smith et al., 2004 [48] | China | 282 | 45.0% | 37.0% | 56.0% | 40.0% | 70.0% | |||||
| Smith et al., 2004 [49] | China | 180 | 42.8% | 38.9% | 56.7% | 38.9% | 10.0% | 27.8% | 22.8% | 31.1% | 34.4% | 70.0% |
| Smith et al., 2005 [57] | Korea | 330 | 62.7% | 29.7% | 72.4% | 74.5% | 6.4% | 46.7% | 14.2% | 35.2% | 38.8% | 93.6% |
| Smith et al., 2006 [12] | Japan | 844 | 54.7% | 33.9% | 71.3% | 71.9% | 85.5% | |||||
| Taghinejad et al., 2016 [46] | Iran | 135 | 31.1% | 23.0% | 40.0% | 14.1% | 14.1% | 11.9% | 11.1% | 20.0% | 17.0% | 71.9% |
| Tariah et al., 2020 [59] | Saudi Arabia | 94 | 40.4% | 48.9% | 63.8% | 50.0% | 11.7% | 34.0% | 36.2% | 23.4% | 41.5% | |
| Yan et al., 2018 [50] | China | 1973 | 57.8% | 37.9% | 47.4% | 17.3% | 23.5% | 21.4% | 34.1% | 31.6% | 79.5% | |
| Yang et al., 2020 [51] | China | 679 | 78.6% | 39.3% | 80.1% | 70.4% | 15.8% | 38.9% | 29.9% | 37.4% | 31.5% | 97.1% |
| Yao et al., 2019 [11] | China | 692 | 68.2% | 39.7% | 54.6% | 17.3% | 30.1% | 23.8% | 34.5% | 30.6% | 84.0% | |
| Yeung et al., 2005 [62] | Hong Kong | 97 | 19.6% | 22.7% | 42.3% | 20.6% | 7.2% | 17.5% | 20.6% | 29.9% | 19.6% | |
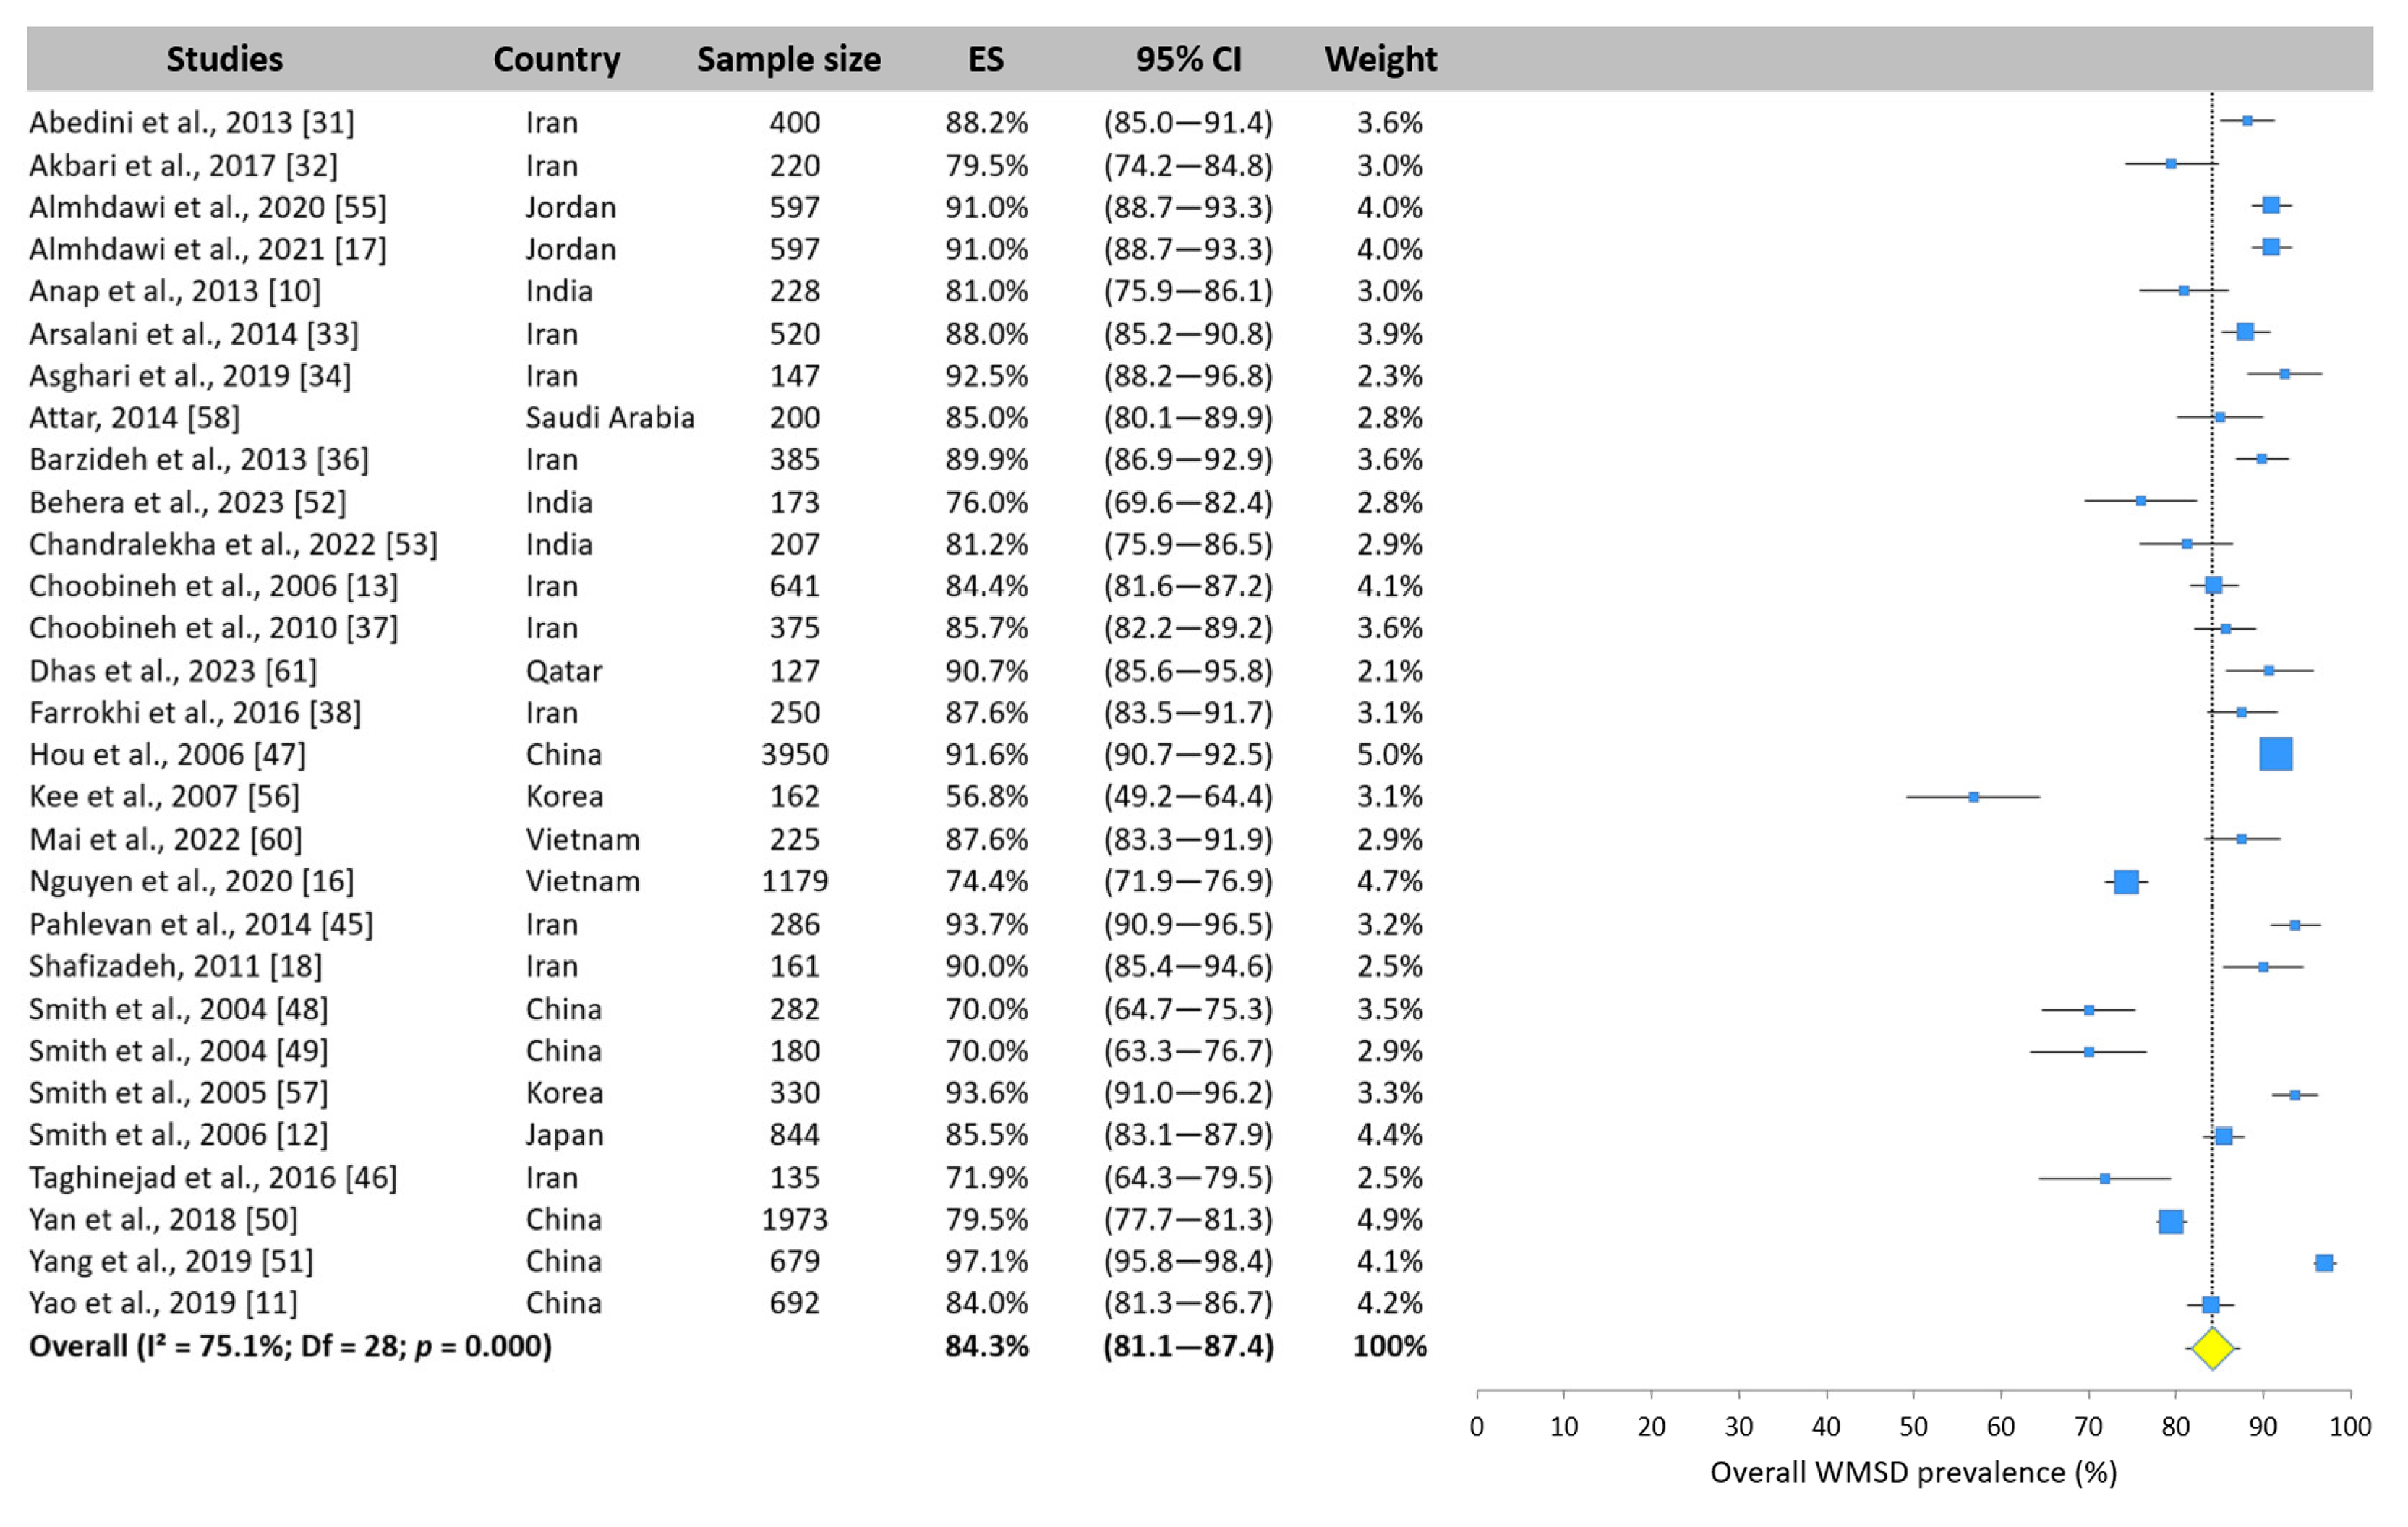
3.4. Overall WMSD Prevalence—Meta-Analysis
3.5. WMSD Prevalence by Body Area—Meta-Analysis
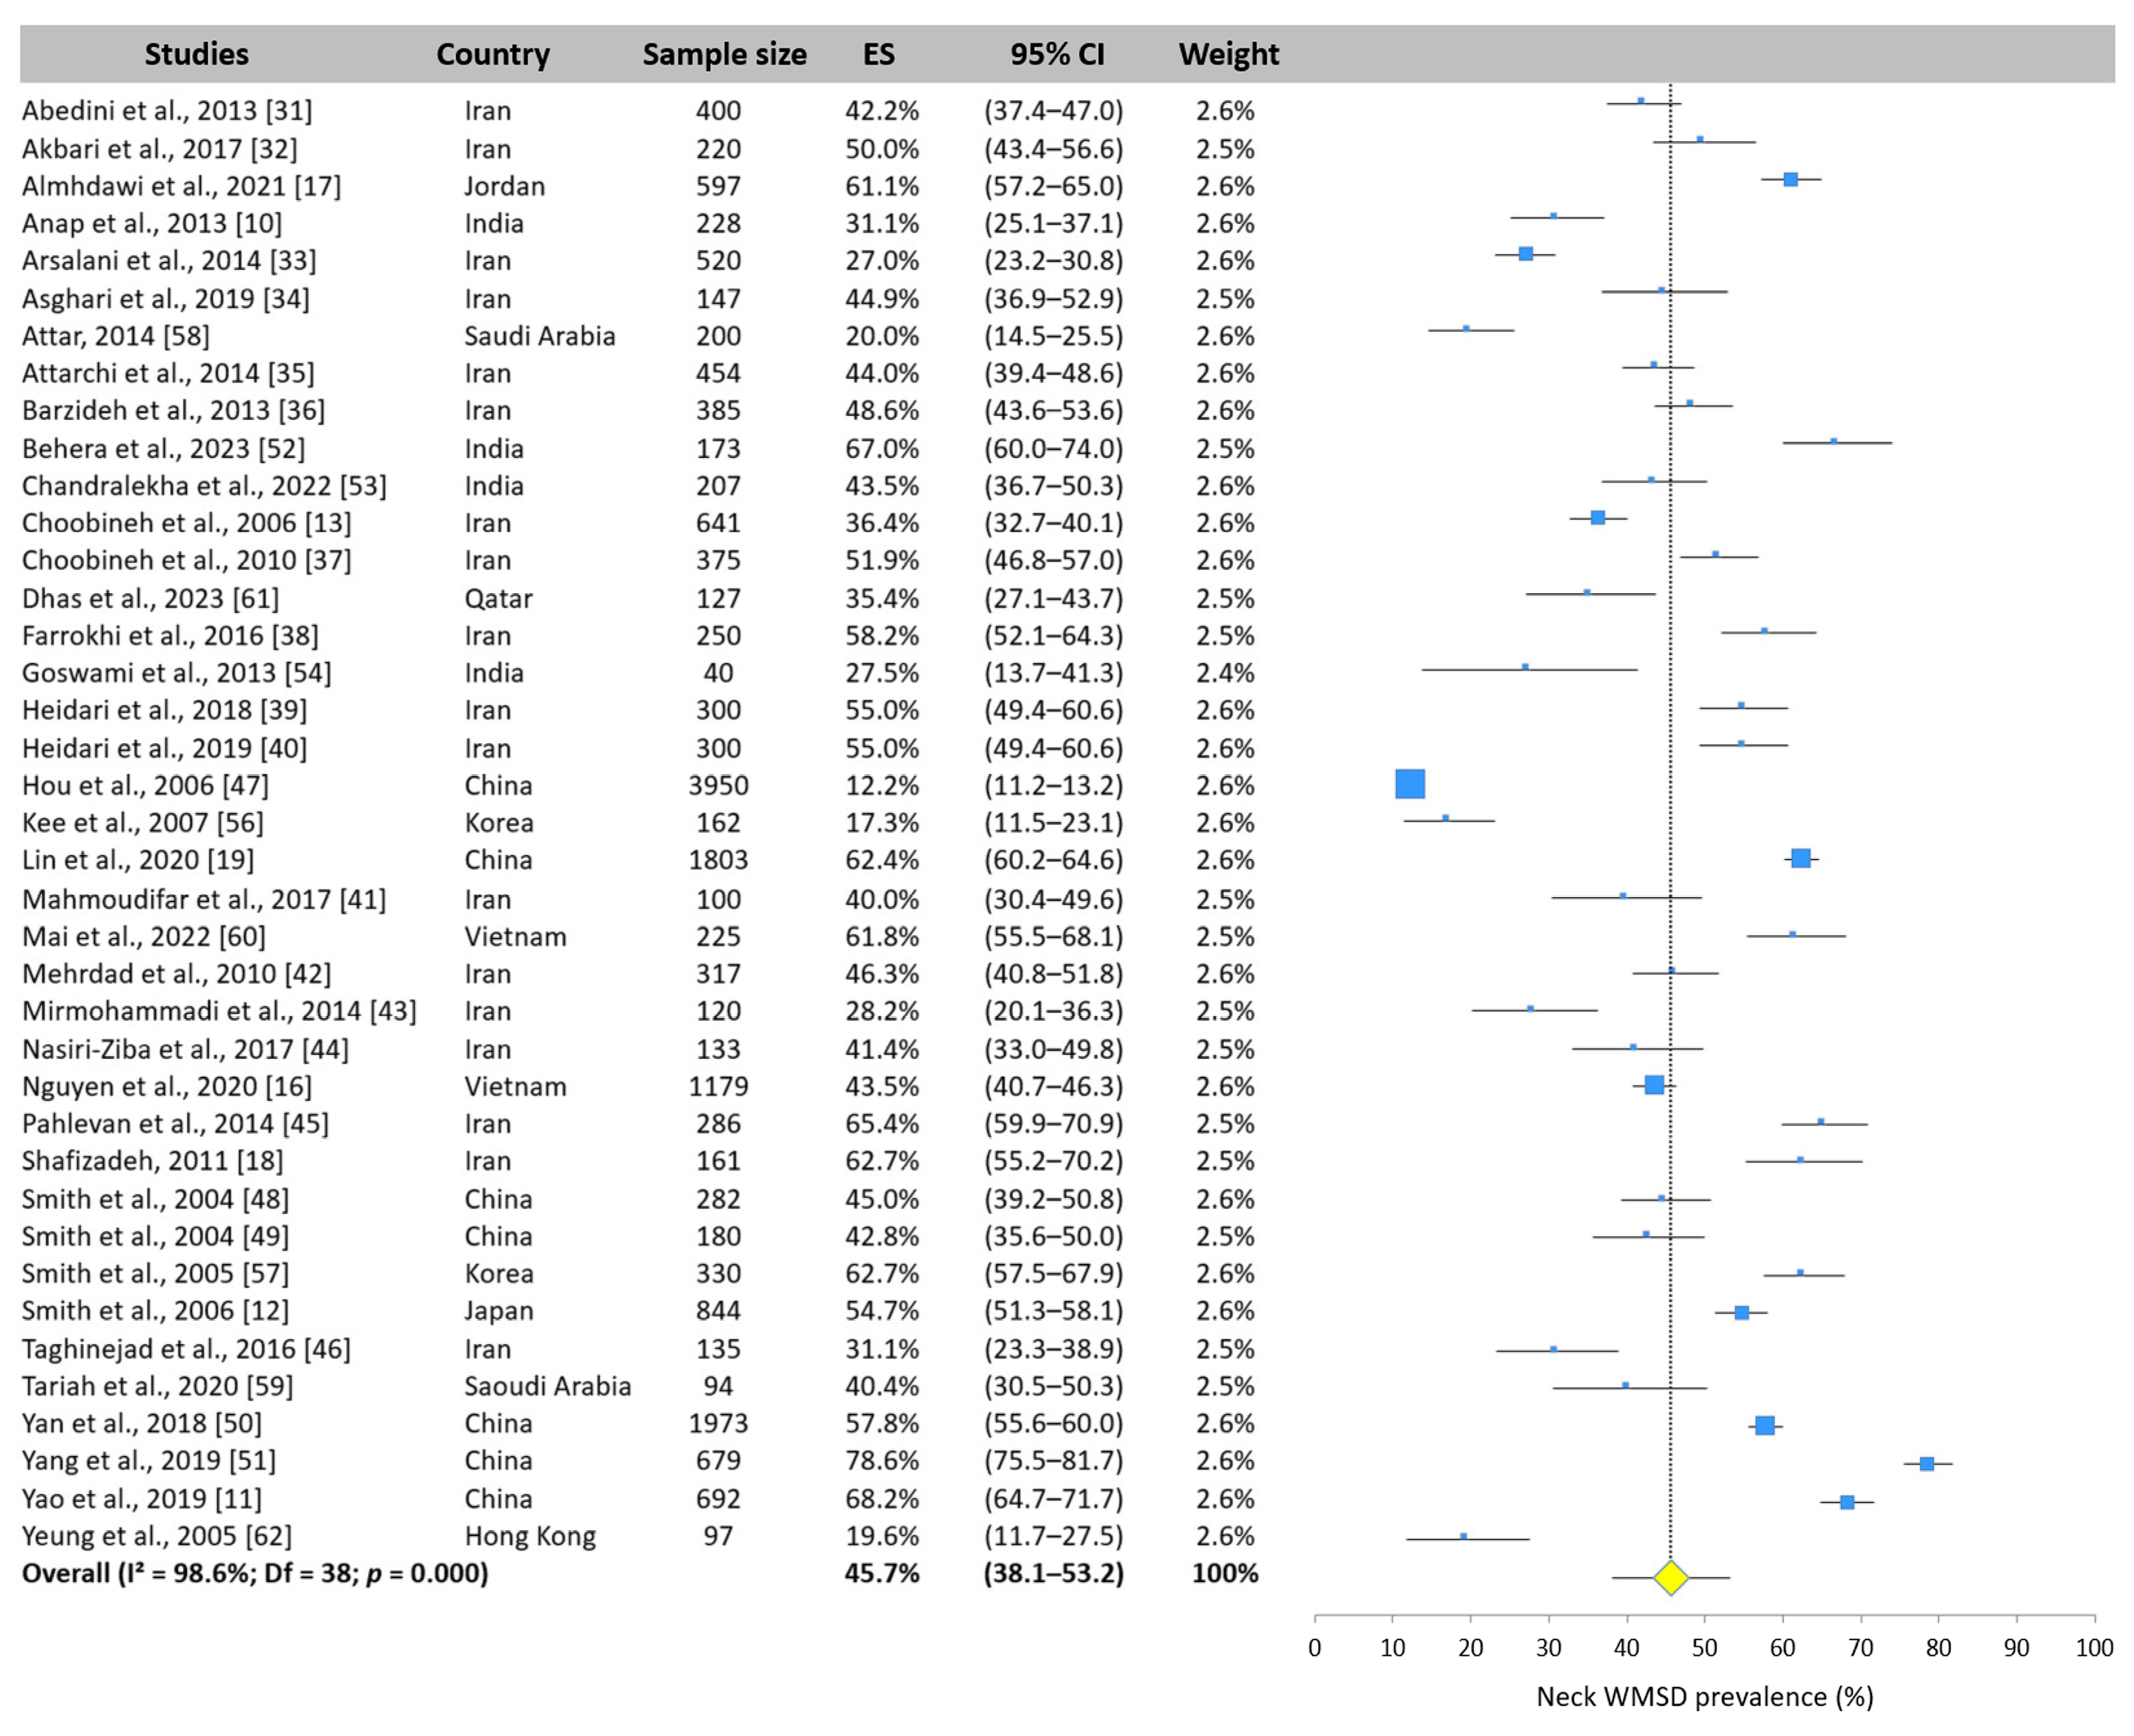
3.5.1. Neck WMSD Prevalence
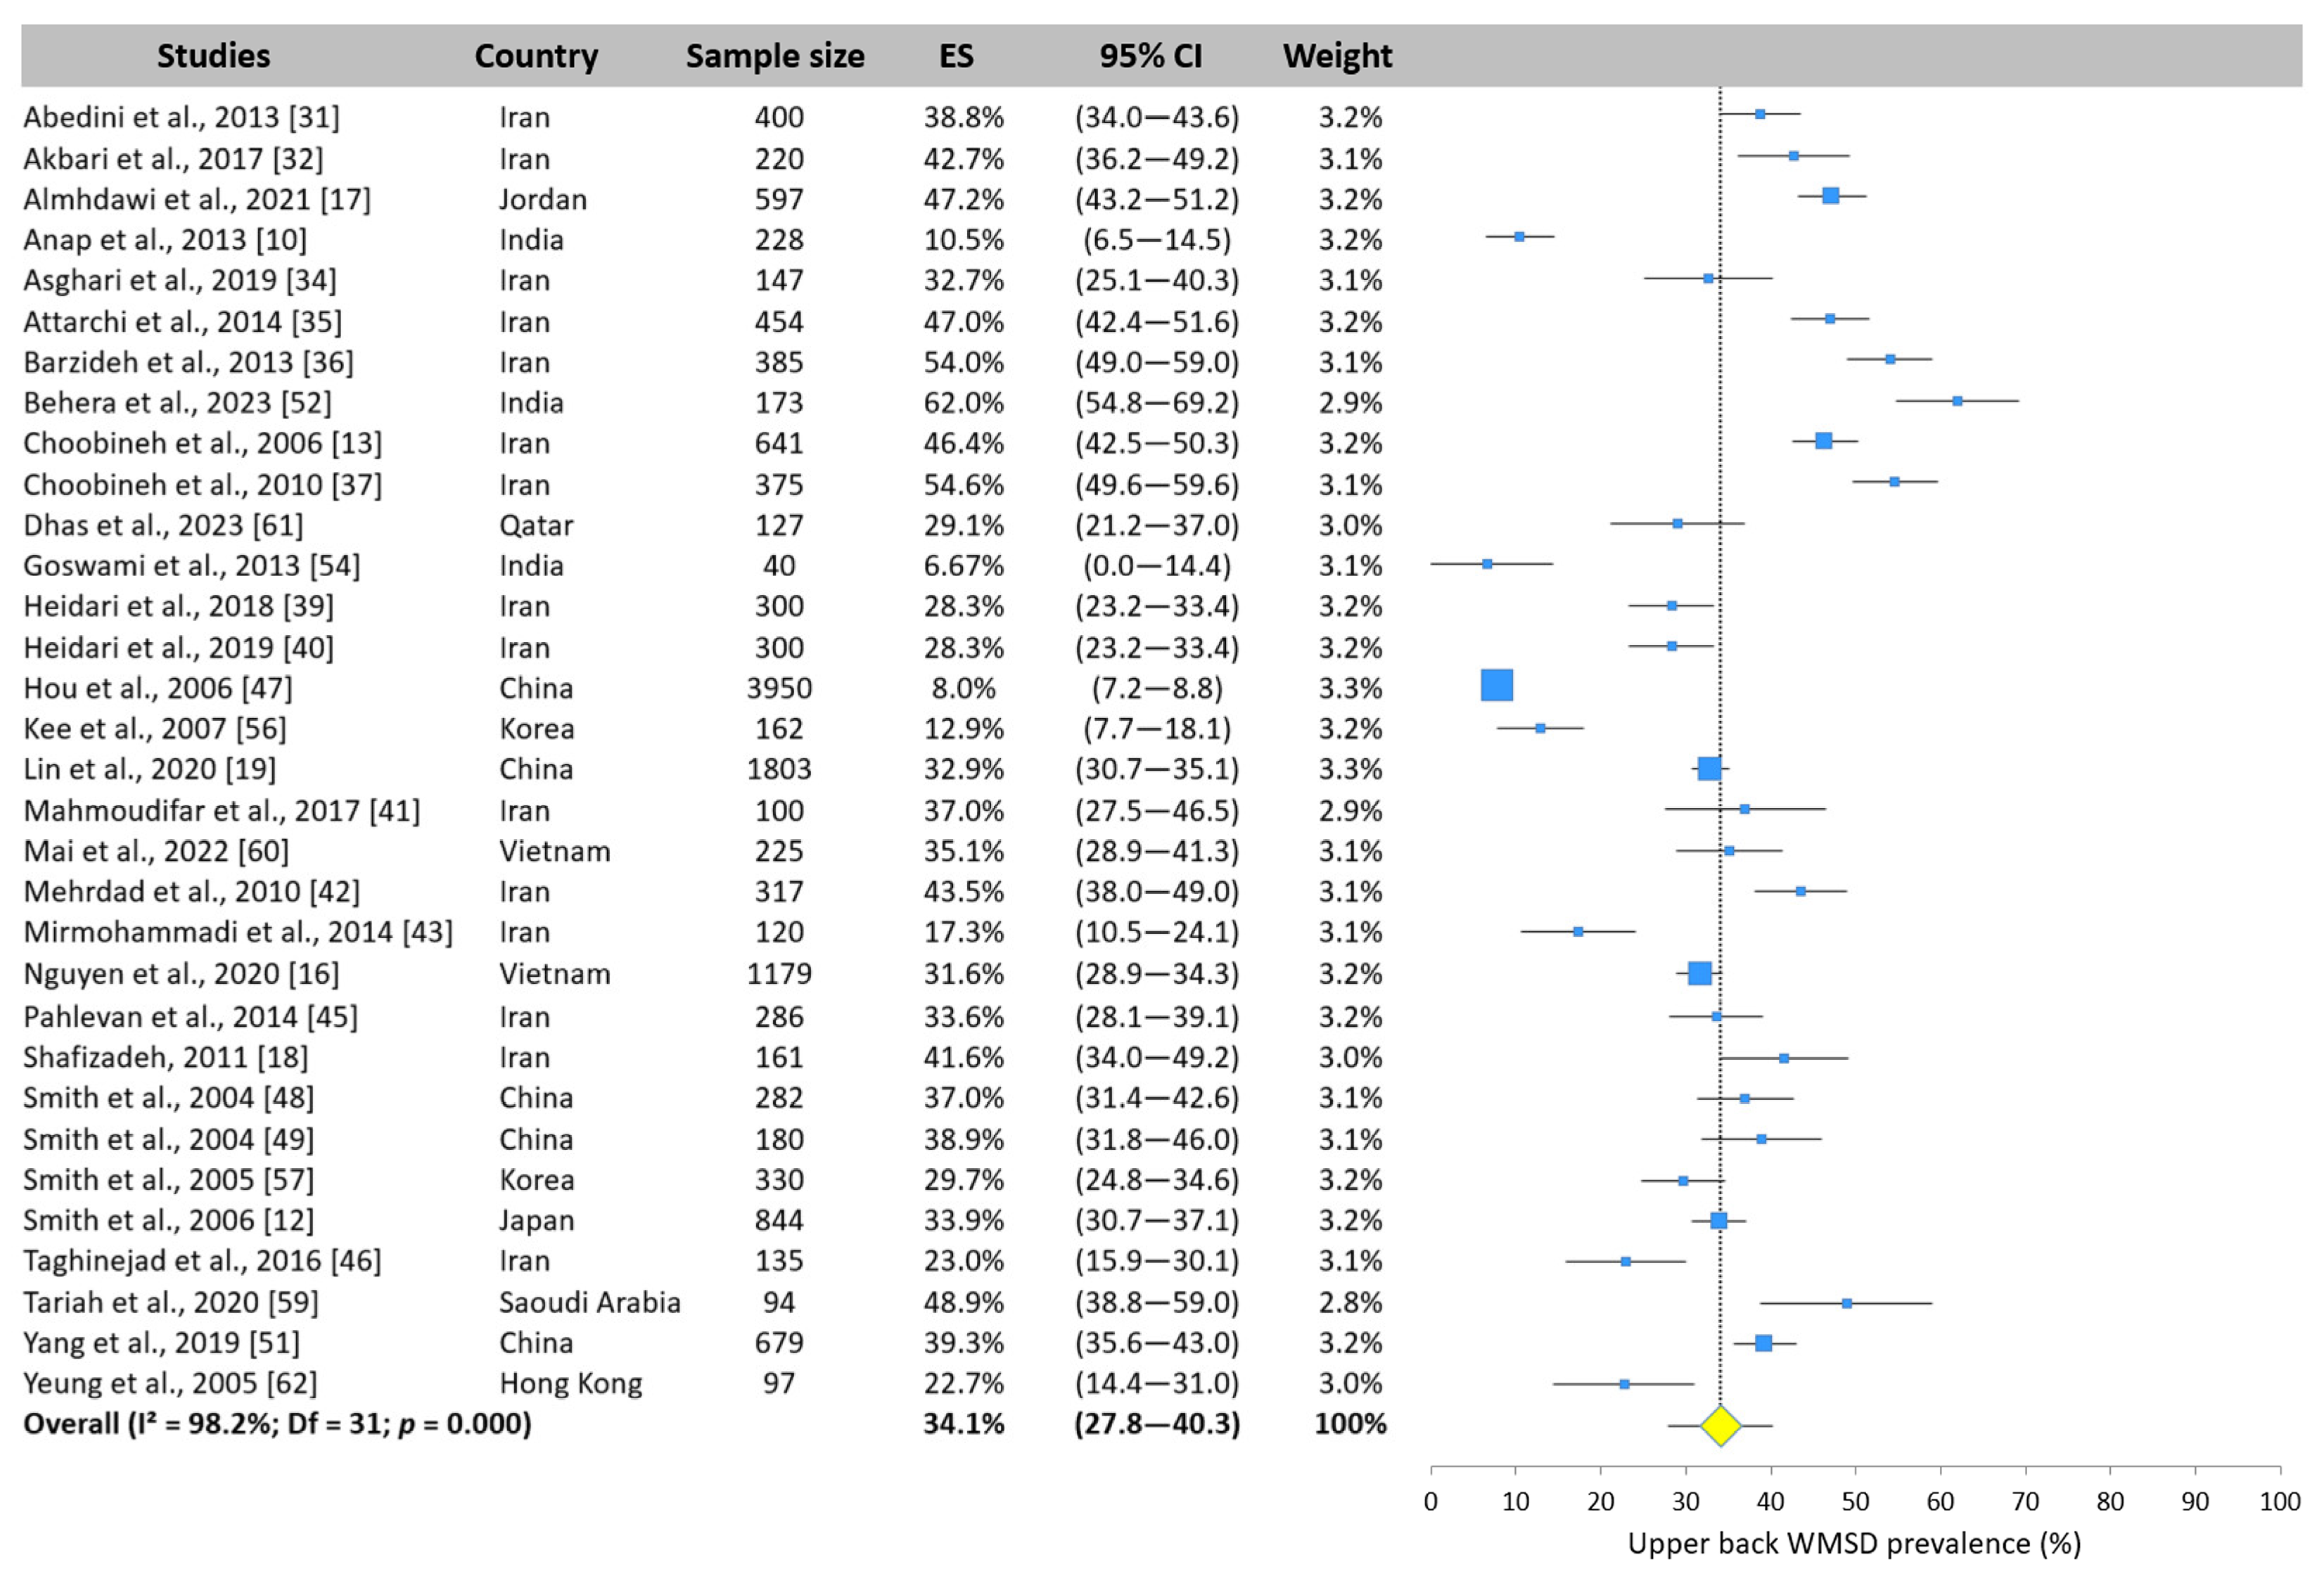
3.5.2. Upper Back WMSD Prevalence
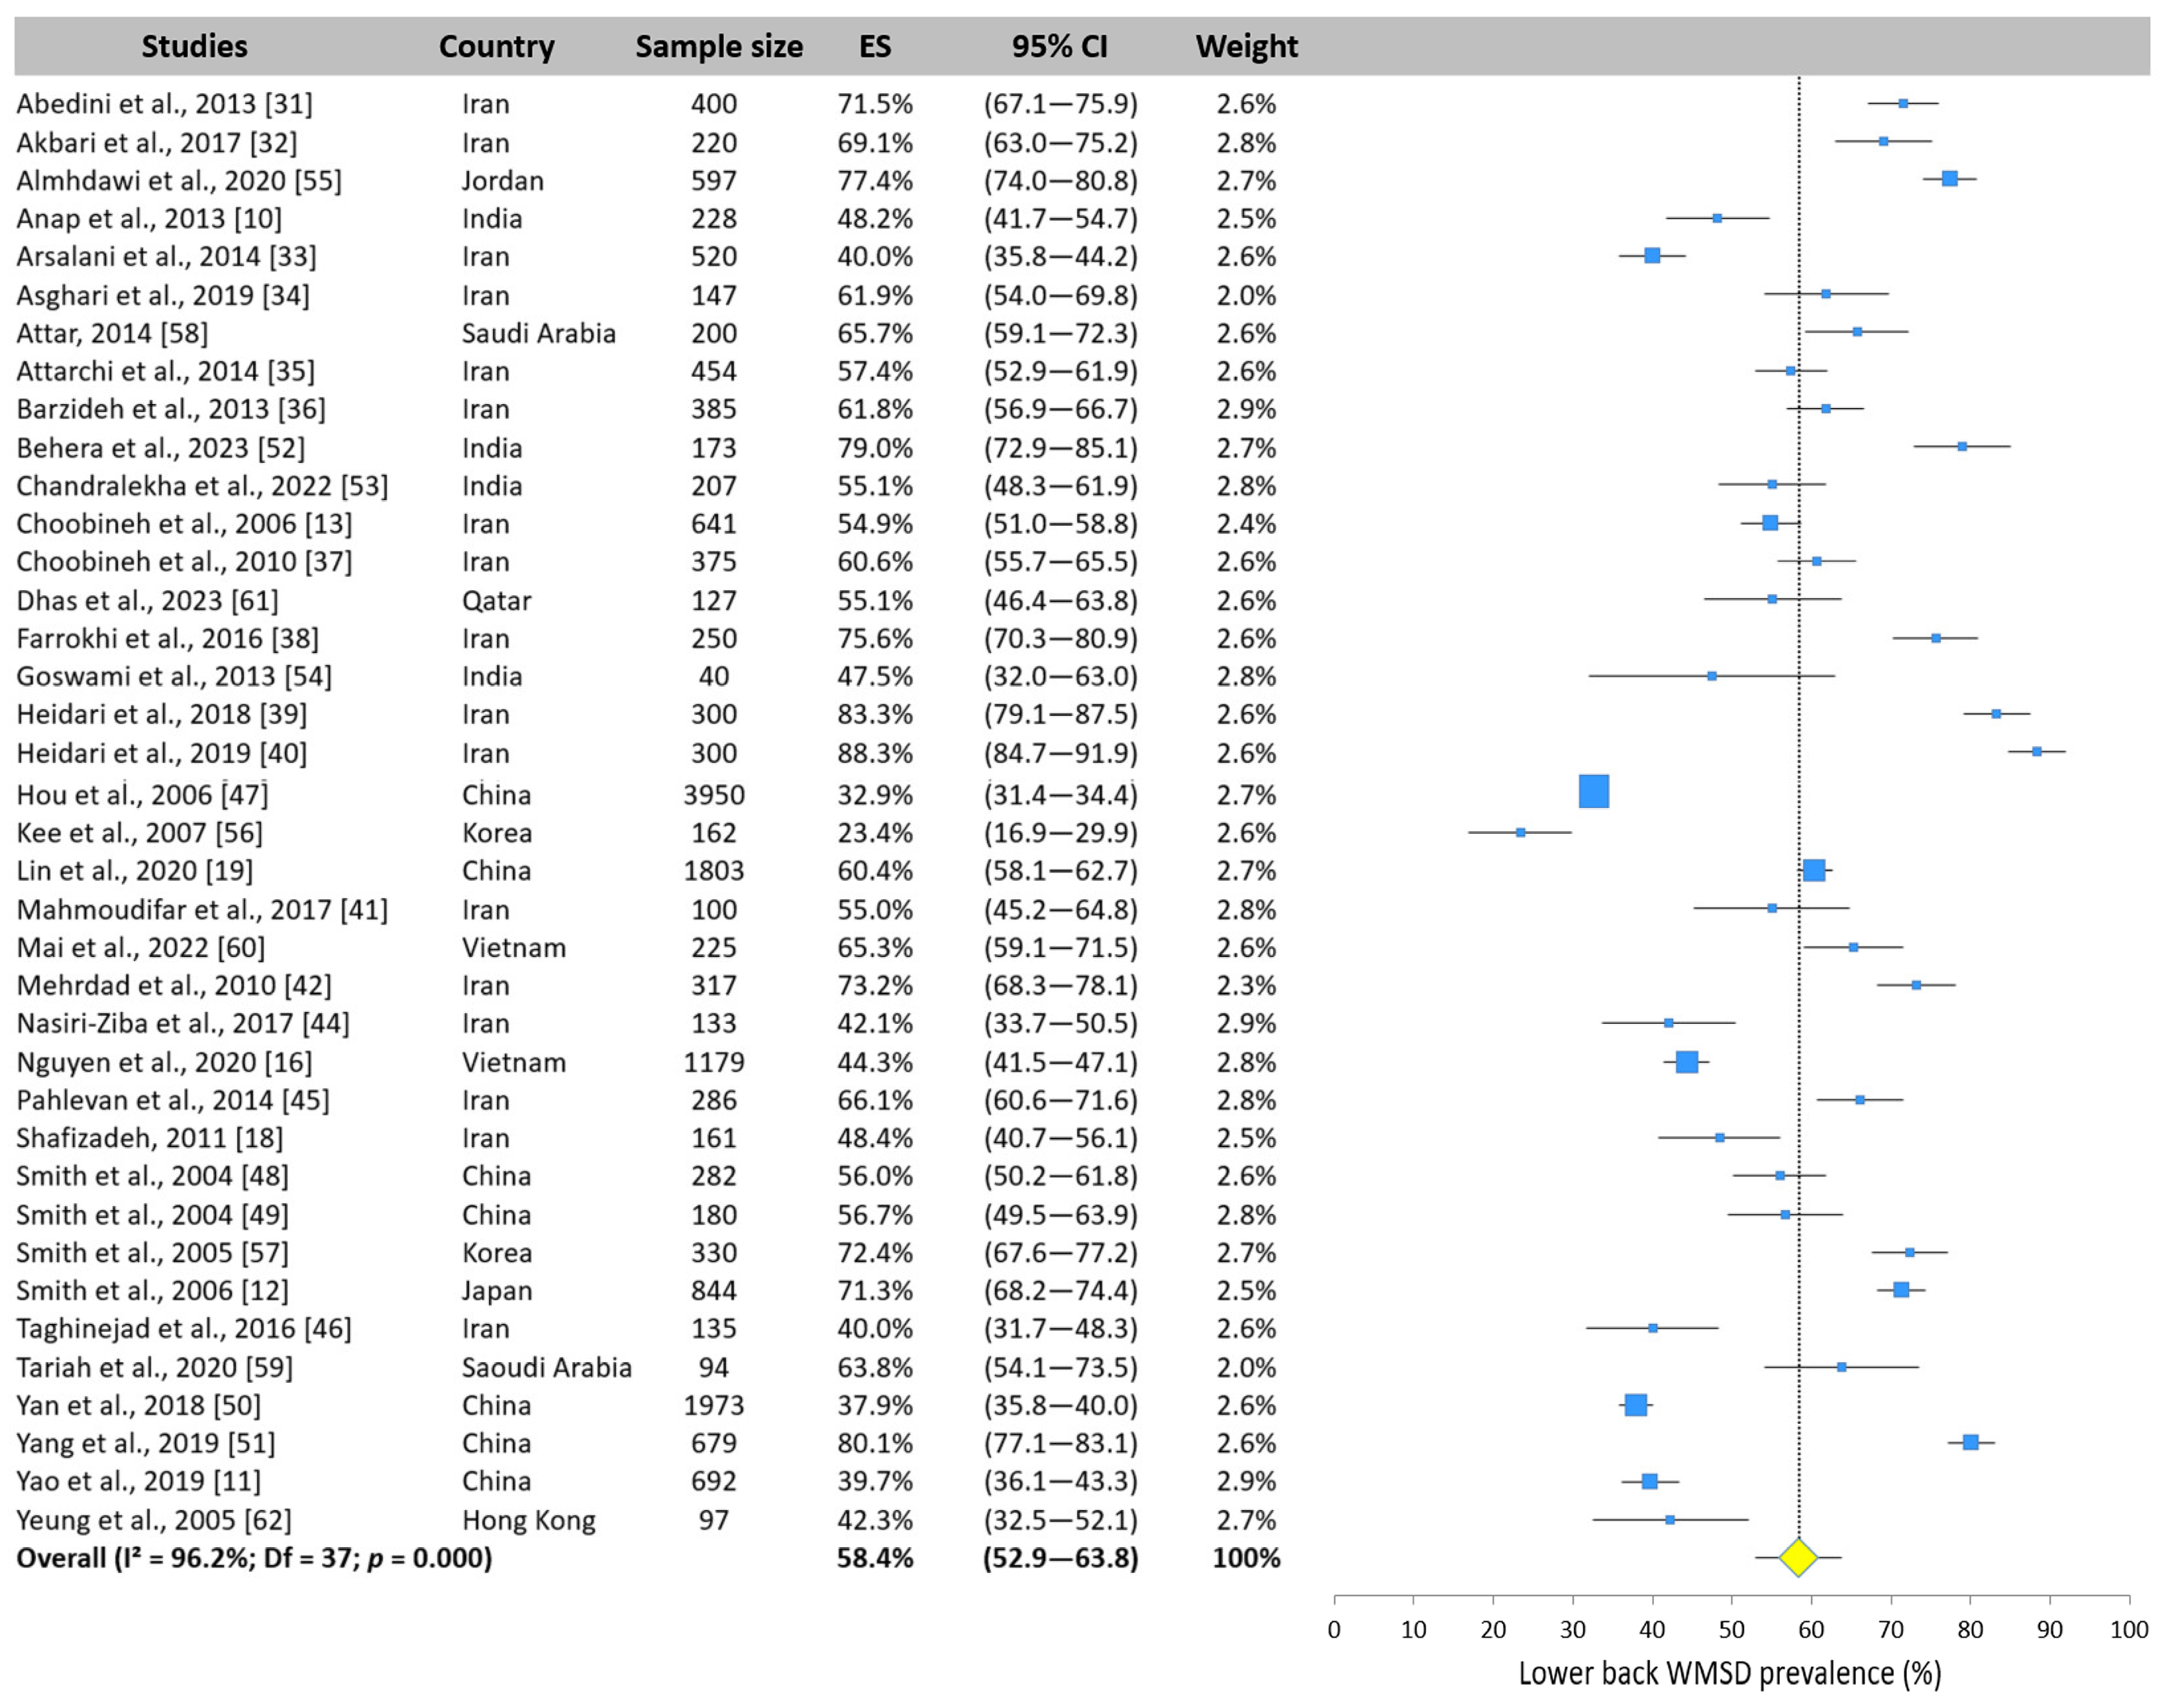
3.5.3. Lower Back WMSD Prevalence
3.5.4. Shoulder WMSD Prevalence
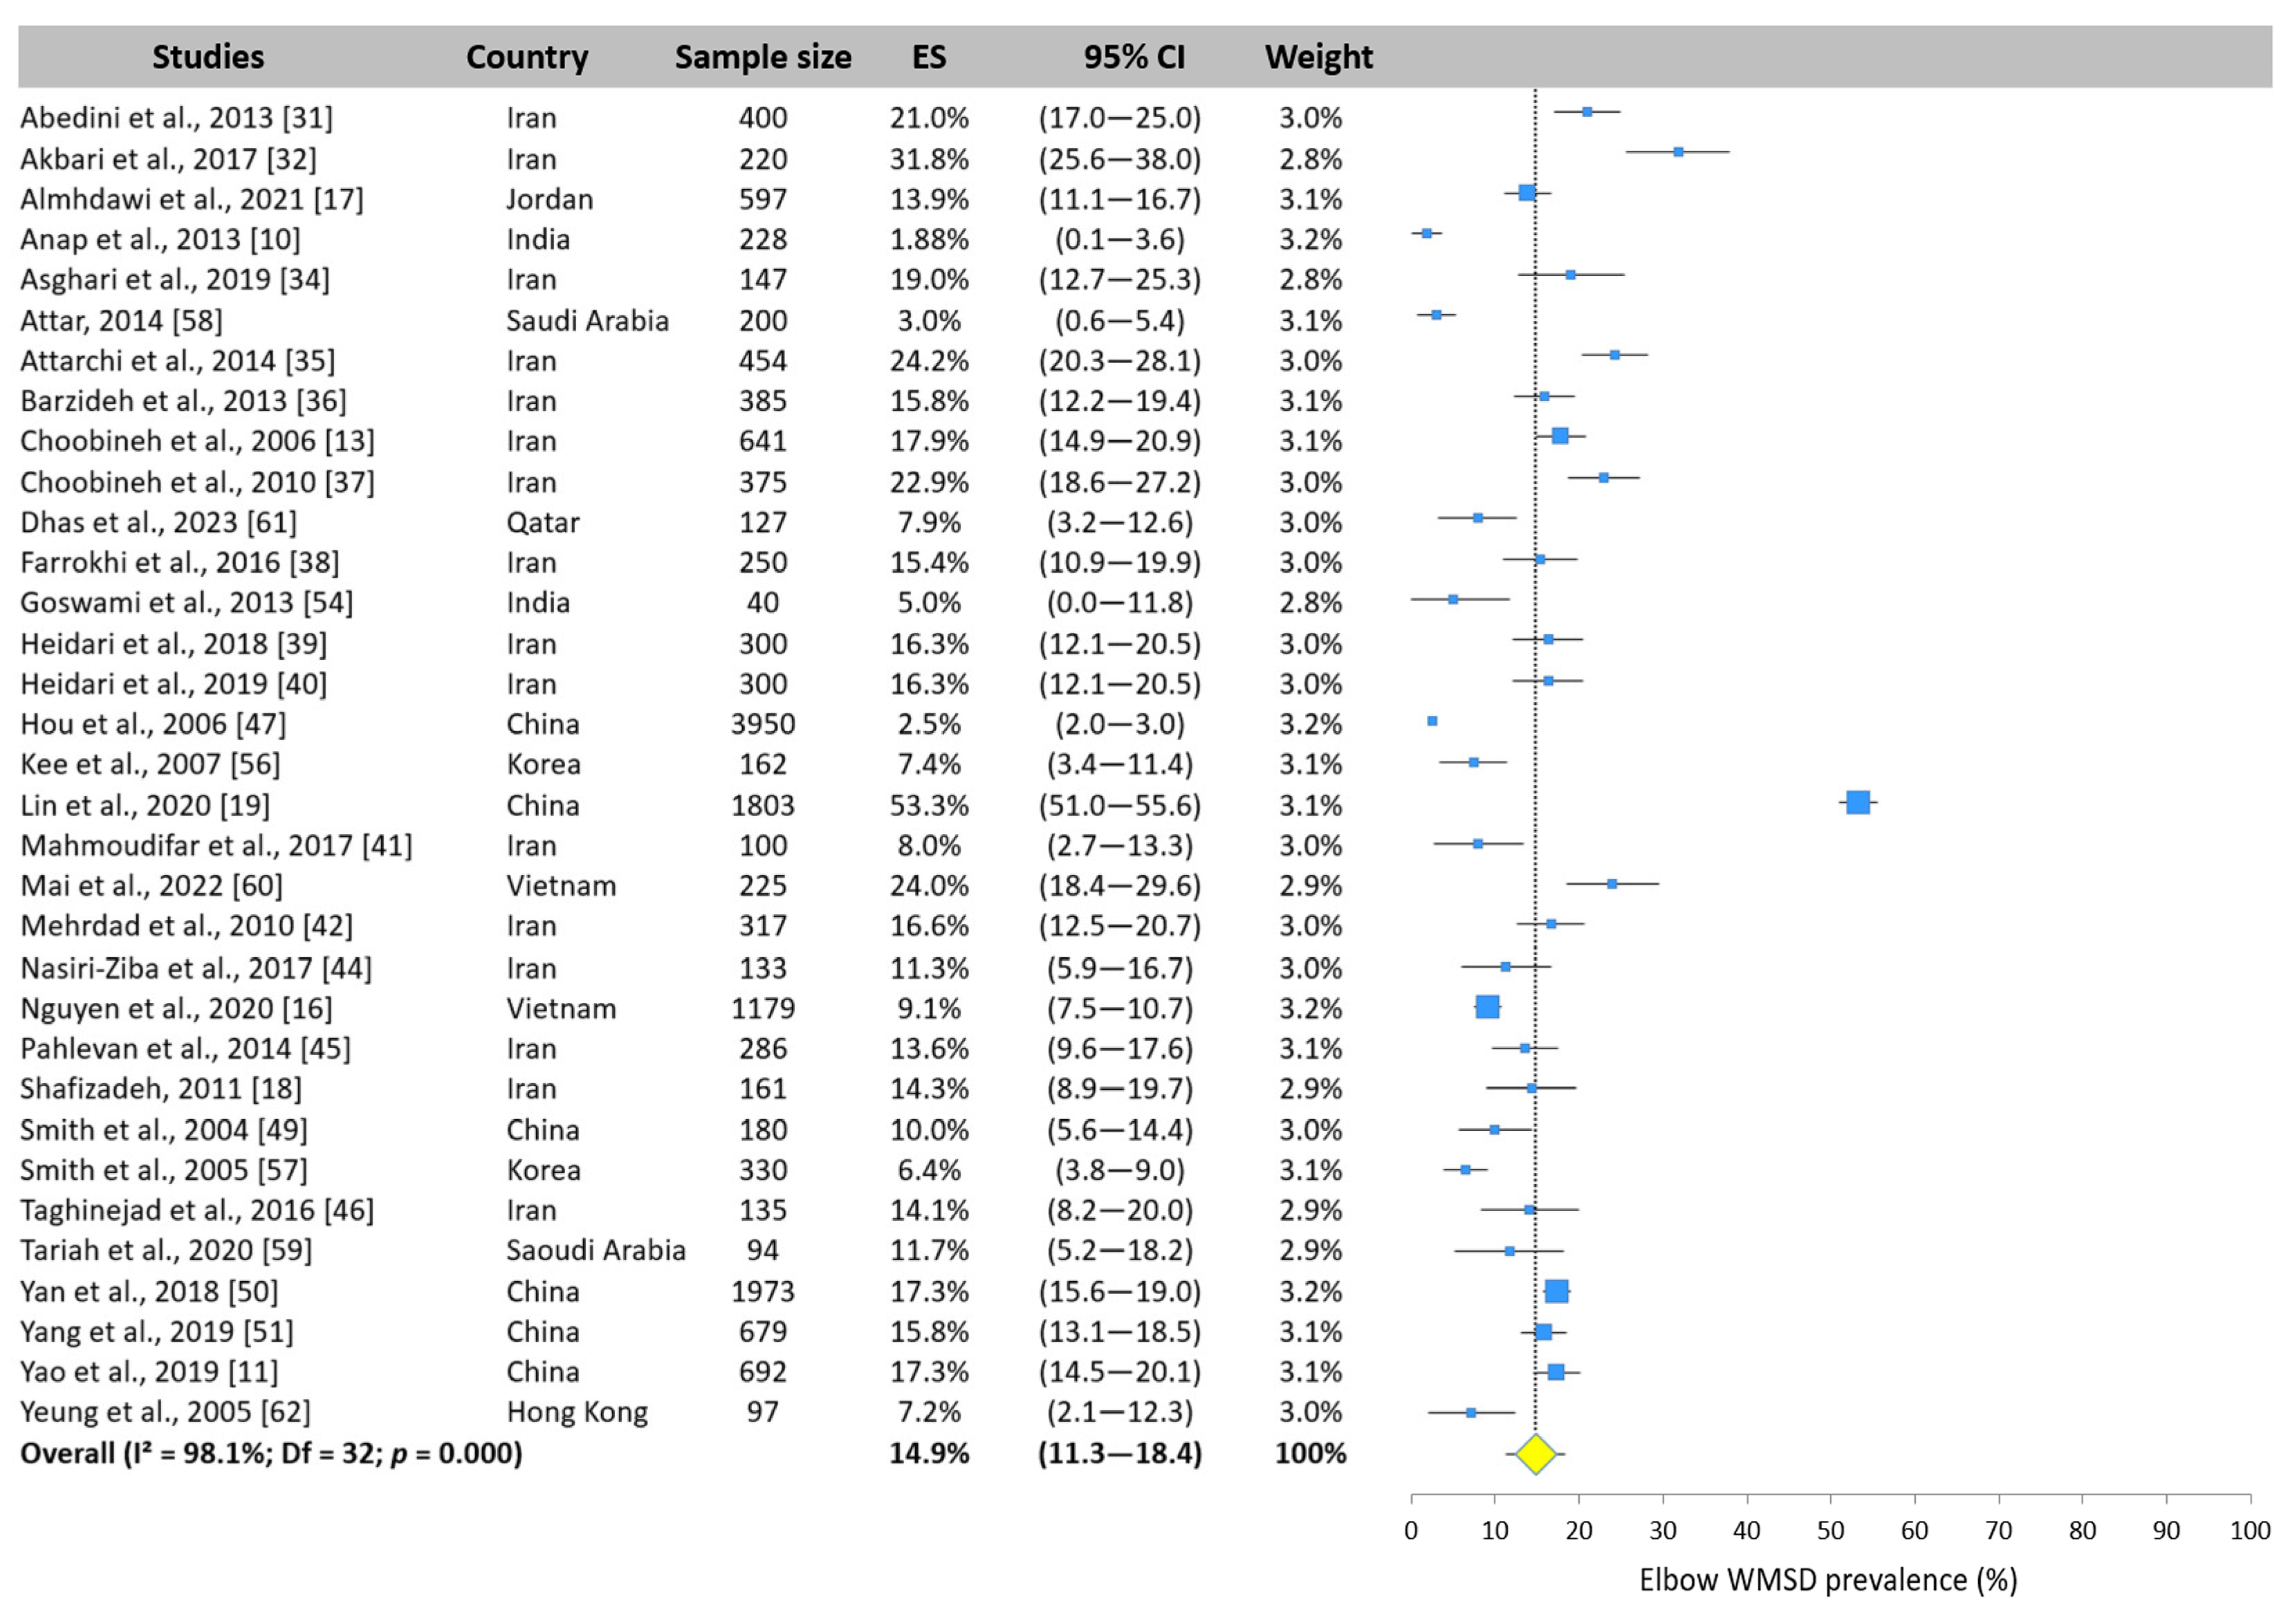
3.5.5. Elbow WMSD Prevalence
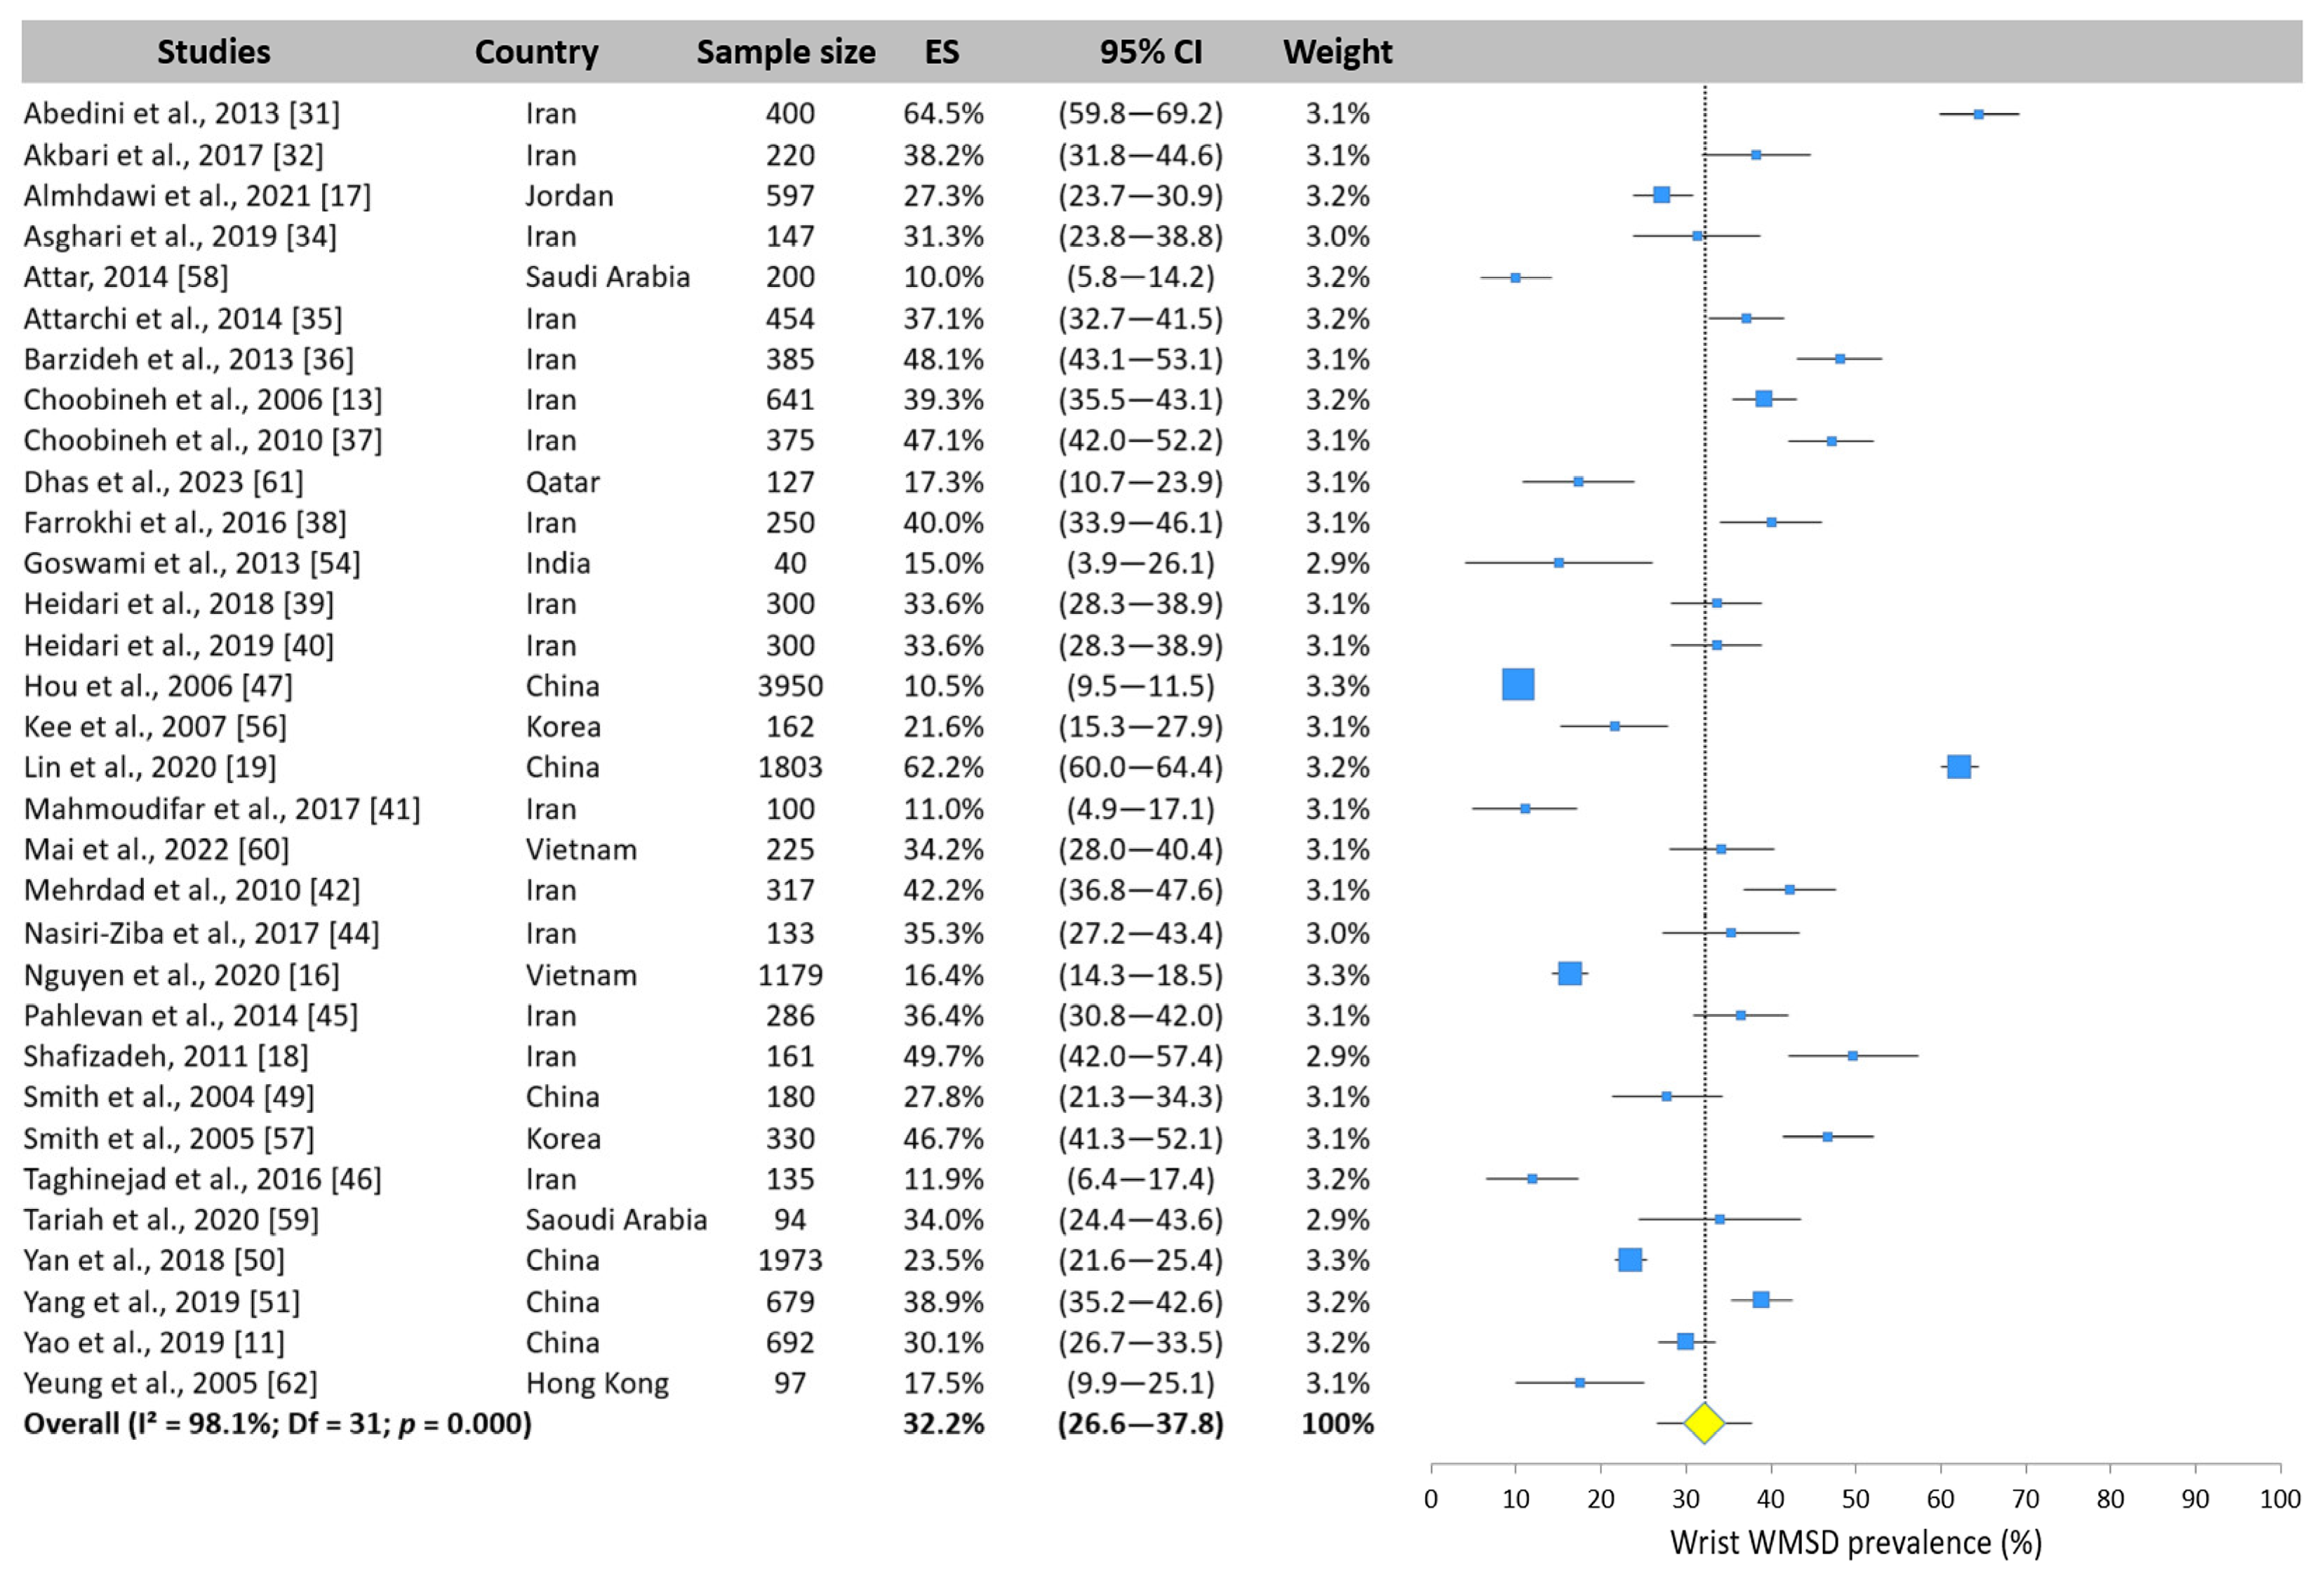
3.5.6. Wrist WMSD Prevalence
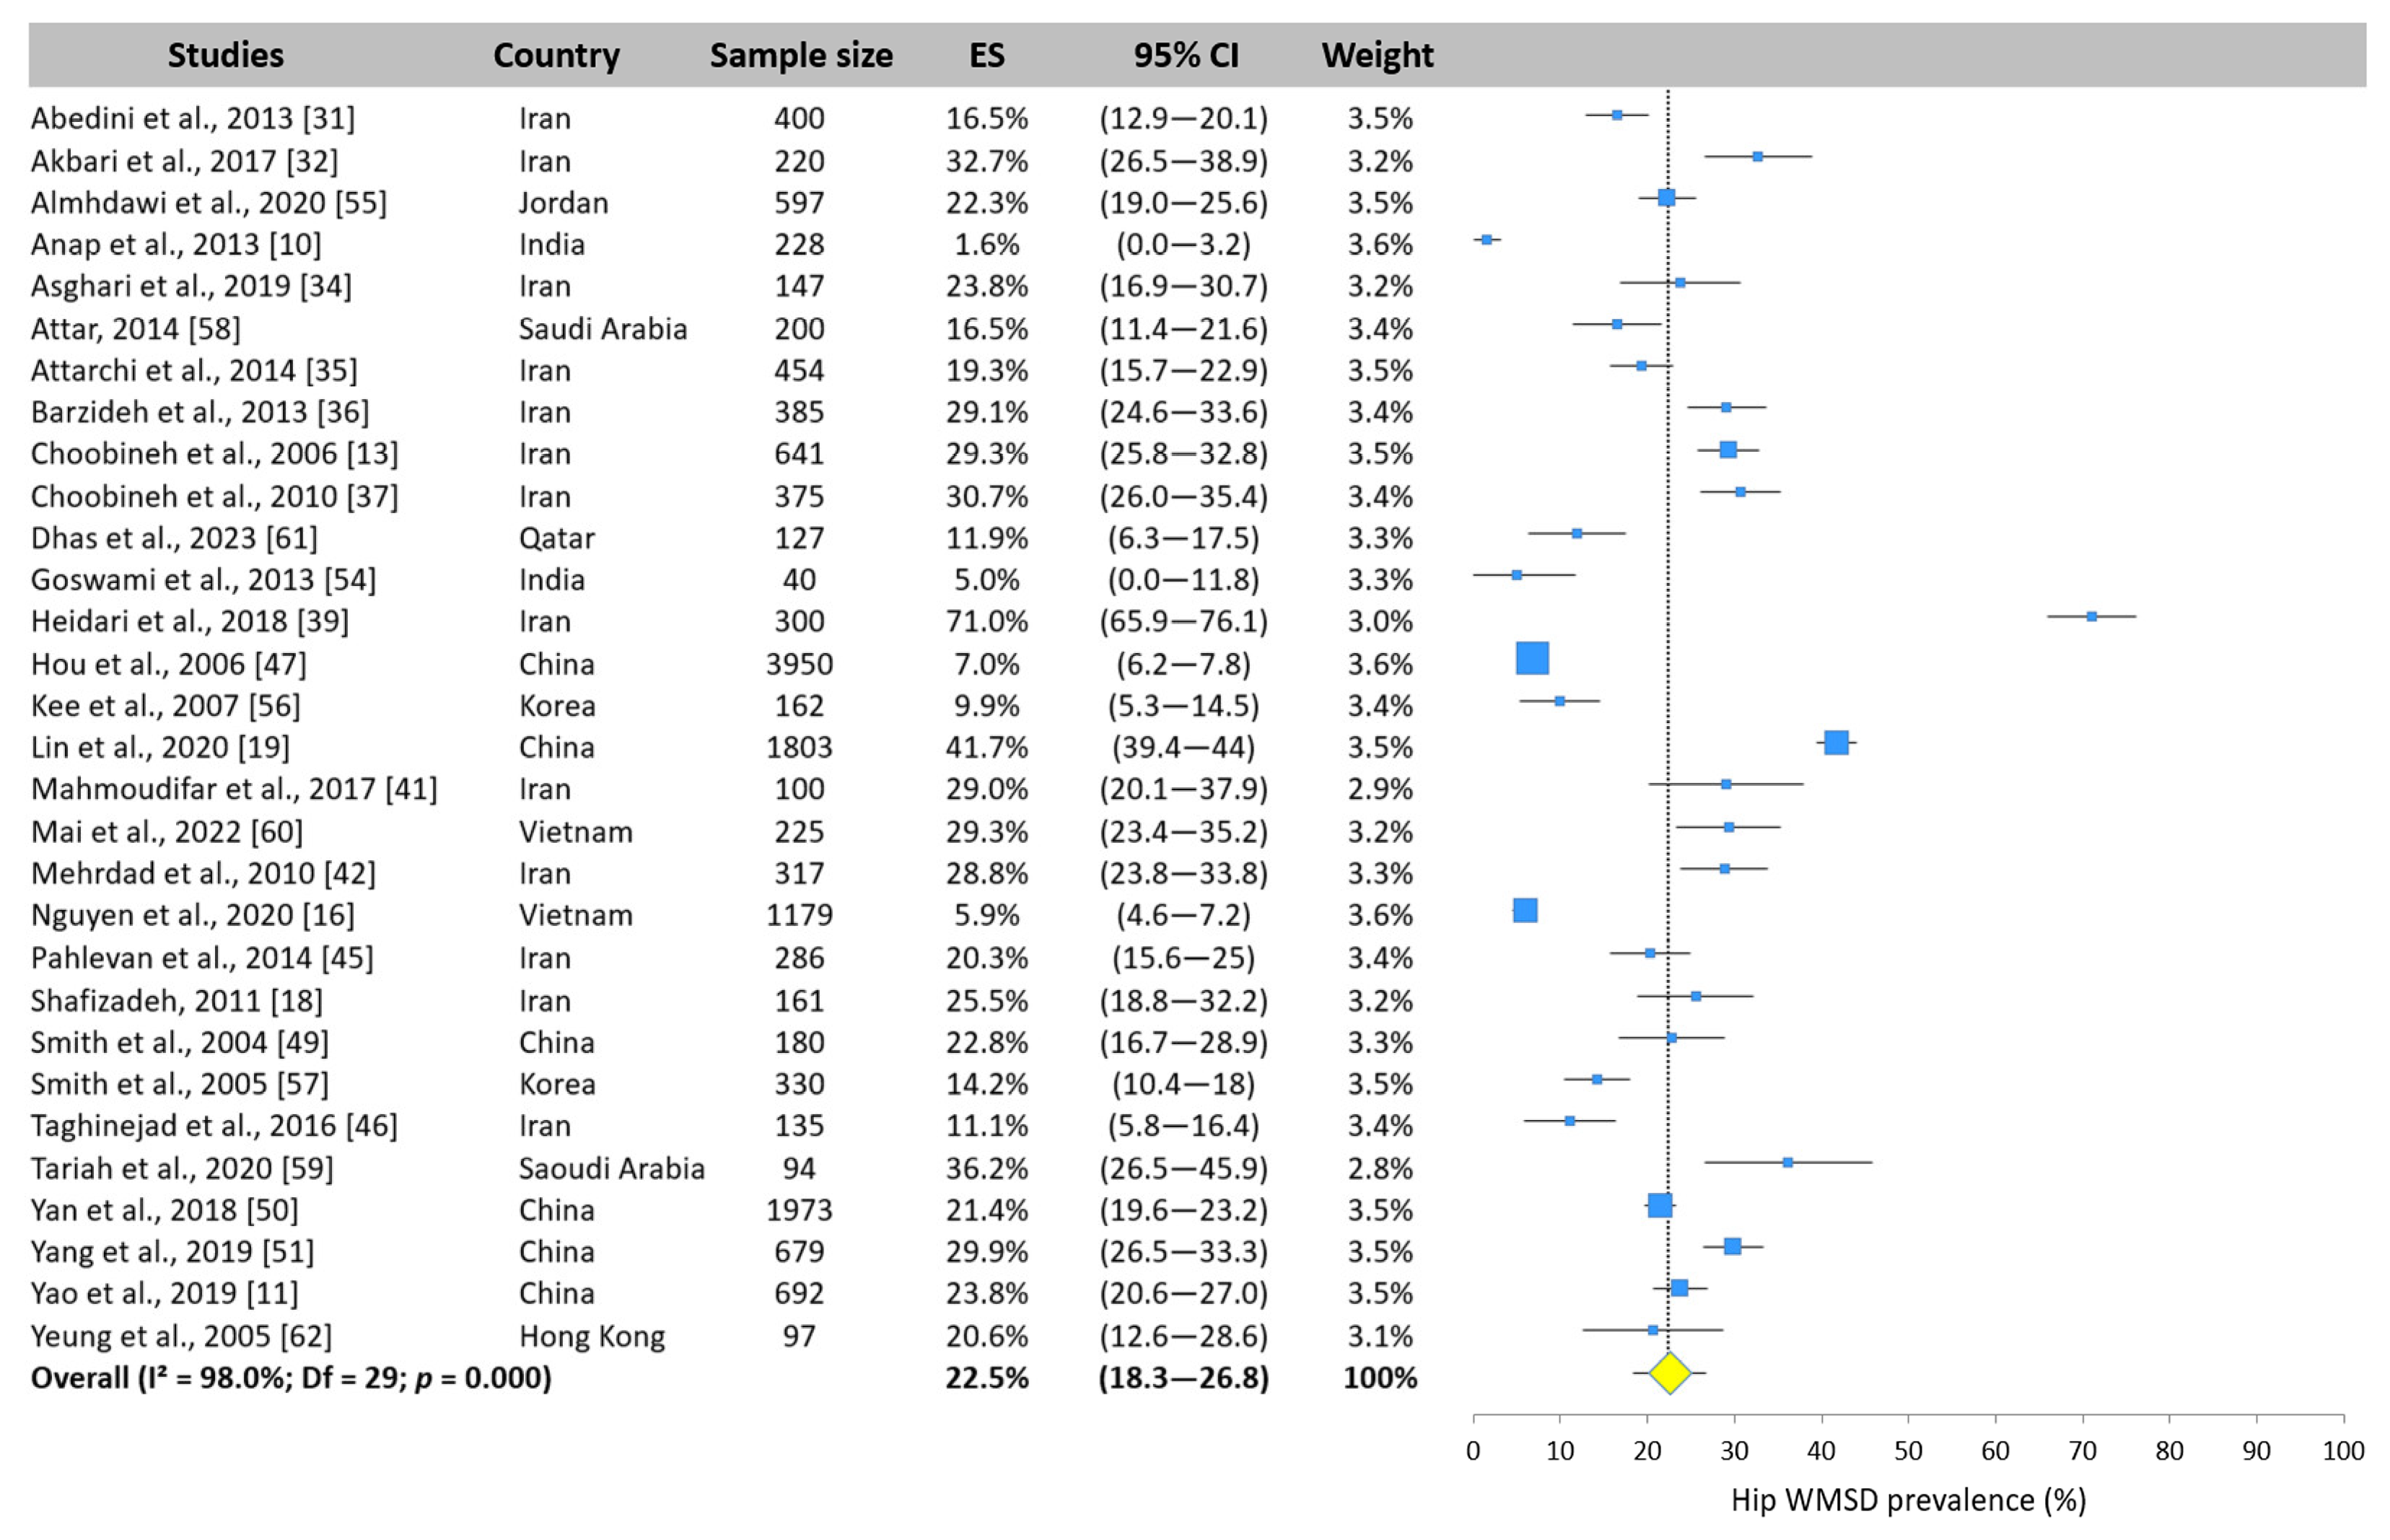
3.5.7. Hip WMSD Prevalence
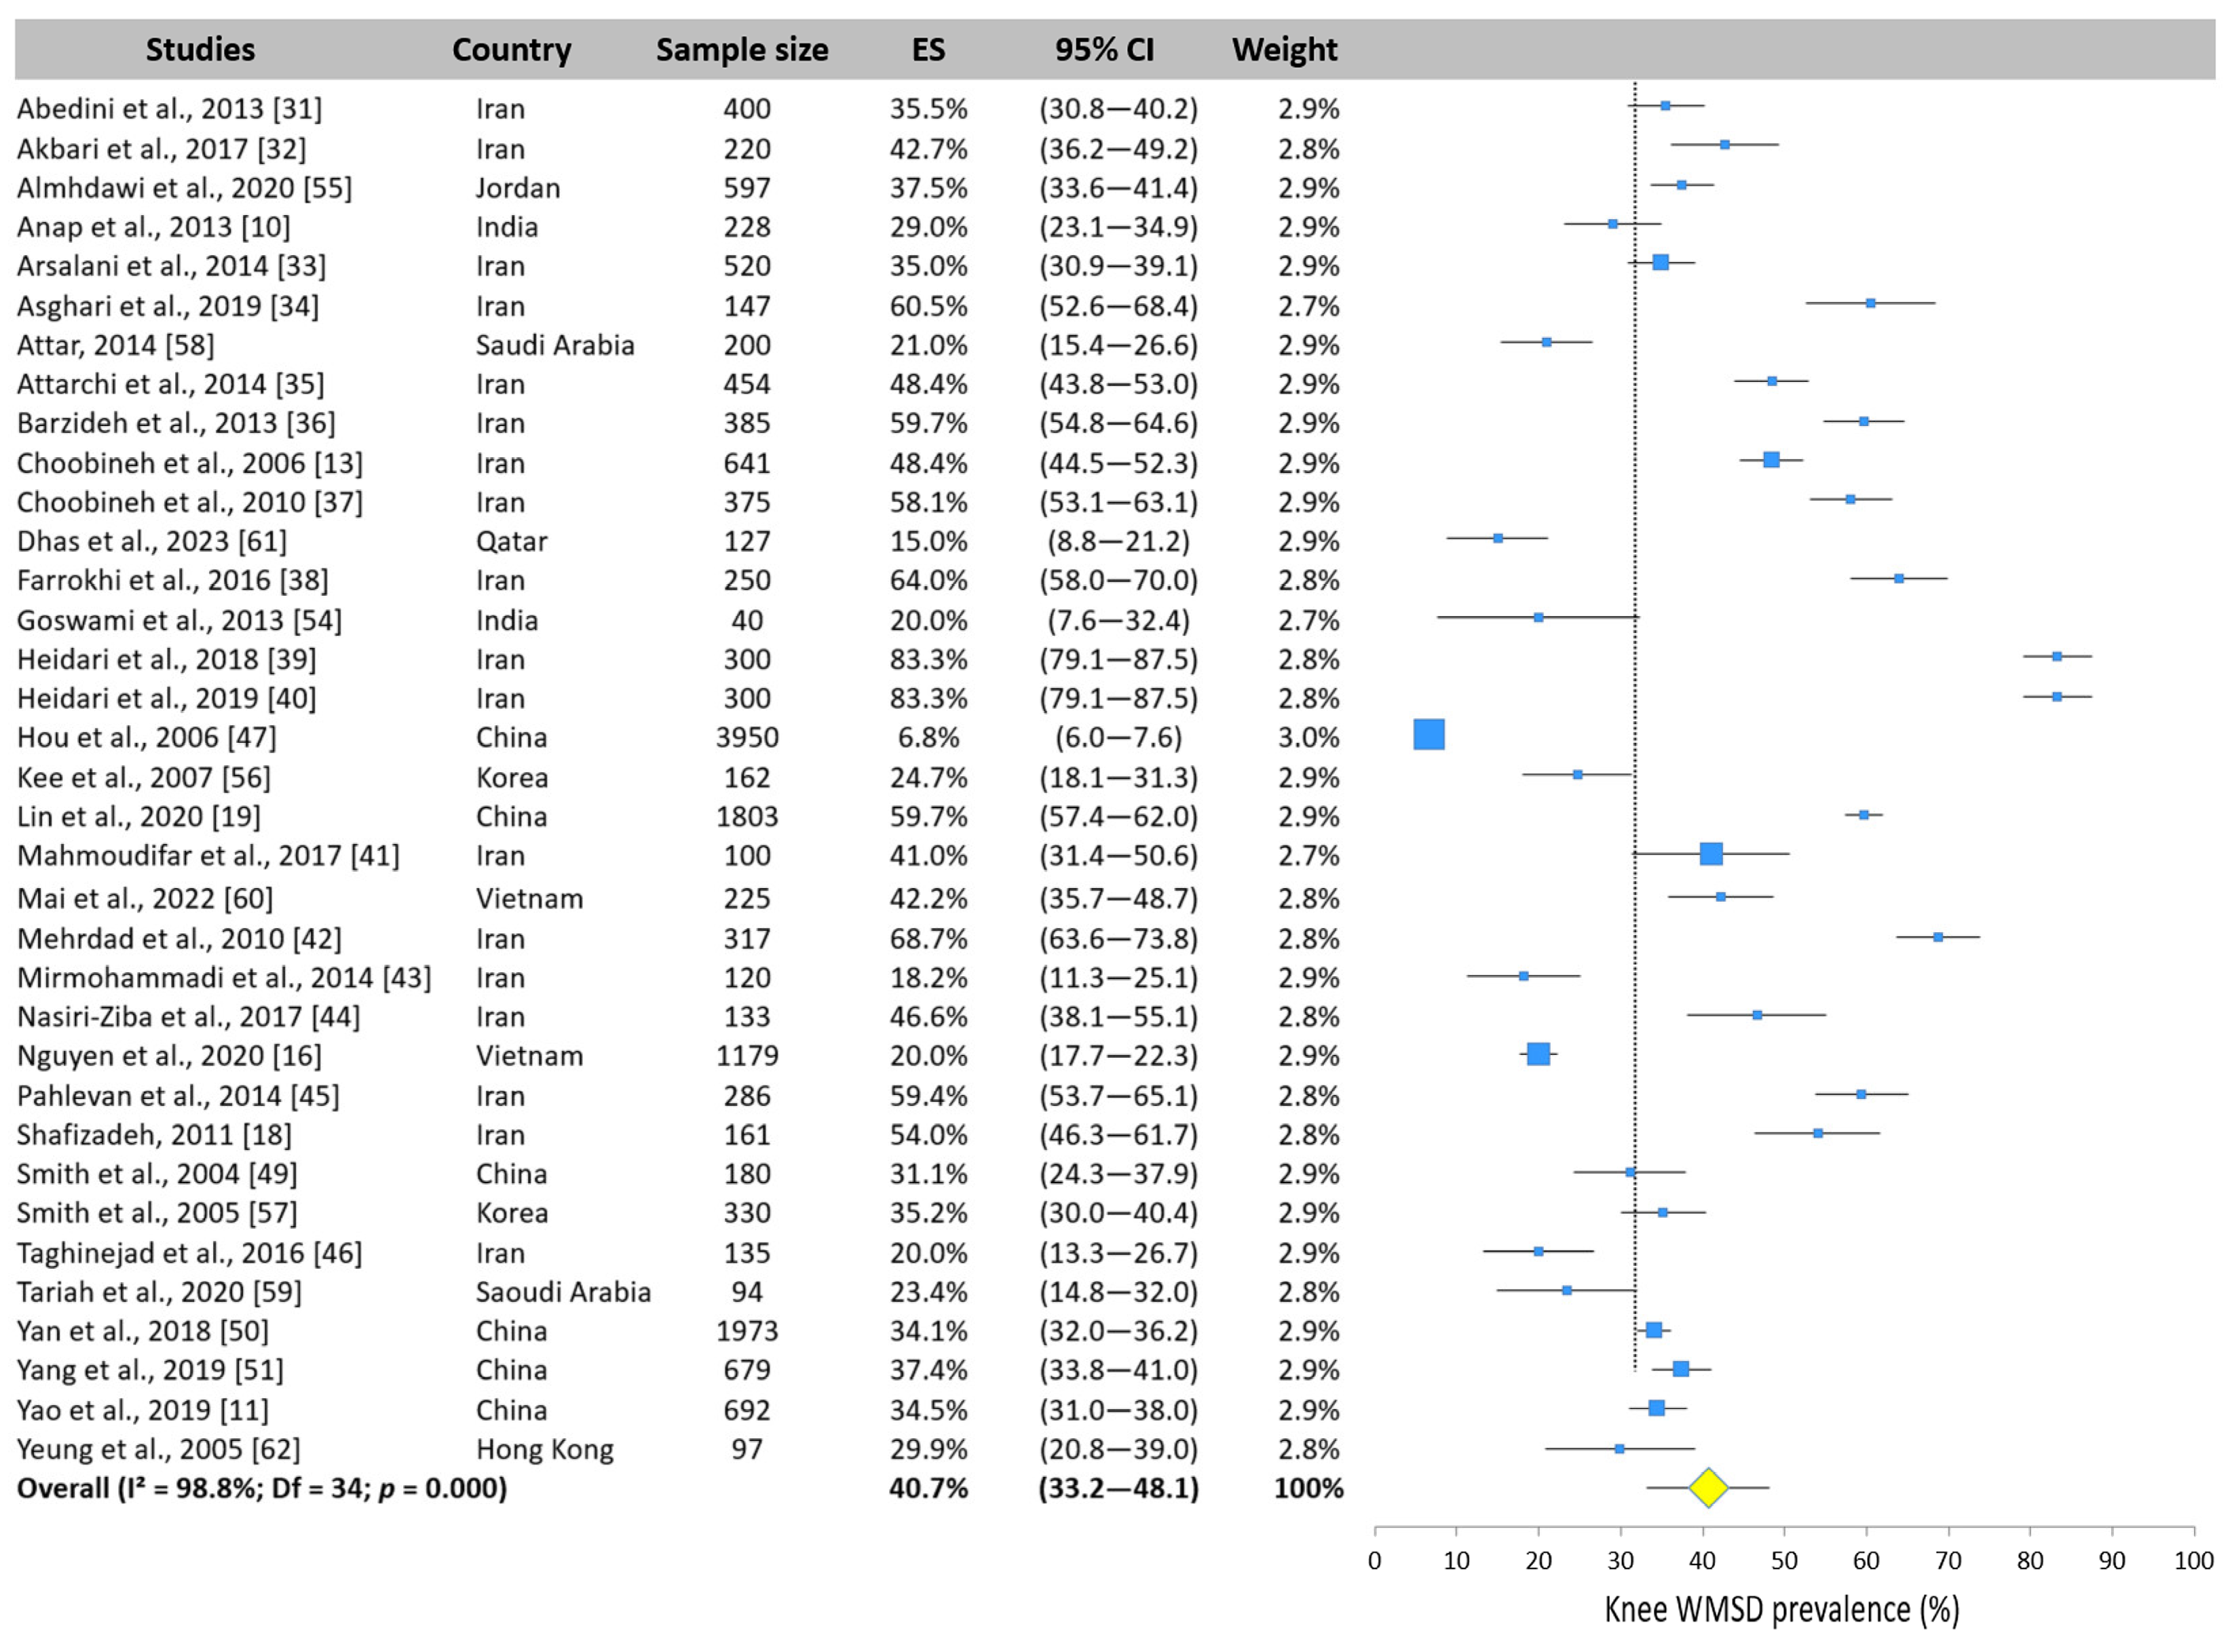
3.5.8. Knee WMSD Prevalence
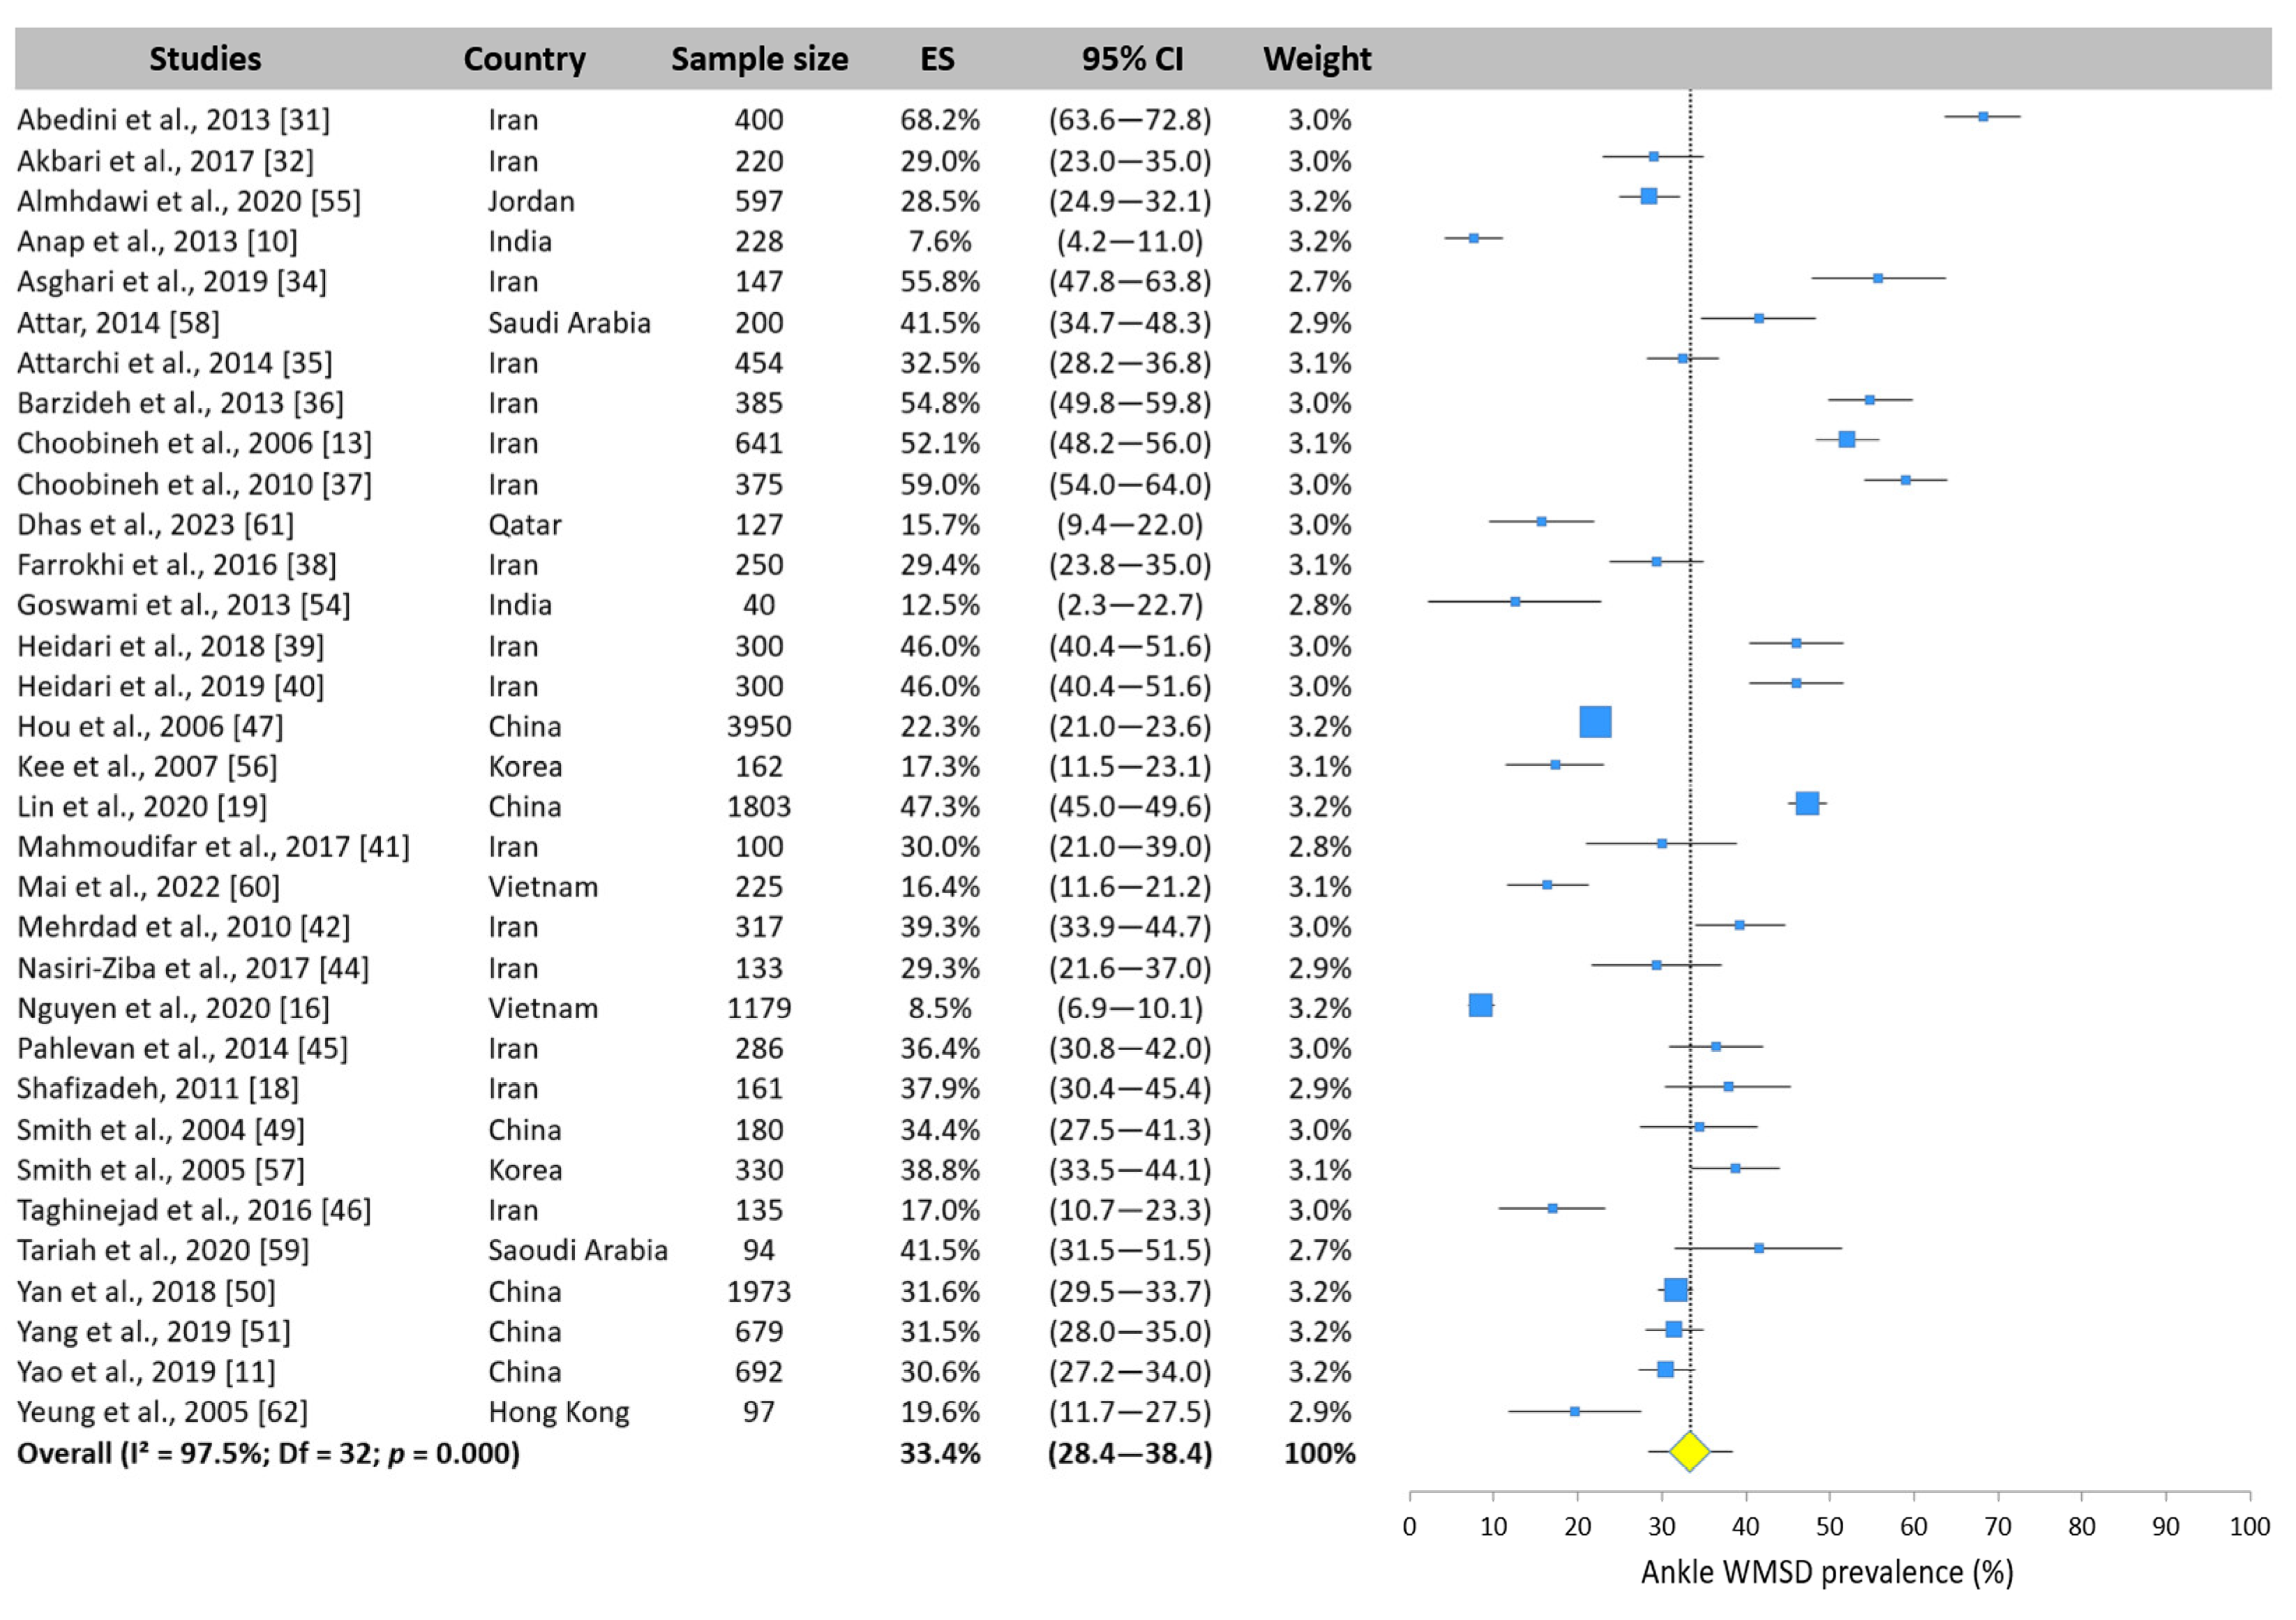
3.5.9. Ankle WMSD Prevalence
3.6. WMSD Subgroup Meta-Analysis
4. Discussion
5. Conclusions
Author Contributions
Funding
Institutional Review Board Statement
Informed Consent Statement
Data Availability Statement
Conflicts of Interest
References
- Punnett, L.; Wegman, D.H. Work-related musculoskeletal disorders: The epidemiologic evidence and the debate. J. Electromyogr. Kinesiol. 2004, 14, 13–23. [Google Scholar] [CrossRef] [PubMed]
- Clari, M.; Godono, A.; Garzaro, G.; Voglino, G.; Gualano, M.R.; Migliaretti, G.; Gullino, A.; Ciocan, C.; Dimonte, V. Prevalence of musculoskeletal disorders among perioperative nurses: A systematic review and META-analysis. BMC Musculoskelet. Disord. 2021, 22, 226. [Google Scholar] [CrossRef] [PubMed]
- Köse Tosunöz, İ.; Oztunç, G. Low Back Pain in Nurses. Int. J. Caring Sci. 2017, 10, 1728–1732. [Google Scholar]
- Keskin, İ.; Çınar, E.; Güvercin, E.; Baklacı, M.; Kirazlı, Y. Assessment of Prevalence of Neck Pain and Related Factors in Nurses Working in a University Hospital. Turk. J. Osteoporos. 2024, 30, 55–63. [Google Scholar] [CrossRef]
- Kooienga, S.A.; Rasmor, M. Shoulder Pain Assessment for the Occupational Health Nurse. Workplace Health Saf. 2016, 64, 448–452. [Google Scholar] [CrossRef]
- Diaz, J.H. Carpal tunnel syndrome in female nurse anesthetists versus operating room nurses: Prevalence, laterality, and impact of handedness. Anesth. Analg. 2001, 93, 975–980. [Google Scholar] [CrossRef]
- Sun, W.; Yin, L.; Zhang, T.; Zhang, H.; Zhang, R.; Cai, W. Prevalence of Work-Related Musculoskeletal Disorders among Nurses: A Meta-Analysis. Iran. J. Public Health 2023, 52, 463–475. [Google Scholar] [CrossRef]
- Muir, K.J.; Porat-Dahlerbruch, J.; Nikpour, J.; Leep-Lazar, K.; Lasater, K. Top Factors in Nurses Ending Health Care Employment Between 2018 and 2021. JAMA Netw. Open 2024, 7, e244121. [Google Scholar] [CrossRef]
- World Health Organization. Density of Nursing and Obstetrical Staff (Per 10,000 Inhabitants). Available online: https://data.who.int/fr/indicators/i/B54EB15/5C8435F (accessed on 12 February 2025).
- Anap, D.; Iyer, C.; Rao, K. Work related musculoskeletal disorders among hospital nurses in rural Maharashtra, India: A multi centre survey. Int. J. Res. Med Sci. 2013, 1, 101–107. [Google Scholar] [CrossRef]
- Yao, Y.; Zhao, S.; An, Z.; Wang, S.; Li, H.; Lu, L.; Yao, S. The associations of work style and physical exercise with the risk of work-related musculoskeletal disorders in nurses. Int. J. Occup. Med. Environ. Health 2019, 32, 15–24. [Google Scholar] [CrossRef]
- Smith, D.R.; Mihashi, M.; Adachi, Y.; Koga, H.; Ishitake, T. A detailed analysis of musculoskeletal disorder risk factors among Japanese nurses. J. Saf. Res. 2006, 37, 195–200. [Google Scholar] [CrossRef] [PubMed]
- Choobineh, A.; Rajaeefard, A.; Neghab, M. Association Between Perceived Demands and Musculoskeletal Disorders Among Hospital Nurses of Shiraz University of Medical Sciences: A Questionnaire Survey. Int. J. Occup. Saf. Ergon. 2006, 12, 409–416. [Google Scholar] [CrossRef] [PubMed]
- Wang, K.; Zeng, X.; Li, J.; Guo, Y.; Wang, Z. The prevalence and risk factors of work-related musculoskeletal disorders among nurses in China: A systematic review and meta-analysis. Int. J. Nurs. Stud. 2024, 157, 104826. [Google Scholar] [CrossRef]
- Saberipour, B.; Ghanbari, S.; Zarea, K.; Gheibizadeh, M.; Zahedian, M. Investigating prevalence of musculoskeletal disorders among Iranian nurses: A systematic review and meta-analysis. Clin. Epidemiol. Glob. Health 2019, 7, 513–518. [Google Scholar] [CrossRef]
- Nguyen, T.H.; Hoang, D.L.; Hoang, T.G.; Pham, M.K.; Bodin, J.; Dewitte, J.D.; Roquelaure, Y. Prevalence and Characteristics of Multisite Musculoskeletal Symptoms among District Hospital Nurses in Haiphong, Vietnam. BioMed Res. Int. 2020, 2020, 3254605. [Google Scholar] [CrossRef]
- Almhdawi, K.A.; Alrabbaie, H.; Kanaan, S.F.; Alahmar, M.R.; Oteir, A.O.; Mansour, Z.M.; Obeidat, D.S. The prevalence of upper quadrants work-related musculoskeletal disorders and their predictors among registered nurses. Work 2021, 68, 1035–1047. [Google Scholar] [CrossRef]
- Shafizadeh, K.R. Prevalence of musculoskeletal disorders among paramedics working in a large hospital in Ahwaz, southwestern Iran in 2010. Int. J. Occup. Environ. Med. 2011, 2, 157–165. [Google Scholar] [PubMed]
- Lin, S.C.; Lin, L.L.; Liu, C.J.; Fang, C.K.; Lin, M.H. Exploring the factors affecting musculoskeletal disorders risk among hospital nurses. PLoS ONE 2020, 15, e0231319. [Google Scholar] [CrossRef]
- Soroush, A.; Shamsi, M.; Izadi, N.; Heydarpour, B.; Samadzadeh, S.; Shahmohammadi, A. Musculoskeletal Disorders as Common Problems among Iranian Nurses: A Systematic Review and Meta-analysis. Int. J. Prev. Med. 2018, 9, 27. [Google Scholar] [CrossRef]
- Bos, E.; Krol, B.; van der Star, L.; Groothoff, J. Risk factors and musculoskeletal complaints in non-specialized nurses, IC nurses, operation room nurses, and X-ray technologists. Int. Arch. Occup. Environ. Health 2007, 80, 198–206. [Google Scholar] [CrossRef]
- Kgakge, K.; Hlongwa, M.; Nwagbara, U.I.; Ginindza, T. The distribution of work-related musculoskeletal disorders among nurses in sub-Saharan Africa: A scoping review. Syst. Rev. 2024, 13, 273. [Google Scholar] [CrossRef] [PubMed]
- Gorce, P.; Jacquier-Bret, J. Work-Related Musculoskeletal Disorder Prevalence by Body Area Among Nurses in Europe: Systematic Review and Meta-Analysis. J. Funct. Morphol. Kinesiol. 2025, 10, 66. [Google Scholar] [CrossRef]
- Harris, J.D.; Quatman, C.E.; Manring, M.M.; Siston, R.A.; Flanigan, D.C. How to Write a Systematic Review. Am. J. Sports Med. 2014, 42, 2761–2768. [Google Scholar] [CrossRef] [PubMed]
- Kuorinka, I.; Jonsson, B.; Kilbom, A.; Vinterberg, H.; Biering-Sørensen, F.; Andersson, G.; Jørgensen, K. Standardised Nordic questionnaires for the analysis of musculoskeletal symptoms. Appl. Ergon. 1987, 18, 233–237. [Google Scholar] [CrossRef]
- Downes, M.J.; Brennan, M.L.; Williams, H.C.; Dean, R.S. Development of a critical appraisal tool to assess the quality of cross-sectional studies (AXIS). BMJ Open 2016, 6, e011458. [Google Scholar] [CrossRef] [PubMed]
- Hermanson, J.E.; Choi, S.D. Study of musculoskeletal risks of the office-based surgeries. Work 2012, 41, 1940–1943. [Google Scholar] [CrossRef]
- Banque_Mondiale. Hospital Beds (Per 1000 People). Available online: https://donnees.banquemondiale.org/indicateur/SH.MED.BEDS.ZS (accessed on 6 February 2025).
- Neyeloff, J.L.; Fuchs, S.C.; Moreira, L.B. Meta-analyses and Forest plots using a microsoft excel spreadsheet: Step-by-step guide focusing on descriptive data analysis. BMC Res. Notes 2012, 5, 52. [Google Scholar] [CrossRef]
- CochraneTraining. Cochrane Handbook for Systematic Reviews of Interventions. Available online: https://training.cochrane.org/handbook/archive/v6/chapter-10#section-10-10-2 (accessed on 2 February 2022).
- Abedini, R.; Choobineh, A.; Hasanzadeh, J. Musculoskeletal Load Assessment in Hospital Nurses with Patient Transfer Activity. Int. J. Occup. Hyg. 2013, 5, 39–45. [Google Scholar]
- Akbari, H.; Akbari, H.; Bagheri, H.; Gholami, F.; Ghasemi, M. Assessing the Risk of Manual Handling of Patients and Its Relationship with the Prevalence of Musculoskeletal Disorders Among Nursing Staff: Performance Evaluation of the MAPO and PTAI Methods. Iran. Red. Crescent Med. J. 2017, 19, e39860. [Google Scholar] [CrossRef]
- Arsalani, N.; Fallahi-Khoshknab, M.; Josephson, M.; Lagerstrom, M. Musculoskeletal disorders and working conditions among Iranian nursing personnel. Int. J. Occup. Saf. Ergon. 2014, 20, 671–680. [Google Scholar] [CrossRef]
- Asghari, E.; Dianat, I.; Abdollahzadeh, F.; Mohammadi, F.; Asghari, P.; Jafarabadi, M.A.; Castellucci, H.I. Musculoskeletal pain in operating room nurses: Associations with quality of work life, working posture, socio-demographic and job characteristics. Int. J. Ind. Ergon. 2019, 72, 330–337. [Google Scholar] [CrossRef]
- Attarchi, M.; Raeisi, S.; Namvar, M.; Golabadi, M. Association between shift working and musculoskeletal symptoms among nursing personnel. Iran. J. Nurs. Res. 2014, 19, 309–314. [Google Scholar]
- Barzideh, M.; Choobineh, A.; Tabatabaee, H.R. Job stress dimensions and their relationship to musculoskeletal disorders in Iranian nurses. Work 2013, 47, 423–429. [Google Scholar] [CrossRef]
- Choobineh, A.; Movahed, M.; Tabatabaie, S.H.; Kumashiro, M. Perceived demands and musculoskeletal disorders in operating room nurses of Shiraz city hospitals. Ind. Health 2010, 48, 74–84. [Google Scholar] [CrossRef]
- Farrokhi, E.; Habibi, E.; Mansourian, M. Risk Assessment of Musculoskeletal Disorders Related to Patient Transfer Tasks Using the Direct Nurse Observation Instrument Method. Jundishapur J. Health Sci. 2016, 8, e35936. [Google Scholar] [CrossRef]
- Heidari, M.; Borujeni, M.G.; Khosravizad, M. Health-promoting Lifestyles of Nurses and Its Association with Musculoskeletal Disorders: A Cross-Sectional Study. Am. J. Lifestyle Med. 2018, 8, 72–78. [Google Scholar] [CrossRef] [PubMed]
- Heidari, M.; Borujeni, M.G.; Rezaei, P.; Kabirian Abyaneh, S. Work-Related Musculoskeletal Disorders and Their Associated Factors in Nurses: A Cross-Sectional Study in Iran. Malays. J. Med. Sci. 2019, 26, 122–130. [Google Scholar] [CrossRef]
- Mahmoudifar, Y.; Seyedamini, B. Ergonomic relationship during work in nursing staff of intensive care unit with operating room. Int. Arch. Health Sci. 2017, 4, 42. [Google Scholar] [CrossRef]
- Mehrdad, R.; Dennerlein, J.T.; Haghighat, M.; Aminian, O. Association between psychosocial factors and musculoskeletal symptoms among Iranian nurses. Am. J. Ind. Med. 2010, 53, 1032–1039. [Google Scholar] [CrossRef]
- Mirmohammadi, M.; Charati, J. Prevalence of Work-related Musculoskeletal Disorders and Associated Risk Factors among Nurses in a Public Hospital. Iran. J. Health Sci. 2014, 2, 55–61. [Google Scholar] [CrossRef]
- Nasiri Ziba, F.; Nosrati, S.; Hanani, S. The prevalence of musculoskeletal disorders among undergraduates and technicians of operating room of the educational hospitals affiliated with Iran University of Medical Sciences in 2016 ARTICLE INFO ABSTRACT. Nurs. Pract. Today 2017, 4, 134–142. [Google Scholar]
- Pahlevan, D.; Azizzadeh, M.; Esmaili, A.; Ghorbani, R.; Mirmohammadkhani, M. Association of Musculoskeletal Complaints With Psychosocial Factors Among Nurses in Semnan Hospitals. Middle East. J. Rehabil. Health 2014, 1, e20841. [Google Scholar] [CrossRef]
- Taghinejad, H.; Azadi, A.; Suhrabi, Z.; Sayedinia, M. Musculoskeletal Disorders and Their Related Risk Factors Among Iranian Nurses. Biotech. Health Sci. 2016, 3, e34473. [Google Scholar] [CrossRef]
- Hou, J.Y.; Shiao, J.S. Risk factors for musculoskeletal discomfort in nurses. J. Nurs. Res. 2006, 14, 228–236. [Google Scholar] [CrossRef] [PubMed]
- Smith, D.R.; Wei, N.; Kang, L.; Wang, R.-S. Musculoskeletal disorders among professional nurses in mainland China. J. Prof. Nurs. 2004, 20, 390–395. [Google Scholar] [CrossRef]
- Smith, D.R.; Wei, N.; Zhao, L.; Wang, R.S. Musculoskeletal complaints and psychosocial risk factors among Chinese hospital nurses. Occup. Med. 2004, 54, 579–582. [Google Scholar] [CrossRef]
- Yan, P.; Yang, Y.; Zhang, L.; Li, F.; Huang, A.; Wang, Y.; Dai, Y.; Yao, H. Correlation analysis between work-related musculoskeletal disorders and the nursing practice environment, quality of life, and social support in the nursing professionals. Medicine 2018, 97, e0026. [Google Scholar] [CrossRef]
- Yang, S.; Lu, J.; Zeng, J.; Wang, L.; Li, Y. Prevalence and Risk Factors of Work-Related Musculoskeletal Disorders Among Intensive Care Unit Nurses in China. Workplace Health Saf. 2019, 67, 275–287. [Google Scholar] [CrossRef]
- Behera, P.; Majumdar, A.; Verma, M.; Kumarasamy, A.P.; Mishra, N. Musculoskeletal pain affecting undergraduate nursing students: A cross sectional study on the prevalence and the associated factors. J. Prof. Nurs. 2023, 49, 135–144. [Google Scholar] [CrossRef]
- Chandralekha, K.; Joseph, M.; Joseph, B. Work-related Musculoskeletal Disorders and Quality of Life Among Staff Nurses in a Tertiary Care Hospital of Bangalore. Indian J. Occup. Environ. Med. 2022, 26, 178–182. [Google Scholar] [CrossRef]
- Goswami, S.; Haldar, P.; Sahu, S. An ergonomic study of postural stress of nurses working in orthopedic wards. Int. J. Occup. Saf. Health 2013, 3, 26–31. [Google Scholar] [CrossRef]
- Almhdawi, K.A.; Alrabbaie, H.; Kanaan, S.F.; Oteir, A.O.; Jaber, A.F.; Ismael, N.T.; Obaidat, D.S. Predictors and prevalence of lower quadrant work-related musculoskeletal disorders among hospital-based nurses: A cross-sectional study. J. Back. Musculoskelet. Rehabil. 2020, 33, 885–896. [Google Scholar] [CrossRef] [PubMed]
- Attar, S.M. Frequency and risk factors of musculoskeletal pain in nurses at a tertiary centre in Jeddah, Saudi Arabia: A cross sectional study. BMC Res. Notes. 2014, 7, 61. [Google Scholar] [CrossRef] [PubMed]
- Tariah, H.A.; Nafai, S.; Alajmi, M.; Almutairi, F.; Alanazi, B. Work-related musculoskeletal disorders in nurses working in the Kingdom of Saudi Arabia. Work 2020, 65, 421–428. [Google Scholar] [CrossRef]
- Mai, H.B.; Kim, J. The Role of Job Resources in the Relationship between Job Demands and Work-Related Musculoskeletal Disorders among Hospital Nurses in Thua Thien Hue Province, Vietnam. Int. J. Environ. Res. Public Health 2022, 19, 4774. [Google Scholar] [CrossRef]
- Dhas, B.N.; Joseph, L.; Jose, J.A.; Zeeser, J.M.; Devaraj, J.P.; Chockalingam, M. Prevalence of work-related musculoskeletal disorders among pediatric long-term ventilatory care unit nurses: Descriptive cross-sectional study. J. Pediatr. Nurs. 2023, 69, e114–e119. [Google Scholar] [CrossRef]
- Yeung, S.S.; Genaidy, A.; Deddens, J.; Sauter, S. The relationship between protective and risk characteristics of acting and experienced workload, and musculoskeletal disorder cases among nurses. J. Saf. Res. 2005, 36, 85–95. [Google Scholar] [CrossRef]
- Kee, D.; Seo, S.R. Musculoskeletal disorders among nursing personnel in Korea. Int. J. Ind. Ergon. 2007, 37, 207–212. [Google Scholar] [CrossRef]
- Smith, D.R.; Choe, M.A.; Jeon, M.Y.; Chae, Y.R.; An, G.J.; Jeong, J.S. Epidemiology of musculoskeletal symptoms among Korean hospital nurses. Int. J. Occup. Saf. Ergon. 2005, 11, 431–440. [Google Scholar] [CrossRef]
- World Health Organization. A Healthy Lifestyle—WHO Recommendations. Available online: https://www.who.int/europe/news-room/fact-sheets/item/a-healthy-lifestyle---who-recommendations (accessed on 14 February 2025).
- Ellapen, T. Work Related Musculoskeletal Disorders among Nurses: Systematic Review. J. Ergon. 2014, S4, S4-003. [Google Scholar] [CrossRef]
- Bernal, D.; Campos-Serna, J.; Tobias, A.; Vargas-Prada, S.; Benavides, F.G.; Serra, C. Work-related psychosocial risk factors and musculoskeletal disorders in hospital nurses and nursing aides: A systematic review and meta-analysis. Int. J. Nurs. Stud. 2015, 52, 635–648. [Google Scholar] [CrossRef] [PubMed]
- Chang, W.P.; Peng, Y.X. Differences between fixed day shift nurses and rotating and irregular shift nurses in work-related musculoskeletal disorders: A literature review and meta-analysis. J. Occup. Health 2021, 63, e12208. [Google Scholar] [CrossRef]
- Tavakkol, R.; Karimi, A.; Hassanipour, S.; Gharahzadeh, A.; Fayzi, R. A Multidisciplinary Focus Review of Musculoskeletal Disorders Among Operating Room Personnel. J. Multidiscip. Healthc. 2020, 13, 735–741. [Google Scholar] [CrossRef]
- Kgakge, K.; Chelule, P.K.; Zungu, L.I. Prevalence and risk factors for self-reported work-related musculoskeletal disorder symptoms among nurses in a tertiary public hospital in Botswana. Occup. Health S. Afr. 2019, 25, 92–96. [Google Scholar]
- Nkhata, L.; Esterhuizen, T.; Siziya, S.; Phiri, P.; Nkandu, E.; Shula, H. The Prevalence and Perceived Contributing Factors for Work-Related Musculoskeletal Disorders Among Nurses at the University Teaching Hospital in Lusaka, Zambia. Int. J. Public Health 2015, 3, 508–513. [Google Scholar] [CrossRef]
- Regassa, T.M.; Lema, T.B.; Garmomsa, G.N. Work Related Musculoskeletal Disorders and Associated Factors among Nurses Working in Jimma Zone Public Hospitals, South West Ethiopia. Occup. Med. Health Aff. 2018, 6, 1000279. [Google Scholar] [CrossRef]
- Abdalla, D.R.; Freitas, F.S.d.; Matheus, J.P.C.; Walsh, I.A.P.d.; Bertoncello, D. Postural biomechanical risks for nursing workers. Fisioter. Mov. 2014, 27, 421–427. [Google Scholar] [CrossRef]
- Szeto, G.P.Y.; Wong, K.T.; Law, K.Y.; Lee, E.W.C. A study of spinal kinematics in community nurses performing nursing tasks. Int. J. Ind. Ergon. 2013, 43, 203–209. [Google Scholar] [CrossRef]
- Jang, R.; Karwowski, W.; Quesada, P.M.; Rodrick, D.; Sherehiy, B.; Cronin, S.N.; Layer, J.K. Biomechanical evaluation of nursing tasks in a hospital setting. Ergonomics 2007, 50, 1835–1855. [Google Scholar] [CrossRef]
- Lee, M.J.; Wang, C.J.; Chang, J.H. Effectiveness of an ergonomic training with exercise program for work-related musculoskeletal disorders among hemodialysis nurses: A pilot randomized control trial. J. Saf. Res. 2024, 91, 481–491. [Google Scholar] [CrossRef]

| Body Area | Experience < 10 Years | Experience > 10 Years | ||||||||
|---|---|---|---|---|---|---|---|---|---|---|
| N | Sample Size | I2 | ES | 95% CI | N | Sample Size | I2 | ES | 95% CI | |
| Neck | 17 | 9368 | 96.0% | 49.2% | (41.9–56.4) | 13 | 4816 | 94.7% | 45.5% | (36.7–54.2) |
| Upper back | 12 | 6163 | 93.4% | 39.9% | (33.8–46.0) | 11 | 4046 | 91.5% | 31.0% | (24.7–37.3) |
| Lower back | 17 | 9368 | 96.1% | 56.3% | (48.6–63.9) | 13 | 4816 | 91.0% | 62.8% | (55.0–70.7) |
| Shoulder | 17 | 9368 | 94.9% | 45.1% | (38.9–51.3) | 12 | 4296 | 97.8% | 41.4% | (27.4–55.4) |
| Elbow | 15 | 8317 | 92.5% | 14.9% | (11.9–17.9) | 11 | 4014 | 98.7% | 19.0% | (8.0–30.0) |
| Wrist | 15 | 8317 | 96.5% | 34.6% | (28.3–40.9) | 10 | 3786 | 95.9% | 35.1% | (24.6–45.7) |
| Hip | 14 | 8184 | 96.8% | 21.4% | (16.1–26.6) | 9 | 3464 | 98.9% | 28.9% | (13.7–44.2) |
| Knee | 15 | 8317 | 95.6% | 40.9% | (34.5–47.2) | 12 | 4534 | 96.6% | 50.9% | (39.3–62.5) |
| Ankle | 15 | 8317 | 98.3% | 37.1% | (28.3–46.0) | 11 | 4014 | 97.3% | 31.8% | (21.0–42.6) |
| Overall | 16 | 9378 | 77.0% | 84.8% | (80.7–89.0) | 8 | 1999 | 42.1% | 83.8% | (78.4–89.2) |
| Body Area | 2004–2014 | 2015–2024 | ||||||||
|---|---|---|---|---|---|---|---|---|---|---|
| N | Sample Size | I2 | ES | 95% CI | N | Sample Size | I2 | ES | 95% CI | |
| Neck | 20 | 9972 | 98.2% | 39.2% | (30.3–48.1) | 19 | 9334 | 90.8% | 52.8% | (47.5–58.1) |
| Upper back | 18 | 9252 | 98.4% | 32.0% | (23.1–40.9) | 14 | 6079 | 82.7% | 36.1% | (32.1–40.1) |
| Lower back | 19 | 9852 | 96.4% | 55.3% | (47.2–63.4) | 19 | 9334 | 95.8% | 61.5% | (53.8–69.3) |
| Shoulder | 18 | 9332 | 97.9% | 40.7% | (31.4–50.0) | 19 | 9334 | 97.7% | 45.3% | (36.1–54.5) |
| Elbow | 16 | 8206 | 96.3% | 11.7% | (8.2–15.3) | 17 | 8954 | 97.2% | 17.8% | (12.4–23.2) |
| Wrist | 15 | 7978 | 98.2% | 34.2% | (24.3–44.1) | 17 | 8954 | 97.2% | 30.5% | (23.6–37.4) |
| Hip | 16 | 8206 | 96.7% | 18.4% | (13.7–23.1) | 14 | 8271 | 98.3% | 27.5% | (19.7–35.3) |
| Knee | 18 | 8846 | 98.7% | 37.9% | (26.7–49.1) | 17 | 8954 | 97.3% | 43.4% | (35.3–51.5) |
| Ankle | 16 | 8206 | 97.1% | 35.8% | (27.9–43.8) | 17 | 8954 | 97.8% | 31.1% | (23.7–38.6) |
| Overall | 15 | 8944 | 76.5% | 84.0% | (79.4–88.5) | 14 | 7201 | 70.7% | 84.5% | (80.1–88.8) |
Disclaimer/Publisher’s Note: The statements, opinions and data contained in all publications are solely those of the individual author(s) and contributor(s) and not of MDPI and/or the editor(s). MDPI and/or the editor(s) disclaim responsibility for any injury to people or property resulting from any ideas, methods, instructions or products referred to in the content. |
© 2025 by the authors. Licensee MDPI, Basel, Switzerland. This article is an open access article distributed under the terms and conditions of the Creative Commons Attribution (CC BY) license (https://creativecommons.org/licenses/by/4.0/).
Share and Cite
Jacquier-Bret, J.; Gorce, P. Work-Related Musculoskeletal Disorder Prevalence by Body Area Among Nurses in Asia: Systematic Review and Meta-Analysis. Int. J. Environ. Res. Public Health 2025, 22, 652. https://doi.org/10.3390/ijerph22040652
Jacquier-Bret J, Gorce P. Work-Related Musculoskeletal Disorder Prevalence by Body Area Among Nurses in Asia: Systematic Review and Meta-Analysis. International Journal of Environmental Research and Public Health. 2025; 22(4):652. https://doi.org/10.3390/ijerph22040652
Chicago/Turabian StyleJacquier-Bret, Julien, and Philippe Gorce. 2025. "Work-Related Musculoskeletal Disorder Prevalence by Body Area Among Nurses in Asia: Systematic Review and Meta-Analysis" International Journal of Environmental Research and Public Health 22, no. 4: 652. https://doi.org/10.3390/ijerph22040652
APA StyleJacquier-Bret, J., & Gorce, P. (2025). Work-Related Musculoskeletal Disorder Prevalence by Body Area Among Nurses in Asia: Systematic Review and Meta-Analysis. International Journal of Environmental Research and Public Health, 22(4), 652. https://doi.org/10.3390/ijerph22040652