Short-Term Effects of Extreme Heat, Cold, and Air Pollution Episodes on Excess Mortality in Luxembourg
Abstract
1. Introduction
2. Materials and Methods
2.1. Data Sources
2.2. Identification of Environmental Episodes
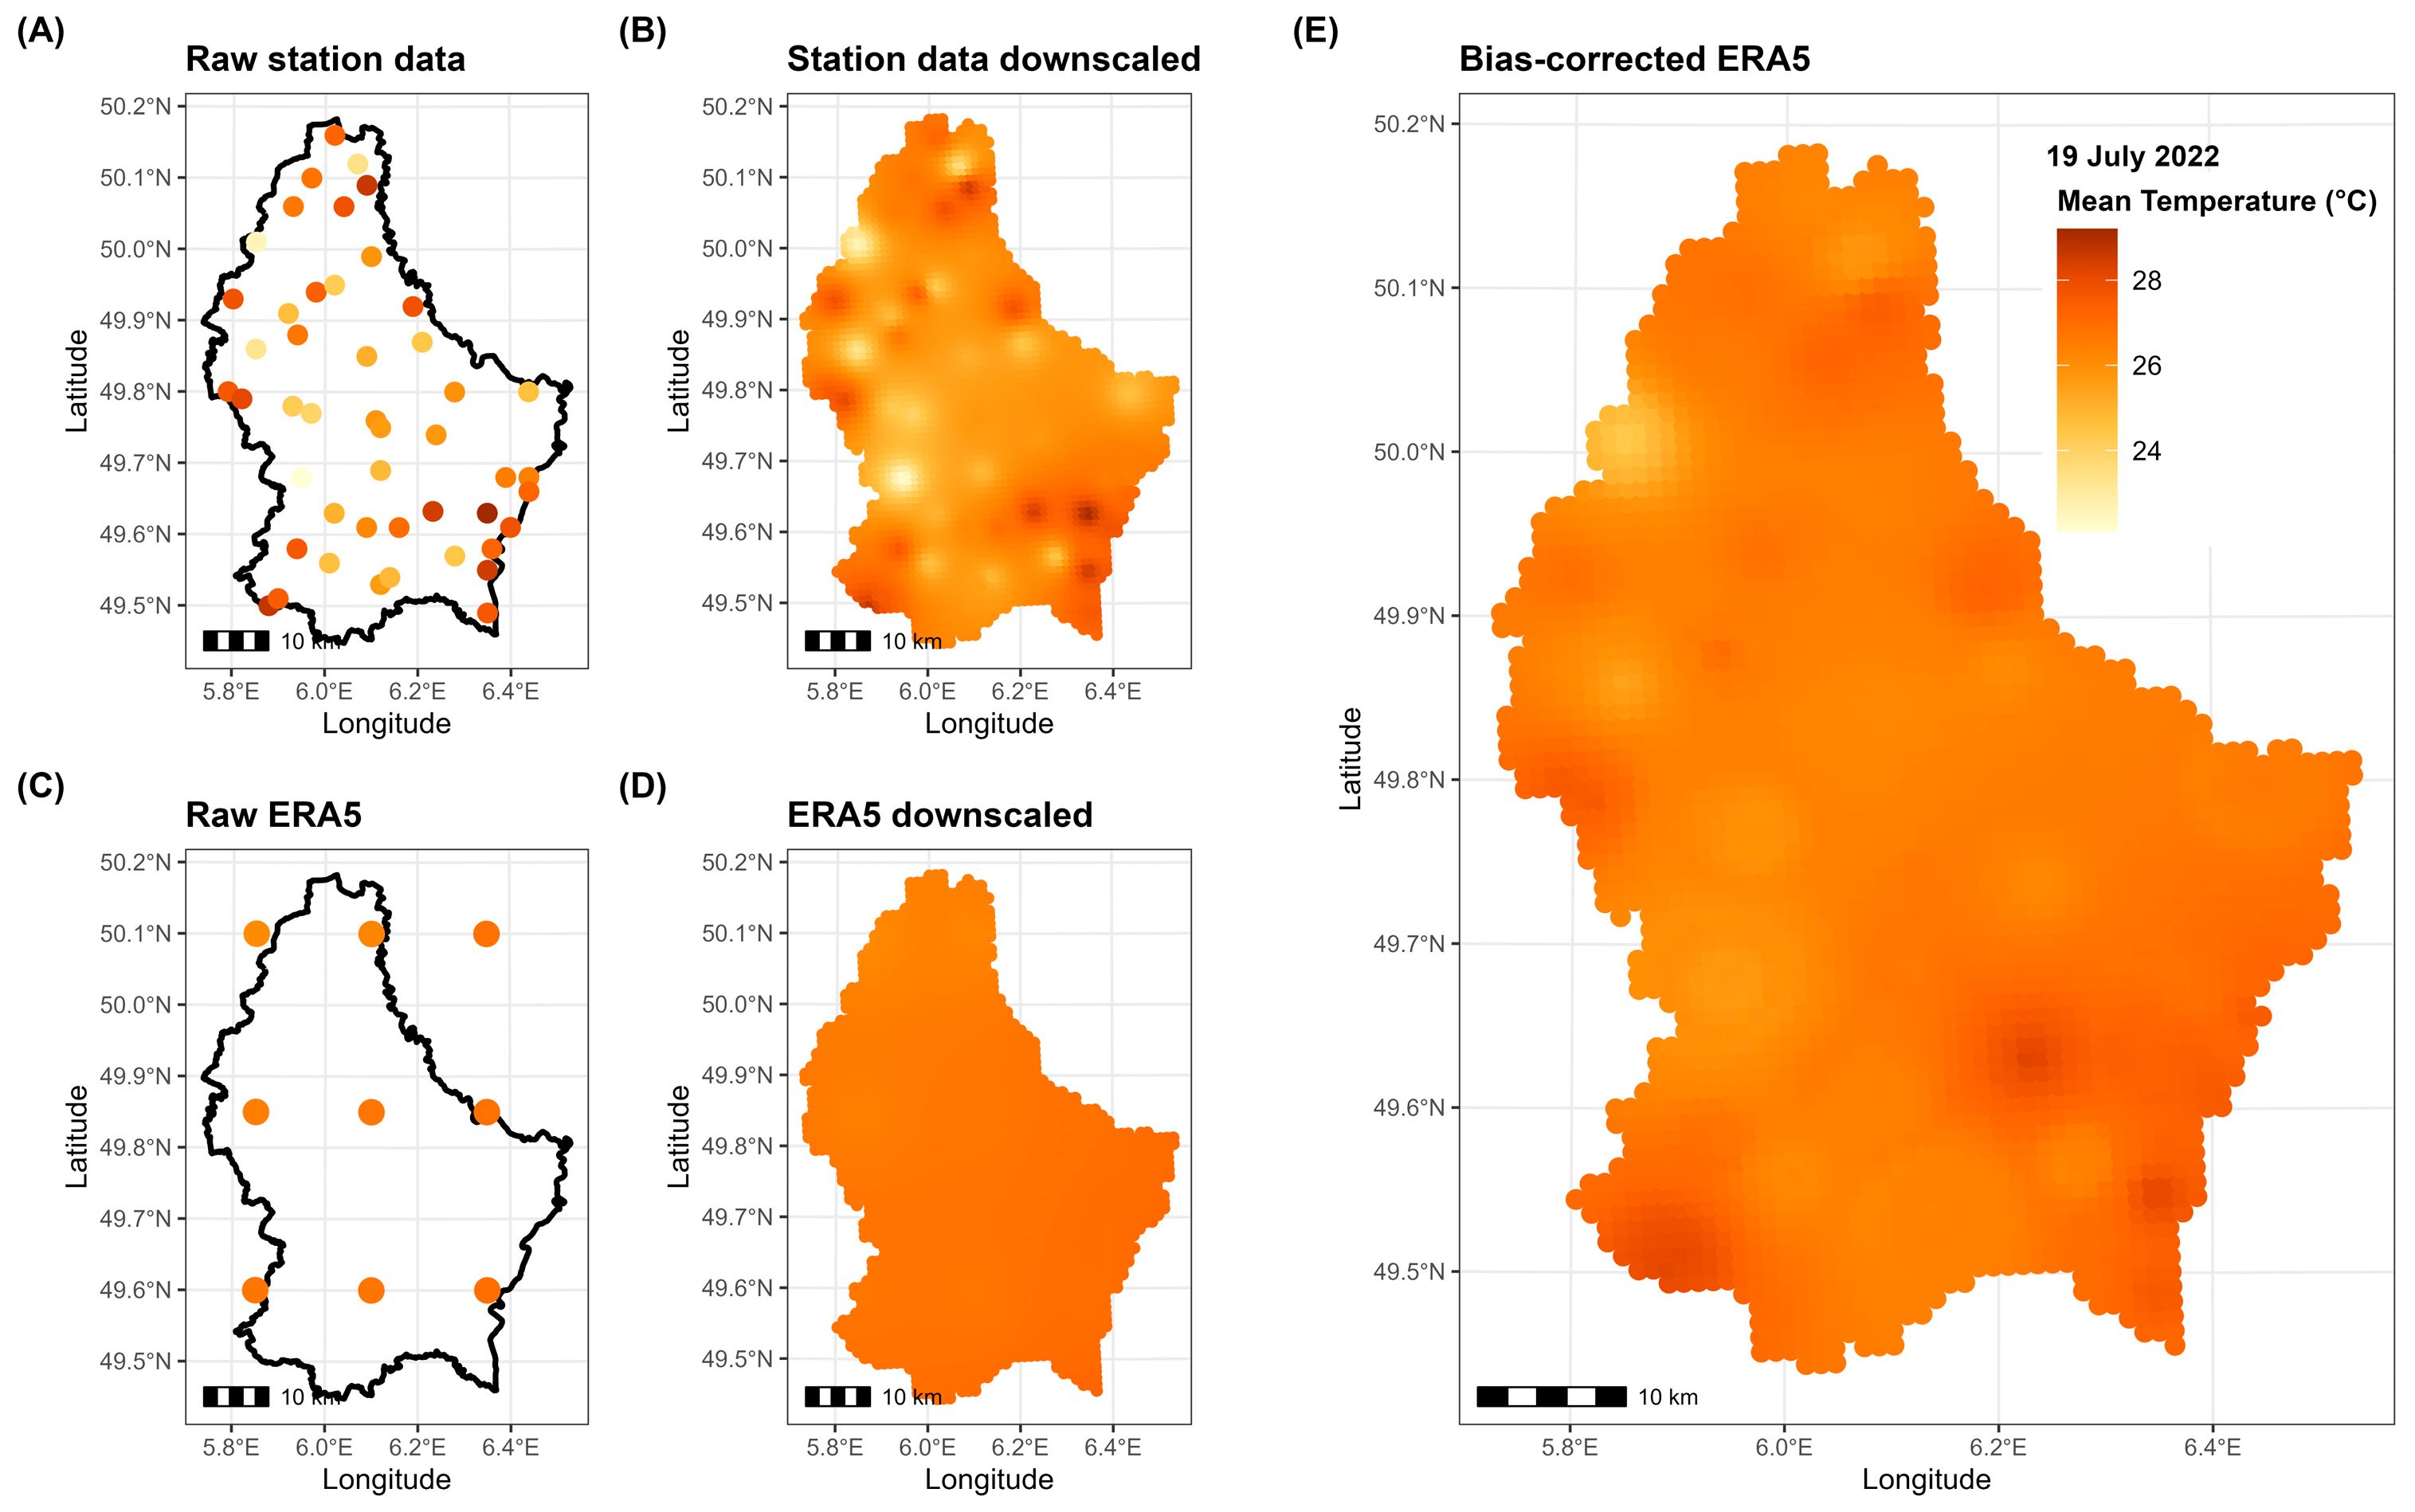
- Data extraction: daily gridded data were retrieved from numerical models and station measurements for the period 1998–2023, covering the Grand Duchy of Luxembourg;
- Downscaling: both raw simulations and station measurements were downscaled to a 1 km × 1 km grid using Inverse Distance-Weighted (IDW) interpolation with the R package gstat;
- Bias correction: at each point of the 1 km grid, downscaled simulations were bias-corrected using downscaled observations as a reference. This was achieved using monthly Empirical Quantile Mapping (EQM) with the R package qmap, which aligns the statistical distribution of the simulations with that of the station measurements month by month.
2.3. Statistical Modeling of Excess Mortality
3. Results
3.1. Occurrence of Environmental Episodes
3.2. Descriptive Analysis of Excess Mortality
3.3. Statistical Modeling of Excess Mortality
3.4. Attributable Mortality Due to Environmental Episodes
3.5. Occurrence and Intensity of Extreme Excess Mortality
4. Discussion
5. Conclusions
Funding
Institutional Review Board Statement
Informed Consent Statement
Data Availability Statement
Acknowledgments
Conflicts of Interest
References
- Watts, N.; Amann, M.; Ayeb-Karlsson, S.; Belesova, K.; Bouley, T.; Boykoff, M.; Byass, P.; Cai, W.; Campbell-Lendrum, D.; Chambers, J.; et al. The Lancet Countdown on Health and Climate Change: From 25 Years of Inaction to a Global Transformation for Public Health. Lancet 2018, 391, 581–630. [Google Scholar] [CrossRef] [PubMed]
- Anderson, G.B.; Bell, M.L. Heatwaves in the United States: Mortality Risk During Heatwaves and Effect Modification by Heatwave Characteristics in 43 U.S. Communities. Environ. Health Perspect. 2011, 119, 210–218. [Google Scholar] [CrossRef]
- Gasparrini, A.; Guo, Y.; Hashizume, M.; Lavigne, E.; Zanobetti, A.; Schwartz, J.; Tobias, A.; Tong, S.; Rocklöv, J.; Forsberg, B.; et al. Mortality Risk Attributable to High and Low Ambient Temperature: A Multicountry Observational Study. Lancet 2015, 386, 369–375. [Google Scholar] [CrossRef]
- Arsad, F.S.; Hod, R.; Ahmad, N.; Ismail, R.; Mohamed, N.; Baharom, M.; Osman, Y.; Radi, M.F.M.; Tangang, F. The Impact of Heatwaves on Mortality and Morbidity and the Associated Vulnerability Factors: A Systematic Review. Int. J. Environ. Res. Public Health 2022, 19, 16356. [Google Scholar] [CrossRef]
- Goggins, W.B.; Chan, E.Y.; Ng, E.; Ren, C. Effect Modification of the Association Between Short-Term Meteorological Factors and Mortality by Urban Heat Islands in Hong Kong. PLoS ONE 2012, 7, e38551. [Google Scholar] [CrossRef] [PubMed]
- Sun, S.; Laden, F.; Hart, J.; Qiu, H.; Wang, Y.; Wong, C.; Lee, R.; Tian, L. Seasonal Temperature Variability and Emergency Hospital Admissions for Respiratory Diseases: A Population-Based Cohort Study. Thorax 2018, 73, 951–958. [Google Scholar] [CrossRef]
- Pope, C.A., III; Burnett, R.T.; Thun, M.J.; Calle, E.E.; Krewski, D.; Ito, K.; Thurston, G.D. Lung Cancer, Cardiopulmonary Mortality, and Long-Term Exposure to Fine Particulate Air Pollution. JAMA 2002, 287, 1132–1141. [Google Scholar] [CrossRef] [PubMed]
- Crouse, D.L.; Peters, P.A.; van Donkelaar, A.; Goldberg, M.S.; Villeneuve, P.J.; Brion, O.; Khan, S.; Atari, D.O.; Jerrett, M.; Pope, C.A., III; et al. Risk of Nonaccidental and Cardiovascular Mortality in Relation to Long-Term Exposure to Low Concentrations of Fine Particulate Matter: A Canadian National-Level Cohort Study. Environ. Health Perspect. 2012, 120, 708–714. [Google Scholar] [CrossRef]
- Stafoggia, M.; Samoli, E.; Alessandrini, E.; Cadum, E.; Ostro, B.; Berti, G.; Faustini, A.; Jacquemin, B.; Linares, C.; Pascal, M.; et al. Short-Term Associations Between Fine and Coarse Particulate Matter and Hospitalizations in Southern Europe: Results from the MED-PARTICLES Project. Environ. Health Perspect. 2013, 121, 1026–1033. [Google Scholar] [CrossRef]
- Demoury, C.; Aerts, R.; Berete, F.; Lefebvre, W.; Pauwels, A.; Vanpoucke, C.; Van der Heyden, J.; De Clercq, E.M. Impact of Short-Term Exposure to Air Pollution on Natural Mortality and Vulnerable Populations: A Multi-City Case-Crossover Analysis in Belgium. Environ. Health 2024, 23, 11. [Google Scholar] [CrossRef]
- Vicedo-Cabrera, A.M.; Scovronick, N.; Sera, F.; Royé, D.; Schneider, R.; Tobias, A.; Astrom, C.; Honda, Y.; Hondula, D.M.; Abrutzky, R.; et al. The Burden of Heat-Related Mortality Attributable to Recent Human-Induced Climate Change. Nat. Clim. Change 2021, 11, 492–500. [Google Scholar] [CrossRef]
- Masselot, P.; Mistry, M.; Vanoli, J.; Schneider, R.; Iungman, T.; Garcia-Leon, D.; Ciscar, J.-C.; Feyen, L.; Orru, H.; Urban, A.; et al. Excess Mortality Attributed to Heat and Cold: A Health Impact Assessment Study in 854 Cities in Europe. Lancet Planet. Health 2023, 7, e271–e281. [Google Scholar] [CrossRef] [PubMed]
- GBD 2019 Risk Factors Collaborators. Global Burden of 87 Risk Factors in 204 Countries and Territories, 1990–2019: A Systematic Analysis for the Global Burden of Disease Study 2019. Lancet 2020, 396, 1223–1249. [Google Scholar] [CrossRef] [PubMed]
- Australian Institute of Health and Welfare (AIHW). Climate Change and Environmental Health Indicators: Reporting Framework, Catalogue Number PHE 343; Australian Government: Canberra, Australia, 2024. [Google Scholar]
- Di Napoli, C.; Romanello, M.; Minor, K.; Chambers, J.; Dasgupta, S.; Escobar, L.E.; Hang, Y.; Hänninen, R.; Liu, Y.; Batista, M.L.; et al. The Role of Global Reanalyses in Climate Services for Health: Insights from the Lancet Countdown. Meteorol. Appl. 2023, 30, e2122. [Google Scholar] [CrossRef]
- Stasinopoulos, D.; Rigby, R.A.; De Bastiani, F. GAMLSS: A Distributional Regression Approach. Stat. Modelling 2018, 18, 248–273. [Google Scholar] [CrossRef]
- Kneib, T.; Silbersdorff, A.; Säfken, B. Rage Against the Mean—A Review of Distributional Regression Approaches. Econom. Stat. 2023, 26, 99–123. [Google Scholar] [CrossRef]
- Kneib, T. Beyond mean regression. Stat. Model. 2013, 13, 275–303. [Google Scholar] [CrossRef]
- Waldmann, E. Quantile regression: A short story on how and why. Stat. Model. 2018, 18, 203–218. [Google Scholar] [CrossRef]
- Guillou, A.; Kratz, M.; Le Strat, Y. An Extreme Value Theory Approach for the Early Detection of Time Clusters: A Simulation-Based Assessment and an Illustration to the Surveillance of Salmonella. Stat. Med. 2014, 33, 5015–5027. [Google Scholar] [CrossRef][Green Version]
- Thomas, M.; Lemaitre, M.; Wilson, M.L.; Viboud, C.; Yordanov, Y.; Wackernagel, H.; Carrat, F. Applications of Extreme Value Theory in Public Health. PLoS ONE 2016, 11, e0159312. [Google Scholar] [CrossRef]
- Chiu, Y.; Chebana, F.; Abdous, B.; Bélanger, D.; Gosselin, P. Mortality and Morbidity Peaks Modeling: An Extreme Value Theory Approach. Stat. Methods Med. Res. 2016, 27, 1498–1512. [Google Scholar] [CrossRef] [PubMed]
- Chiu, Y.M.; Chebana, F.; Abdous, B.; Bélanger, D.; Gosselin, P. Cardiovascular Health Peaks and Meteorological Conditions: A Quantile Regression Approach. Int. J. Environ. Res. Public Health 2021, 18, 13277. [Google Scholar] [CrossRef] [PubMed]
- Caetano, C.P.; de Zea Bermudez, P. Modeling Large Values of Systolic Blood Pressure in the Portuguese Population. REVSTAT-Stat. J. 2019, 17, 163–186. [Google Scholar] [CrossRef]
- Ranjbar, S.; Cantoni, E.; Chavez-Demoulin, V.; Marra, G.; Radice, R.; Jaton, K. Modelling the Extremes of Seasonal Viruses and Hospital Congestion: The Example of Flu in a Swiss Hospital. J. R. Stat. Soc. C Appl. Stat. 2022, 71, 884–905. [Google Scholar] [CrossRef]
- Saleh, S.; Abad, D.; Weiss, J. Statistiques des Causes de Décès au Luxembourg pour l’Année 2021; Direction de la santé: Luxembourg, 2023; ISBN 978-2-919797-80-6. [Google Scholar]
- World Health Organization (WHO). International Statistical Classification of Diseases and Related Health Problems, 10th Revision, 5th ed.; World Health Organization: Geneva, Switzerland, 2016; Available online: https://apps.who.int/iris/handle/10665/246208 (accessed on 22 November 2024).
- Pace, M.; Lanzieri, G.; Glickman, M.; Grande, E.; Zupanic, T.; Wojtyniak, B.; Gissler, M.; Cayotte, E.; Agafitei, L. Revision of the European Standard Population; Eurostat Methodologies and Working Papers; Eurostat: Luxembourg, 2013. [Google Scholar]
- Hersbach, H.; Bell, B.; Berrisford, P.; Hirahara, S.; Horányi, A.; Muñoz-Sabater, J.; Nicolas, J.; Peubey, C.; Radu, R.; Schepers, D.; et al. The ERA5 Global Reanalysis. Q. J. R. Meteorol. Soc. 2020, 146, 1999–2049. [Google Scholar] [CrossRef]
- Hersbach, H.; Bell, B.; Berrisford, P.; Biavati, G.; Horányi, A.; Muñoz Sabater, J.; Nicolas, J.; Peubey, C.; Radu, R.; Rozum, I.; et al. ERA5 Hourly Data on Single Levels from 1940 to Present; Copernicus Climate Change Service (C3S) Climate Data Store (CDS). 2023. Available online: https://cds.climate.copernicus.eu/datasets/reanalysis-era5-single-levels?tab=overview (accessed on 20 November 2024).
- Ciarelli, G.; Colette, A.; Schucht, S.; Beekmann, M.; Andersson, C.; Manders-Groot, A.; Mircea, M.; Tsyro, S.; Fagerli, H.; Ortiz, A.G.; et al. Long-Term Health Impact Assessment of Total PM2.5 in Europe During the 1990–2015 Period. Atmos. Environ. X 2019, 3, 100032. [Google Scholar] [CrossRef]
- Li, N.; Friedrich, R.; Schieberle, C. Exposure of Individuals in Europe to Air Pollution and Related Health Effects. Front. Public Health 2022, 10, 871144. [Google Scholar] [CrossRef]
- Grange, S. Technical Note: Saqgetr R Package; 2019. Available online: https://www.researchgate.net/publication/336512127_Technical_note_saqgetr_R_package?channel=doi&linkId=5da4261a92851c6b4bd35930&showFulltext=true (accessed on 20 November 2024).
- Holthuijzen, M.; Beckage, B.; Clemins, P.; Higdon, D.; Winter, J. Constructing High-Resolution, Bias-Corrected Climate Products: A Comparison of Methods. J. Appl. Meteorol. Climatol. 2021, 60, 209–223. [Google Scholar] [CrossRef]
- Caruso, G.; Schiel, K.; Ferro, Y.; Pigeron-Piroth, I.; Gerber, P. Spatial Distribution of the Population in Luxembourg: From the Sub-Municipal Scale to the Urban Structure; STATEC: Luxembourg, 2023. [Google Scholar]
- Mackie, A.; Haščič, I.; Cárdenas Rodríguez, M. Population Exposure to Fine Particles: Methodology and Results for OECD and G20 Countries; OECD Publishing: Paris, France, 2016; OECD Green Growth Papers, No. 2016/02. [Google Scholar]
- Vicedo-Cabrera, A.; de Schrijver, E.; Schumacher, D.L.; Ragettli, M.; Fischer, E.; Seneviratne, S. The Footprint of Human-Induced Climate Change on Heat-Related Deaths in the Summer of 2022 in Switzerland. Res. Square 2023, 18, 074037. [Google Scholar] [CrossRef]
- Infocrise Luxembourg. Available online: https://infocrise.public.lu/en.html (accessed on 22 November 2024).
- The European Parliament and the Council of the European Union. Directive (EU) 2024/2881 of the European Parliament and of the Council of 23 October 2024 on Ambient Air Quality and Cleaner Air for Europe. Available online: https://eur-lex.europa.eu/eli/dir/2024/2881/oj (accessed on 19 February 2025).
- World Health Organization (WHO). WHO Global Air Quality Guidelines: Particulate Matter (PM2.5 and PM10), Ozone, Nitrogen Dioxide, Sulfur Dioxide and Carbon Monoxide; World Health Organization: Geneva, Switzerland, 2021; Available online: https://apps.who.int/iris/handle/10665/345329 (accessed on 19 February 2025).
- Bell, M.; Dominici, F.; Samet, J. A Meta-Analysis of Time-Series Studies of Ozone and Mortality with Comparison to the National Morbidity, Mortality, and Air Pollution Study. Epidemiology 2005, 16, 436–445. [Google Scholar] [CrossRef]
- Cox, B.; Wuillaume, F.; Van Oyen, H.; Maes, S. Monitoring of All-Cause Mortality in Belgium (Be-MOMO): A New and Automated System for the Early Detection and Quantification of the Mortality Impact of Public Health Events. Int. J. Public Health 2010, 55, 251–259. [Google Scholar] [CrossRef]
- Msemburi, W.; Karlinsky, A.; Knutson, V.; Aleshin-Guendel, S.; Chatterji, S.; Wakefield, J. The WHO Estimates of Excess Mortality Associated with the COVID-19 Pandemic. Nature 2023, 613, 130–137. [Google Scholar] [CrossRef] [PubMed]
- Fasiolo, M.; Wood, S.N.; Zaffran, M.; Nedellec, R.; Goude, Y. Fast Calibrated Additive Quantile Regression. J. Am. Stat. Assoc. 2020, 116, 1402–1412. [Google Scholar] [CrossRef]
- von Cube, M.; Timsit, J.F.; Kammerlander, A.; Schumacher, M. Quantifying and Communicating the Burden of COVID-19. BMC Med. Res. Methodol. 2021, 21, 164. [Google Scholar] [CrossRef] [PubMed]
- Aron, J.; Muellbauer, J.; Giattino, C.; Ritchie, H. A Pandemic Primer on Excess Mortality Statistics and Their Comparability Across Countries. OurWorldinData.org 2020. Available online: https://ourworldindata.org/covid-excess-mortality (accessed on 22 November 2024).
- Ullrich-Kniffka, N.; Schöley, J. Population Age Structure Dependency of the Excess Mortality P-Score. Popul. Health Metr. 2024, 22, 25. [Google Scholar] [CrossRef]
- Gasparrini, A.; Armstrong, B.; Kenward, M.G. Distributed Lag Non-Linear Models. Stat. Med. 2010, 29, 2224–2234. [Google Scholar] [CrossRef]
- Johnson, N.; Kotz, S.; Balkrishnan, N. Continuous Univariate Distributions; Wiley Series in Probability and Mathematical Statistics; John Wiley & Sons: New York, NY, USA, 1995; Volume 2, pp. 113–163. [Google Scholar]
- Hannan, E.J.; Quinn, B.G. The Determination of the Order of an Autoregression. J. R. Stat. Soc. B 1979, 41, 190–195. [Google Scholar] [CrossRef]
- Ramires, T.; Nakamura, L.; Righetto, A.; Pescim, R.; Mazucheli, J.; Rigby, R.; Stasinopoulos, D. Validation of Stepwise-Based Procedure in GAMLSS. J. Data Sci. 2021, 19, 96–110. [Google Scholar] [CrossRef]
- Dunn, P.K.; Smyth, G.K. Randomized Quantile Residuals. J. Comput. Graph. Stat. 1996, 5, 236–244. [Google Scholar] [CrossRef]
- van Buuren, S.; Fredriks, M. Worm Plot: Simple Diagnostic Device for Modelling Growth Reference Curves. Stat. Med. 2001, 20, 1259–1277. [Google Scholar] [CrossRef]
- Coles, S. An Introduction to Statistical Modeling of Extreme Values; Springer: London, UK, 2001. [Google Scholar] [CrossRef]
- Leadbetter, M.R.; Rootzén, H. Extremal Theory for Stochastic Processes. Ann. Probab. 1988, 16, 431–478. [Google Scholar] [CrossRef]
- Ferro, C.A.T.; Segers, J. Inference for Clusters of Extreme Values. J. R. Stat. Soc. B 2003, 65, 545–556. [Google Scholar] [CrossRef]
- Eastoe, E.; Tawn, J. Modelling Non-Stationary Extremes with Application to Surface Level Ozone. J. R. Stat. Soc. C 2009, 58, 25–45. [Google Scholar] [CrossRef]
- Davison, A.C.; Smith, R.L. Models for Exceedances over High Thresholds. J. R. Stat. Soc. B 1990, 52, 393–442. [Google Scholar] [CrossRef]
- Lüthi, S.; Fairless, C.; Fischer, E.M.; Scovronick, N.; Armstrong, B.; Coelho, M.D.S.Z.S.; Guo, Y.L.; Guo, Y.; Honda, Y.; Huber, V.; et al. Rapid Increase in the Risk of Heat-Related Mortality. Nat. Commun. 2023, 14, 4894. [Google Scholar] [CrossRef] [PubMed]
- Khatana, S.A.M.; Szeto, J.J.; Eberly, L.A.; Nathan, A.S.; Puvvula, J.; Chen, A. Projections of Extreme Temperature-Related Deaths in the U.S. JAMA Netw. Open 2024, 7, e2434942. [Google Scholar] [CrossRef]
- COMEAP. Associations of Long-Term Average Concentrations of Nitrogen Dioxide with Mortality; Report No. PHE 238; Committee on the Medical Effects of Air Pollutants: London, UK, 2018. [Google Scholar]
- Godzinski, A.; Suarez Castillo, M. Disentangling the Effects of Air Pollutants with Many Instruments. J. Environ. Econ. Manag. 2021, 109, 102489. [Google Scholar] [CrossRef]
- Ji, J.S.; Liu, L.; Zhang, J.; Kan, H.; Zhao, B.; Burkart, K.G.; Zeng, Y. NO2 and PM2.5 Air Pollution Co-Exposure and Temperature Effect Modification on Premature Mortality in Advanced Age: A Longitudinal Cohort Study in China. Environ. Health 2022, 21, 97. [Google Scholar] [CrossRef]
- Krug, A.; Fenner, D.; Holtmann, A.; Scherer, D. Occurrence and Coupling of Heat and Ozone Events and Their Relation to Mortality Rates in Berlin, Germany, Between 2000 and 2014. Atmosphere 2019, 10, 348. [Google Scholar] [CrossRef]
- OECD/European Union. Health at a Glance: Europe 2020: State of Health in the EU Cycle; OECD Publishing: Paris, France, 2020. [Google Scholar] [CrossRef]
- Chen, Z.Y.; Petetin, H.; Méndez Turrubiates, R.F.; Achebak, H.; García-Pando, C.P.; Ballester, J. Population Exposure to Multiple Air Pollutants and Its Compound Episodes in Europe. Nat. Commun. 2024, 15, 2094. [Google Scholar] [CrossRef]
- Li, H.; Lu, Y. Coherent Forecasting of Mortality Rates: A Sparse Vector-Autoregression Approach. ASTIN Bull. 2017, 47, 563–600. [Google Scholar] [CrossRef]
- Yang, L.; Qin, G.; Zhao, N.; Wang, C.; Song, G. Using a Generalized Additive Model with Autoregressive Terms to Study the Effects of Daily Temperature on Mortality. BMC Med. Res. Methodol. 2012, 12, 165. [Google Scholar] [CrossRef] [PubMed]
- Guibert, Q.; Lopez, O.; Piette, P. Forecasting Mortality Rate Improvements with a High-Dimensional VAR. Insur. Math. Econ. 2019, 88, 255–272. [Google Scholar] [CrossRef]
- Kenney, W.L.; Craighead, D.H.; Alexander, L.M. Heat Waves, Aging, and Human Cardiovascular Health. Med. Sci. Sports Exerc. 2014, 46, 1891–1899. [Google Scholar] [CrossRef] [PubMed]
- Ballester, J.; Quijal-Zamorano, M.; Méndez Turrubiates, R.F.; Pegenaute, F.; Herrmann, F.R.; Robine, J.M.; Basagaña, X.; Tonne, C.; Antó, J.M.; Achebak, H. Heat-Related Mortality in Europe During the Summer of 2022. Nat. Med. 2023, 29, 1857–1866. [Google Scholar] [CrossRef]
- Mistry, M.N.; Gasparrini, A. Real-Time Forecast of Temperature-Related Excess Mortality at Small-Area Level: Towards an Operational Framework. Environ. Res. Health 2024, 2, 035011. [Google Scholar] [CrossRef]


| Environmental Risk | Definition |
|---|---|
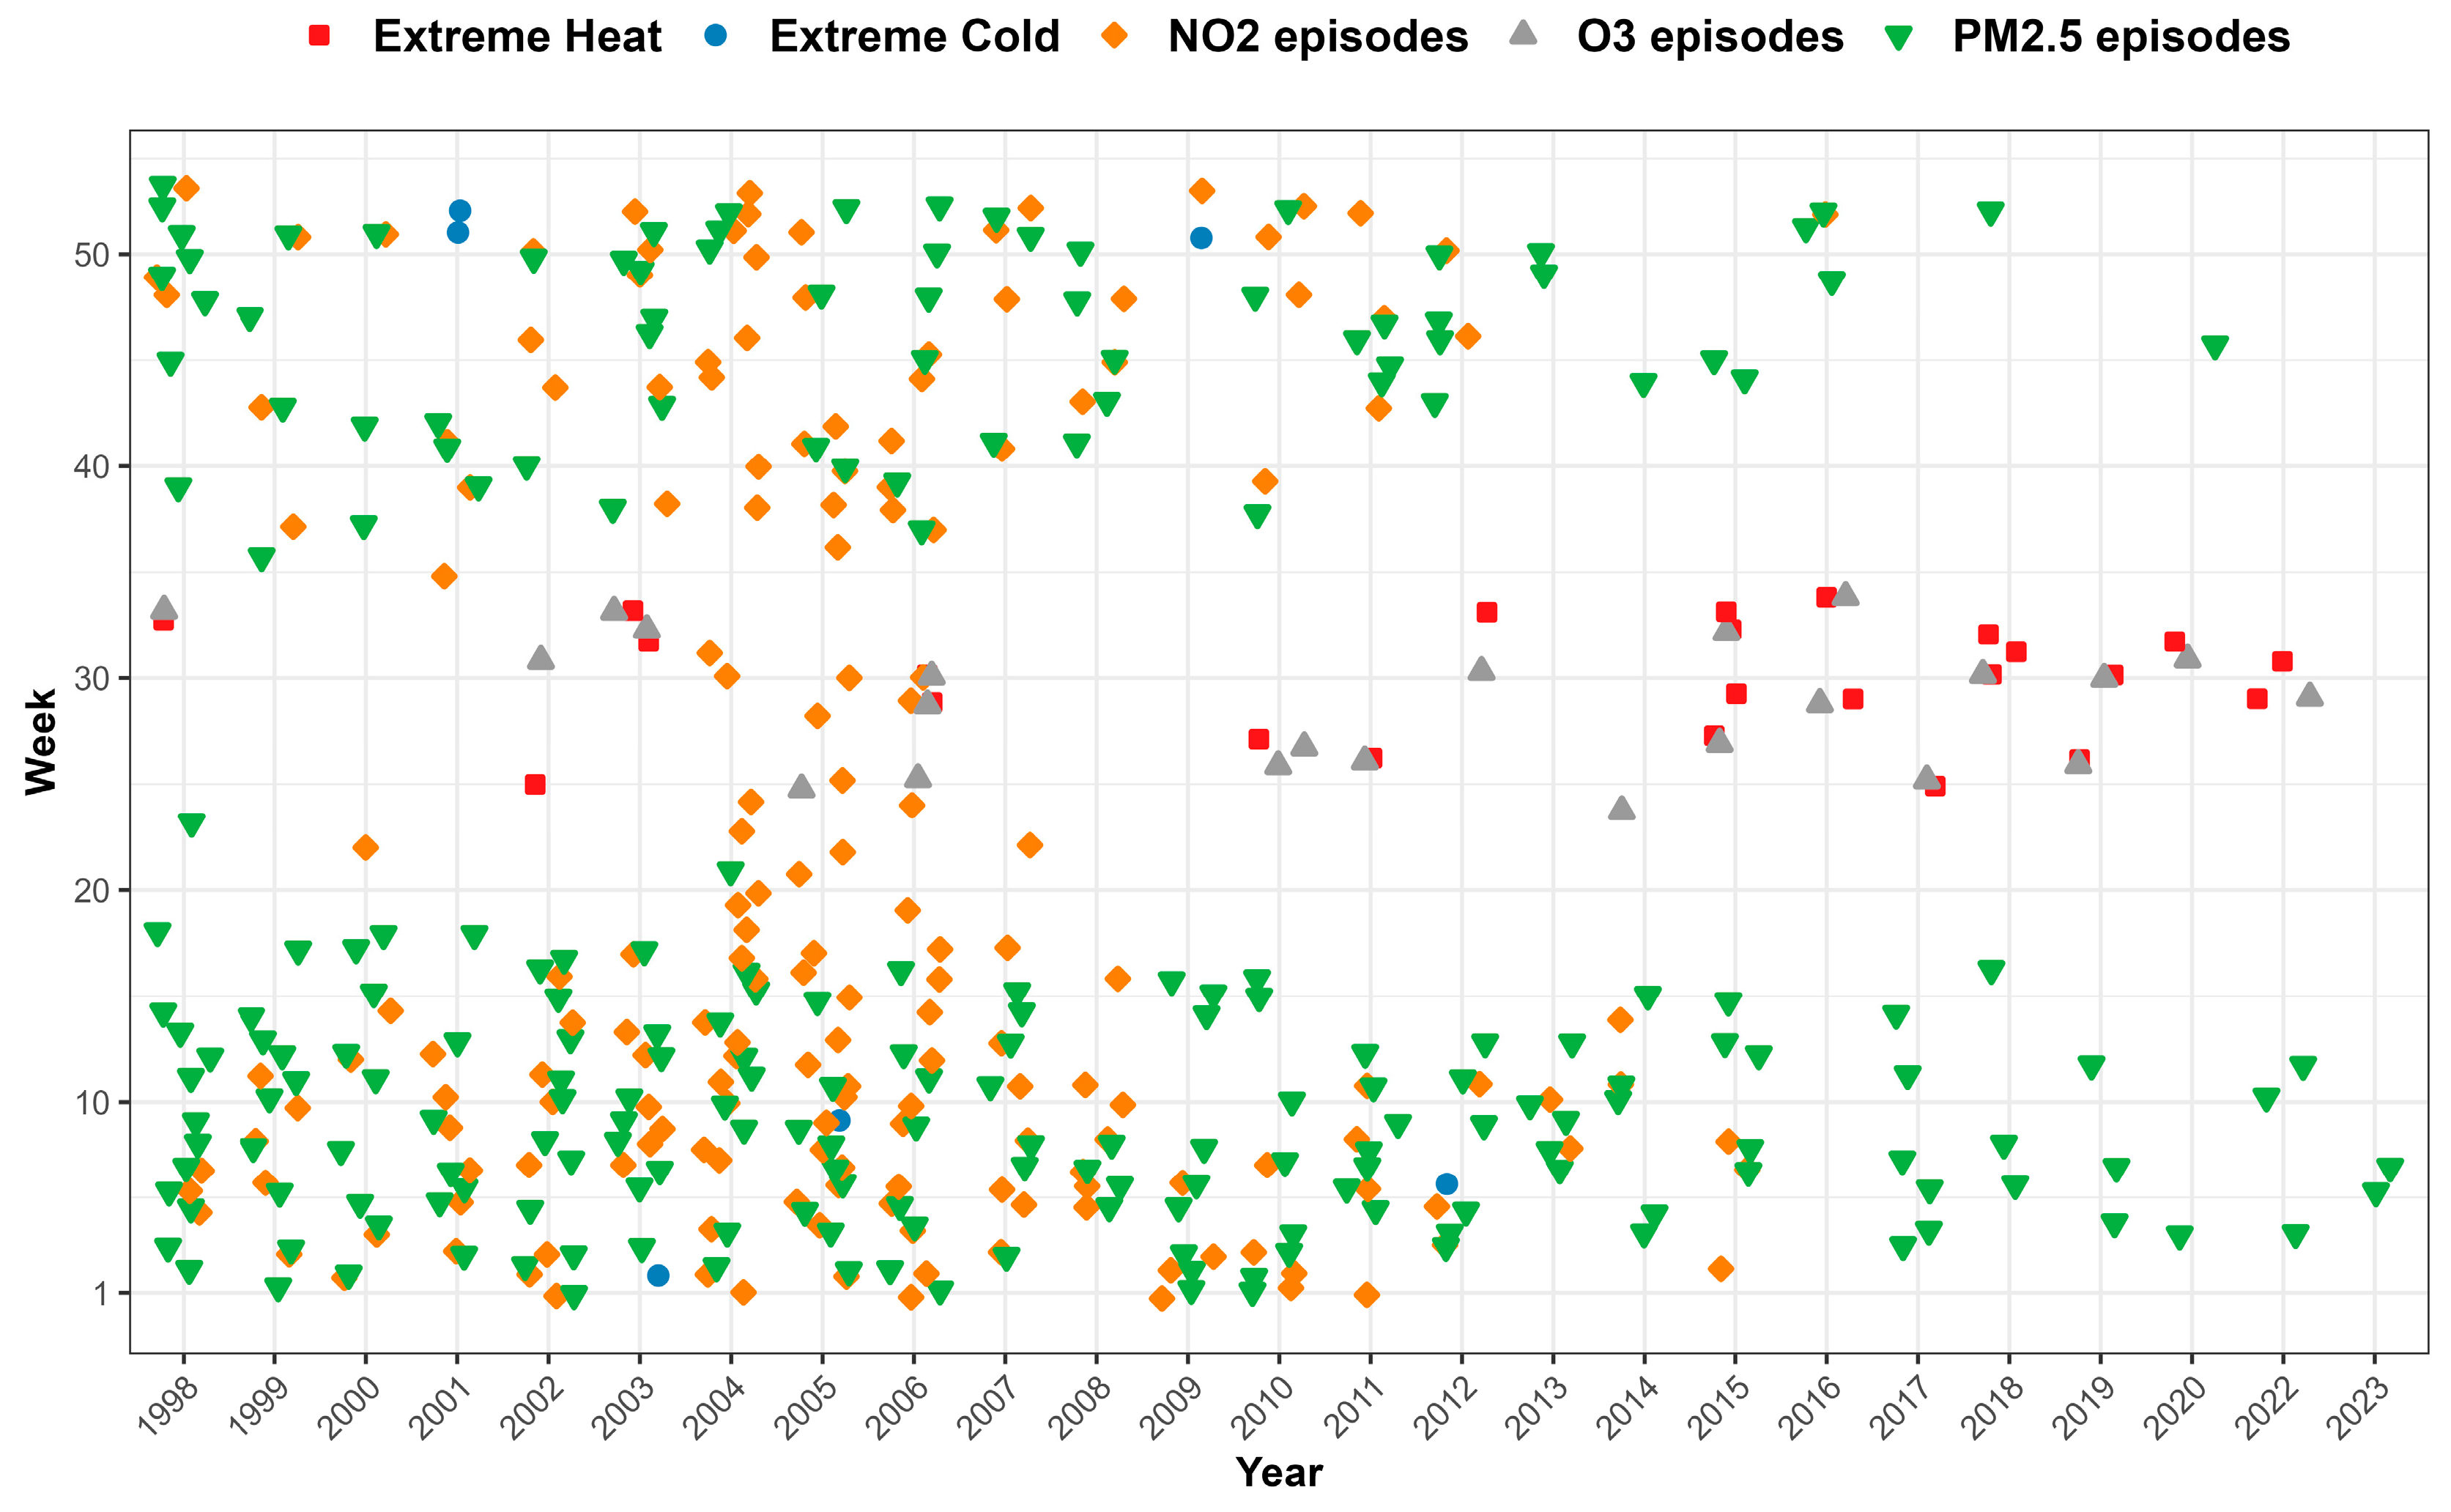
| Extreme heat | Maximal daily temperature ≥ 35 °C and previous day’s average temperature ≥ 23 °C |
| Extreme cold | Minimal daily temperature ≤ −15 °C |
| PM2.5 episode | 24 h average PM2.5 concentration ≥ 25 µg/m3 |
| NO2 episode | 24 h average NO2 concentration ≥ 50 µg/m3 |
| O3 episode | 1h daily maximum O3 concentration ≥ 160 µg/m3 |
| Minimum | 1st Quartile | Median | Mean | 3rd Quartile | Maximum |
|---|---|---|---|---|---|
| −47.6% | −9.2% | −0.5% | 0.4% | 9.4% | 57.8% |
| Parameter | Covariate | Estimate | Standard Error | 95% CI | p-Value |
|---|---|---|---|---|---|
| μ | (Intercept) | −1.36 | 0.42 | [−2.20, −0.54] | 0.00129 |
| Extreme heat | 4.91 | 0.90 | [3.15, 6.67] | 5.67 × 10⁻⁸ | |
| Extreme cold | 9.37 | 2.93 | [3.64, 15.10] | 0.00139 | |
| PM2.5 episodes | 0.80 | 0.26 | [0.29, 1.31] | 0.00203 | |
| COVID-19 | 0.55 | 0.13 | [0.30, 0.80] | 2.20 × 10⁻⁵ | |
| PSCORE_LAG1 | 0.08 | 0.03 | [0.03, 0.13] | 0.00169 | |
| σ | (Intercept) | 2.01 | 0.03 | [1.96, 2.06] | <2 × 10⁻¹⁶ |
| NO2 episodes | 0.05 | 0.02 | [0.01, 0.09] | 0.02127 | |
| COVID-19 | 0.02 | 0.01 | [0.01, 0.03] | 0.00497 |
| Environmental Risk | Annual Frequency of Episode Days | Total Attributable Number of Deaths (with 95% CI) | Yearly Average Attributable Number of Deaths (with 95% CI) | Yearly Average Attributable ASMR per 100,000 (with 95% CI) | ||||
|---|---|---|---|---|---|---|---|---|
| 1998–2023 | 2019–2023 | 1998–2023 | 2019–2023 | 1998–2023 | 2019–2023 | 1998–2023 | 2019–2023 | |
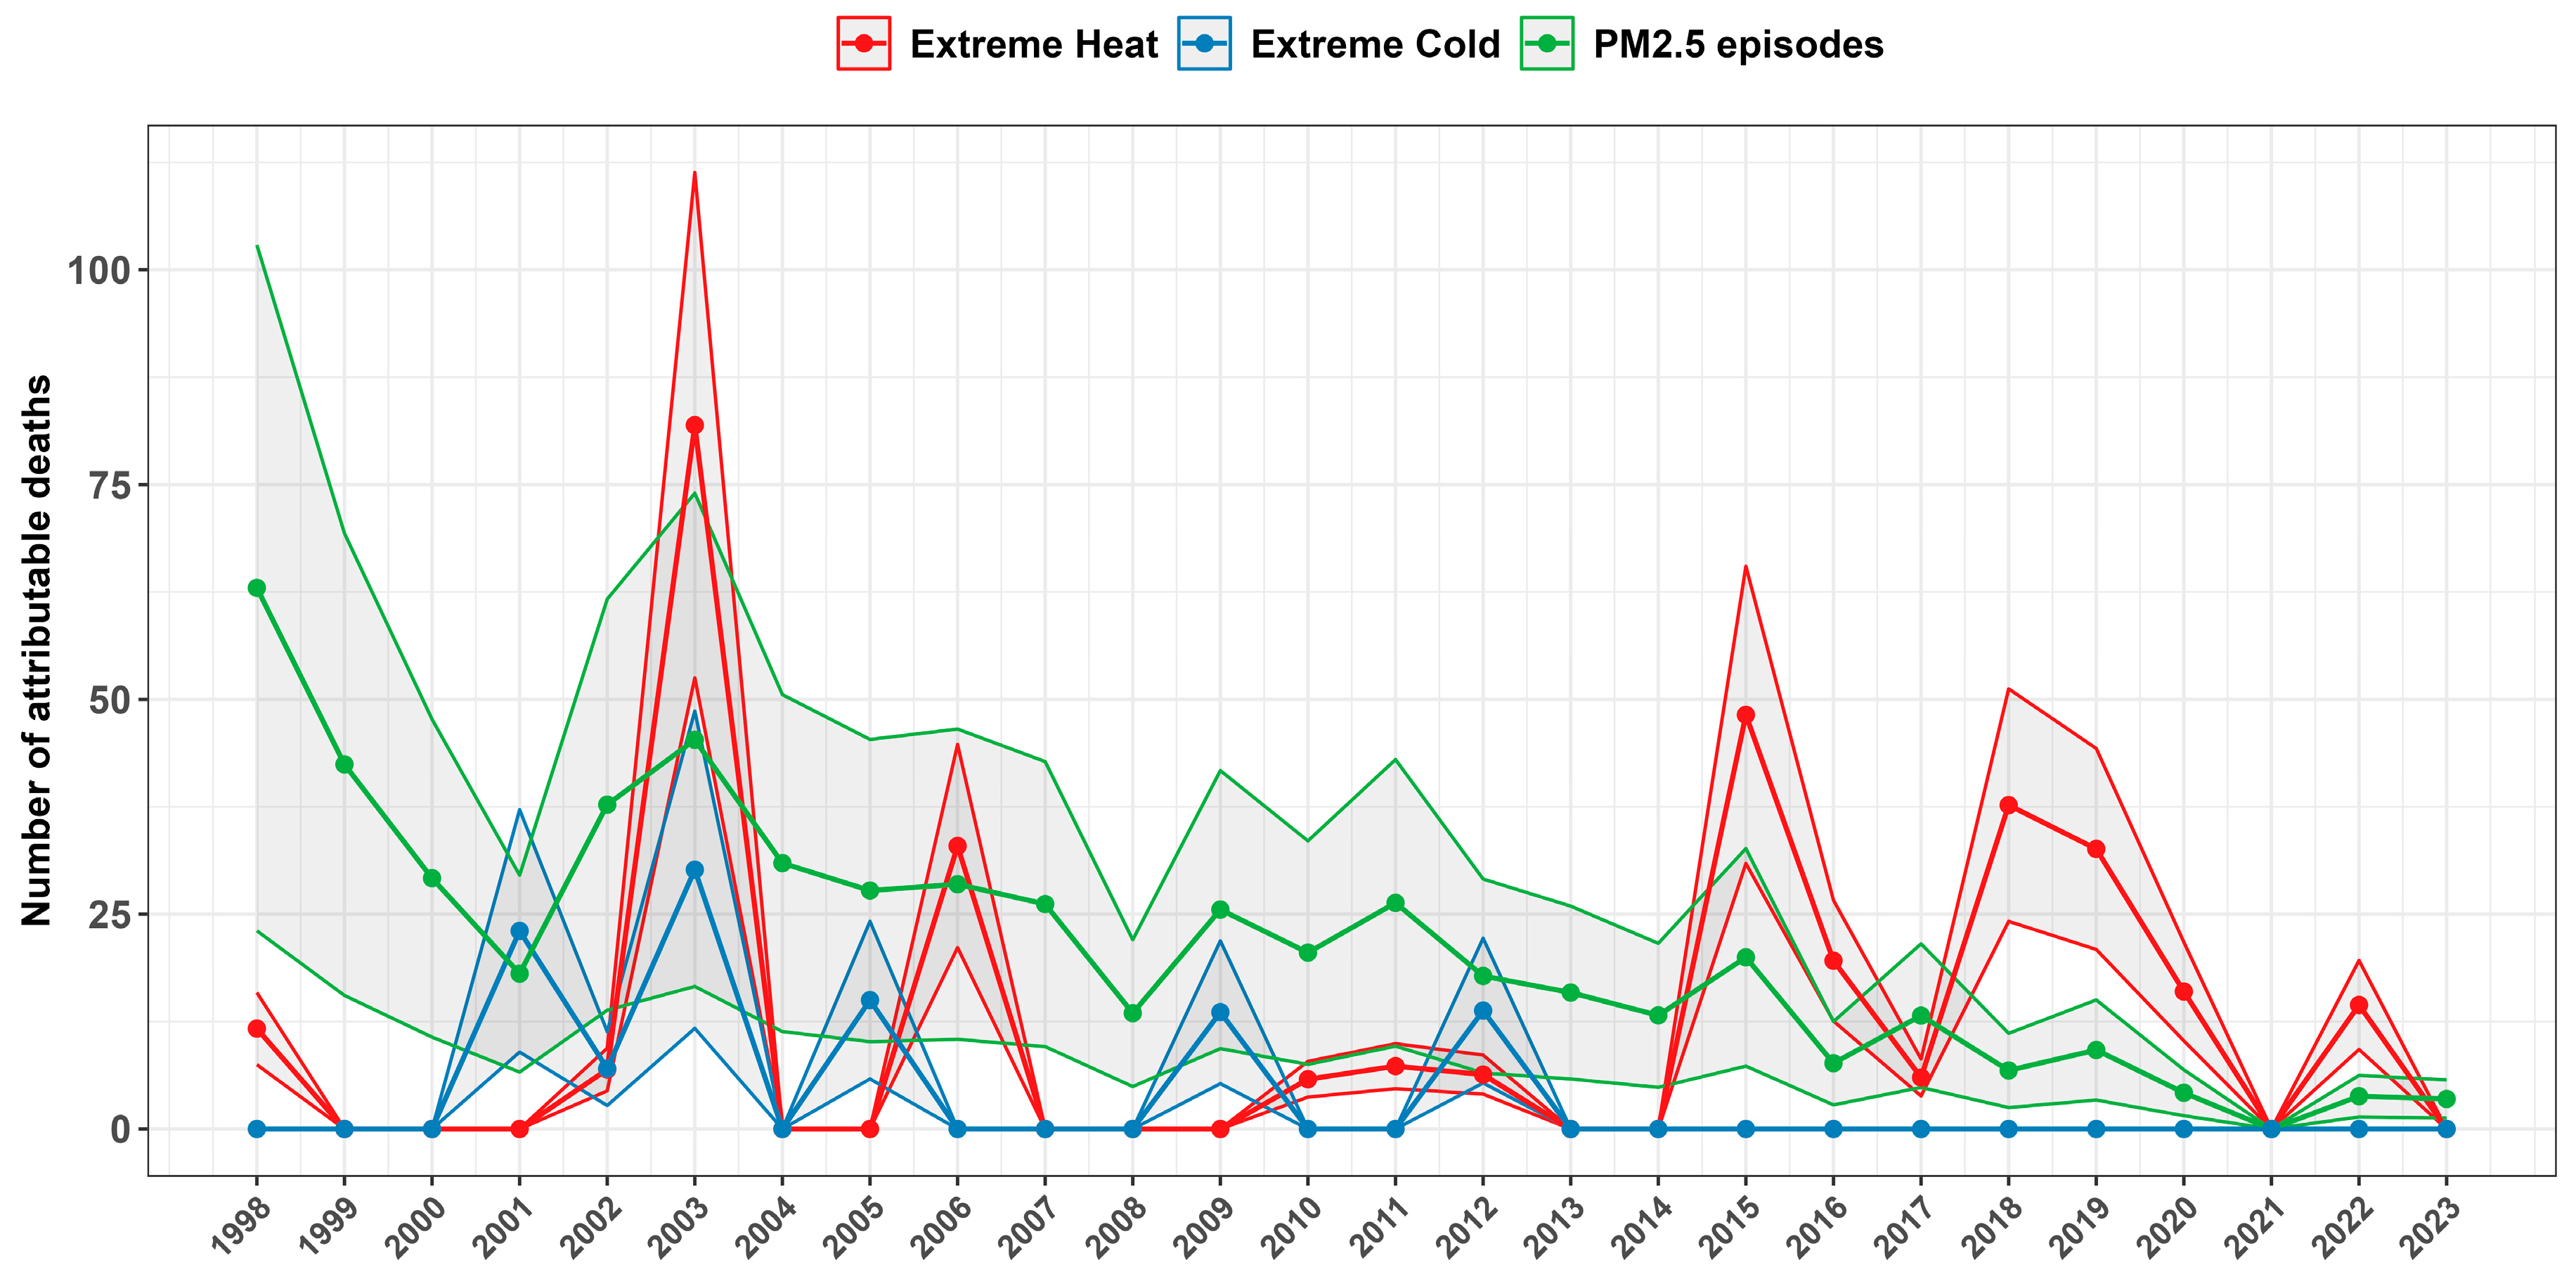
| Extreme Heat | 1.77 | 1.80 | 327 [210, 445] | 63 [40, 86] | 12.59 [8.07, 17.11] | 12.60 [8.08, 17.12] | 2.82 [1.81, 3.83] | 2.39 [1.53, 3.25] |
| Extreme Cold | 0.27 | 0.00 | 103 [40, 165] | 0 [0, 0] | 3.95 [1.53, 6.36] | 0 [0, 0] | 1.12 [0.43, 1.80] | 0 [0, 0] |
| PM2.5 Episodes | 18.58 | 3.00 | 550 [201, 899] | 21 [8, 34] | 21.16 [7.75, 34.57] | 4.14 [1.52, 6.77] | 6.32 [2.32, 10.33] | 0.87 [0.32, 1.42] |
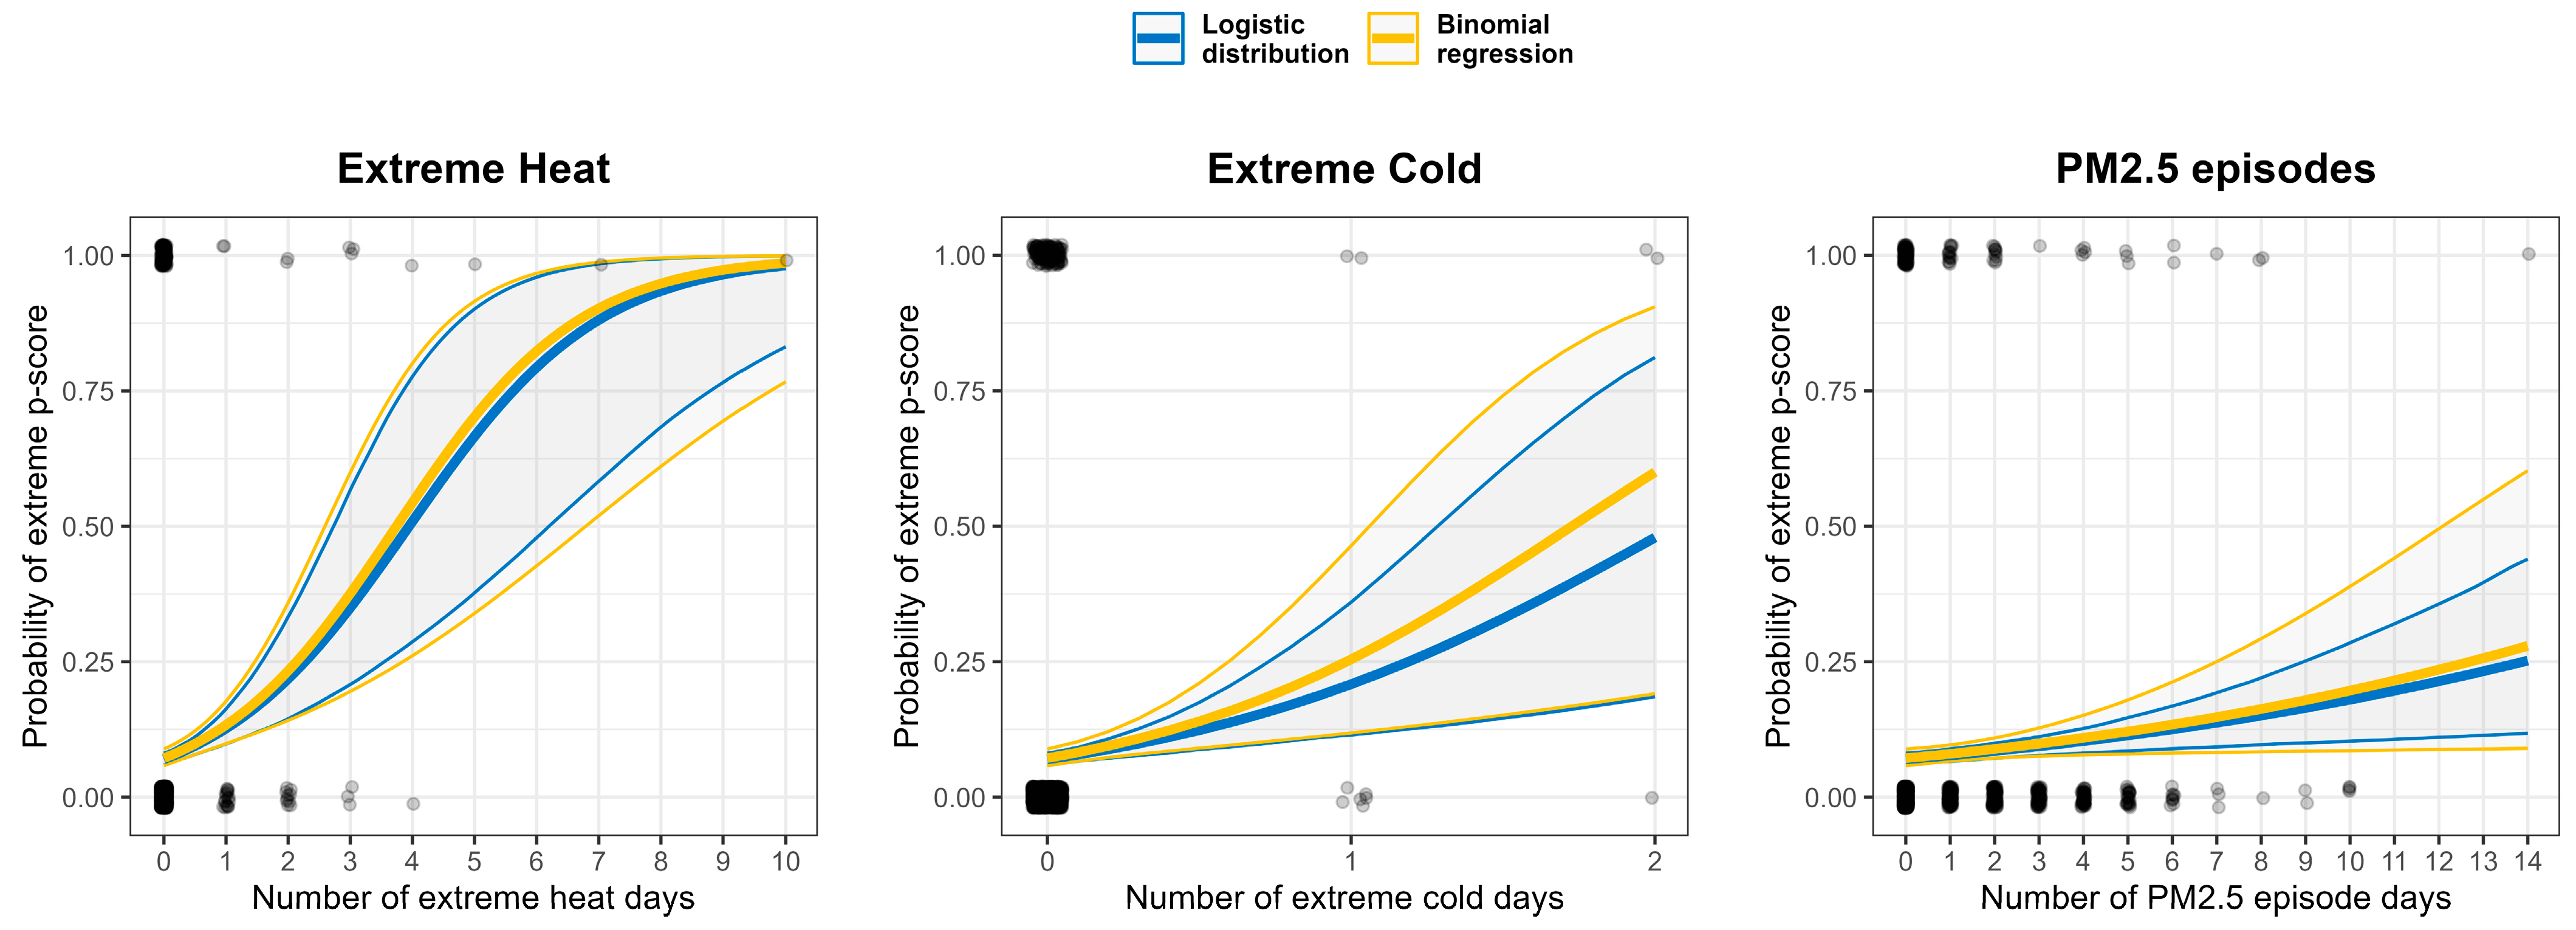
| Environmental Risk | Odds Ratio (with 95% CI) | |
|---|---|---|
| Logistic Distribution | Binomial Regression | |
| Extreme Heat | 1.93 [1.52, 2.66] | 1.98 [1.45, 2.71] |
| Extreme Cold | 3.49 [1.77, 7.56] | 4.39 [1.73, 11.16] |
| PM2.5 Episodes | 1.11 [1.04, 1.19] | 1.12 [1.01, 1.24] |
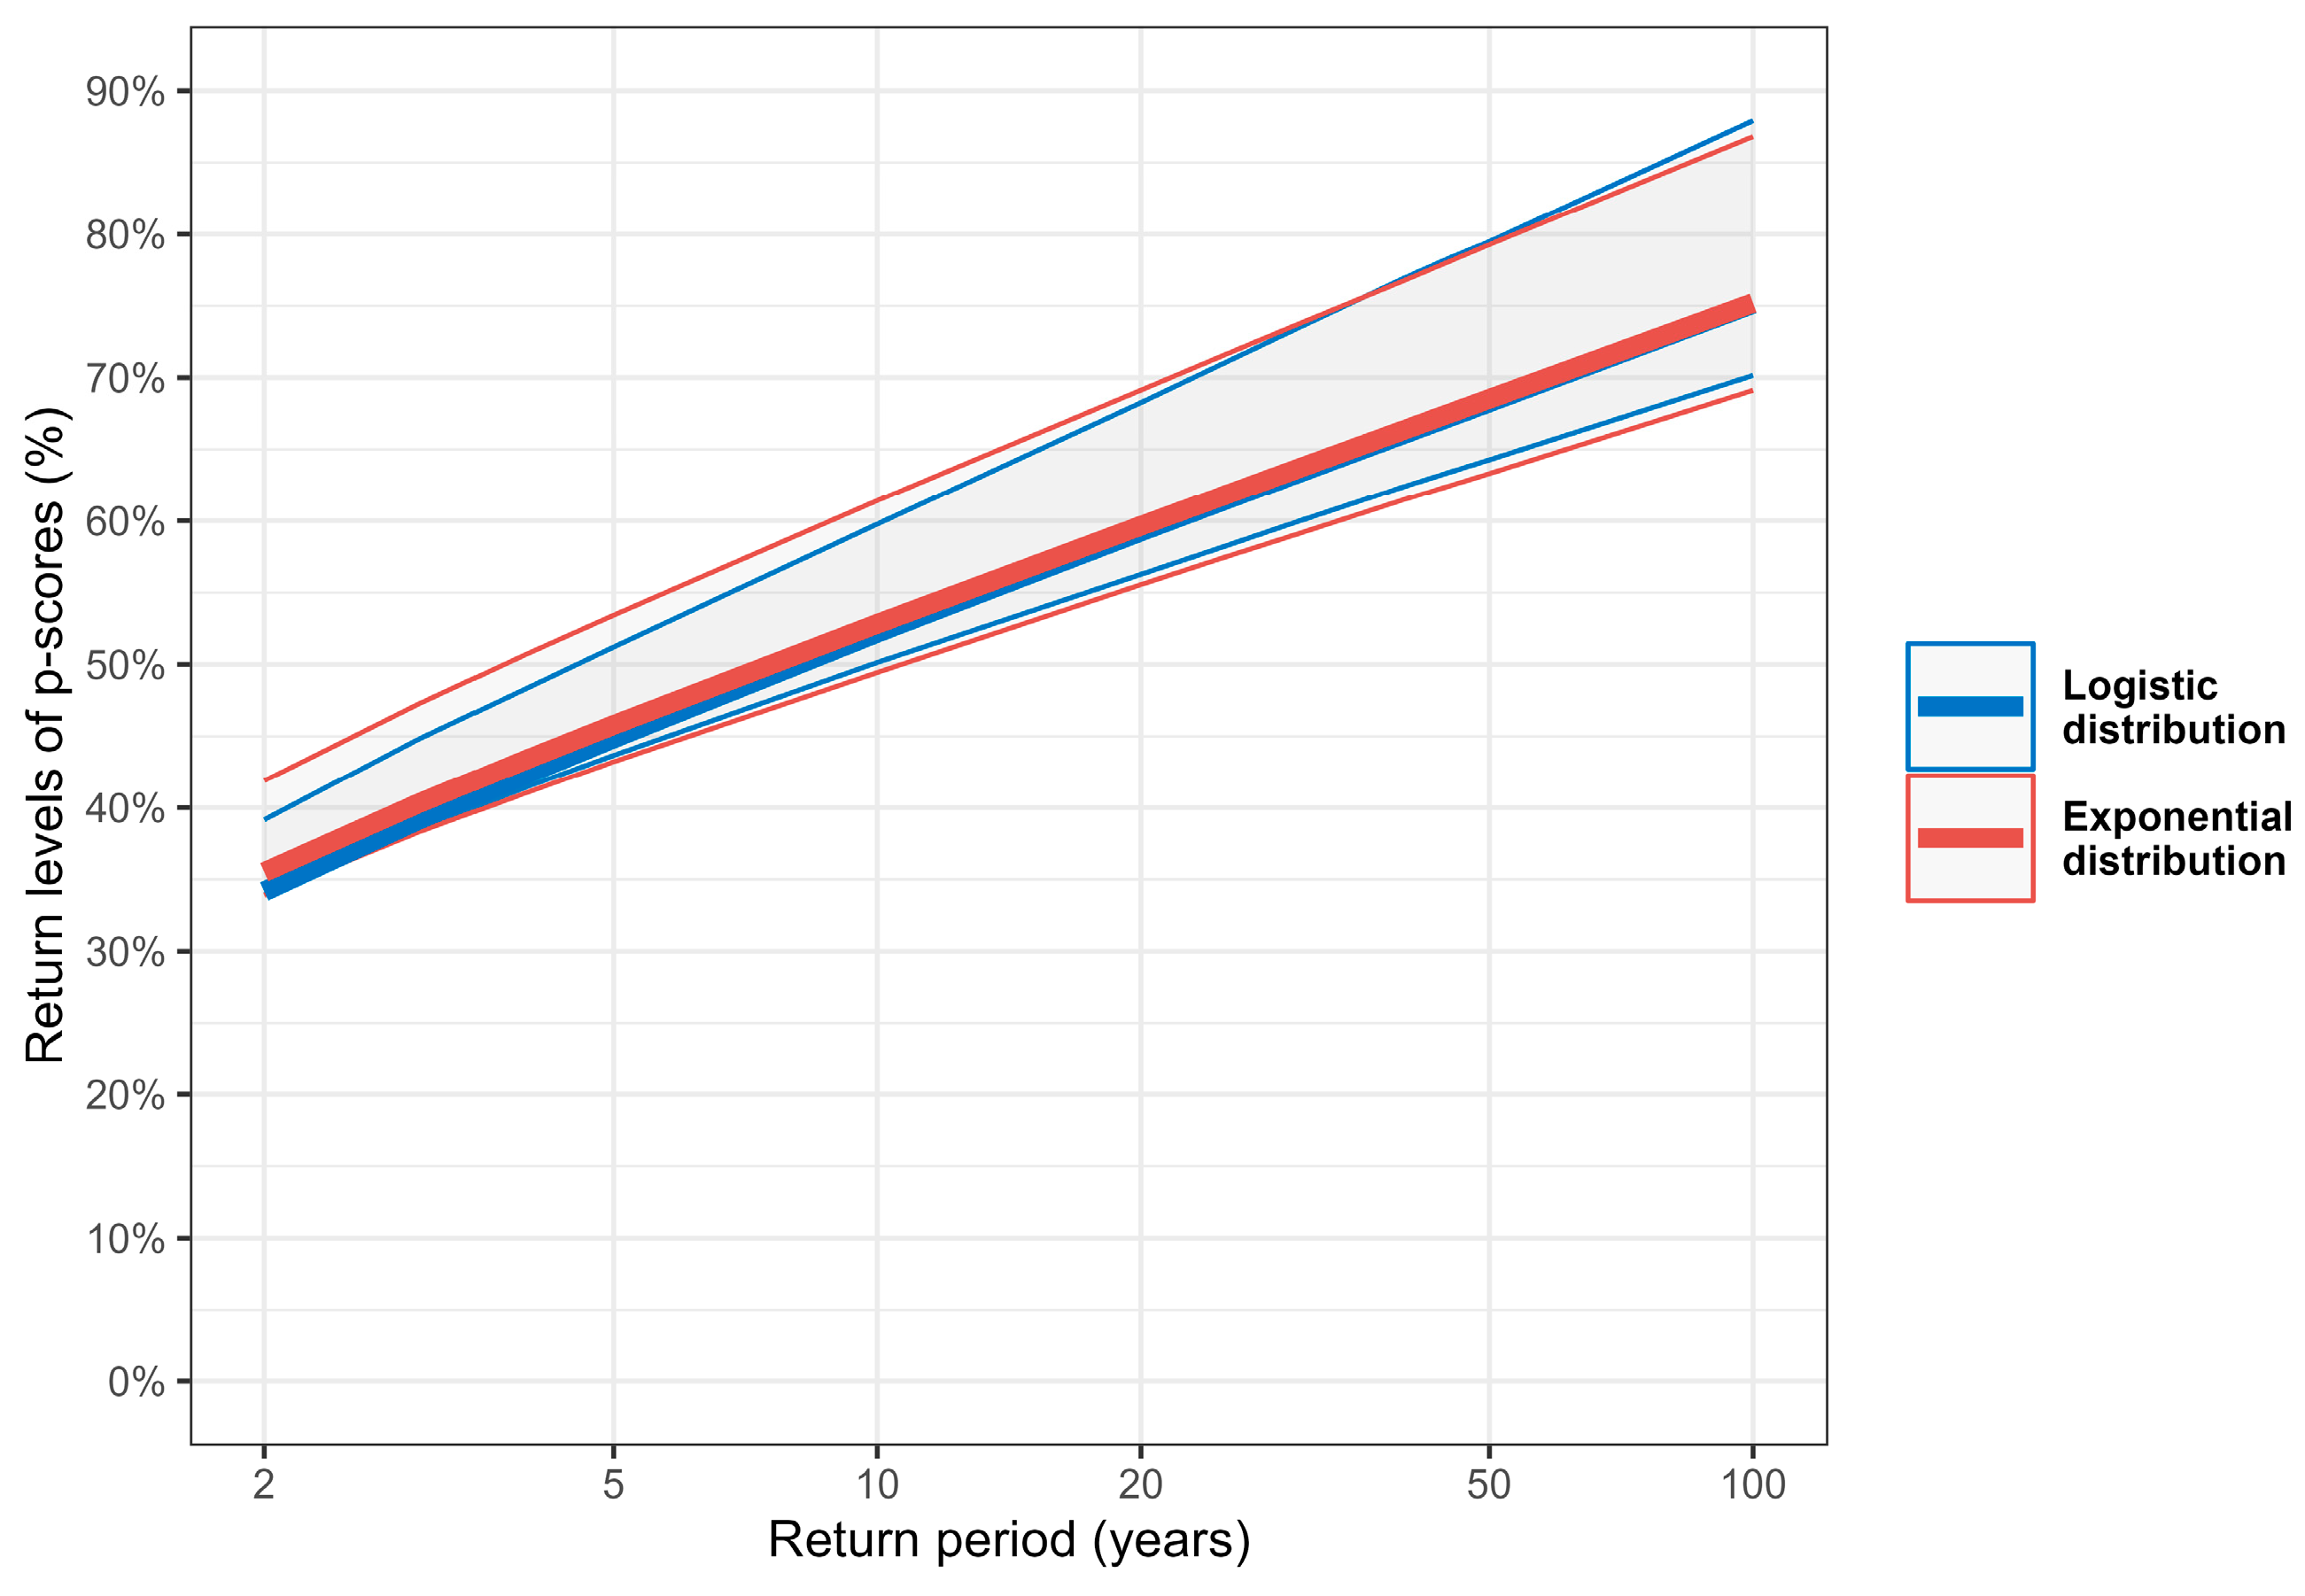
| Return Period (Years) | Excess Mortality p-Scores Return Levels (%, with 95% CI) | |
|---|---|---|
| Logistic Distribution | Exponential Distribution | |
| 5 | 44.9% [43.7%, 51.2%] | 45.8% [43.2%, 53.4%] |
| 10 | 52.2% [50.1%, 59.8%] | 52.8% [49.4%, 61.4%] |
| 25 | 61.5% [58.2%, 71.1%] | 61.8% [57.5%, 71.6%] |
| 50 | 68.3% [64.3%, 79.5%] | 68.5% [63.3%, 79.3%] |
| 100 | 75.1% [70.2%, 87.9%] | 75.2% [69.1%, 86.8%] |
| Event | Week of Highest p-Score | Highest p-Score (%) | Return Period from Logistic Distribution (years, with 95% CI) | Return Period from Exponential Distribution (Years, with 95% CI) |
|---|---|---|---|---|
| COVID-19 pandemic | 2020-W50 | 57.8% | 17.3 [8.5, 23.8] | 16.6 [7.6, 26.8] |
| 2003 heatwave | 2003-W32 | 55.8% | 14.3 [7.2, 19.1] | 13.6 [6.4, 21.2] |
Disclaimer/Publisher’s Note: The statements, opinions and data contained in all publications are solely those of the individual author(s) and contributor(s) and not of MDPI and/or the editor(s). MDPI and/or the editor(s) disclaim responsibility for any injury to people or property resulting from any ideas, methods, instructions or products referred to in the content. |
© 2025 by the author. Licensee MDPI, Basel, Switzerland. This article is an open access article distributed under the terms and conditions of the Creative Commons Attribution (CC BY) license (https://creativecommons.org/licenses/by/4.0/).
Share and Cite
Weiss, J. Short-Term Effects of Extreme Heat, Cold, and Air Pollution Episodes on Excess Mortality in Luxembourg. Int. J. Environ. Res. Public Health 2025, 22, 376. https://doi.org/10.3390/ijerph22030376
Weiss J. Short-Term Effects of Extreme Heat, Cold, and Air Pollution Episodes on Excess Mortality in Luxembourg. International Journal of Environmental Research and Public Health. 2025; 22(3):376. https://doi.org/10.3390/ijerph22030376
Chicago/Turabian StyleWeiss, Jérôme. 2025. "Short-Term Effects of Extreme Heat, Cold, and Air Pollution Episodes on Excess Mortality in Luxembourg" International Journal of Environmental Research and Public Health 22, no. 3: 376. https://doi.org/10.3390/ijerph22030376
APA StyleWeiss, J. (2025). Short-Term Effects of Extreme Heat, Cold, and Air Pollution Episodes on Excess Mortality in Luxembourg. International Journal of Environmental Research and Public Health, 22(3), 376. https://doi.org/10.3390/ijerph22030376


