Abstract
Japan has the most ageing population in the world with a high population of bicycle users, and the percentage of older cyclists continues to grow as the population ages. At the same time, the proportion of bicycle-related collisions is increasing. The aim of this study is to analyse trends and risk factors for bicycle injuries and deaths in Japan in order to suggest preventive measures, using data from vital statistics and the National Police Agency to calculate incidence rate ratios (IRR), age-standardised mortality rates, and annual percent changes, by ten-year-interval age groups. Data from the Japan Trauma Data Bank was analysed for demographic information about injuries. The risk of casualties was high in the younger generation and lower in the older population. However, the risk of mortality increased rapidly with age, with people over 70 years old facing more than 10 times the risk of younger age groups (IRR = 12.62). Casualty and mortality rates were declining in all age groups until the year 2020 (range: −9.77% to −4.95%, −8.61% to −1.07%, respectively). However, lethality of bicycle collisions showed no significant reduction. Current methods have not been effective in reducing bicycle-related lethality in Japan, especially for the older population, and should be improved to ensure that bicycle transportation is safe for all road users.
1. Introduction
Bicycles are a common mode of transportation method in many countries, with global bicycle ownership reported at 42% [1]. Japan is among the top ten largest bicycle users globally, with more than 72 million bicycle owners [2]. People living in urban areas have relied on bicycles as their transportation method, mainly because they allow people to travel freely and rapidly on narrow and crowded roads [3]. In the past decade, the Japanese government enacted the Bicycle Utilization Promotion Plan to promote more bicycle use to improve the environment, traffic control, transportation in times of disasters, healthy lifestyles, and also to provide transportation for older people [3,4].
However, while Japan’s bicycle culture allows widespread, unrestricted use of bicycles, there are several risks for bicycle injuries. First, the roads in urban areas are narrow and crowded, and do not separate lanes for cars, bicycles, and pedestrians, and the number of designated lanes for bicycles are limited [5]. Secondly, the law allows cyclists 16 years old or older to carry two young children under the age of six on one bike, a widespread practice among parents with children [6]. On the other hand, 63% of community-dwelling older adults in urban areas regularly ride bicycles [7]. The number of older cyclists is increasing, as 20% of older adults who returned their drivers’ licence began using bicycles as a mode of transportation [8]. At the same time, it has been reported that one in three older cyclists in urban areas sustain serious injuries that require hospital treatment [9,10]. Thirdly, there are no mandatory rules or laws for helmet use; instead, cyclists are asked only to make “efforts” [11]. This leaves unprotected and unstable bike riders roaming through road environments where there are many pedestrians, weaving between slow vehicular traffic and pedestrians, often while carrying small children. Since bicycles are a part of many Japanese people’s daily lives, there are other risks such as riding on a rainy day while holding an umbrella or using a cell phone while riding [12]. Some people intentionally use bicycles instead of cars when they go out drinking [12].
The police reported a total of 72,339 bicycle-related crashes in 2023, accounting for 23.5% of all road traffic crashes, which hit a record high [13]. In Tokyo, there were over 15,000 crashes involving cyclists in 2023, which was an increase of over 650 cases from 2022, and the proportion of bicycle-related crashes has increased from 36.1% to 46.3% over the past five years [13]. Among these crashes, injury rates were highest in people aged 15 to 19 years, but fatalities were concentrated in those aged 65 and older, with 60% of all bicycle-related deaths occurring in riders aged over 70 [14,15]. Since Japan is the world’s most ageing country with 29.1% of the population aged over 65 years in 2023, and this proportion is estimated to grow to 38.7% by 2070, it can be assumed that the percentage of injuries in this age group will increase [16]. Furthermore, it has been reported that over 70% of bicycle-related deaths in individuals under the age 65 and 65% in age 65 and older were associated with violations of traffic laws [13]. Since cyclists over 50 years old are increasing, it is likely that the number of collisions among the older generation due to law violations will also increase [2,17].
Although Japan has a substantial population of bicycle users, there is a limited body of research on bicycle-related injuries compared to other countries where bicycles are used on a daily basis [18]. Assessment of trends in and demographics of bicycle injuries is essential for prevention, to reflect on improvements in law, corporate education, road infrastructure, and insurance, as well as supporting a public health approach to understand the current situation of bicycle injuries in an ageing and bicycle-centric country such as Japan [19,20,21]. The aim of this study is to analyse trends in and risk factors for bicycle injuries and deaths in Japan by age group up to 80 years and older in order to suggest preventive measures based on the demographics of the high-risk population.
2. Materials and Methods
In order to assess the impact and trends from multiple perspectives, analysis was performed to identify the following indicators: (a) bicycle-related casualty per Japanese population, (b) bicycle-related mortality per Japanese population, (c) bicycle-related mortality per number of casualties, and (d) demographics of bike-related injuries compared with other vehicles. These include all casualties or mortalities in which cyclists were involved, including single-bicycle collisions.
2.1. Data Sources
Bicycle-related casualty data were obtained from the Annual Report of Traffic Accidents, released by the National Police Agency, which shows the number of annual casualties caused in traffic from 2010 to 2020 by vehicle type [22]. Mortality data were obtained from the vital statistics registration of the Ministry of Health, Labour, and Welfare in Japan, which provides a total of all deaths that occurred in Japan, based on the International Classification of Disease (ICD)-10 codes [23,24]. Codes v10-19 for pedal cycle riders injured in transport accidents between 1995 and 2020 were used for analysis. We classified age into ten-year intervals from ages 0 to 80 and over.
The Japan Trauma Data Bank (JTDB) database (year 2004–2018) was used for additional analysis on overall demographics of vehicle-related injuries in Japan. The JTDB was established in 2003, authorised by the Japanese Association for The Surgery of Trauma (JAST), and operated by Japan Trauma Care and Research (JTCR). In 2018, 280 emergency medical institutes across Japan participated in registering trauma cases to the JTDB [25]. Background information such as age, gender, and the occurrence of drinking and driving is available as aggregated data, as well as the injured body region, severity, and information on operation, to support the understanding of the situation of bicycle injuries in Japan. Severity was reported in five scales: Abbreviated Injury Scale (AIS), Injury Severity Score (ISS), Revised Trauma Score (RTS), Trauma and Injury Severity Score (TRISS), and Glasgow Coma Scale (GCS), to assess both anatomical and physiological scores. No personal identifiers were recorded or used, and ethical approval was not required based on Ethics Guidelines.
2.2. Statistical Analysis
Poisson regression analysis was performed to estimate incidence rate ratios (IRR) in bicycle-related casualty and mortality rates by year and age group, with ages 40–49 as the reference, as this age group includes the average age of overall bicycle-related injuries. An interaction term for year and age group was included in the analysis to determine age-specific trends in IRR. IRR was selected as a choice of method to show the significance of relative incidence rate in bike injuries by age group in comparison with the average. IRR was calculated as the exponential of the corresponding coefficient of the Poisson regression model, following the method of McCullagh and Nelder [26]. Linear combinations of year, age group category, and their interaction were calculated in order to estimate the modelled casualty and death rate, and presented as annual percent changes (APC). Casualty rates were analysed by population. Mortality rates were analysed separately using two denominators: (a) the Japanese population and (b) the number of bicycle-related casualties. Mortality rates were analysed separately by sex for analysis among the Japanese population. IRRs and APCs were considered to be statistically significant when they were different from zero with a p-value of <0.05. For analysis of overall trends, crude rates and directly age-standardised (DSR) casualty and mortality rates per 100,000 population were computed with the 2010 population of Japan as a reference [27]. DSR express the weighted average of casualty and mortality with the weights being equal to the proportion of people in each age group in a chosen standard population [28]. The numbers of casualties in 2010 were used as reference to calculate age-standardised mortality rates per 100,000 casualties.
For demographic data, proportions of bicycle-related factors were compared with car and motorcycle crashes using a chi-squared test or a logistic regression model. All variables included both drivers and passengers, except for drinking under the influence, in which only drivers were included, to assess the influence of drunk riders. All analyses were conducted in Stata/BE version 17.0 (Stata Corp LP, College Station, TX, USA).
3. Results
3.1. Incidence and Trends in Bicycle-Related Casualties
The number of bicycle-related casualties decreased from 151,676 in 2010 to 66,137 in 2020. Table 1 shows the IRR of bicycle-related casualties in Japan by age group from 2010 to 2020. The upper half of the table displays the results of IRRs and 95% confidence intervals (CI).

Table 1.
Results of Poisson regression analysis of incidence rate ratios of bicycle-related casualties per population by age group (2010–2020).
All values showed statistical significance. The average rate of bicycle-related casualties in ages 10–19 was 3.77 times the incidence of ages 40–49, but the rate decreased by more than half in age groups 20–29 (IRR = 1.66, 95% CI [1.64–1.68]), nearly a quarter in 30–39-year-olds (0.99 [0.79–1.00]), and ranged from 0.81 to 1.19 in ages 50–79. Casualty per population was the lowest in age 80 and over, with an IRR of 0.64 [95% CI, 0.63–0.65] times the risk of 40–49-year-olds. The lower half of the table shows the effect of the interaction of age and year on IRRs. The average rate of incidence of bicycle-related casualty declined in 0–9-year-olds, but these rates of decline were attenuated in ages 30–39, 50–59, and 80 or older. Table S1 in the Supplementary Materials shows the IRR of bicycle-related casualties in Japan by age group in years 2010 and 2020 to see possible differences by year and population demographics. Similar to overall results from 2010 to 2020, ages 10–19 had the highest incidence rate. However, the lowest incidence rate was in ages 0–9 instead of age 80 and over in year 2020.
Figure 1 shows the crude and DSR of bicycle casualties per 100,000 population from 2010 to 2020. Decreasing trends in casualties were observed in both crude and age-standardised rates throughout the observation period.
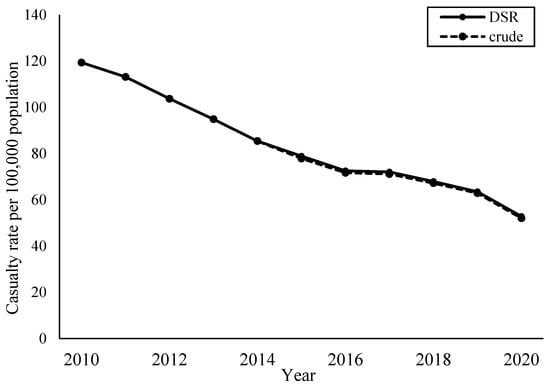
Figure 1.
Crude and directly age-standardised casualty rates per 100,000 population (2010–2020).
Table 2 shows the APCs in bicycle-related casualty per population by age group from 2010 to 2020, composed from the linear combinations of coefficients in the interaction model in Table 1. All APCs were statistically significant, where all results showed decreasing trends. The greatest decrease was seen in ages 0–9 with an APC of −9.77% [95% CI, −10.02 to −9.51] and the slowest decline was observed in the 80 and older population with a value of −4.95% [−5.22 to −4.68]. The trend in proportion of casualties by age group is shown as Supplemental Material (Figure S1).
Table 2.
Annual percent change in bicycle-related casualty per population among age groups (2010–2020).
3.2. Incidence and Trends in Bicycle-Related Mortality
3.2.1. Mortality per Population
There were 2014 bicycle-related deaths in the year 1995 (1366 men and 648 women), and 523 (337 men, 186 women) in 2020.
Table 3 shows the IRR of bicycle-related mortality per capita in Japan from 1995 to 2020 by gender. The IRR of bicycle-related mortality among boys aged 10–19 was 1.44 times that of those aged 40–49 years, but the rate decreased to just over half in age groups 20–29 (IRR = 0.42, 95% CI [0.36–0.50]) and 30–39 (0.50 [0.43–0.60]), and increased by age group after ages 40–49 years old. The IRR sharply increased to 12.62 [95% CI, 11.35–14.04] in men ages 70–79 and 28.15 [25.29–31.35] in ages 80 and over. For girls/women, analysis showed a similar trend to boys/men, except for ages 80 and over. The average rate of bicycle-related mortality for girls aged 10–19 was 1.57 times the mortality of ages 40–49. The rate increased by age group after ages 50–59 years old and was higher than that of men in 50- to 69-year-olds. The highest IRR for women was observed in age 70–79 at 10.67 [95% CI, 9.23–12.34] but decreased to 4.00 [3.36–4.75] in ages 80 and over. The average rate of incidence of bicycle-related mortality by year has declined in both genders, but these rates of declines were significantly attenuated in women and men aged 20–29 and women aged 80 and older. Table S2 shows Table 3 in separate periods, from 1995–2009 and 2010–2020 for comparable purposes. Both time periods showed similar results to Table 3. However, women older than 60 years old showed significantly higher risk of death in the previous decade.
Table 3.
Results of Poisson regression analysis of IRR of bicycle-related deaths per population by age group (1995–2020).
Figure 2 shows the crude and age-standardised mortality rates per 100,000 population by gender, from 1995 to 2020. Men had a higher rate of deaths than women throughout the observed period. Decreasing trends were observed in both crude and age-standardised rates for both genders throughout those periods with larger reductions in mortality among men.
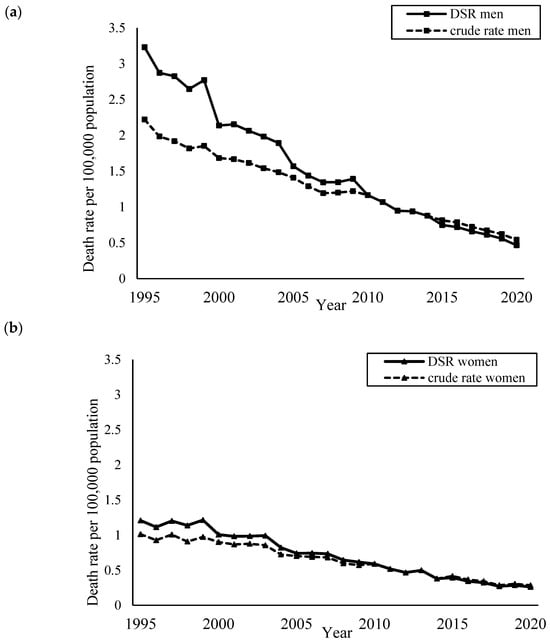
Figure 2.
Crude and directly age-standardised mortality rates per 100,000 population among (a) men and (b) women (1995–2020).
All annual percentage changes (APCs) were statistically significant for both genders, and all results showed decreasing trends (Table 4). For boys/men, the greatest decrease was seen in ages 0–9 with an APC of −8.54% [95% CI, −9.84 to −7.22] and the slowest decrease was observed in men in their 20s (−1.07% [−3.16 to −0.97]). Women showed similar trends to men until their 50s, with a large APC of −6.96% [95% CI, −9.13 to −4.74] in ages 0–9. However, the greatest decrease was observed in women in their 50s (IRR = −8.61, 95% CI [−9.37 to −7.86]), and the amount of decrease reduced with age. The APC for women aged 80 and older was −2.49% [95% CI, −3.19 to −1.78]. The trend in proportion of death by age group is shown as Supporting Information (Figure S2).
Table 4.
Annual percent change in bicycle-related death per population by gender among age groups (1995–2020).
3.2.2. Mortality Share of Casualties
Table 5 shows the IRR of bicycle-related mortality per number of casualties by age group from 2010 to 2020. The average rate of deaths over the number of casualties was significantly lower among cyclists aged 39 years and younger relative to 40–49-year-olds and decreased with age. In contrast, rates were significantly higher among those aged 50 and older and increased with age. The average death rate was highest in ages 80 years and older, which was 15.18 [95% CI, 12.72–18.11] times the age group of 40–49-year-olds, and lowest in ages 0–9-year-olds (0.39 [0.27–0.58]). Deaths per casualty did not show significant annual trends except for age nine and under with an upward trend.
Table 5.
Results of Poisson regression analysis of incidence rate ratios of bicycle-related deaths per casualty by age group (2010–2020).
Crude and age-standardised mortality rates per 100,000 casualties from 2010 to 2020 are shown in Figure 3. The crude mortality rate overall showed an increasing trend, but by adjusting with the age distribution of casualties in 2010, it showed a slightly decreasing trend.
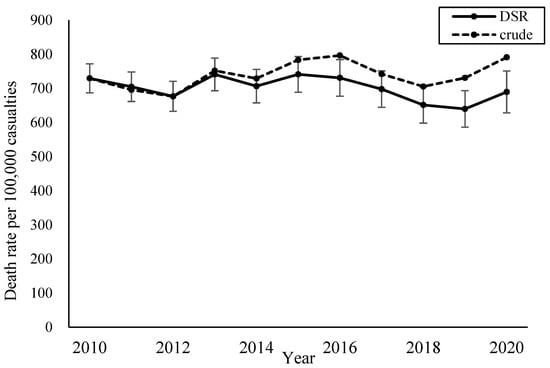
Figure 3.
Crude and directly age-standardised mortality rates per 100,000 bicycle-related casualties (2010–2020).
Table 6 shows the APCs of bicycle-related mortality per casualty from 2010 to 2020. No significant change was seen for APCs, except for a 1.75% [95% CI, −3.02 to −0.47] decrease in the 80 years and older age group. Figure S3 shows that the proportion of deaths by age group has been stable throughout the ten years for the majority of age groups.
Table 6.
Annual percent change in bicycle-related death per casualty among age groups (2010–2020).
3.2.3. Demographics and Severity of Bicycle-Related Injuries
Demographic data on vehicle-related injuries are shown in Table 7. Bicycle injuries had the highest percentage of drivers who reported drinking. They also experienced the highest percentage of head injuries (54.06%), which was more than twice as many compared to those who were injured in cars (26.23%), and operations on the head were also performed more commonly on bicycle riders (5.85%). The percentage of head injuries were highest at age 10–19, followed by age 70–79 and 80 and older (Table S3). All severity scores were most critical for cyclists among the three vehicles, except for ISS. The percentage of deaths was the highest at 9.62%, compared to 8.37% for cars, and 7.39% for motorcycles.
Table 7.
Overall demographics of traffic-related injuries by vehicle (2004–2018).
4. Discussion
This study shows that while the number and rate of bicycle-related crashes and deaths per 100,000 population have declined up to 2020, by analysing by age groups up to 80 years and older, it is notable that almost all age groups showed no significant decline in the risk of death per injury throughout the years, which indicates that the survival rate for bike-related injuries has not improved in the past decade. The older generation had the highest risk of bicycle-related deaths, and although the incidence of death is low in 20–39-year-olds, the mortality rate had minimal improvement compared to other groups. Compared to road injuries caused by other vehicles, cyclists were more prone to head injuries, more severely injured, and most likely to die in case of injury. They were also the most likely to drink and ride.
4.1. Current Situations in the High-Risk Groups and Age Groups with Minimal Decreasing Trend
In order to prevent road traffic injuries in the older generation, the Japanese government has promoted the return of licences by older drivers and encouraged them to use other transportation methods [29]. As a result, the many older people who forgo their licences are using bicycles as alternatives to maintain mobility [30,31]. The proportion of bicycle owners in these age groups increased from 21.3% in 2018 to 29.5% in 2021 [17]. However, bicycling is an accessible mode of transportation that comes with a high risk of failure, and it is a source of serious injury among older adults, which leads to an increase in injuries [7]. Our analysis showed that men over 70 years old and women aged 60–79 years old are at high risk of fatal injuries. Many older drivers think they are safe after switching to cycling after returning their drivers’ licence, but in reality, there are many factors among older people which lead to high risk in bike-related crashes in this group [10,32,33]. Furthermore, past studies have shown that older adults who were assessed to have a high likelihood of falling rode a bicycle regularly [7].
One significant result is the discrepancy of IRR between casualty and death (0.64 and 15.18) in the oldest people (age 80 and older). Past studies from other countries have shown that cyclists over 50 years old are more likely to be injured, but our study indicates that the oldest elderly people have a low risk of being involved in bicycle-related injuries compared to younger age groups [34]. However, despite the low risk of injury, they still have the highest death risk in case of injury, which emphasises the necessity for new measures in this growing age group. Further evaluation analysing the underlying factors, specifically in this age group, is urgently needed. However, statistics on exposure data of bicycle injuries are not reported specifically for this age group, which prevents further understanding.
On the other hand, cyclists aged 20–39 showed the least improvement in bicycle-related mortality over the years. In 2023, out of 72,339 bicycle-related collisions, 55,682 were caused by law violations [13]. Among those, people aged 24 and under violated the law the most, hence resulting in the large IRR of casualties in this age group [14]. In Japan, the main reason for using bicycles in the young adult population besides shopping and commuting, is to carry children [33]. Since 2009, the government legalised cyclists aged 16 and older to carry up to two children [11]. A possible reason for the limited decreasing trend in mortality rates in this age group may be the lack of compliance with bicycle safety and rules including parents carrying children [12]. Additionally, the media has reported more commercial bike-involved crashes after the outbreak of the COVID−19 pandemic, possibly due to more use of food delivery services [35]. Unfortunately, other than these facts, there is limited research on the causes of bicycle injuries in this age group [13,14,36,37,38].
4.2. Current Efforts by Japanese Society to Reduce Bicycle-Related Injuries
The Japanese government has proposed several policies to promote safety among cyclists from environmental, vehicle, and educational aspects. For example, Japanese electric bikes (e-bikes), for which ownership has more than doubled from 2012 to 2021, are required to be manufactured such that the assist ratio decreases after 10 km/h, and to avoid speeding, motor assist is more strictly restricted in Japan compared to other countries [17,39,40]. The government has also encouraged prefectures to obligate insurance coverage for bicycle owners, and finally, the obligation for cyclists in all age groups to make efforts to wear helmets, which started in April, 2023 [11,41]. Although it is not stated as ‘mandatory’, it is a step towards reducing fatal bicycle-related injuries. Finally, in November 2024, the Road Traffic Law was amended to strengthen penalties for driving under the influence of alcohol and while using a cell phone [42,43].
4.3. Suggestions for Reform to Improve Bicycle Safety in Japan
From our analysis and the past literature, it can be presumed that governmental efforts have shown success in decreasing injury and death among the Japanese population [44]. However, our study shows that specific measures are still needed especially to reduce fatal injuries in older adults and crashes in younger adults. Based on our results and past reports, we suggest mandatory helmet use, especially by older adults, and re-education of bicycle rules for both young and older adults.
Head injuries were the most affected body region for bicycle-related injuries in all age groups in our study and past reports [14,45,46]. Helmet use has been associated with reduced odds of head injuries among cyclists in other countries, and since the risk of death among casualties showed no improvement in our study, this should not be an exception in Japan [47,48,49,50]. Therefore, mandatory helmet use should be considered for all cyclists; especially for the older riders who have handed in their driving licence, to reduce the risk of mortality [47]. At the same time, 65 to 70% of fatal bicycle-injuries were caused by violating the law regardless of age [13]. Currently, educational events for cycling are mostly held for children in school, whereas adults have very limited opportunities to review or learn about bicycle safety [51]. Given that parents in their 20s’ and 30s’ tend to carry their children using bikes, educational events for this age group could be effective in reducing injuries among parents and also for bicycle-related death in 0–9year-olds who are carried by adults [22,52,53].
The strength of our study is the specific classification for older age groups. Ten-year-interval age groups are classified up to age 80, while most past studies on cyclists have classified the older population as ages 65 and older. Given Japan’s rapidly ageing population, more relevancies can be assessed not just for epidemiological purposes but also for policy change, when this generation is classified into more specific age groups. On the other hand, no covariates other than age and gender were used for adjustment, because of the limited information which could be derived from publicly available aggravated data. Despite the fact that Japan has the world’s most aging population, the majority of exposure factors on bicycle accidents in the older generation at a national level are reported as aged 65 and older as a whole, which is not in line with the reality of Japan’s current demographics and therefore of minimal use in developing preventive measures. Inclusion of exposure factors such as distances cycled, occupational, and other demographic information and analysis such as crash severity models may be relevant to understanding patterns of mortality in further studies.
5. Conclusions
While the Japanese government encourages older drivers to return their licences, based on the high IRR in deaths of the older cyclists, promotion of bike use in an ageing society may lead to increase in fatal injuries. This study showed that bicycle-related mortality has not decreased per casualty in Japan, which indicates the need for more comprehensive safety measures. These should include mandatory helmet use and re-education of cycling rules, especially for people aged over 70, to ensure a safe transition from cars to bicycle transportation for safety in all road users.
Efforts to improve safety should be implemented at various levels of society. The government should mandate helmet use, considering Japan’s status as the world’s most aged society. Education should target not only to the older generation but also police officers, families, and community organisations that serve elderly people. Older individuals need opportunities to become aware of the risks associated with cycling and to revisit bicycle laws, for example by being lectured when returning their drivers’ licences. Additionally, educating them on how their physical imbalance can increase the likelihood of falls is crucial and can also affect others. Families and communities also should be encouraged to be educated to recognise these risks and actively support and guide older individuals in choosing safer transportation options. Finally, local police need to be reminded of the heightened risks faced by the aging society, particularly as cycling becomes more common among older people, and implement strategies to prevent crashes through proper management and awareness.
As the Japanese population ages, and as the proportion of bicycle-related injuries increases, it is also important to develop credible indicators of the situation among older people, to evaluate environmental and vehicle-related factors in crashes, to suggest safety measures for this population. Re-evaluation of characteristics, strategies, and focus on implementation and country action based on population demographics, by re-examining the method in reporting bicycle injuries so more exposure factors can be in consideration, is key to achieving reductions in road traffic injuries for the next decade and beyond for all generations.
Supplementary Materials
The following supporting information can be downloaded at: https://www.mdpi.com/article/10.3390/ijerph22030322/s1, Figure S1: Proportion of bicycle-related casualties per population by age-group (2010–2020); Figure S2: Proportion of bicycle-related deaths per population by age-group (1995–2020); (Top) Men, (Bottom) Women; Figure S3: Proportion of deaths out of bicycle-related casualties by age-group (2010–2020); Table S1: Results of Poisson regression analysis of incidence rate ratios of bicycle-related casualties per population by age-group ((a) 2010, (b) 2020); Table S2: Results of Poisson regression analysis of IRR of bicycle-related deaths per population by age-group and year ((a) 1995–2009, (b) 2010–2020); Table S3: Number and percentage of injured body region by age-group (2004–2018).
Author Contributions
Conceptualization, S.T. and S.G.; methodology, S.G.; software, S.T.; validation, S.G.; formal analysis, S.T.; investigation, S.T.; resources, K.S.; data curation, S.G. and S.T.; writing—original draft preparation, S.T.; writing—review and editing, S.T., K.S. and S.G.; visualization, S.T.; supervision, S.G.; project administration, S.G. All authors have read and agreed to the published version of the manuscript.
Funding
This research received no external funding.
Institutional Review Board Statement
Not applicable.
Informed Consent Statement
Not applicable.
Data Availability Statement
Bicycle-related casualty and mortality data (the Annual Report of Traffic Accidents released by the National Police Agency and vital statistics registration of the Ministry of Health, Labour, and Welfare in Japan) were derived from a source in the public domain and available at https://www.e-stat.go.jp. Restrictions apply to the availability of the demographic data and are not publicly available. Data were obtained from The Japan Trauma Data Bank (JTDB) database and are available with the permission of Japan Trauma Care and Research, which requires appropriate ethical and governance clearances.
Acknowledgments
The authors would like to acknowledge Bibha Dhungel (University of Melbourne) for support in revising the original manuscript.
Conflicts of Interest
The authors declare no conflicts of interest.
References
- IPSOS. Cycling Across the World. 2022. Available online: https://www.ipsos.com/sites/default/files/ct/news/documents/2022-05/Global%20Advisor-Cycling%20Across%20the%20World-2022%20Report.pdf (accessed on 9 January 2025).
- Japan Bicycle Promotion Institute. Bicycle Statistics in Japan. 2017. Available online: https://jbpi.or.jp/wp-content/uploads/2022/12/toukeiyouran_51.pdf (accessed on 9 January 2025).
- Japan: Ministry of Land, Infrastructure, Transport and Tourism. Toshibu ni Wataru Hitono Ugoki to Sono Henka. 2024. Available online: https://www.mlit.go.jp/report/press/content/001711623.pdf (accessed on 9 January 2025).
- Japan: Cabinet Office. White Paper on Traffic Safety in Japan. 2023. Available online: https://www8.cao.go.jp/koutu/taisaku/r05kou_haku/english/pdf/wp2023.pdf (accessed on 9 January 2025).
- Harada, M. Jitenshano Tsukoukankyoto soukoukoudou no kenkyu. Sch. Des. Archit. Nagoya City Univ. Bull. 2019, 24, 37–51. [Google Scholar]
- Tokyo Metropolitan Public Safety. Tokyo Douro Koutsu Kisoku, Article 10-1. 1971. Available online: https://www.reiki.metro.tokyo.lg.jp/reiki/reiki_honbun/g101RG00002199.html (accessed on 14 January 2025).
- Sakurai, R.; Kawai, H.; Suzuki, H.; Ogawa, S.; Kim, H.; Watanabe, Y.; Hirano, H.; Ihara, K.; Obuchi, S.; Fujiwara, Y. An Epidemiological Study of the Risk Factors of Bicycle-Related Falls Among Japanese Older Adults. J. Epidemiol. 2019, 29, 487–490. [Google Scholar] [CrossRef] [PubMed]
- Au Insurance Co. Survey on Bicycle Use by People 65 Years and Older. 2022. Available online: https://www.au-sonpo.co.jp/corporate/news/detail-307.html (accessed on 15 January 2025).
- Sakurai, R.; Kawai, H.; Fukaya, T.; Yoshida, H.; Kim, H.; Hirano, H.; Suzuki, H.; Obuchi, S.; Fujiwara, Y. Incidence of bicycle-related accidents and subsequent injury in community-dwelling older adults: Understanding potential accidents. Jpn. J. Public Health 2015, 62, 251–258. [Google Scholar] [CrossRef]
- Sasaki, Y.; Fujiwara, K.; Mitobe, K. Risks that induce bicycle accidents: Measurement and analysis of bicyclist behavior while going straight and turning right using a bicycle simulator. Accid. Anal. Prev. 2024, 194, 107338. [Google Scholar] [CrossRef]
- Japan: Cabinet Office. Douro Koutsu Hou, Article 63-11, Act No. 32. Available online: https://www.npa.go.jp/laws/kaisei/02_youkou.pdf (accessed on 14 January 2025).
- Ohmori, Y. Bicycle Culture in Japan Derived from Mamachari. IATSS Rev. 2021, 46, 139–146. [Google Scholar] [CrossRef]
- Japan: National Police Agency. Statistics About Road Traffic. 2024. Available online: https://www.e-stat.go.jp/stat-search/files?page=1&layout=datalist&toukei=00130002&tstat=000001027457&cycle=7&year=20230&month=0&result_back=1&cycle_facet=cycle&tclass1val=0&metadata=1&data=1 (accessed on 15 January 2025).
- Japan: Metropolitan Police Department, Traffic Bureau. Reiwa Gonen Niokeru Koutsu Shibou Jikono Hasseijoukyou Nitsuite. 2024. Available online: https://www.npa.go.jp/publications/statistics/koutsuu/jiko/R05bunseki.pdf (accessed on 15 January 2025).
- Institute for Traffic Accident Research and Data Analysis. Number of Deaths by Gender, Age and Legal Violations. 2024. Available online: https://www.itarda.or.jp/contents/7917/with_authenticate/FM-30NM107 (accessed on 15 January 2024).
- Japan: Cabinet Office. Kourei Shakai Hakusho. Annual Report on the Aging Society. Available online: https://www8.cao.go.jp/kourei/whitepaper/w-2024/zenbun/pdf/1s1s_01.pdf (accessed on 15 January 2025).
- Japan Bicycle Promotion Institute. Jitensha Hoyu Narabini Shiyoujittaini Kansuru Chousahoukokusho. 2022. Available online: https://jbpi.or.jp/wp-content/uploads/2022/12/own_report_2021.pdf (accessed on 15 January 2025).
- Scarano, A.; Aria, M.; Mauriello, F.; Riccardi, M.R.; Montella, A. Systematic literature review of 10 years of cyclist safety research. Accid. Anal. Prev. 2023, 184, 106996. [Google Scholar] [CrossRef] [PubMed]
- Hyder, A.A.; Hoe, C.; Hijar, M.; Peden, M. The political and social contexts of global road safety: Challenges for the next decade. Lancet 2022, 400, 127–136. [Google Scholar] [CrossRef]
- James, S.L.; Lucchesi, L.R.; Bisignano, C.; Castle, C.D.; Dingels, Z.V.; Fox, J.T.; Hamilton, E.B.; Liu, Z.; McCracken, D.; Nixon, M.R.; et al. Morbidity and mortality from road injuries: Results from the Global Burden of Disease Study 2017. INJ. Prev. 2020, 26 (Suppl. S1), i46–i56. [Google Scholar] [CrossRef]
- Tripodi, A.; Persia, L. Impact of e-safety applications on cyclists’ safety. Int. J. Inj. Control Saf. Promot. 2015, 22, 377–386. [Google Scholar] [CrossRef] [PubMed]
- Japan: National Police Agency. Trend in Casualties of Pedal Cyclists by Age Group. 2021. Available online: https://www.e-stat.go.jp/stat-search/files?page=1&layout=datalist&toukei=00130002&tstat=000001027457&cycle=7&year=20200&month=0&result_back=1&cycle_facet=cycle&tclass1val=0&metadata=1&data=1 (accessed on 18 February 2021).
- Tokyo, Japan: Ministry of Health Labour and Welfare. General Mortality: Deaths by Causes, Sex and Age: Japan [Dataset]. Vital Statistics of Japan. Available online: https://www.e-stat.go.jp/stat-search/files?page=1&query=ICD&layout=dataset&metadata=1&data=11995-2020 (accessed on 17 September 2020).
- World Health Organization. International Statistical Classification of Diseases and Related Health Problems, 10th Revision, Fifth Edition, 2016. 2015. Available online: https://apps.who.int/iris/handle/10665/246208 (accessed on 17 September 2020).
- Japan Trauma Care and Research. Japan Trauma Data Bank Report 2020. 2021. Available online: https://jtcr-jatec.org/traumabank/dataroom/dataroom.htm (accessed on 4 October 2021).
- McCullagh, P.; Nelder, J.A. Generalized Linear Models, 2nd ed.; Chapman and Hall/CRC: Boca Raton, FL, USA, 1989. [Google Scholar]
- Ahmad, O.B.; Boschi, C.P.; Lopez, A.; Murray, C.; Lozano, R.; Inoue, M. Age Standardization of Rates: A New WHO Standard; World Health Organization: Geneva, Switzerland, 2001; p. 10. Available online: https://cdn.who.int/media/docs/default-source/gho-documents/global-health-estimates/gpe_discussion_paper_series_paper31_2001_age_standardization_rates.pdf (accessed on 15 April 2022).
- Australian Institute of Health and Welfare. Principles on the Use of Direct Age-Standardisation in Administrative Data Collections: For Measuring the Gap Between Indigenous and Non-Indigenous Australians; Cat. no. CSI 12; AIHW: Canberra, Australia, 2011. Available online: https://www.aihw.gov.au/getmedia/95237794-4b77-4683-9f00-77c4d33e0e7c/13406.pdf.aspx?inline=true (accessed on 20 December 2024).
- Japan: National Police Agency. The White Paper on Police. 2020. Available online: https://www.npa.go.jp/hakusyo/r02/pdf/02_tokushu.pdf (accessed on 15 January 2025).
- Inada, H.; Tomio, J.; Nakahara, S.; Ichikawa, M. Association between mandatory cognitive testing for license renewal and motor vehicle collisions and road injuries. J. Am. Geriatr. Soc. 2023, 71, 1145–1155. [Google Scholar] [CrossRef]
- Japan: Ministry of Land, Infrastructure, Transport and Tourism. Jitensha Katsuyo Suishin Keikaku. 2021. Available online: https://www.mlit.go.jp/report/press/content/001406524.pdf (accessed on 15 January 2025).
- Japan: National Police Agency. Jitensha Kanren Koutsujikono Joukyou. 2022. Available online: https://www.npa.go.jp/koutsuu/kikaku/bicycle/kentokai/01/siryou07.pdf (accessed on 17 December 2023).
- Tokyo Metropolitan Government. Jitenshano Anzende Tekiseina Riyou. 2018. Available online: https://www.metro.tokyo.lg.jp/tosei/hodohappyo/press/2018/09/11/documents/01_00.pdf (accessed on 14 January 2025).
- Vanparijs, J.; Int Panis, L.; Meeusen, R.; de Geus, B. Exposure measurement in bicycle safety analysis: A review of the literature. Accid. Anal. Prev. 2015, 84, 9–19. [Google Scholar] [CrossRef] [PubMed]
- Nihon Keizai Shimbun. Gyoumuchuno Jitenshajiko Zouka Takuhai Service Eikyouka. 2020. Available online: https://www.nikkei.com/article/DGXMZO66160260S0A111C2CR8000/ (accessed on 15 October 2021).
- Japan: Cabinet Office. White Paper on Traffic Safety in Japan. 2016. Available online: https://www8.cao.go.jp/koutu/taisaku/h28kou_haku/english/wp2016-pdf (accessed on 11 March 2023).
- Institute for Traffic Accident Research and Data Analysis. Number of Bicycle and Pedestrian Deaths by Human Factor, Gender, and Age-Group. 2024. Available online: https://www.itarda.or.jp/contents/8099/with_authenticate/FM-31NM102 (accessed on 13 January 2025).
- Japan: Metropolitan Police Department, Traffic Planning Division. Jitensha Jikoni Kakawaru Bunseki. 2019. Available online: https://www.npa.go.jp/bureau/traffic/bunseki/sonota/310425jitensha.pdf (accessed on 17 October 2021).
- Requirements for Low-Speed Electric Bicycles; Public Law 107–319; Consumer Product Safety Commission: Washington, DC, USA, 2002. Available online: https://www.cpsc.gov/PageFiles/93295/low.pdf (accessed on 4 February 2024).
- Japan: Cabinet Office. Douro Koutsu Hou, Article 1–3. Available online: https://laws.e-gov.go.jp/law/335M50000002060/20240629_506M60000002059#Mp-Ch_1-At_1_3 (accessed on 4 January 2023).
- Japan: Ministry of Land, Infrastructure, Transport and Tourism. Dai2ji Jitensha Katuyou Suishinkeikaku No Gaiyou. 2021. Available online: https://www.mlit.go.jp/road/bicycleuse/pdf/gaiyo2.pdf (accessed on 15 January 2025).
- Japan: Cabinet Office. Douro Koutsu Hou, Article 117-2, Act No. 34. Available online: https://laws.e-gov.go.jp/law/335AC0000000105#Mp-Ch_8-At_117_2 (accessed on 14 January 2025).
- Japan: Cabinet Office. Douro Koutsu Hou, Article 71-5, Act No. 34. Available online: https://laws.e-gov.go.jp/law/335AC0000000105#Mp-Ch_4-Se_1-At_71 (accessed on 14 January 2025).
- Inada, H.; Tomio, J.; Nakahara, S.; Ichikawa, M. Area-Wide Traffic-Calming Zone 30 Policy of Japan and Incidence of Road Traffic Injuries Among Cyclists and Pedestrians. Am. J. Public Health 2020, 110, 237–243. [Google Scholar] [CrossRef] [PubMed]
- Matsui, Y.; Doi, T.; Oikawa, S.; Ando, K. Features of fatal pedestrian injuries in vehicle-to-pedestrian accidents in Japan. SAE Int. J. Transp. Saf. 2013, 1, 297–308. [Google Scholar] [CrossRef]
- Oikawa, S.; Matsui, Y.; Nakadate, H.; Aomura, S. Factors in fatal injuries to cyclists impacted by five types of vehicles. Int. J. Automot. Technol. 2019, 20, 197–205. [Google Scholar] [CrossRef]
- Hoye, A. Recommend or mandate? A systematic review and meta-analysis of the effects of mandatory bicycle helmet legislation. Accid. Anal. Prev. 2018, 120, 239–249. [Google Scholar] [CrossRef]
- Olivier, J.; Creighton, P. Bicycle injuries and helmet use: A systematic review and meta-analysis. Int. J. Epidemiol. 2016, 46, 278–292. [Google Scholar] [CrossRef]
- Büth, C.M.; Barbour, N.; Abdel-Aty, M. Effectiveness of bicycle helmets and injury prevention: A systematic review of meta-analyses. Sci. Rep. 2023, 13, 8540. [Google Scholar] [CrossRef] [PubMed]
- Bahrololoom, S.; Young, W.; Logan, D. Modelling injury severity of bicyclists in bicycle-car crashes at intersections. Accid. Anal. Prev. 2020, 144, 105597. [Google Scholar] [CrossRef]
- Nakanishi, M. Education for Cyclists. IATSS Rev. 2016, 41, 41–49. [Google Scholar]
- Orsi, C.; Montomoli, C.; Otte, D.; Morandi, A. Road accidents involving bicycles: Configurations and injuries. Int. J. Inj. Control. Saf. Promot. 2017, 24, 534–543. [Google Scholar] [CrossRef]
- Samerei, S.A.; Aghabayk, K.; Shiwakoti, N.; Mohammadi, A. Using latent class clustering and binary logistic regression to model Australian cyclist injury severity in motor vehicle-bicycle crashes. J. Saf. Res. 2021, 79, 246–256. [Google Scholar] [CrossRef] [PubMed]
Disclaimer/Publisher’s Note: The statements, opinions and data contained in all publications are solely those of the individual author(s) and contributor(s) and not of MDPI and/or the editor(s). MDPI and/or the editor(s) disclaim responsibility for any injury to people or property resulting from any ideas, methods, instructions or products referred to in the content. |
© 2025 by the authors. Licensee MDPI, Basel, Switzerland. This article is an open access article distributed under the terms and conditions of the Creative Commons Attribution (CC BY) license (https://creativecommons.org/licenses/by/4.0/).