Adolescent Smartphone Overdependence in South Korea: A Place-Stratified Evaluation of Conceptually Informed AI/ML Modeling
Abstract
1. Introduction
Research Aims and Contributions
- Develop a high-performing low-risk screening tool to detect adolescents at risk of smartphone overdependence using conceptually informed AI/ML modeling;
- Leverage AI/ML toward construct exploration of contributing factors;
- Provide place-based policy profiles that offer insights into local variations in risk factors and model performance, enabling targeted intervention.
2. Materials and Methods
2.1. Data
2.2. Outcome
2.3. Conceptual Feature Selection and Construct Grouping
- Intent to Seek Smartphone Education. This construct captures adolescents’ intention to engage in preventive education related to smartphone use [48]. Intention to seek smartphone education can be understood as a proxy within the broader help-seeking framework for behavioral addictions. Treatment- or help-seeking studies highlight its association with smartphone struggles across countries [48,49,50] and in other smartphone-accessible issues such as internet gaming disorder, internet addiction, and social network sites [51,52].
- Preventive Education. This reflects actual participation in any educational or intervention programs to prevent smartphone addiction [53,54]. Although evidence for their efficacy and effectiveness remains mixed [55,56,57,58], adolescents who have received such education often demonstrate greater awareness and are more likely to engage in help-seeking behaviors. Those who have received such education tend to have greater awareness of the risks, perceive the programs as more helpful when at high risk, and even demonstrate reduced overdependence and improved self-control in some cases [53,59,60].
- Smartphone Use Cases. This measures the frequency of engagement with different smartphone functions (e.g., gaming, video streaming, and navigation) [61]. Prior studies have found important associations between the types of smartphone use and overdependence across populations, including adolescents [34,62]. Entertainment and social networking applications, in particular, have been linked to increased overdependence due to their reward structures and habit-forming properties [63].
- Home Environment. The home environment includes both physical and psychological aspects of the household context [64]. Prior studies have shown that conditions such as socioeconomic status, family structure, and parental support can shape adolescent behavior and potentially influence smartphone use [65,66]. For instance, socioeconomic status is linked to adolescents’ screen media use [67].
- Parental Prevention Efforts. Parental prevention efforts refer to the strategies parents use to manage and guide their children’s media use, including rule-setting, supervision, and open dialogue [68,69,70]. Active parental prevention efforts have been found to reduce risk of smartphone addiction, while overly restrictive or absent parenting may increase it [71,72,73]. In addition, parental mediation and psychological control significantly predict problematic smartphone use through mechanisms such as psychological reactance and resilience [71,74,75].
- Perceived Digital Competence and Risk. This construct refers to individuals’ perceived abilities to effectively navigate digital environments (e.g., digital content creation and privacy awareness) as well as their perceived smartphone issues (e.g., excessive use and difficulty controlling short-form video consumption). These perceptions may shape how individuals engage with digital technology and manage potential overdependence [83]. Notably, from a cognitive–behavioral perspective, such self-evaluations can reflect cognitive distortions [84]. In the smartphone literature, maladaptive cognitions and impaired self-regulation reinforce problematic use [46,47]. In addition, Perceived Digital Competence has emerged as a relevant construct where prior research has demonstrated that higher digital literacy can buffer risks in some groups but also exacerbate overdependence when combined with stress or limited coping resources [85].
- Smartphone Consequences and Dependence. Smartphone Consequences and Dependence is characterized by emotional suffering, typically involving symptoms of depression and anxiety [19,90,91]. Excessive smartphone use has been linked to increased psychological distress and related cognitive and neurological effects [19,92].
2.4. Artificial Intelligence/Machine Learning Models
2.4.1. Conceptual Framework
2.4.2. AI/ML Classification Modeling
Data Processing
AI/ML Procedures
2.4.3. Explainable AI (XAI) Techniques
2.4.4. Place-Stratified Predictive Analysis
3. Results
3.1. Sample Descriptives
3.2. Overview of AI/ML Results
3.2.1. Performance Comparison for Nested AI/ML Classifiers
3.2.2. Performance Comparison Between Construct-Based AI/ML Classifiers
3.3. Four Exemplar Models
3.3.1. M4 (+Smartphone Use Cases) Nested Model
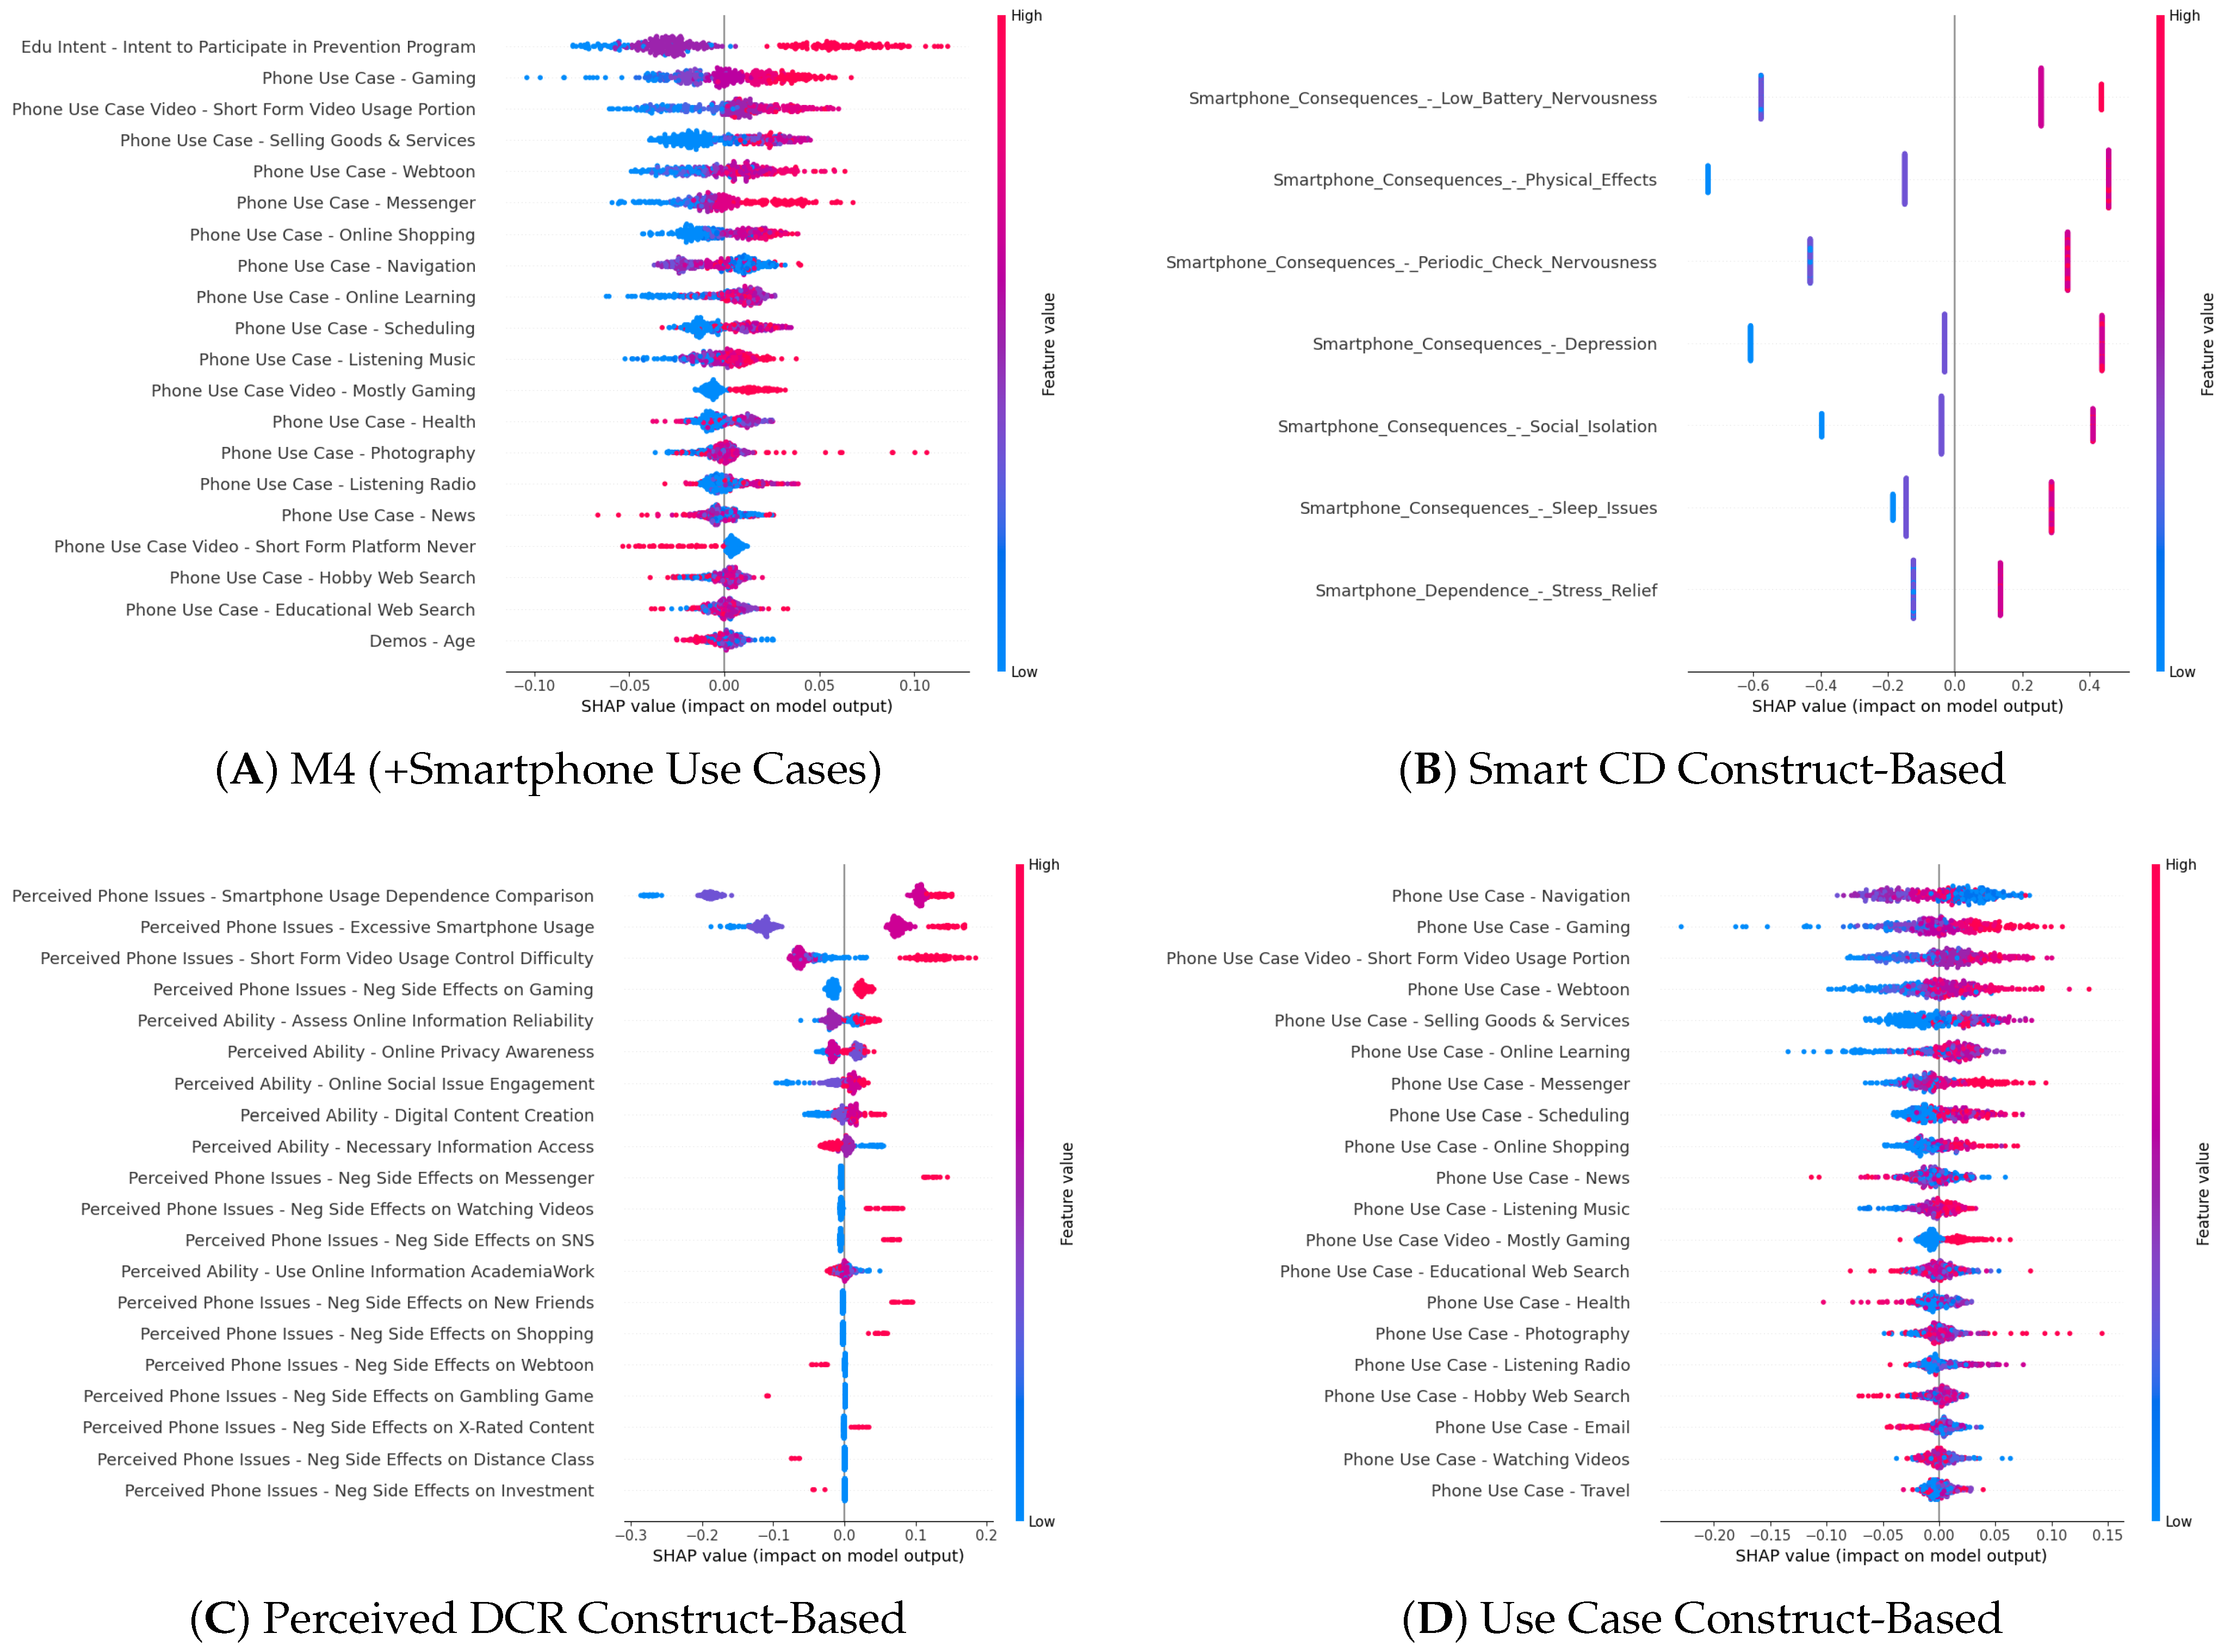
Feature Importance
Place-Stratified Results
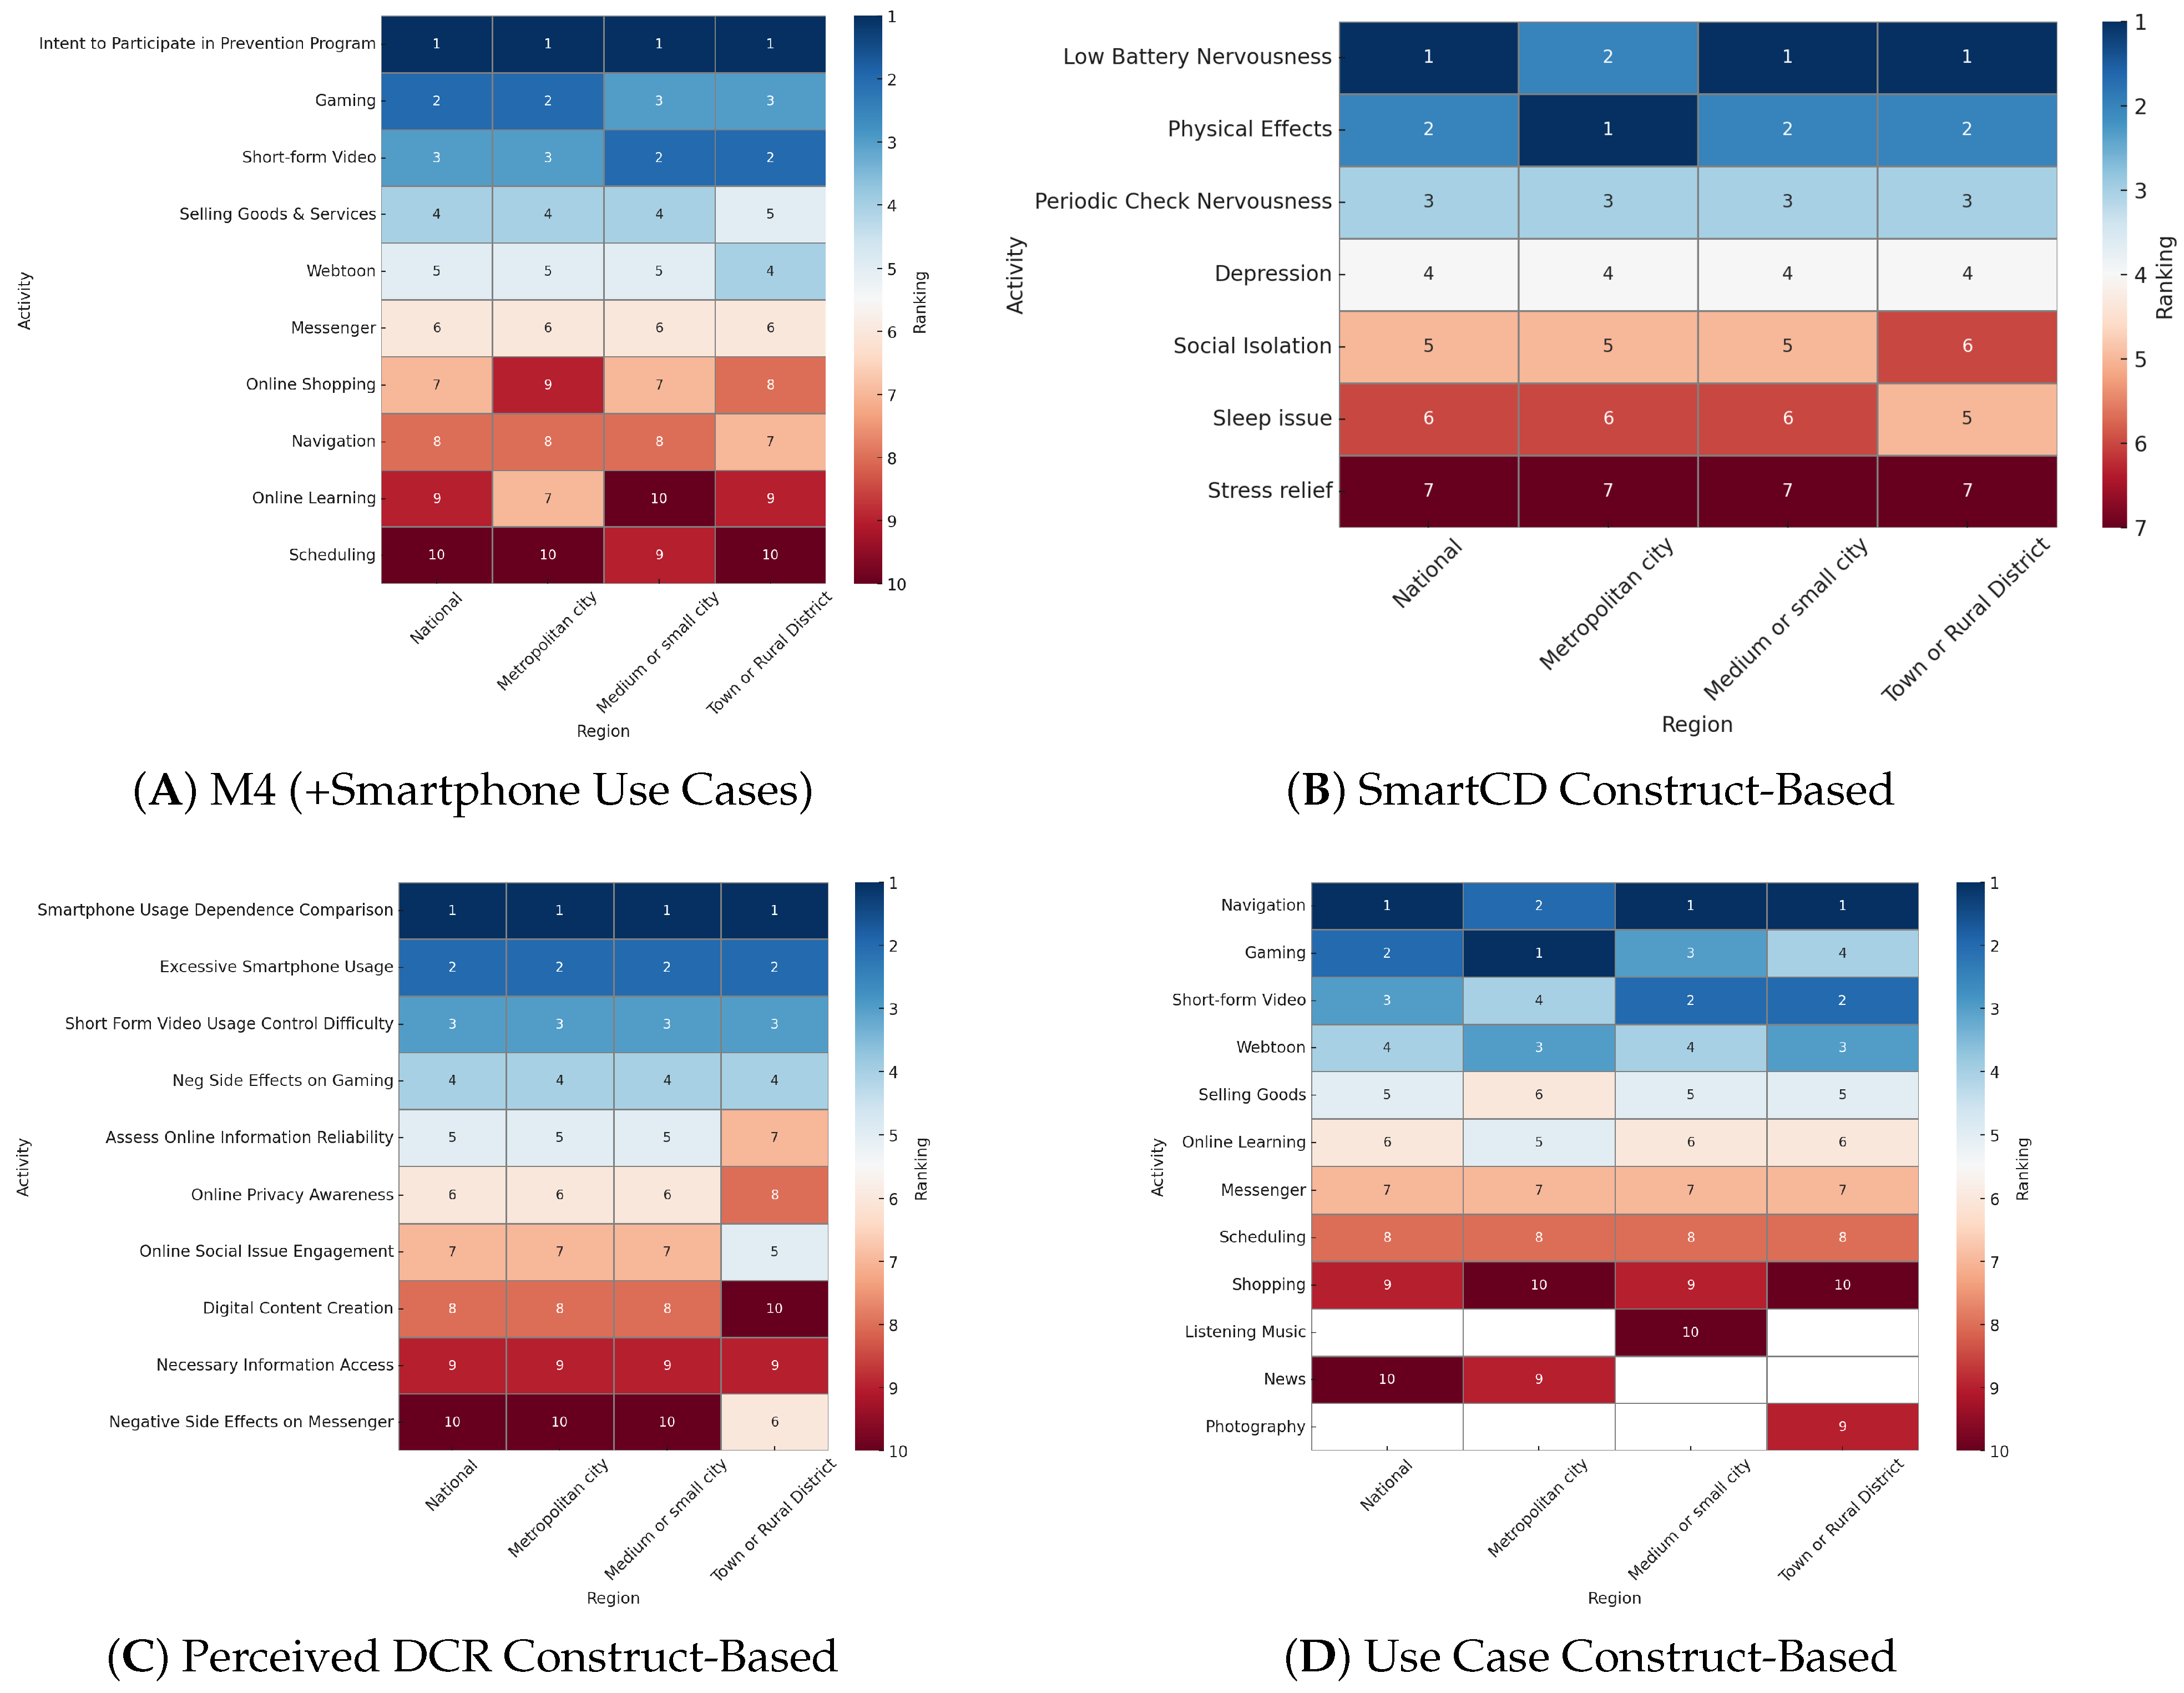
Placed-Stratified Feature Importance
3.3.2. Smartphone Consequences and Dependence Classifier Results
Feature Importance
Place-Stratified Results
Placed-Stratified Feature Importance
3.3.3. Perceived Digital Competence and Risk Classifier Results
Feature Importance
Place-Stratified Results
Placed-Stratified Feature Importance
3.3.4. Smartphone Use Case Results
Feature Importance
Place-Stratified Results
Placed-Stratified Feature Importance
4. Discussion
4.1. Place-Based Policy Implication Profiles
4.1.1. Metropolitan Cities
4.1.2. Medium and Small Cities
4.1.3. Towns and Rural Districts
4.2. Limitations and Future Research
5. Conclusions
Author Contributions
Funding
Institutional Review Board Statement
Data Availability Statement
Conflicts of Interest
Appendix A. Conceptual Feature Selection and Construct Grouping
| Domains/Constructs | Features |
|---|---|
| Demographics | Male |
| Age | |
| Elementary School | |
| Middle School | |
| High School | |
| Urbanicity | Metropolitan City |
| Medium/Small City | |
| Town/Rural District | |
| Preventive Education Experiences | Smartphone Overdependence Prevention Education |
| Awareness of Smartphone Overdependence Treatment | |
| Intent to Seek Smartphone Education | Intent to Participate in Prevention Program |
| Smartphone Use Cases | Phone Use Case—Email |
| Phone Use Case—Messenger | |
| Phone Use Case—Making New Friends | |
| Phone Use Case—Scheduling | |
| Phone Use Case—Health | |
| Phone Use Case—Zoom Meetings | |
| Phone Use Case—Online Shopping | |
| Phone Use Case—Selling Goods and Services | |
| Phone Use Case—Banking | |
| Phone Use Case—Investment | |
| Phone Use Case—Gaming | |
| Phone Use Case—Watching Videos | |
| Phone Use Case—Listening Music | |
| Phone Use Case—Listening Radio | |
| Phone Use Case—Webtoon | |
| Phone Use Case—Photography | |
| Phone Use Case—Travel | |
| Phone Use Case—Adult Content | |
| Phone Use Case—Gambling | |
| Phone Use Case—News | |
| Phone Use Case—Educational Web Search | |
| Phone Use Case—Hobby Web Search | |
| Phone Use Case—Navigation | |
| Phone Use Case—Online Learning | |
| Smartphone Online Video Usage | |
| Phone Use Case Video—Short-Form Platform YouTube | |
| Phone Use Case Video—Short-Form Platform TikTok | |
| Phone Use Case Video—Short-Form Platform Reels | |
| Phone Use Case Video—Short-Form Platform, Etc. | |
| Phone Use Case Video—Short-Form Platform Never | |
| Phone Use Case Video—Short-Form Video Usage Portion | |
| Phone Use Case Video—Mostly Food | |
| Phone Use Case Video—Mostly Sports | |
| Phone Use Case Video—Mostly Fashion/Beauty | |
| Phone Use Case Video—Mostly Gaming | |
| Phone Use Case Video—Mostly Dramas/Variety Show | |
| Phone Use Case Video—Mostly Animation/Comics | |
| Phone Use Case Video—Mostly TV/Entertainment | |
| Phone Use Case Video—Mostly Music/Dance | |
| Phone Use Case Video—Mostly Talk/Streaming | |
| Phone Use Case Video—Mostly Movies | |
| Phone Use Case Video—Mostly Products | |
| Phone Use Case Video—Mostly Current Affairs | |
| Phone Use Case Video—Mostly Lifestyle | |
| Phone Use Case Video—Mostly Edu | |
| Phone Use Case Video—Mostly Kids | |
| Phone Use Case Video—Mostly Vlog | |
| Phone Use Case Video—Mostly Other | |
| Home Environment | House |
| Apartment | |
| Mansion | |
| etc. | |
| Multicultural Family | |
| Single Parent Family | |
| Both Parents Work | |
| Monthly Family Income | |
| Parental Prevention Efforts | Complete Smartphone Use Restriction |
| Limit Smartphone Usage Time | |
| Restrict Smartphone Apps | |
| Teach Smartphone Usage | |
| Smartphone Use Pros and Cons | |
| Recommended Beneficial Smartphone Apps | |
| Use Beneficial Apps Together | |
| Use Beneficial Games Together | |
| Family Smartphone Rules | |
| Social Support | Family Support Generosity |
| Friend Support In Difficulty | |
| Society Fair Opportunities and Benefits |
| Domains/Constructs | Features |
|---|---|
| Self-Regulation Assessments | Smartphone Usage Avoidance While Walking |
| Smartphone Usage Habit Check | |
| Smartphone Usage History Check | |
| Digital Detox | |
| Designated Smartphone Placement | |
| Use Work Mode | |
| Direct Conversation | |
| Hobby Engagement | |
| Perceived Digital Competence and Risk | Perceived Phone Issues—Smartphone Usage Dependence Comparison |
| Perceived Phone Issues—Neg Side Effects on SNS | |
| Perceived Phone Issues—Neg Side Effects on Email | |
| Perceived Phone Issues—Neg Side Effects on Messenger | |
| Perceived Phone Issues—Neg Side Effects on New Friends | |
| Perceived Phone Issues—Neg Side Effects on Scheduling | |
| Perceived Phone Issues—Neg Side Effects on Health | |
| Perceived Phone Issues—Neg Side Effects on Zoom | |
| Perceived Phone Issues—Neg Side Effects on Shopping | |
| Perceived Phone Issues—Neg Side Effects on Selling | |
| Perceived Phone Issues—Neg Side Effects on Banking | |
| Perceived Phone Issues—Neg Side Effects on Investment | |
| Perceived Phone Issues—Neg Side Effects on Gaming | |
| Perceived Phone Issues—Neg Side Effects on Watching Videos | |
| Perceived Phone Issues—Neg Side Effects on Listening Music | |
| Perceived Phone Issues—Neg Side Effects on Listening Radio | |
| Perceived Phone Issues—Neg Side Effects on Webtoon | |
| Perceived Phone Issues—Neg Side Effects on Photography | |
| Perceived Phone Issues—Neg Side Effects on Travel | |
| Perceived Phone Issues—Neg Side Effects on X-Rated Content | |
| Perceived Phone Issues—Neg Side Effects on Gambling Game | |
| Perceived Phone Issues—Neg Side Effects on News | |
| Perceived Phone Issues—Neg Side Effects on Edu | |
| Perceived Phone Issues—Neg Side Effects on Interests | |
| Perceived Phone Issues—Neg Side Effects on Navigation | |
| Perceived Phone Issues—Neg Side Effects on Distance Class | |
| Perceived Phone Issues—Excessive Smartphone Usage | |
| Perceived Phone Issues—Short-Form Video Usage Control Difficulty | |
| Perceived Competence—Necessary Information Access | |
| Perceived Competence—Assess Online Information Reliability | |
| Perceived Competence—Online Social Issue Engagement | |
| Perceived Competence—Digital Content Creation | |
| Perceived Competence—Online Privacy Awareness | |
| Perceived Competence—Use Online Information Academia Work | |
| Life Satisfaction | Relationship Satisfaction |
| Work Satisfaction | |
| Leisure Activities Satisfaction | |
| Overall Life Satisfaction | |
| Smartphone Consequences and Dependence | Smartphone Periodic Check Nervousness |
| Smartphone Low-Battery Nervousness | |
| Smartphone Usage Depression | |
| Smartphone Usage Physical Effects | |
| Smartphone Usage Sleep Issues | |
| Smartphone Communication Social Isolation | |
| Stress Relief Through Smartphone |
Appendix B. Hyperparameters for Our 4 Exemplar Models
| Model Name | Algorithm | Hyperparameters |
|---|---|---|
| Nest M4 model | Random Forest | n_estimators = 1967; max_depth = 81; min_samples_split = 4; min_samples_leaf = 1 |
| SmartCD Only | LightGBM | n_estimators = 254; learning_rate = 0.064495018055983; max_depth = 3; num_leaves = 222; min_child_samples = 17; feature_fraction = 0.469378476101846; bagging_fraction = 0.52804982292064; bagging_freq = 6; lambda_l1 = 0.186535833027839; lambda_l2 = 0.0000131738014410991 |
| Perceived DCR Only | XGBoost | num_boost_round = 674; subsample = 0.85597440455654; min_child_weight = 1; max_depth = 38; learning_rate = 0.0127554708475019; = 0.229654735805916; colsample_bytree = 0.287803548558039; reg_alpha = 0.00651358918568053; reg_lambda = 0.791652034688638 |
| Use Case Only | XGBoost | num_boost_round = 562; subsample = 0.583206150016204; min_child_weight = 1; max_depth = 74; learning_rate = 0.0113916452910645; = 0.00109214155684023; colsample_bytree = 0.300084001241431; reg_alpha = 0.277286668793397; reg_lambda = 0.0305140602390746 |
Appendix C. Sample Descriptives
Appendix C.1. Place-Stratified Descriptive Comparisons
| Variable Category | Variable | Metropolitan City (n = 831) | Medium/Small City (n = 714) | Town/Rural District (n = 328) | p-Value |
|---|---|---|---|---|---|
| Demographics | |||||
| Age (mean, SD) | 14.35 (2.35) | 14.35 (2.45) | 14.29 (2.4) | 0.917 | |
| Sex (Male; n (%)) | 401 (48.3%) | 355 (49.7%) | 144 (43.9%) | 0.215 | |
| Elementary School Students (n (%)) | 205 (24.7%) | 189 (26.5%) | 88 (26.8%) | 0.637 | |
| Middle School Students (n (%)) | 317 (38.1%) | 263 (36.8%) | 127 (38.7%) | 0.802 | |
| High School Students (n (%)) | 309 (37.2%) | 262 (36.7%) | 113 (34.5%) | 0.679 | |
| Home Environment | |||||
| House (n (%)) | 167 (20.1%) | 152 (21.3%) | 90 (27.4%) | 0.022 * | |
| Apartment (n (%)) | 473 (56.9%) | 394 (55.2%) | 172 (52.4%) | 0.377 | |
| Mansion (n (%)) | 170 (20.5%) | 129 (18.1%) | 53 (16.2%) | 0.197 | |
| Other Housing (n (%)) | 21 (2.5%) | 39 (5.5%) | 13 (4.0%) | - | |
| Multicultural Family (n (%)) | 7 (0.8%) | 2 (0.3%) | 4 (1.2%) | - | |
| Single-Parent Family (n (%)) | 55 (6.6%) | 60 (8.4%) | 31 (9.5%) | 0.200 | |
| Both Parents Working (n (%)) | 588 (70.8%) | 520 (72.8%) | 236 (72.0%) | 0.664 | |
| Monthly Household Income (mean, SD) | 3.26 (0.75) | 3.2 (0.82) | 3.23 (0.77) | 0.424 | |
| Smartphone Use Cases | |||||
| Email (M (SD)) | 1.85 (1.89) | 1.89 (1.89) | 1.98 (2.05) | 0.601 | |
| Messenger (M (SD)) | 5.31 (1.46) | 5.41 (1.42) | 5.02 (1.75) | <0.001 *** | |
| Making New Friends (M (SD)) | 1.45 (1.98) | 1.25 (1.79) | 1.33 (1.85) | 0.126 | |
| Scheduling (M (SD)) | 2.06 (2.13) | 1.86 (2.06) | 1.62 (2.08) | 0.004 ** | |
| Health (M (SD)) | 1.76 (2.04) | 1.59 (1.91) | 1.46 (1.98) | 0.045 * | |
| Zoom Meetings (M (SD)) | 0.73 (1.57) | 0.54 (1.33) | 0.59 (1.41) | 0.030 * | |
| Online Shopping (M (SD)) | 2.1 (2.16) | 2.04 (2.13) | 2.18 (2.32) | 0.596 | |
| Selling Goods and Services (M (SD)) | 1.65 (2.06) | 1.51 (2.0) | 1.77 (2.27) | 0.149 | |
| Banking (M (SD)) | 1.49 (1.93) | 1.39 (1.85) | 1.35 (2.01) | 0.411 | |
| Investment (M (SD)) | 0.86 (1.52) | 0.63 (1.28) | 0.62 (1.29) | <0.001 *** | |
| Gaming (M (SD)) | 4.89 (1.83) | 4.92 (1.73) | 4.63 (1.97) | 0.052 | |
| Watching Videos (M (SD)) | 5.25 (1.62) | 5.32 (1.58) | 5.02 (1.81) | 0.018 * | |
| Listening Music (M (SD)) | 4.51 (1.97) | 4.48 (2.04) | 4.03 (2.35) | <0.001 *** | |
| Listening Radio (M (SD)) | 1.55 (2.03) | 1.69 (2.08) | 1.54 (2.09) | 0.380 | |
| Webtoon (M (SD)) | 3.35 (2.27) | 3.32 (2.2) | 3.11 (2.33) | 0.241 | |
| Variable Category | Variable | Metropolitan City (n = 831) | Medium/Small City (n = 714) | Town/Rural District (n = 328) | p-Value |
|---|---|---|---|---|---|
| Photography (M (SD)) | 3.5 (1.96) | 3.43 (1.94) | 3.42 (2.2) | 0.745 | |
| Travel (M (SD)) | 1.71 (1.94) | 1.6 (1.86) | 1.84 (2.04) | 0.144 | |
| Adult Content (M (SD)) | 0.5 (1.15) | 0.33 (0.94) | 0.3 (0.94) | <0.001 *** | |
| Gambling (M (SD)) | 0.48 (1.2) | 0.29 (0.87) | 0.32 (1.04) | <0.001 *** | |
| News (M (SD)) | 2.57 (2.21) | 2.3 (2.04) | 2.16 (2.16) | 0.004 ** | |
| Educational Web Search (M (SD)) | 4.06 (1.81) | 3.84 (1.78) | 3.64 (2.26) | 0.002 ** | |
| Hobby Web Search (M (SD)) | 3.87 (1.9) | 3.73 (1.9) | 3.68 (2.25) | 0.234 | |
| Navigation (M (SD)) | 2.42 (1.92) | 2.37 (1.95) | 2.12 (2.0) | 0.049 * | |
| Online Learning (M (SD)) | 3.63 (2.23) | 3.45 (2.2) | 3.62 (2.33) | 0.274 | |
| Smartphone Online Video Usage (n (%)) | 798 (96.0%) | 694 (97.2%) | 313 (95.4%) | 0.285 | |
| Short-Form Platform YouTube (n (%)) | 443 (53.3%) | 315 (44.1%) | 162 (49.4%) | 0.002 ** | |
| Short-Form Platform TikTok (n (%)) | 145 (17.4%) | 165 (23.1%) | 68 (20.7%) | 0.021 * | |
| Short-Form Platform Reels (n (%)) | 77 (9.3%) | 81 (11.3%) | 34 (10.4%) | 0.405 | |
| Short-Form Platform, Etc. (n (%)) | 8 (1.0%) | 6 (0.8%) | 2 (0.6%) | - | |
| Short-Form Platform Never (n (%)) | 125 (15.0%) | 127 (17.8%) | 47 (14.3%) | 0.229 | |
| Short-Form Video Usage (M (SD)) | 1.67 (1.1) | 1.73 (1.15) | 1.8 (1.17) | 0.207 | |
| Mostly Food (n (%)) | 130 (15.6%) | 80 (11.2%) | 47 (14.3%) | 0.038 * | |
| Mostly Sports (n (%)) | 40 (4.8%) | 39 (5.5%) | 14 (4.3%) | - | |
| Mostly Fashion/Beauty (n (%)) | 38 (4.6%) | 37 (5.2%) | 20 (6.1%) | - | |
| Mostly Gaming (n (%)) | 250 (30.1%) | 222 (31.1%) | 90 (27.4%) | 0.489 | |
| Mostly Dramas/Variety Show (n (%)) | 83 (10.0%) | 54 (7.6%) | 24 (7.3%) | - | |
| Mostly Animation/Comics (n (%)) | 56 (6.7%) | 63 (8.8%) | 24 (7.3%) | - | |
| Mostly TV/Entertainment (n (%)) | 42 (5.1%) | 46 (6.4%) | 19 (5.8%) | - | |
| Mostly Music/Dance (n (%)) | 45 (5.4%) | 53 (7.4%) | 24 (7.3%) | - | |
| Mostly Talk/Streaming (n (%)) | 17 (2.0%) | 16 (2.2%) | 5 (1.5%) | - | |
| Mostly Movies (n (%)) | 18 (2.2%) | 9 (1.3%) | 8 (2.4%) | - | |
| Mostly Products (n (%)) | 12 (1.4%) | 11 (1.5%) | 2 (0.6%) | - | |
| Mostly Current Affairs (n (%)) | 3 (0.4%) | 10 (1.4%) | 2 (0.6%) | - | |
| Mostly Lifestyle (n (%)) | 4 (0.5%) | 2 (0.3%) | 5 (1.5%) | - | |
| Mostly Edu (n (%)) | 49 (5.9%) | 34 (4.8%) | 26 (7.9%) | - | |
| Mostly Kids (n (%)) | 6 (0.7%) | 11 (1.5%) | 2 (0.6%) | - | |
| Mostly Vlog (n (%)) | 4 (0.5%) | 7 (1.0%) | 1 (0.3%) | - | |
| Mostly Other (n (%)) | 1 (0.1%) | 0 (0.0%) | 0 (0.0%) | - |
| Variable Category | Variable | Metropolitan City (n = 831) | Medium/Small City (n = 714) | Town/Rural District (n = 328) | p-Value |
|---|---|---|---|---|---|
| Perceived Digital Risk | |||||
| Smartphone Usage Dependence Comparison (M (SD)) | 2.71 (0.74) | 2.76 (0.75) | 2.72 (0.78) | 0.376 | |
| Side Effects on SNS (n (%)) | 48 (5.8%) | 56 (7.8%) | 22 (6.7%) | - | |
| Side Effects on Email (n (%)) | 15 (1.8%) | 11 (1.5%) | 4 (1.2%) | - | |
| Side Effects on Messenger (n (%)) | 23 (2.8%) | 28 (3.9%) | 16 (4.9%) | - | |
| Side Effects on New Friends (n (%)) | 21 (2.5%) | 16 (2.2%) | 14 (4.3%) | - | |
| Side Effects on Scheduling (n (%)) | 13 (1.6%) | 4 (0.6%) | 0 (0.0%) | - | |
| Side Effects on Health (n (%)) | 7 (0.8%) | 2 (0.3%) | 1 (0.3%) | - | |
| Side Effects on Zoom (n (%)) | 3 (0.4%) | 5 (0.7%) | 0 (0.0%) | - | |
| Side Effects on Shopping (n (%)) | 34 (4.1%) | 24 (3.4%) | 13 (4.0%) | - | |
| Side Effects on Selling (n (%)) | 8 (1.0%) | 7 (1.0%) | 6 (1.8%) | - | |
| Side Effects on Banking (n (%)) | 1 (0.1%) | 3 (0.4%) | 2 (0.6%) | - | |
| Side Effects on Investment (n (%)) | 9 (1.1%) | 3 (0.4%) | 3 (0.9%) | - | |
| Side Effects on Gaming (n (%)) | 353 (42.5%) | 313 (43.8%) | 108 (32.9%) | 0.003 ** | |
| Side Effects on Watching Videos (n (%)) | 68 (8.2%) | 52 (7.3%) | 21 (6.4%) | - | |
| Side Effects on Listening Music (n (%)) | 0 (0.0%) | 2 (0.3%) | 3 (0.9%) | - | |
| Side Effects on Listening Radio (n (%)) | 1 (0.1%) | 1 (0.1%) | 1 (0.3%) | - | |
| Side Effects on Webtoon (n (%)) | 28 (3.4%) | 13 (1.8%) | 7 (2.1%) | - | |
| Side Effects on Photography (n (%)) | 2 (0.2%) | 0 (0.0%) | 1 (0.3%) | - | |
| Side Effects on Travel (n (%)) | 1 (0.1%) | 1 (0.1%) | 0 (0.0%) | - | |
| Side Effects on X-Rated Content (n (%)) | 30 (3.6%) | 9 (1.3%) | 8 (2.4%) | - | |
| Side Effects on Gambling Game (n (%)) | 2 (0.2%) | 12 (1.7%) | 2 (0.6%) | - | |
| Side Effects on News (n (%)) | 3 (0.4%) | 1 (0.1%) | 2 (0.6%) | - | |
| Side Effects on Edu (n (%)) | 1 (0.1%) | 3 (0.4%) | 0 (0.0%) | - | |
| Side Effects on Interests (n (%)) | 1 (0.1%) | 0 (0.0%) | 0 (0.0%) | - | |
| Side Effects on Navigation (n (%)) | 2 (0.2%) | 3 (0.4%) | 0 (0.0%) | - | |
| Side Effects on Distance Class (n (%)) | 1 (0.1%) | 5 (0.7%) | 4 (1.2%) | - | |
| Excessive Smartphone Usage (M (SD)) | 2.57 (0.69) | 2.62 (0.69) | 2.62 (0.77) | 0.218 | |
| Short-Form Video Usage Control Difficulty (M (SD)) | 1.71 (1.09) | 1.81 (1.15) | 1.81 (1.08) | 0.139 | |
| Perceived Digital Competence | |||||
| Necessary Information Access (M (SD)) | 3.25 (0.64) | 3.25 (0.66) | 3.3 (0.67) | 0.404 | |
| Assess Online Information Reliability (M (SD)) | 2.98 (0.75) | 2.94 (0.77) | 3.05 (0.78) | 0.070 | |
| Online Social Issue Engagement (M (SD)) | 2.8 (0.85) | 2.7 (0.85) | 2.81 (0.81) | 0.037 * | |
| Digital Content Creation (M (SD)) | 2.49 (0.98) | 2.43 (0.98) | 2.62 (0.99) | 0.012 * | |
| Online Privacy Awareness (M (SD)) | 2.66 (0.88) | 2.57 (0.86) | 2.79 (0.86) | <0.001 *** | |
| Use Online Information for Academia/Work (M (SD)) | 2.89 (0.87) | 2.67 (0.94) | 2.81 (0.92) | <0.001 *** | |
Appendix C.2. Training Versus Test Set Descriptive Comparisons
| Variable Category | Variable | Metropolitan City (n = 831) | Medium/Small City (n = 714) | Town/Rural District (n = 328) | p-Value |
|---|---|---|---|---|---|
| Smartphone Consequences and Dependence | |||||
| Low-Battery Nervousness (M (SD)) | 2.71 (0.83) | 2.85 (0.86) | 2.75 (0.85) | 0.004 ** | |
| Smartphone Usage Depression (M (SD)) | 2.16 (0.87) | 2.23 (0.81) | 2.17 (0.83) | 0.250 | |
| Physical Effects (M (SD)) | 2.27 (0.89) | 2.35 (0.86) | 2.32 (0.89) | 0.170 | |
| Periodic Check Nervousness (M (SD)) | 2.57 (0.75) | 2.61 (0.76) | 2.52 (0.73) | 0.175 | |
| Smartphone Usage Sleep Issues (M (SD)) | 2.21 (0.84) | 2.29 (0.86) | 2.21 (0.89) | 0.174 | |
| Social Isolation (M (SD)) | 2.05 (0.79) | 2.13 (0.81) | 2.11 (0.73) | 0.133 | |
| Stress Relief Through Smartphone (M (SD)) | 2.41 (0.83) | 2.43 (0.85) | 2.35 (0.85) | 0.437 | |
| Preventative Education | |||||
| Received Preventive Education (n (%)) | 589 (31.4%) | 466 (31.1%) | 123 (32.8%) | 0.819 | |
| Awareness of Treatment Options (n (%)) | 958 (51.1%) | 768 (51.3%) | 190 (50.7%) | 0.979 | |
| Intent to Seek Smartphone Education | |||||
| Participation Intention (M (SD)) | 2.25 (0.71) | 2.21 (0.72) | 2.27 (0.74) | 0.370 | |
| Parental Prevention Efforts | |||||
| Complete Restriction (n (%)) | 81 (9.7%) | 71 (9.9%) | 33 (10.1%) | 0.984 | |
| Teaches How to Use the Phone (n (%)) | 397 (47.8%) | 284 (39.8%) | 130 (39.6%) | 0.002 ** | |
| Restrict Smartphone Apps (n (%)) | 508 (61.1%) | 439 (61.5%) | 185 (56.4%) | 0.256 | |
| Teaches Pros and Cons (n (%)) | 514 (61.9%) | 422 (59.1%) | 176 (53.7%) | 0.037 * | |
| Recommends Good Apps (n (%)) | 396 (47.7%) | 277 (38.8%) | 152 (46.3%) | <0.001 *** | |
| Uses Good Apps Together (n (%)) | 252 (30.3%) | 210 (29.4%) | 93 (28.4%) | 0.793 | |
| Plays Good Games Together (n (%)) | 225 (27.1%) | 206 (28.9%) | 75 (22.9%) | 0.130 | |
| Family Smartphone Rules (n (%)) | 354 (42.6%) | 272 (38.1%) | 133 (40.5%) | 0.199 | |
| Social Support | |||||
| Family Support (M (SD)) | 3.29 (0.69) | 3.17 (0.75) | 3.26 (0.66) | 0.005 ** | |
| Friend Support (M (SD)) | 3.13 (0.67) | 3.07 (0.69) | 3.17 (0.68) | 0.044 * | |
| Societal Fairness Perception (M (SD)) | 2.93 (0.71) | 2.81 (0.75) | 3.03 (0.79) | <0.001 *** | |
| Variable Category | Variable | Metropolitan City (n = 831) | Medium/Small City (n = 714) | Town/Rural District (n = 328) | p-Value |
|---|---|---|---|---|---|
| Social Support | |||||
| Family Support (M (SD)) | 3.29 (0.69) | 3.17 (0.75) | 3.26 (0.66) | 0.005 ** | |
| Friend Support (M (SD)) | 3.13 (0.67) | 3.07 (0.69) | 3.17 (0.68) | 0.044 * | |
| Societal Fairness Perception (M (SD)) | 2.93 (0.71) | 2.81 (0.75) | 3.03 (0.79) | <0.001 *** | |
| Self-Regulation Assessments | |||||
| Smartphone Usage Avoidance While Walking (n (%)) | 518 (62.3%) | 455 (63.7%) | 223 (68.0%) | 0.195 | |
| Smartphone Usage Habit Check (n (%)) | 226 (27.2%) | 186 (26.1%) | 96 (29.3%) | 0.554 | |
| Smartphone Use History Check (n (%)) | 164 (19.7%) | 162 (22.7%) | 72 (22.0%) | 0.347 | |
| Digital Detox (n (%)) | 210 (25.3%) | 153 (21.4%) | 55 (16.8%) | 0.006 ** | |
| Designated Placement (n (%)) | 286 (34.4%) | 200 (28.0%) | 105 (32.0%) | 0.026 * | |
| Use of Work Mode (n (%)) | 414 (49.8%) | 316 (44.3%) | 136 (41.5%) | 0.015 * | |
| Engaging in Conversation (n (%)) | 374 (45.0%) | 285 (39.9%) | 134 (40.9%) | 0.109 | |
| Hobby Engagement (n (%)) | 208 (25.0%) | 212 (29.7%) | 94 (28.7%) | 0.106 | |
| Life Satisfaction | |||||
| Relationship Satisfaction (M (SD)) | 3.25 (0.58) | 3.28 (0.6) | 3.31 (0.6) | 0.193 | |
| Work Satisfaction (M (SD)) | 2.91 (0.7) | 2.89 (0.73) | 2.99 (0.72) | 0.077 | |
| Leisure Satisfaction (M (SD)) | 2.86 (0.7) | 2.84 (0.71) | 2.91 (0.77) | 0.300 | |
| Overall Life Satisfaction (M (SD)) | 3.08 (0.57) | 3.04 (0.59) | 3.08 (0.65) | 0.462 | |
| Variable Category | Variable | Total Sample (N = 1873) | Training Set (n = 1498) | Test Set (n = 375) | p-Value |
|---|---|---|---|---|---|
| Demographics | |||||
| Age (mean, SD) | 14.34 (2.40) | 14.34 (2.39) | 14.34 (2.42) | 1.000 | |
| Sex (Male; n (%)) | 900 (48.1%) | 728 (48.6%) | 172 (45.9%) | 0.639 | |
| Elementary School Students (n (%)) | 482 (25.7%) | 389 (26.0%) | 93 (24.8%) | 0.898 | |
| Middle School Students (n (%)) | 707 (37.7%) | 565 (37.7%) | 142 (37.9%) | 0.999 | |
| High School Students (n (%)) | 684 (36.5%) | 544 (36.3%) | 140 (37.3%) | 0.935 | |
| Urbanicity | |||||
| Metropolitan City (n (%)) | 831 (44.4%) | 656 (43.8%) | 175 (46.7%) | 0.605 | |
| Medium or Small City (n (%)) | 714 (38.1%) | 571 (38.1%) | 143 (38.1%) | 1.000 | |
| Town or Rural District (n (%)) | 328 (17.5%) | 271 (18.1%) | 57 (15.2%) | 0.420 | |
| Home Environment | |||||
| House (n (%)) | 409 (21.8%) | 331 (22.1%) | 78 (20.8%) | 0.863 | |
| Apartment (n (%)) | 1039 (55.5%) | 829 (55.3%) | 210 (56.0%) | 0.974 | |
| Mansion (n (%)) | 352 (18.8%) | 276 (18.4%) | 76 (20.3%) | 0.716 | |
| Other Housing (n (%)) | 73 (3.9%) | 62 (4.1%) | 11 (2.9%) | - | |
| Multicultural Family (n (%)) | 13 (0.7%) | 11 (0.7%) | 2 (0.5%) | - | |
| Single-Parent Family (n (%)) | 146 (7.8%) | 114 (7.6%) | 32 (8.5%) | 0.837 | |
| Both Parents Working (n (%)) | 1344 (71.8%) | 1086 (72.5%) | 258 (68.8%) | 0.364 | |
| Monthly Household Income (mean, SD) | 3.23 (0.78) | 3.24 (0.79) | 3.18 (0.76) | 0.442 | |
| Variable Category | Variable | Total Sample (N = 1873) | Training Set (n = 1498) | Test Set (n = 375) | p-Value |
|---|---|---|---|---|---|
| Smartphone Use Cases | |||||
| Email (M (SD)) | 1.89 (1.91) | 1.89 (1.94) | 1.87 (1.81) | 0.983 | |
| Messenger (M (SD)) | 5.3 (1.51) | 5.29 (1.51) | 5.32 (1.49) | 0.966 | |
| Making New Friends (M (SD)) | 1.35 (1.89) | 1.36 (1.89) | 1.3 (1.9) | 0.857 | |
| Scheduling (M (SD)) | 1.91 (2.1) | 1.89 (2.11) | 2.0 (2.06) | 0.652 | |
| Health (M (SD)) | 1.64 (1.98) | 1.63 (1.97) | 1.67 (2.03) | 0.945 | |
| Zoom Meetings (M (SD)) | 0.63 (1.46) | 0.64 (1.47) | 0.61 (1.4) | 0.938 | |
| Online Shopping (M (SD)) | 2.09 (2.17) | 2.08 (2.17) | 2.13 (2.18) | 0.934 | |
| Selling Goods and Services (M (SD)) | 1.62 (2.08) | 1.62 (2.08) | 1.61 (2.07) | 0.987 | |
| Banking (M (SD)) | 1.43 (1.91) | 1.47 (1.94) | 1.24 (1.78) | 0.110 | |
| Investment (M (SD)) | 0.73 (1.4) | 0.71 (1.36) | 0.81 (1.54) | 0.529 | |
| Gaming (M (SD)) | 4.85 (1.82) | 4.84 (1.85) | 4.92 (1.67) | 0.718 | |
| Watching Videos (M (SD)) | 5.24 (1.64) | 5.22 (1.65) | 5.3 (1.6) | 0.695 | |
| Listening Music (M (SD)) | 4.42 (2.07) | 4.44 (2.05) | 4.32 (2.16) | 0.625 | |
| Listening Radio (M (SD)) | 1.6 (2.06) | 1.61 (2.07) | 1.58 (2.02) | 0.976 | |
| Webtoon (M (SD)) | 3.3 (2.25) | 3.27 (2.25) | 3.42 (2.28) | 0.519 | |
| Photography (M (SD)) | 3.46 (2.0) | 3.46 (2.02) | 3.49 (1.91) | 0.967 | |
| Travel (M (SD)) | 1.69 (1.93) | 1.71 (1.94) | 1.61 (1.86) | 0.652 | |
| Adult Content (M (SD)) | 0.4 (1.04) | 0.4 (1.04) | 0.41 (1.06) | 0.956 | |
| Gambling (M (SD)) | 0.38 (1.06) | 0.37 (1.04) | 0.43 (1.13) | 0.570 | |
| News (M (SD)) | 2.4 (2.14) | 2.38 (2.16) | 2.47 (2.05) | 0.770 | |
| Educational Web Search (M (SD)) | 3.9 (1.89) | 3.91 (1.91) | 3.88 (1.82) | 0.971 | |
| Hobby Web Search (M (SD)) | 3.78 (1.97) | 3.78 (1.96) | 3.81 (2.0) | 0.947 | |
| Navigation (M (SD)) | 2.35 (1.95) | 2.34 (1.97) | 2.37 (1.88) | 0.978 | |
| Online Learning (M (SD)) | 3.56 (2.23) | 3.56 (2.26) | 3.55 (2.13) | 0.999 | |
| Smartphone Online Video Usage (n (%)) | 1805 (96.4%) | 1441 (96.2%) | 364 (97.1%) | 0.722 | |
| Short-Form Platform YouTube (n (%)) | 920 (49.1%) | 740 (49.4%) | 180 (48.0%) | 0.889 | |
| Short-Form Platform TikTok (n (%)) | 378 (20.2%) | 294 (19.6%) | 84 (22.4%) | 0.489 | |
| Short-Form Platform Reels (n (%)) | 192 (10.3%) | 146 (9.7%) | 46 (12.3%) | 0.355 | |
| Short-Form Platform, Etc. (n (%)) | 16 (0.9%) | 13 (0.9%) | 3 (0.8%) | 0.992 | |
| Short-Form Platform Never (n (%)) | 299 (16.0%) | 248 (16.6%) | 51 (13.6%) | 0.377 | |
| Short-Form Video Usage (M (SD)) | 1.72 (1.13) | 1.69 (1.13) | 1.83 (1.13) | 0.109 | |
| Variable Category | Variable | Total Sample (N = 1873) | Training Set (n = 1498) | Test Set (n = 375) | p-Value |
|---|---|---|---|---|---|
| Smartphone Use Cases | |||||
| Mostly Food (n (%)) | 929 (49.6%) | 742 (49.5%) | 187 (49.9%) | 0.897 | |
| Mostly Sports (n (%)) | 586 (31.3%) | 469 (31.3%) | 117 (31.2%) | 0.961 | |
| Mostly Fashion/Beauty (n (%)) | 429 (22.9%) | 337 (22.5%) | 92 (24.5%) | 0.388 | |
| Mostly Gaming (n (%)) | 770 (41.1%) | 616 (41.1%) | 154 (41.1%) | 0.918 | |
| Mostly Dramas/Variety Show (n (%)) | 730 (39.0%) | 580 (38.7%) | 150 (40.0%) | 0.642 | |
| Mostly Animation/Comics (n (%)) | 631 (33.7%) | 510 (34.0%) | 121 (32.3%) | 0.541 | |
| Mostly TV/Entertainment (n (%)) | 620 (33.1%) | 491 (32.8%) | 129 (34.4%) | 0.548 | |
| Mostly Music/Dance (n (%)) | 612 (32.7%) | 491 (32.8%) | 121 (32.3%) | 0.869 | |
| Mostly Talk/Streaming (n (%)) | 563 (30.1%) | 446 (29.8%) | 117 (31.2%) | 0.607 | |
| Mostly Movies (n (%)) | 537 (28.7%) | 424 (28.3%) | 113 (30.1%) | 0.500 | |
| Mostly Products (n (%)) | 529 (28.2%) | 419 (28.0%) | 110 (29.3%) | 0.625 | |
| Mostly Current Affairs (n (%)) | 497 (26.5%) | 394 (26.3%) | 103 (27.5%) | 0.647 | |
| Mostly Lifestyle (n (%)) | 493 (26.3%) | 394 (26.3%) | 99 (26.4%) | 0.974 | |
| Mostly Edu (n (%)) | 488 (26.1%) | 391 (26.1%) | 97 (25.9%) | 0.946 | |
| Mostly Kids (n (%)) | 439 (23.4%) | 350 (23.4%) | 89 (23.7%) | 0.879 | |
| Mostly Vlog (n (%)) | 1032 (55.2%) | 775 (54.6%) | 257 (57.1%) | 0.703 | |
| Mostly Other (n (%)) | 1870 (99.8%) | 1496 (99.9%) | 374 (99.7%) | 0.323 | |
| Perceived Digital Risk | |||||
| Smartphone Usage Dependence Comparison (M (SD)) | 2.73 (0.75) | 2.72 (0.74) | 2.74 (0.79) | 0.889 | |
| Side Effects on SNS (n (%)) | 126 (6.7%) | 112 (7.5%) | 14 (3.7%) | - | |
| Side Effects on Email (n (%)) | 30 (1.6%) | 24 (1.6%) | 6 (1.6%) | - | |
| Side Effects on Messenger (n (%)) | 67 (3.6%) | 53 (3.5%) | 14 (3.7%) | - | |
| Side Effects on New Friends (n (%)) | 51 (2.7%) | 37 (2.5%) | 14 (3.7%) | - | |
| Side Effects on Scheduling (n (%)) | 17 (0.9%) | 12 (0.8%) | 5 (1.3%) | - | |
| Side Effects on Health (n (%)) | 10 (0.5%) | 10 (0.7%) | 0 (0.0%) | - | |
| Side Effects on Zoom (n (%)) | 8 (0.4%) | 7 (0.5%) | 1 (0.3%) | - | |
| Side Effects on Shopping (n (%)) | 71 (3.8%) | 55 (3.7%) | 16 (4.3%) | - | |
| Side Effects on Selling (n (%)) | 21 (1.1%) | 19 (1.3%) | 2 (0.5%) | - | |
| Side Effects on Banking (n (%)) | 6 (0.3%) | 5 (0.3%) | 1 (0.3%) | - | |
| Side Effects on Investment (n (%)) | 15 (0.8%) | 12 (0.8%) | 3 (0.8%) | - | |
| Side Effects on Gaming (n (%)) | 774 (41.3%) | 607 (40.5%) | 167 (44.5%) | 0.369 | |
| Variable Category | Variable | Total Sample (N = 1873) | Training Set (n = 1498) | Test Set (n = 375) | p-Value |
|---|---|---|---|---|---|
| Side Effects on Watching Videos (n (%)) | 141 (7.5%) | 113 (7.5%) | 28 (7.5%) | - | |
| Side Effects on Listening Music (n (%)) | 5 (0.3%) | 5 (0.3%) | 0 (0.0%) | - | |
| Side Effects on Listening Radio (n (%)) | 3 (0.2%) | 3 (0.2%) | 0 (0.0%) | - | |
| Side Effects on Webtoon (n (%)) | 48 (2.6%) | 36 (2.4%) | 12 (3.2%) | - | |
| Side Effects on Photography (n (%)) | 3 (0.2%) | 2 (0.1%) | 1 (0.3%) | - | |
| Side Effects on Travel (n (%)) | 2 (0.1%) | 2 (0.1%) | 0 (0.0%) | - | |
| Side Effects on X-Rated Content (n (%)) | 47 (2.5%) | 35 (2.3%) | 12 (3.2%) | - | |
| Side Effects on Gambling Game (n (%)) | 16 (0.9%) | 13 (0.9%) | 3 (0.8%) | - | |
| Side Effects on News (n (%)) | 6 (0.3%) | 6 (0.4%) | 0 (0.0%) | - | |
| Side Effects on Edu (n (%)) | 4 (0.2%) | 4 (0.3%) | 0 (0.0%) | - | |
| Side Effects on Interests (n (%)) | 1 (0.1%) | 1 (0.1%) | 0 (0.0%) | - | |
| Side Effects on Navigation (n (%)) | 5 (0.3%) | 5 (0.3%) | 0 (0.0%) | - | |
| Side Effects on Distance Class (n (%)) | 10 (0.5%) | 5 (0.3%) | 5 (1.3%) | - | |
| Excessive Smartphone Usage (M (SD)) | 2.6 (0.71) | 2.6 (0.69) | 2.59 (0.75) | 0.947 | |
| Short-Form Video Usage Control Difficulty (M (SD)) | 1.76 (1.11) | 1.74 (1.12) | 1.85 (1.09) | 0.209 | |
| Perceived Digital Competence | |||||
| Necessary Information Access (M (SD)) | 3.26 (0.65) | 3.25 (0.66) | 3.29 (0.65) | 0.619 | |
| Assess Online Information Reliability (M (SD)) | 2.98 (0.76) | 2.97 (0.76) | 3.0 (0.75) | 0.791 | |
| Online Social Issue Engagement (M (SD)) | 2.77 (0.84) | 2.76 (0.85) | 2.78 (0.82) | 0.972 | |
| Digital Content Creation (M (SD)) | 2.49 (0.99) | 2.47 (0.99) | 2.57 (0.97) | 0.197 | |
| Online Privacy Awareness (M (SD)) | 2.65 (0.88) | 2.64 (0.88) | 2.68 (0.86) | 0.756 | |
| Use Online Information for Academia/Work (M (SD)) | 2.79 (0.91) | 2.79 (0.93) | 2.8 (0.85) | 0.981 | |
| Smartphone Consequences and Dependence | |||||
| Low-Battery Nervousness (M (SD)) | 2.77 (0.85) | 2.76 (0.85) | 2.79 (0.84) | 0.790 | |
| Smartphone Usage Depression (M (SD)) | 2.19 (0.84) | 2.18 (0.83) | 2.22 (0.9) | 0.740 | |
| Physical Effects (M (SD)) | 2.31 (0.88) | 2.31 (0.87) | 2.33 (0.91) | 0.923 | |
| Periodic Check Nervousness (M (SD)) | 2.58 (0.75) | 2.57 (0.75) | 2.6 (0.76) | 0.836 | |
| Smartphone Usage Sleep Issues (M (SD)) | 2.24 (0.86) | 2.23 (0.85) | 2.29 (0.9) | 0.539 | |
| Social Isolation (M (SD)) | 2.09 (0.79) | 2.08 (0.78) | 2.14 (0.8) | 0.494 | |
| Stress Relief Through Smartphone (M (SD)) | 2.41 (0.84) | 2.4 (0.84) | 2.42 (0.85) | 0.918 | |
| Variable Category | Variable | Total Sample (N = 1873) | Training Set (n = 1498) | Test Set (n = 375) | p-Value |
|---|---|---|---|---|---|
| Preventative Education | |||||
| Received Preventive Education (n (%)) | 589 (31.4%) | 466 (31.1%) | 123 (32.8%) | 0.819 | |
| Awareness of Treatment Options (n (%)) | 958 (51.1%) | 768 (51.3%) | 190 (50.7%) | 0.979 | |
| Intent to Seek Smartphone Education | |||||
| Participation Intention (M (SD)) | 2.24 (0.72) | 2.25 (0.73) | 2.2 (0.69) | 0.501 | |
| Parental Prevention Efforts | |||||
| Complete Restriction (n (%)) | 1132 (60.4%) | 912 (60.9%) | 220 (58.7%) | 0.735 | |
| Teaches How to Use the Phone (n (%)) | 811 (43.3%) | 652 (43.5%) | 159 (42.4%) | 0.926 | |
| Restrict Smartphone Apps (n (%)) | 1132 (60.4%) | 912 (60.9%) | 220 (58.7%) | 0.735 | |
| Teaches Pros and Cons (n (%)) | 1112 (59.4%) | 885 (59.1%) | 227 (60.5%) | 0.877 | |
| Recommends Good Apps (n (%)) | 825 (44.0%) | 650 (43.4%) | 175 (46.7%) | 0.521 | |
| Uses Good Apps Together (n (%)) | 555 (29.6%) | 439 (29.3%) | 116 (30.9%) | 0.827 | |
| Plays Good Games Together (n (%)) | 506 (27.0%) | 393 (26.2%) | 113 (30.1%) | 0.315 | |
| Family Smartphone Rules (n (%)) | 759 (40.5%) | 599 (40.0%) | 160 (42.7%) | 0.640 | |
| Social Support | |||||
| Family Support (M (SD)) | 3.24 (0.71) | 3.23 (0.71) | 3.27 (0.70) | 0.616 | |
| Friend Support (M (SD)) | 3.12 (0.68) | 3.11 (0.67) | 3.13 (0.70) | 0.940 | |
| Societal Fairness Perception (M (SD)) | 2.9 (0.75) | 2.91 (0.74) | 2.86 (0.76) | 0.520 | |
| Self-Regulation Assessments | |||||
| Smartphone Usage Avoidance While Walking (n (%)) | 1196 (63.9%) | 949 (63.4%) | 247 (65.9%) | 0.663 | |
| Smartphone Usage Habit Check (n (%)) | 508 (27.1%) | 408 (27.2%) | 100 (26.7%) | 0.976 | |
| Smartphone Use History Check (n (%)) | 398 (21.2%) | 311 (20.8%) | 87 (23.2%) | 0.587 | |
| Digital Detox (n (%)) | 418 (22.3%) | 349 (23.3%) | 69 (18.4%) | 0.126 | |
| Designated Placement (n (%)) | 591 (31.6%) | 468 (31.2%) | 123 (32.8%) | 0.845 | |
| Use of Work Mode (n (%)) | 866 (46.2%) | 689 (46.0%) | 177 (47.2%) | 0.916 | |
| Engaging in Conversation (n (%)) | 793 (42.3%) | 647 (43.2%) | 146 (38.9%) | 0.328 | |
| Hobby Engagement (n (%)) | 514 (27.4%) | 409 (27.3%) | 105 (28.0%) | 0.964 | |
| Life Satisfaction | |||||
| Relationship Satisfaction (M (SD)) | 3.27 (0.59) | 3.27 (0.60) | 3.25 (0.57) | 0.798 | |
| Work Satisfaction (M (SD)) | 2.92 (0.71) | 2.92 (0.70) | 2.9 (0.75) | 0.853 | |
| Leisure Satisfaction (M (SD)) | 2.86 (0.72) | 2.87 (0.72) | 2.82 (0.69) | 0.384 | |
| Overall Life Satisfaction (M (SD)) | 3.07 (0.59) | 3.06 (0.59) | 3.07 (0.62) | 0.969 | |
Appendix D. AI/ML Results
Appendix D.1. Performance Comparison for Nested AI/ML Classifiers
| Model | Name | Algorithm | AUC | Mean Val Loss | Test Loss | # Features |
|---|---|---|---|---|---|---|
| M0 | Demographics | RF | 0.51 | 0.69 | 0.69 | 5 |
| M1 | +Urbanicity | DT | 0.57 | 0.70 | 0.69 | 8 |
| M2 | +Intent to Seek Smartphone Edu | RF | 0.63 | 0.67 | 0.67 | 9 |
| M3 | +Preventative Education Experiences | LightGBM | 0.63 | 0.67 | 0.67 | 11 |
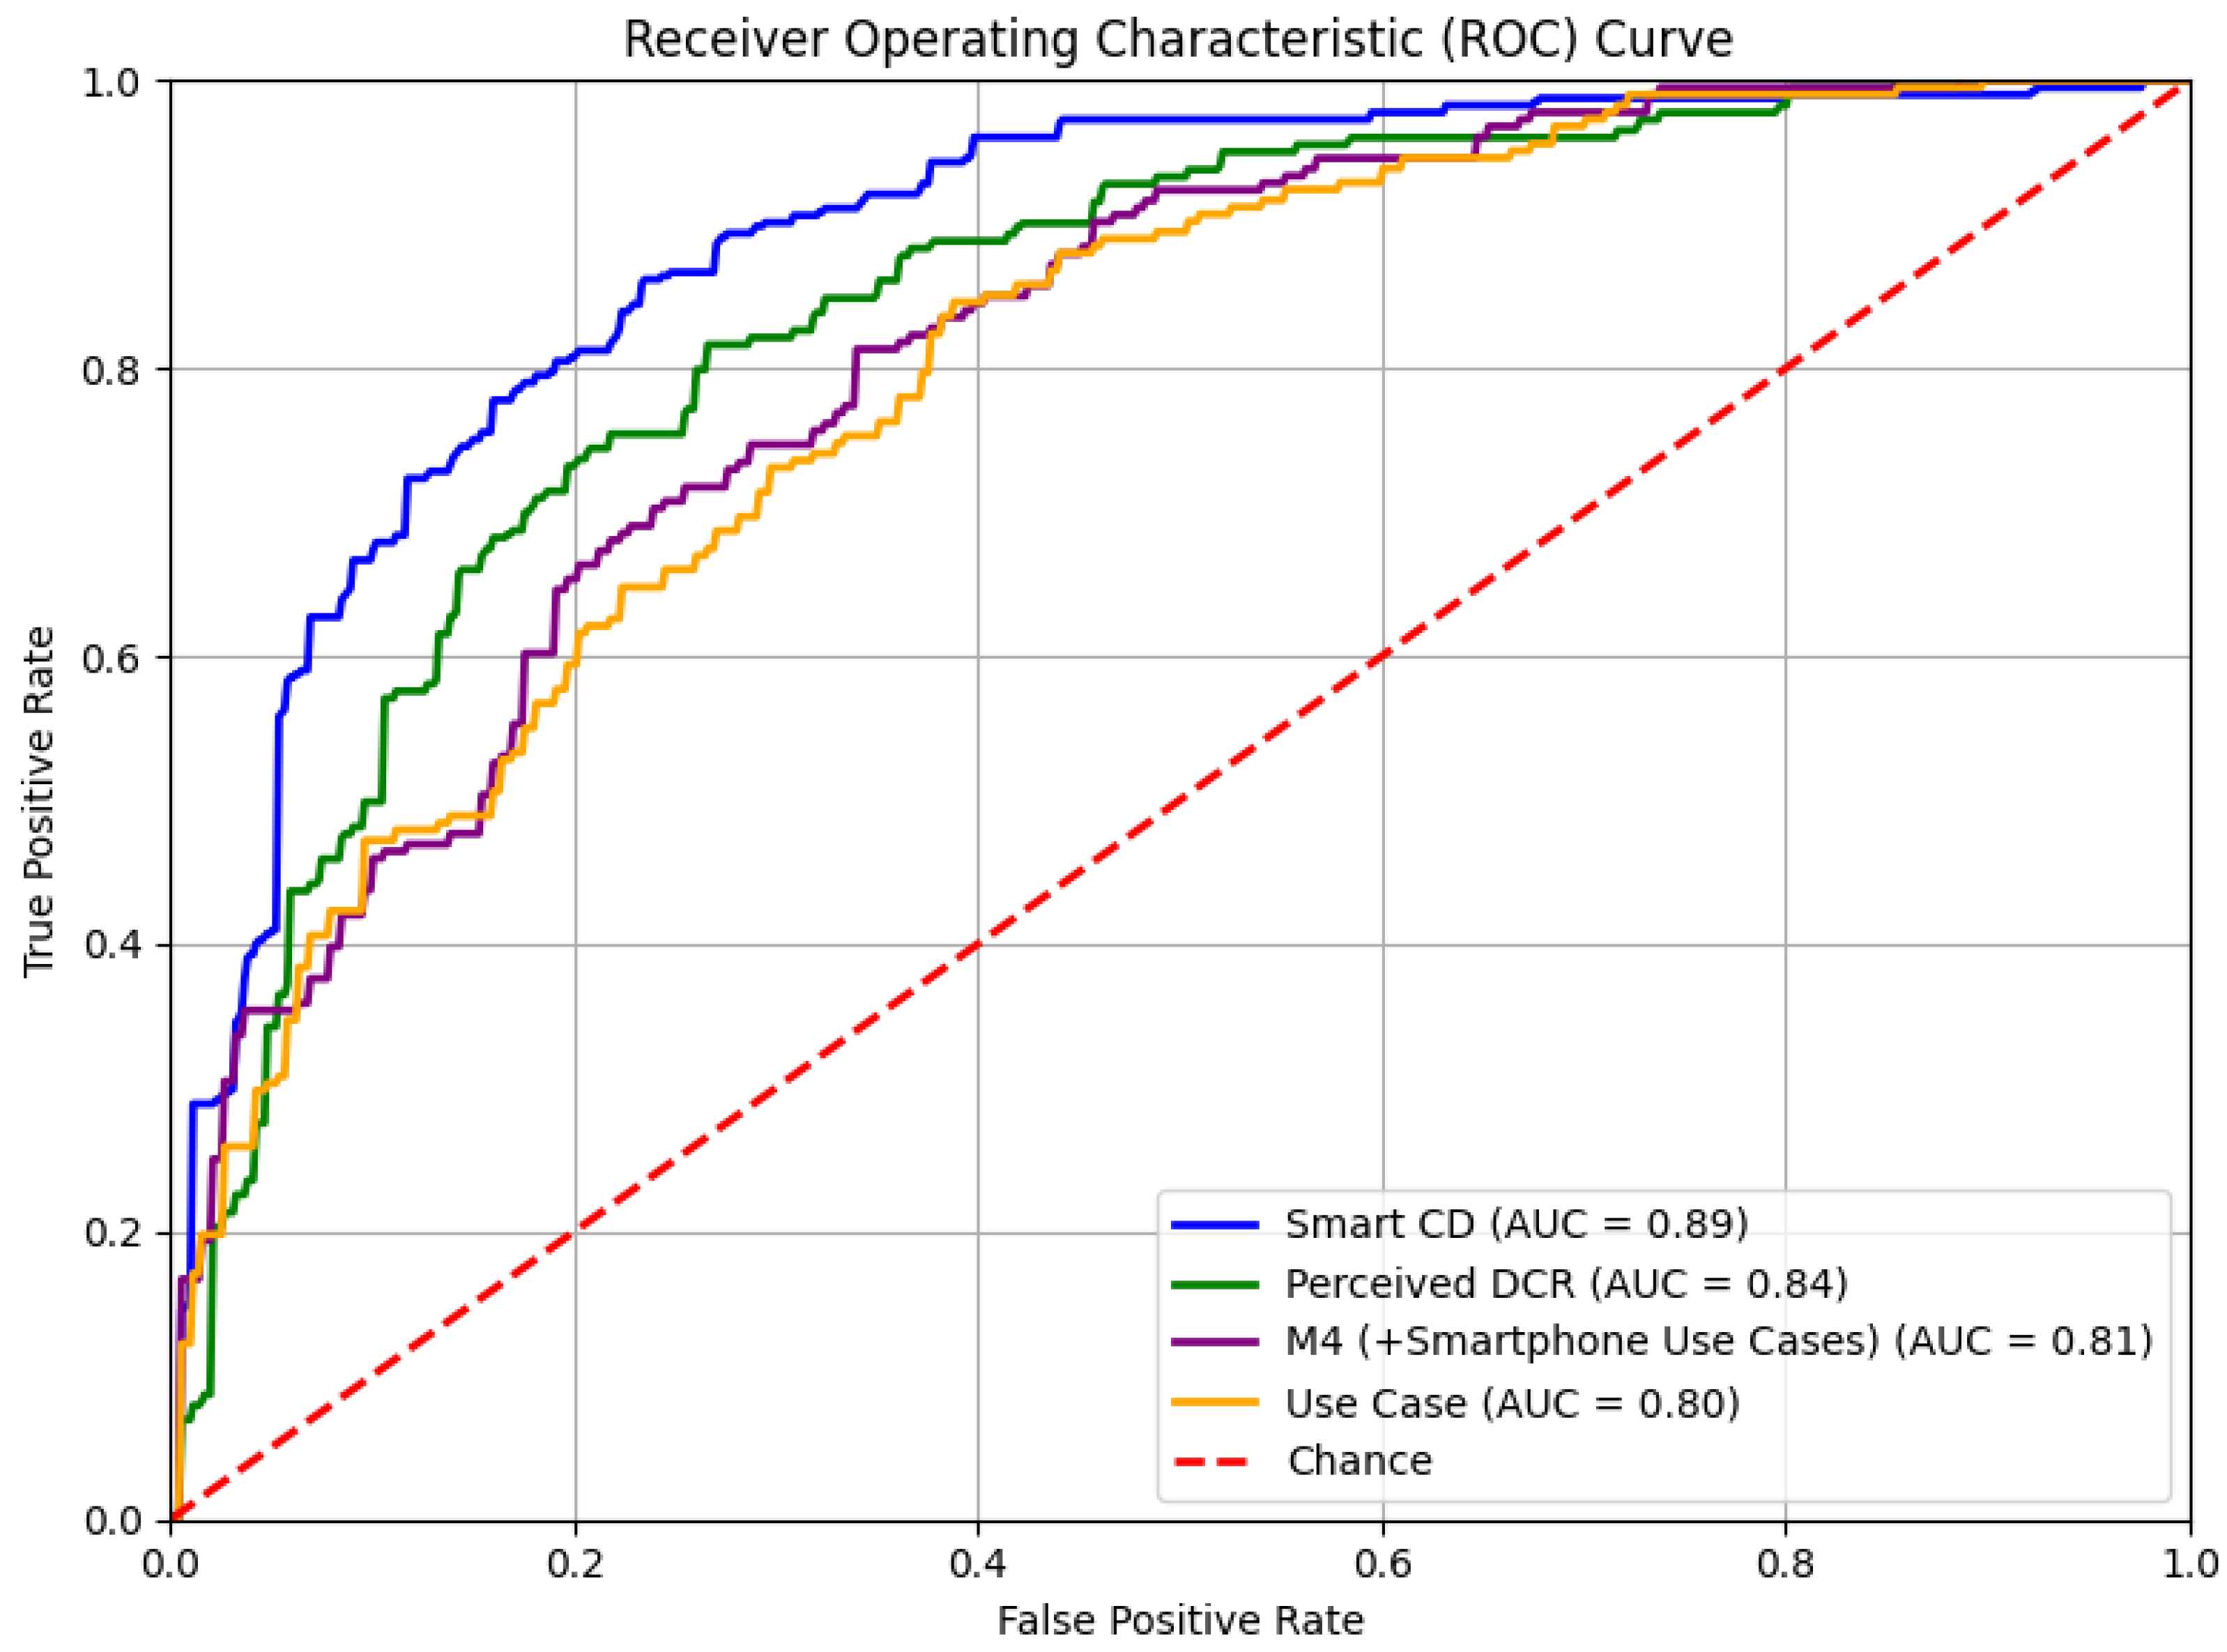
| M4 | +Smartphone Use Cases | RF | 0.81 | 0.58 | 0.55 | 59 |
| M5 | +Home Environment | LightGBM | 0.80 | 0.59 | 0.54 | 66 |
| M6 | +Parental Prevention Efforts | XGB | 0.82 | 0.58 | 0.53 | 75 |
| M7 | +Social Support | RF | 0.80 | 0.59 | 0.57 | 78 |
| M8 | +Self-Regulation Assessments | XGB | 0.82 | 0.56 | 0.54 | 86 |
| M9 | +Perceived Digital Competence and Risk | XGB | 0.89 | 0.48 | 0.47 | 120 |
| M10 | +Life Satisfaction | RF | 0.88 | 0.51 | 0.47 | 124 |
| M11 | +Smartphone Consequences and Dependence | XGB | 0.92 | 0.45 | 0.39 | 131 |
Appendix D.2. Performance Comparison Between Construct-Based AI/ML Classifiers
| Construct | Shorthand | Algorithm | AUC | Mean Val Loss | Test Loss | # Features |
|---|---|---|---|---|---|---|
| Smartphone Consequences and Dependence | Smart CD | LightGBM | 0.89 | 0.50 | 0.42 | 7 |
| Perceived Digital Competence and Risk | Perceived DCR | XGB | 0.84 | 0.52 | 0.49 | 34 |
| Smartphone Use Cases | Use Case | XGB | 0.80 | 0.59 | 0.54 | 48 |
| Self-Regulation Assessments | Self-Reg | RF | 0.64 | 0.67 | 0.66 | 8 |
| Parental Prevention Efforts | Par Prev | XGB | 0.62 | 0.68 | 0.67 | 9 |
| Intent to Seek Smartphone Edu | Intent Edu | LogReg | 0.61 | 0.67 | 0.67 | 1 |
| Urbanicity | Urb | LogReg | 0.58 | 0.69 | 0.69 | 3 |
| Home Environment | Home Envir | LogReg | 0.56 | 0.70 | 0.69 | 8 |
| Preventative Education Experiences | Prev Edu | DT | 0.55 | 0.69 | 0.69 | 2 |
| Life Satisfaction | Life Sat | RF | 0.54 | 0.69 | 0.69 | 4 |
| Social Support | SoSu | RF | 0.53 | 0.70 | 0.69 | 3 |
| Demographics | Demo | RF | 0.51 | 0.69 | 0.69 | 5 |
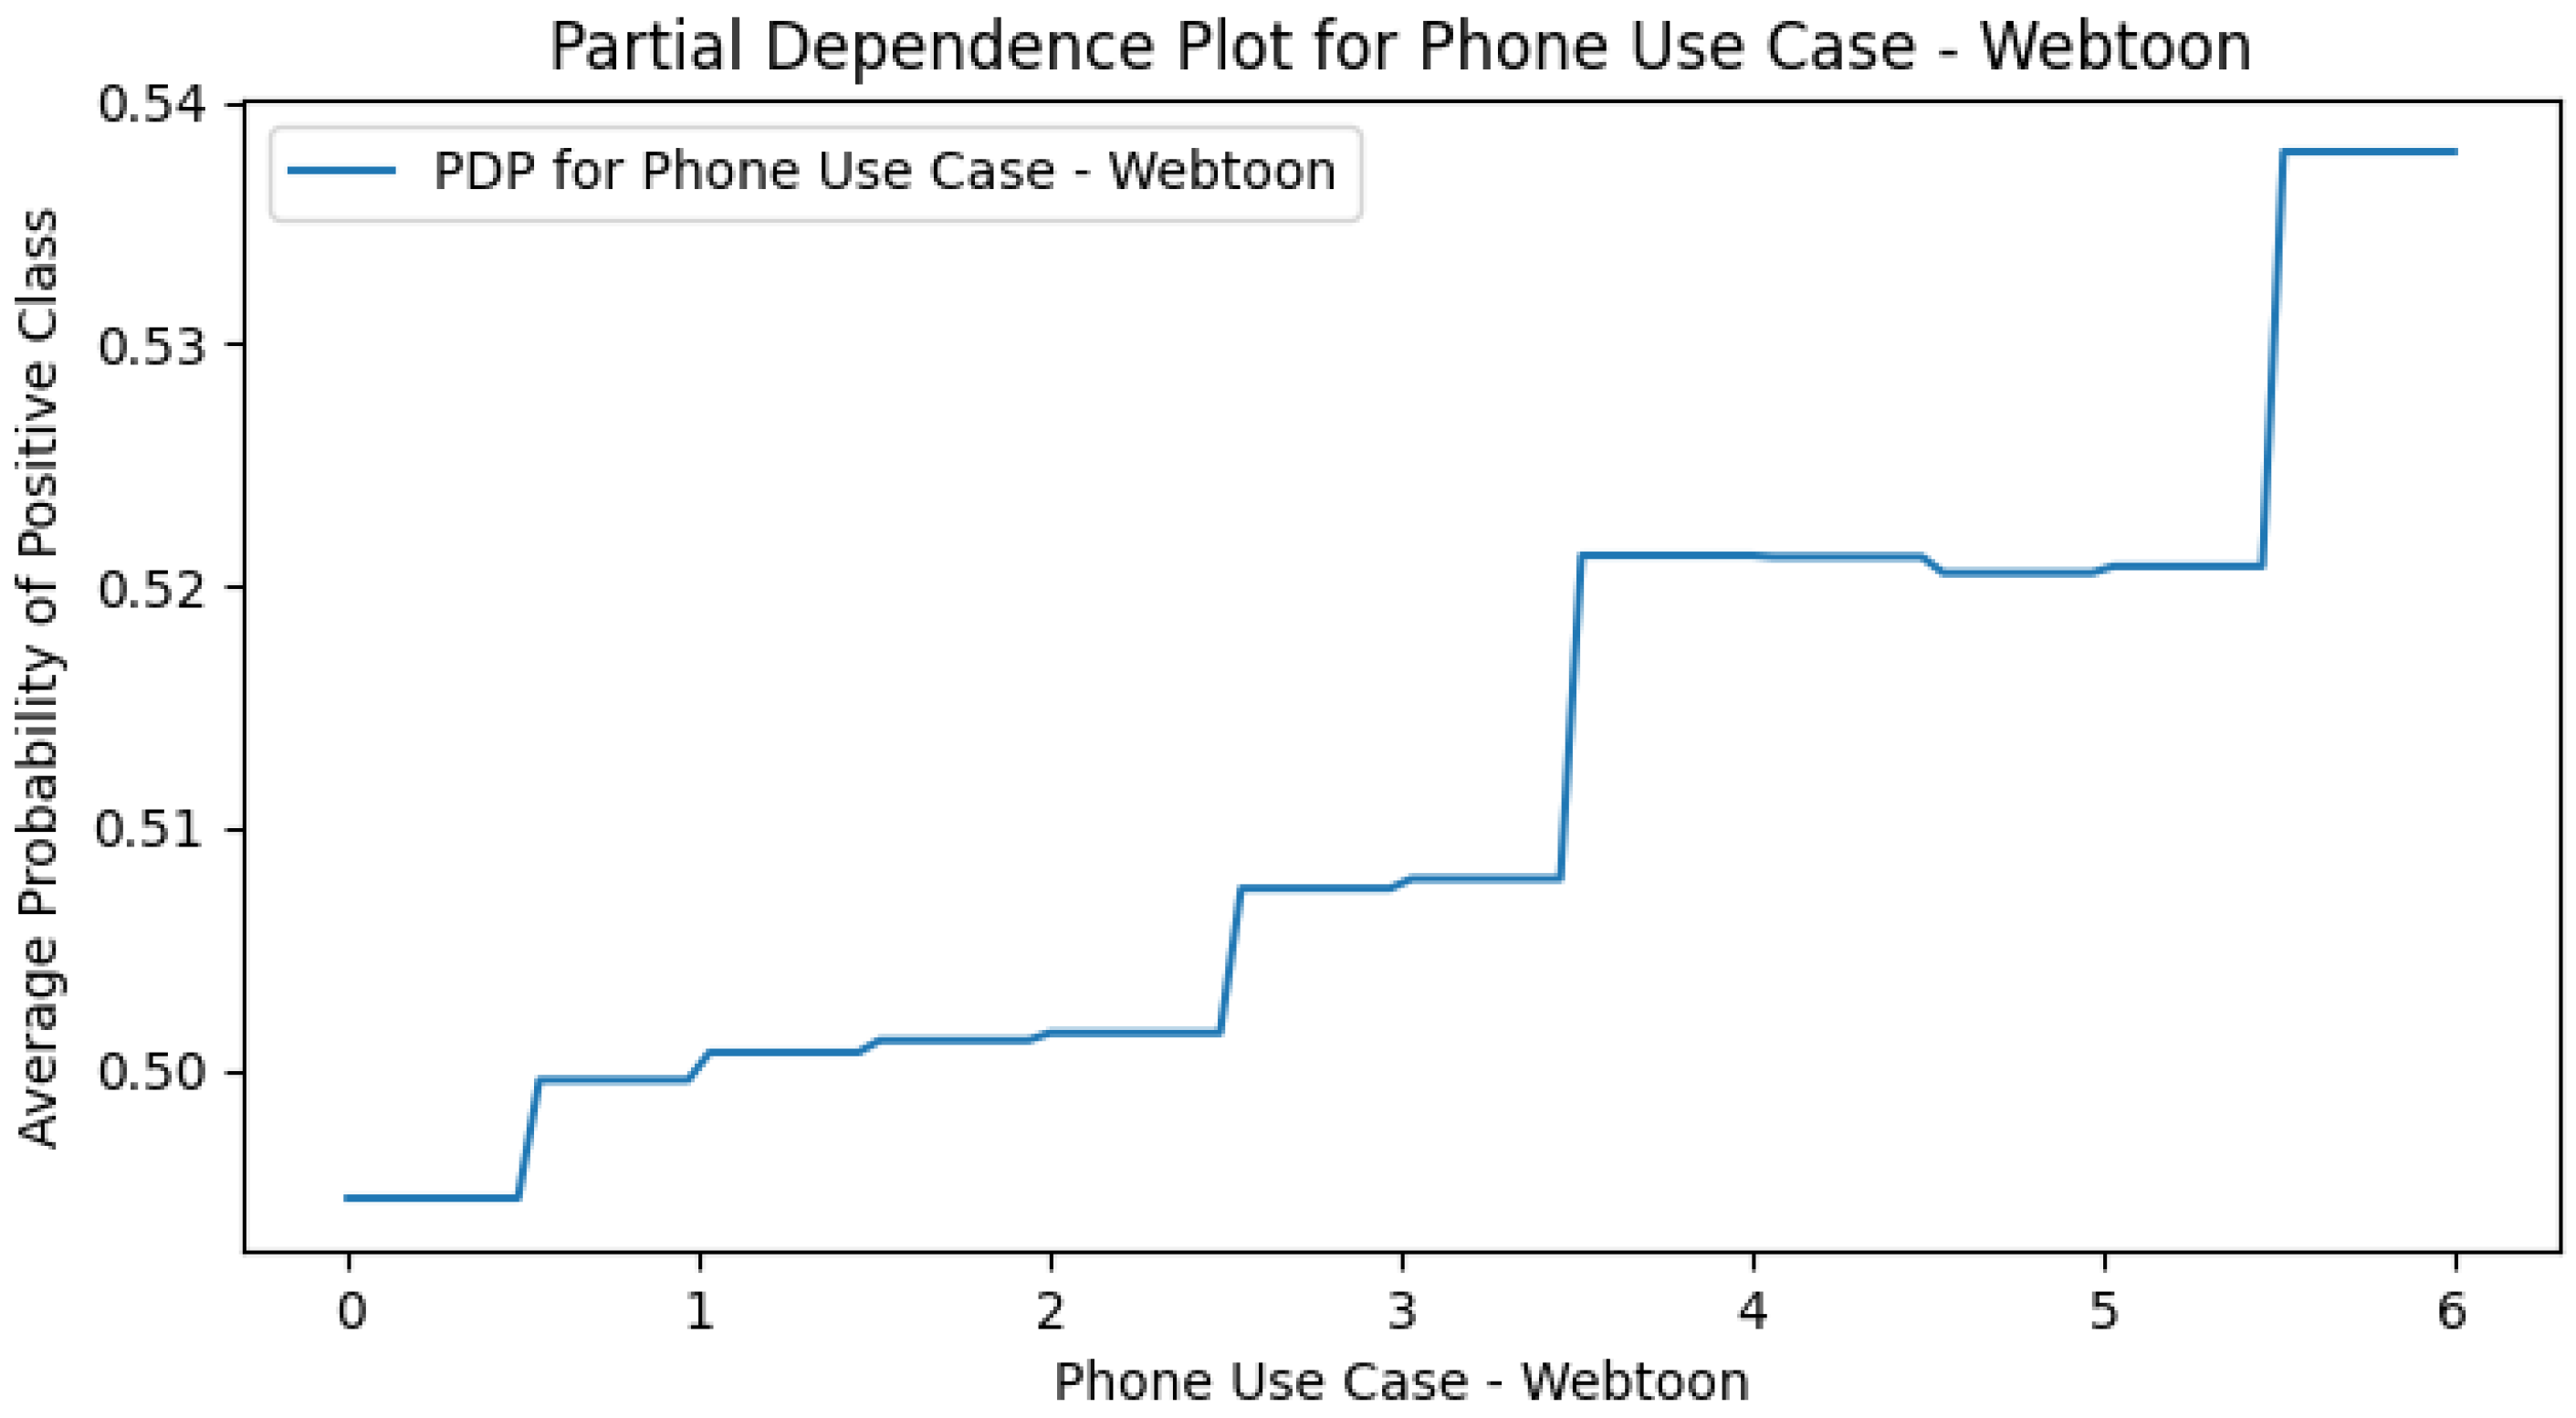
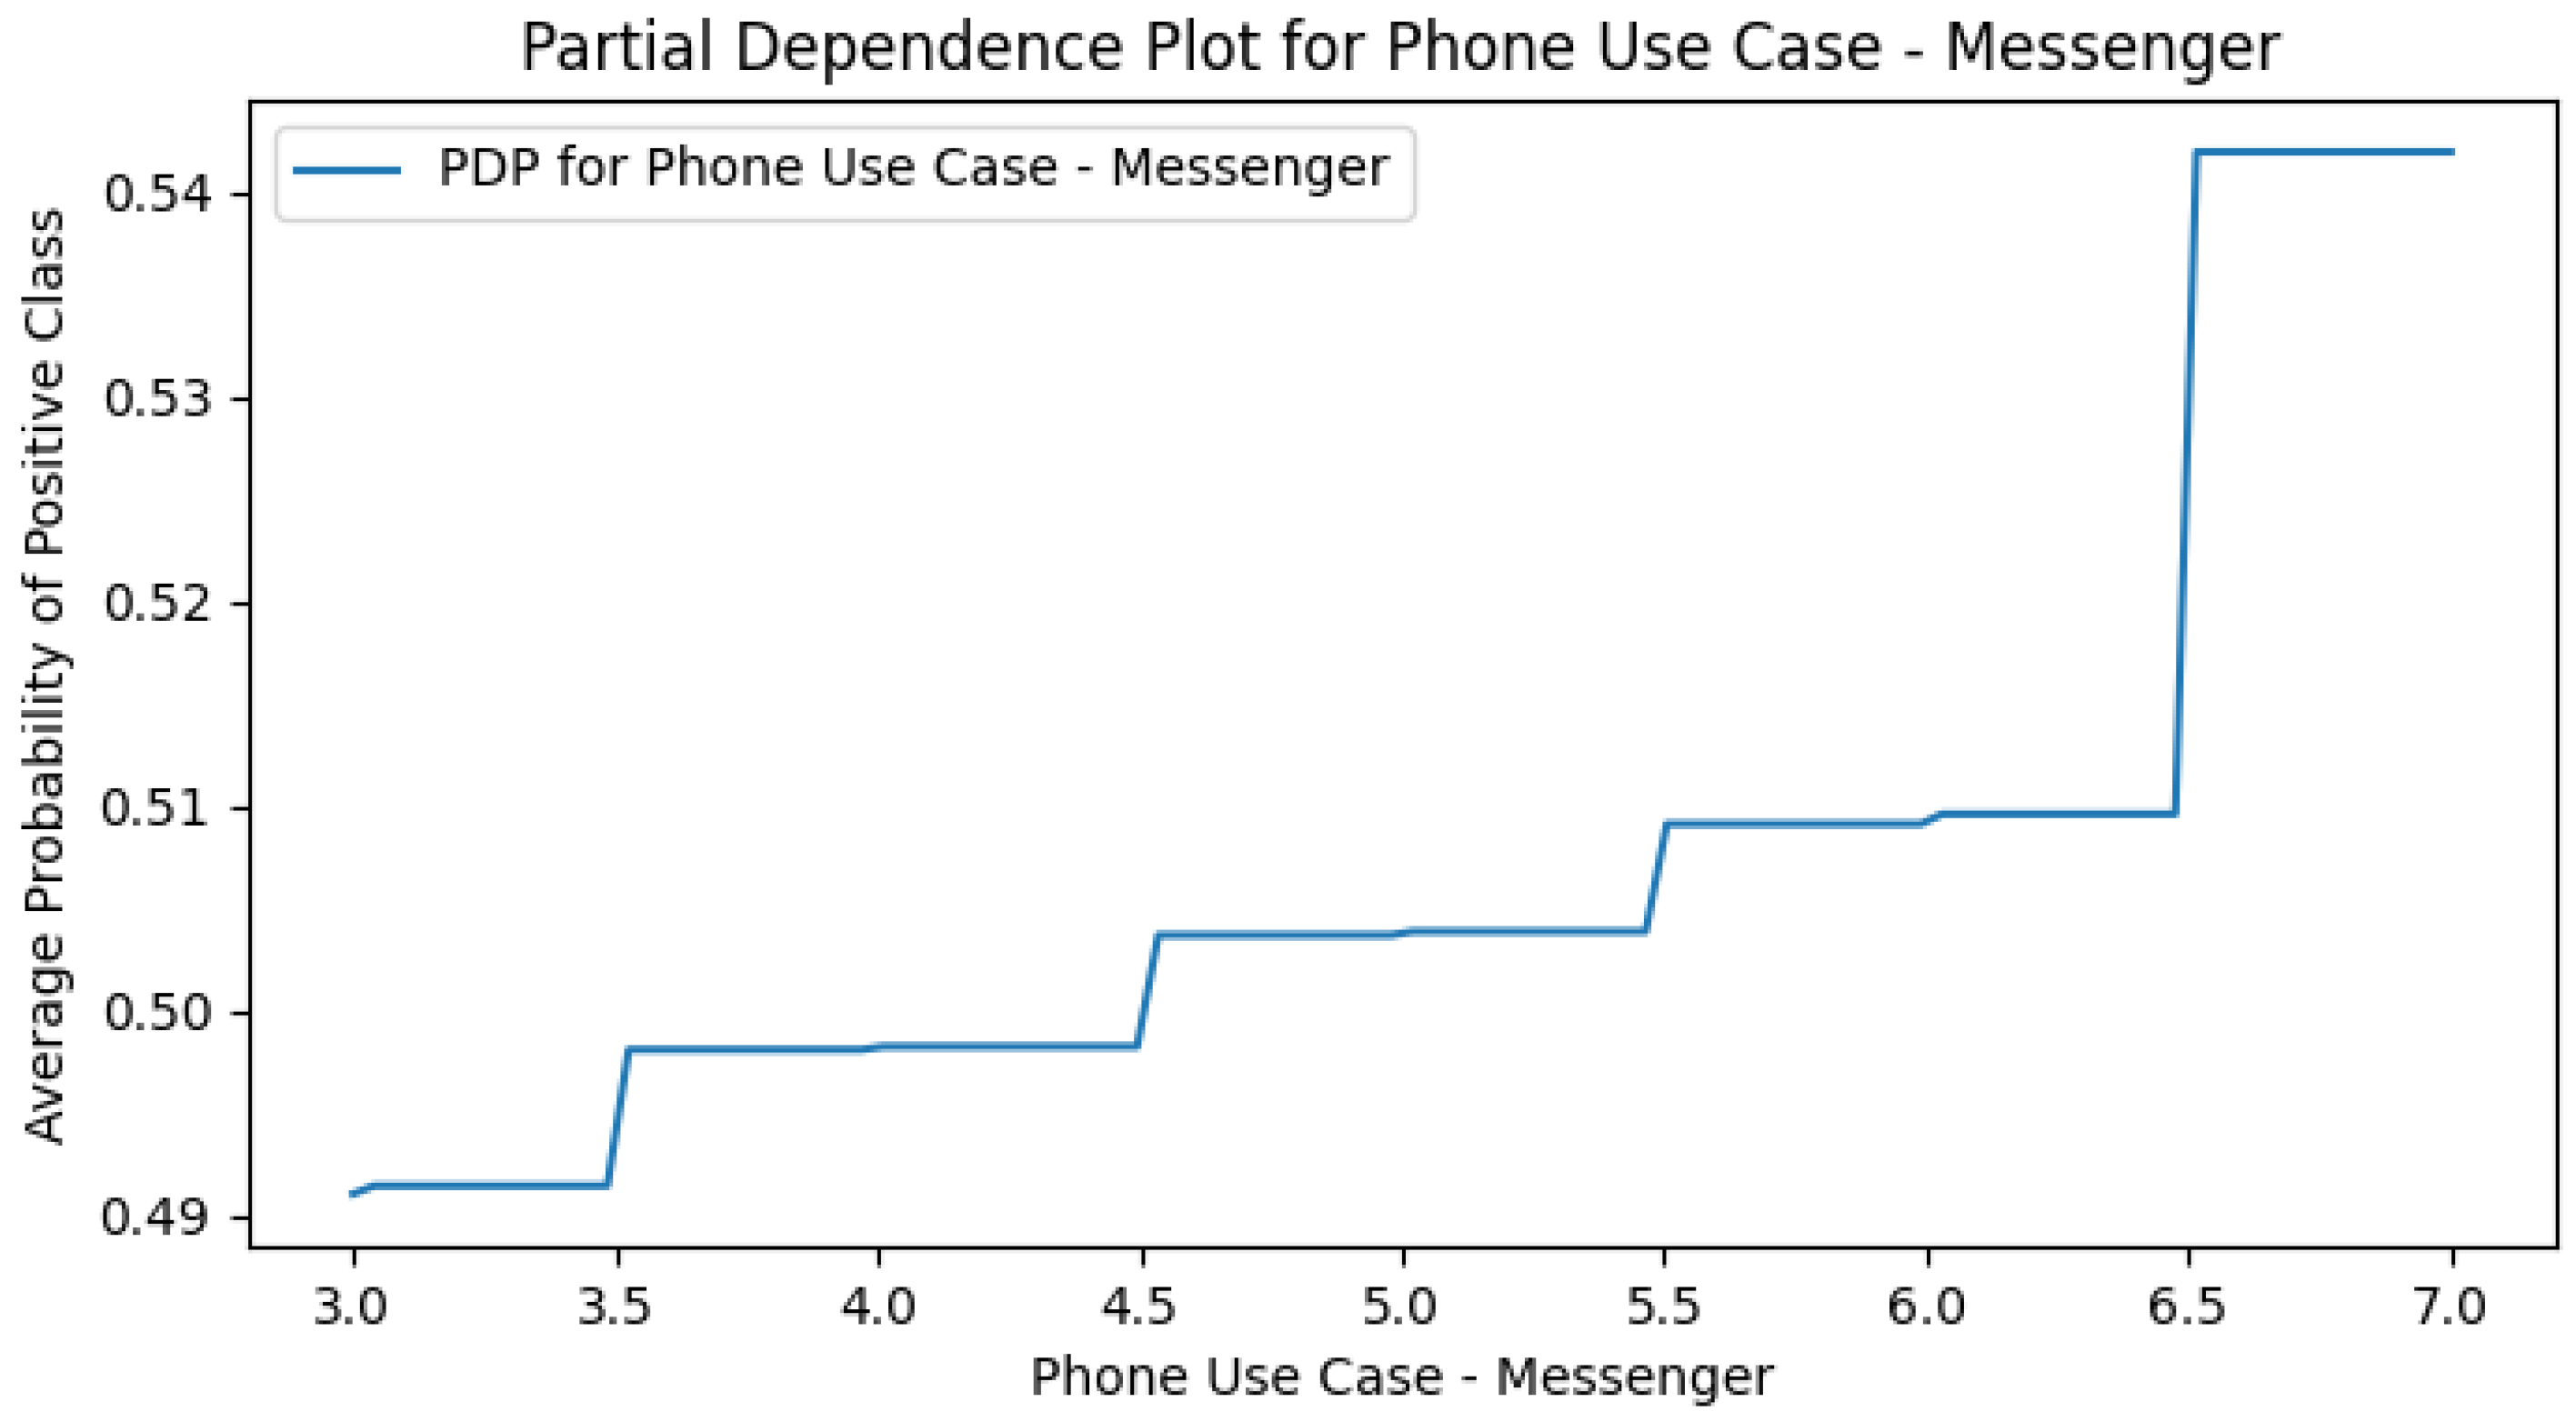
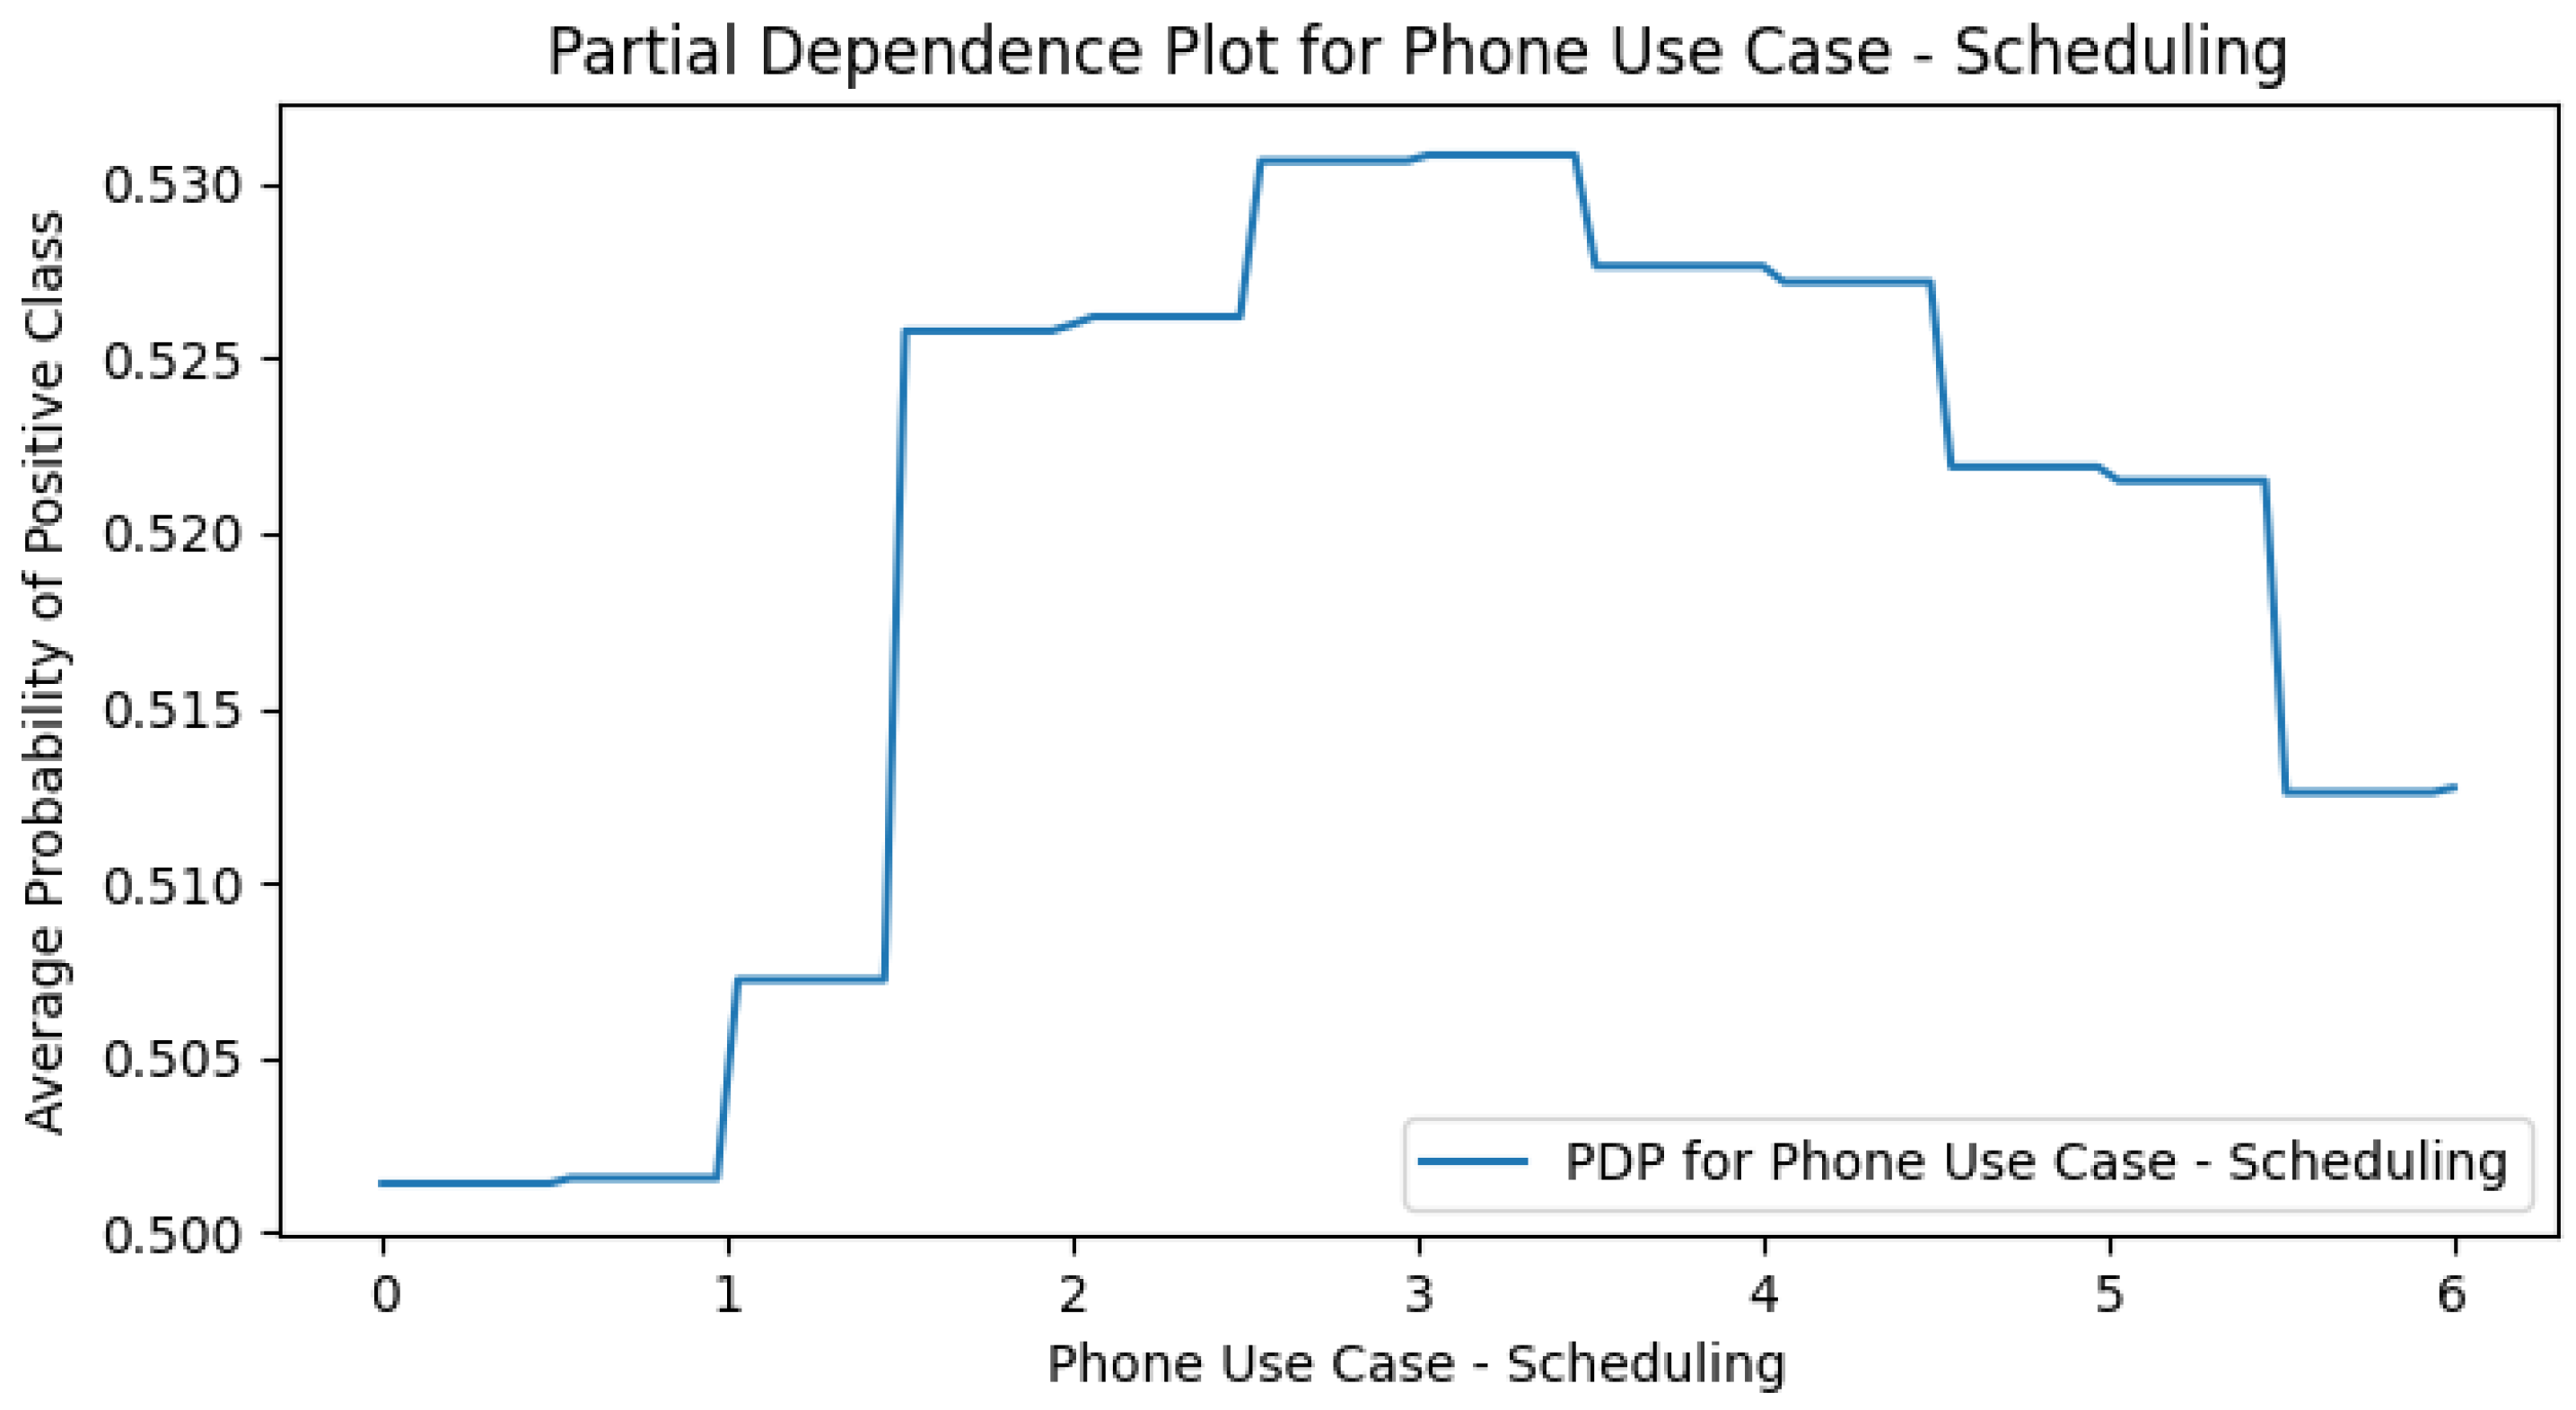
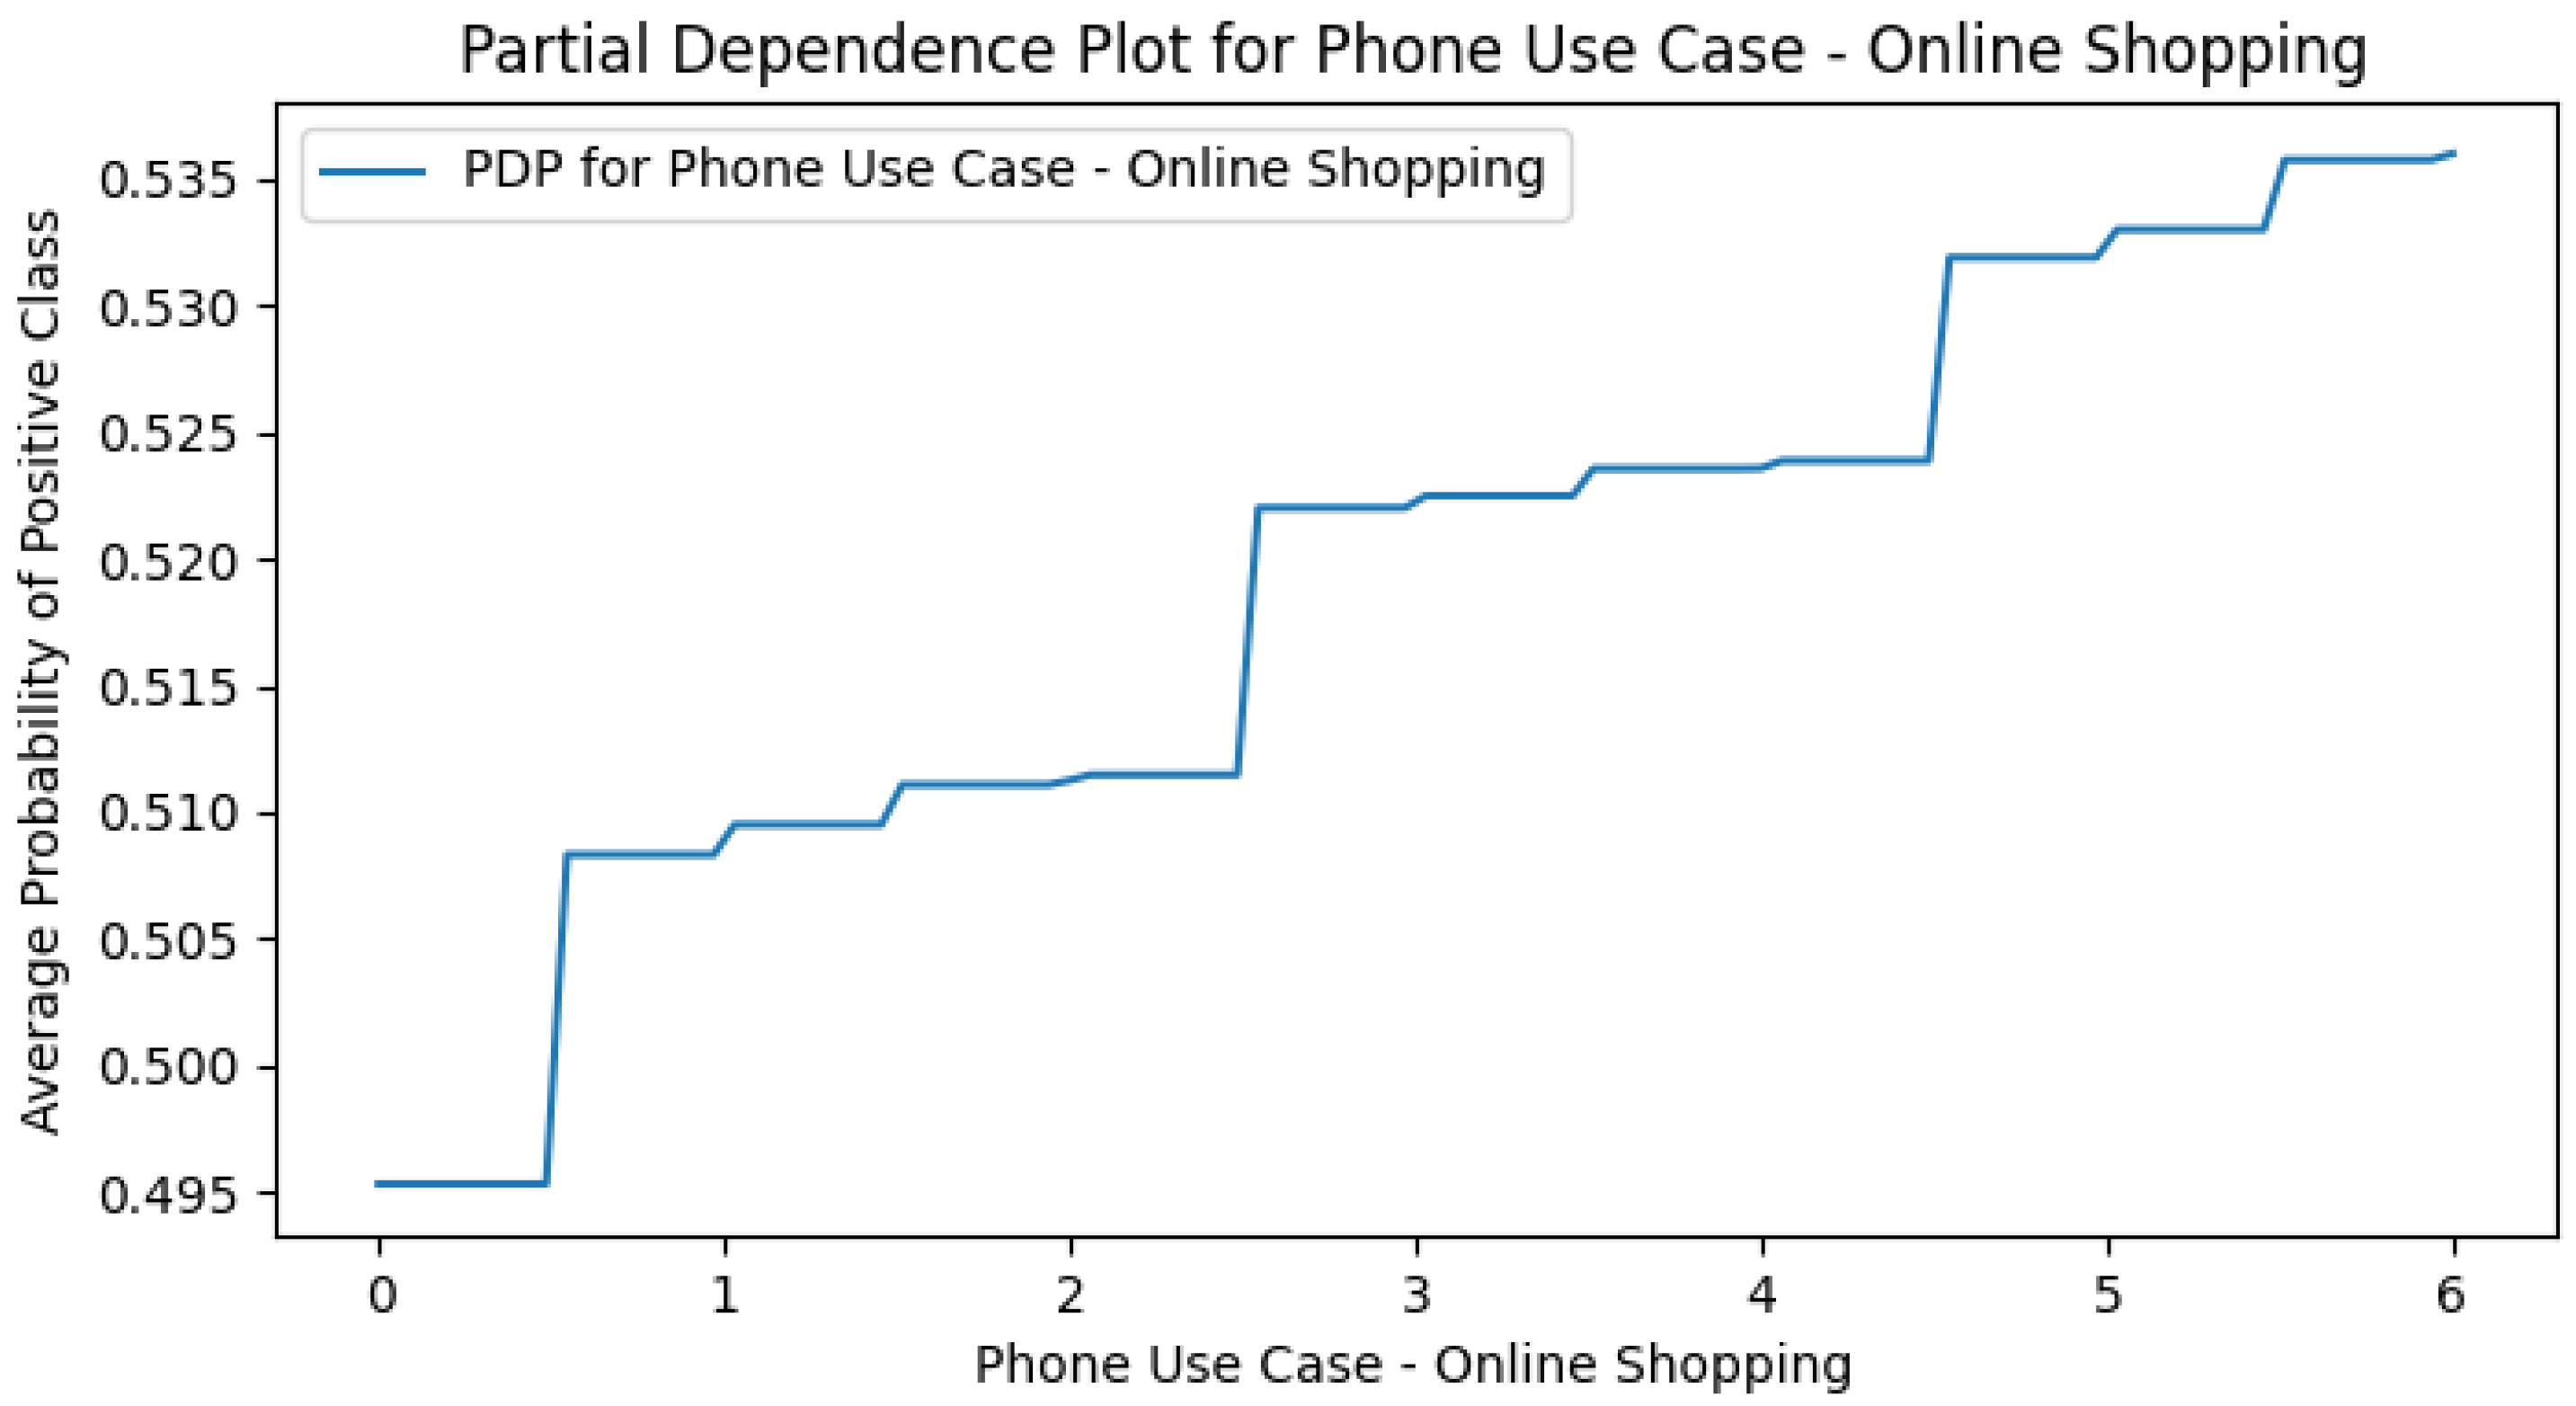
Appendix E. M4 (+Smartphone Use Cases) PDPs


Appendix F. Smart CD PDPs
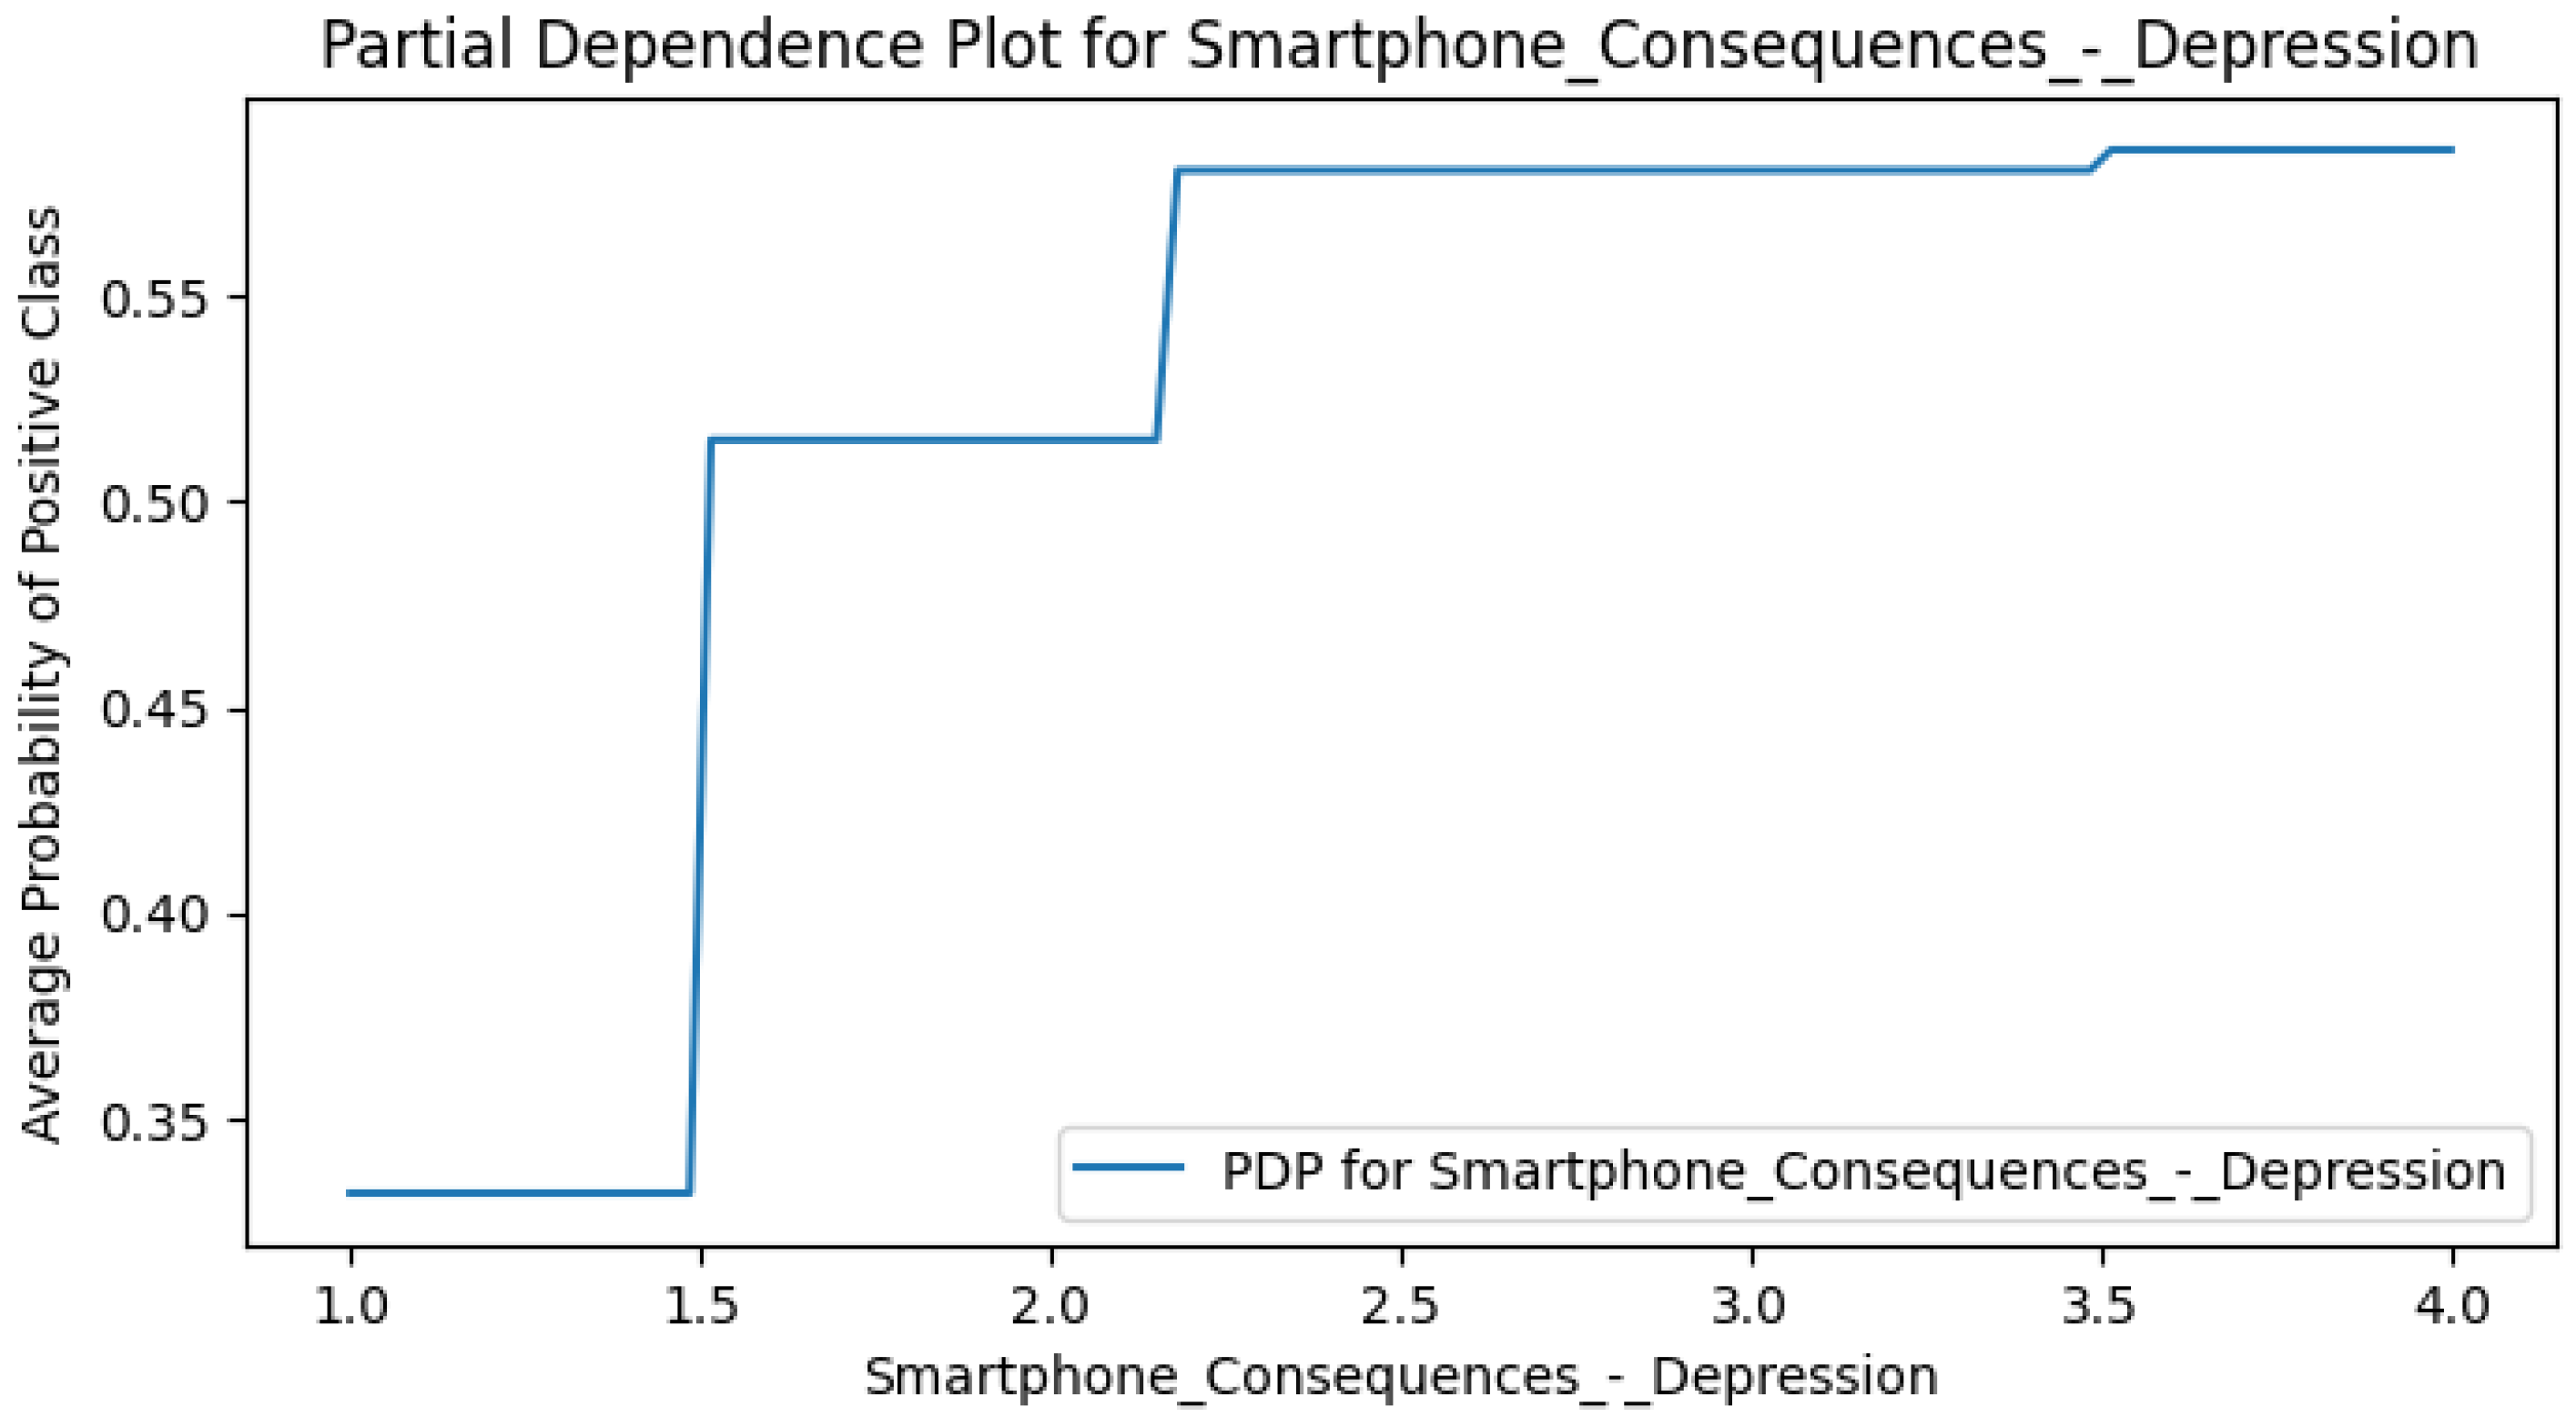
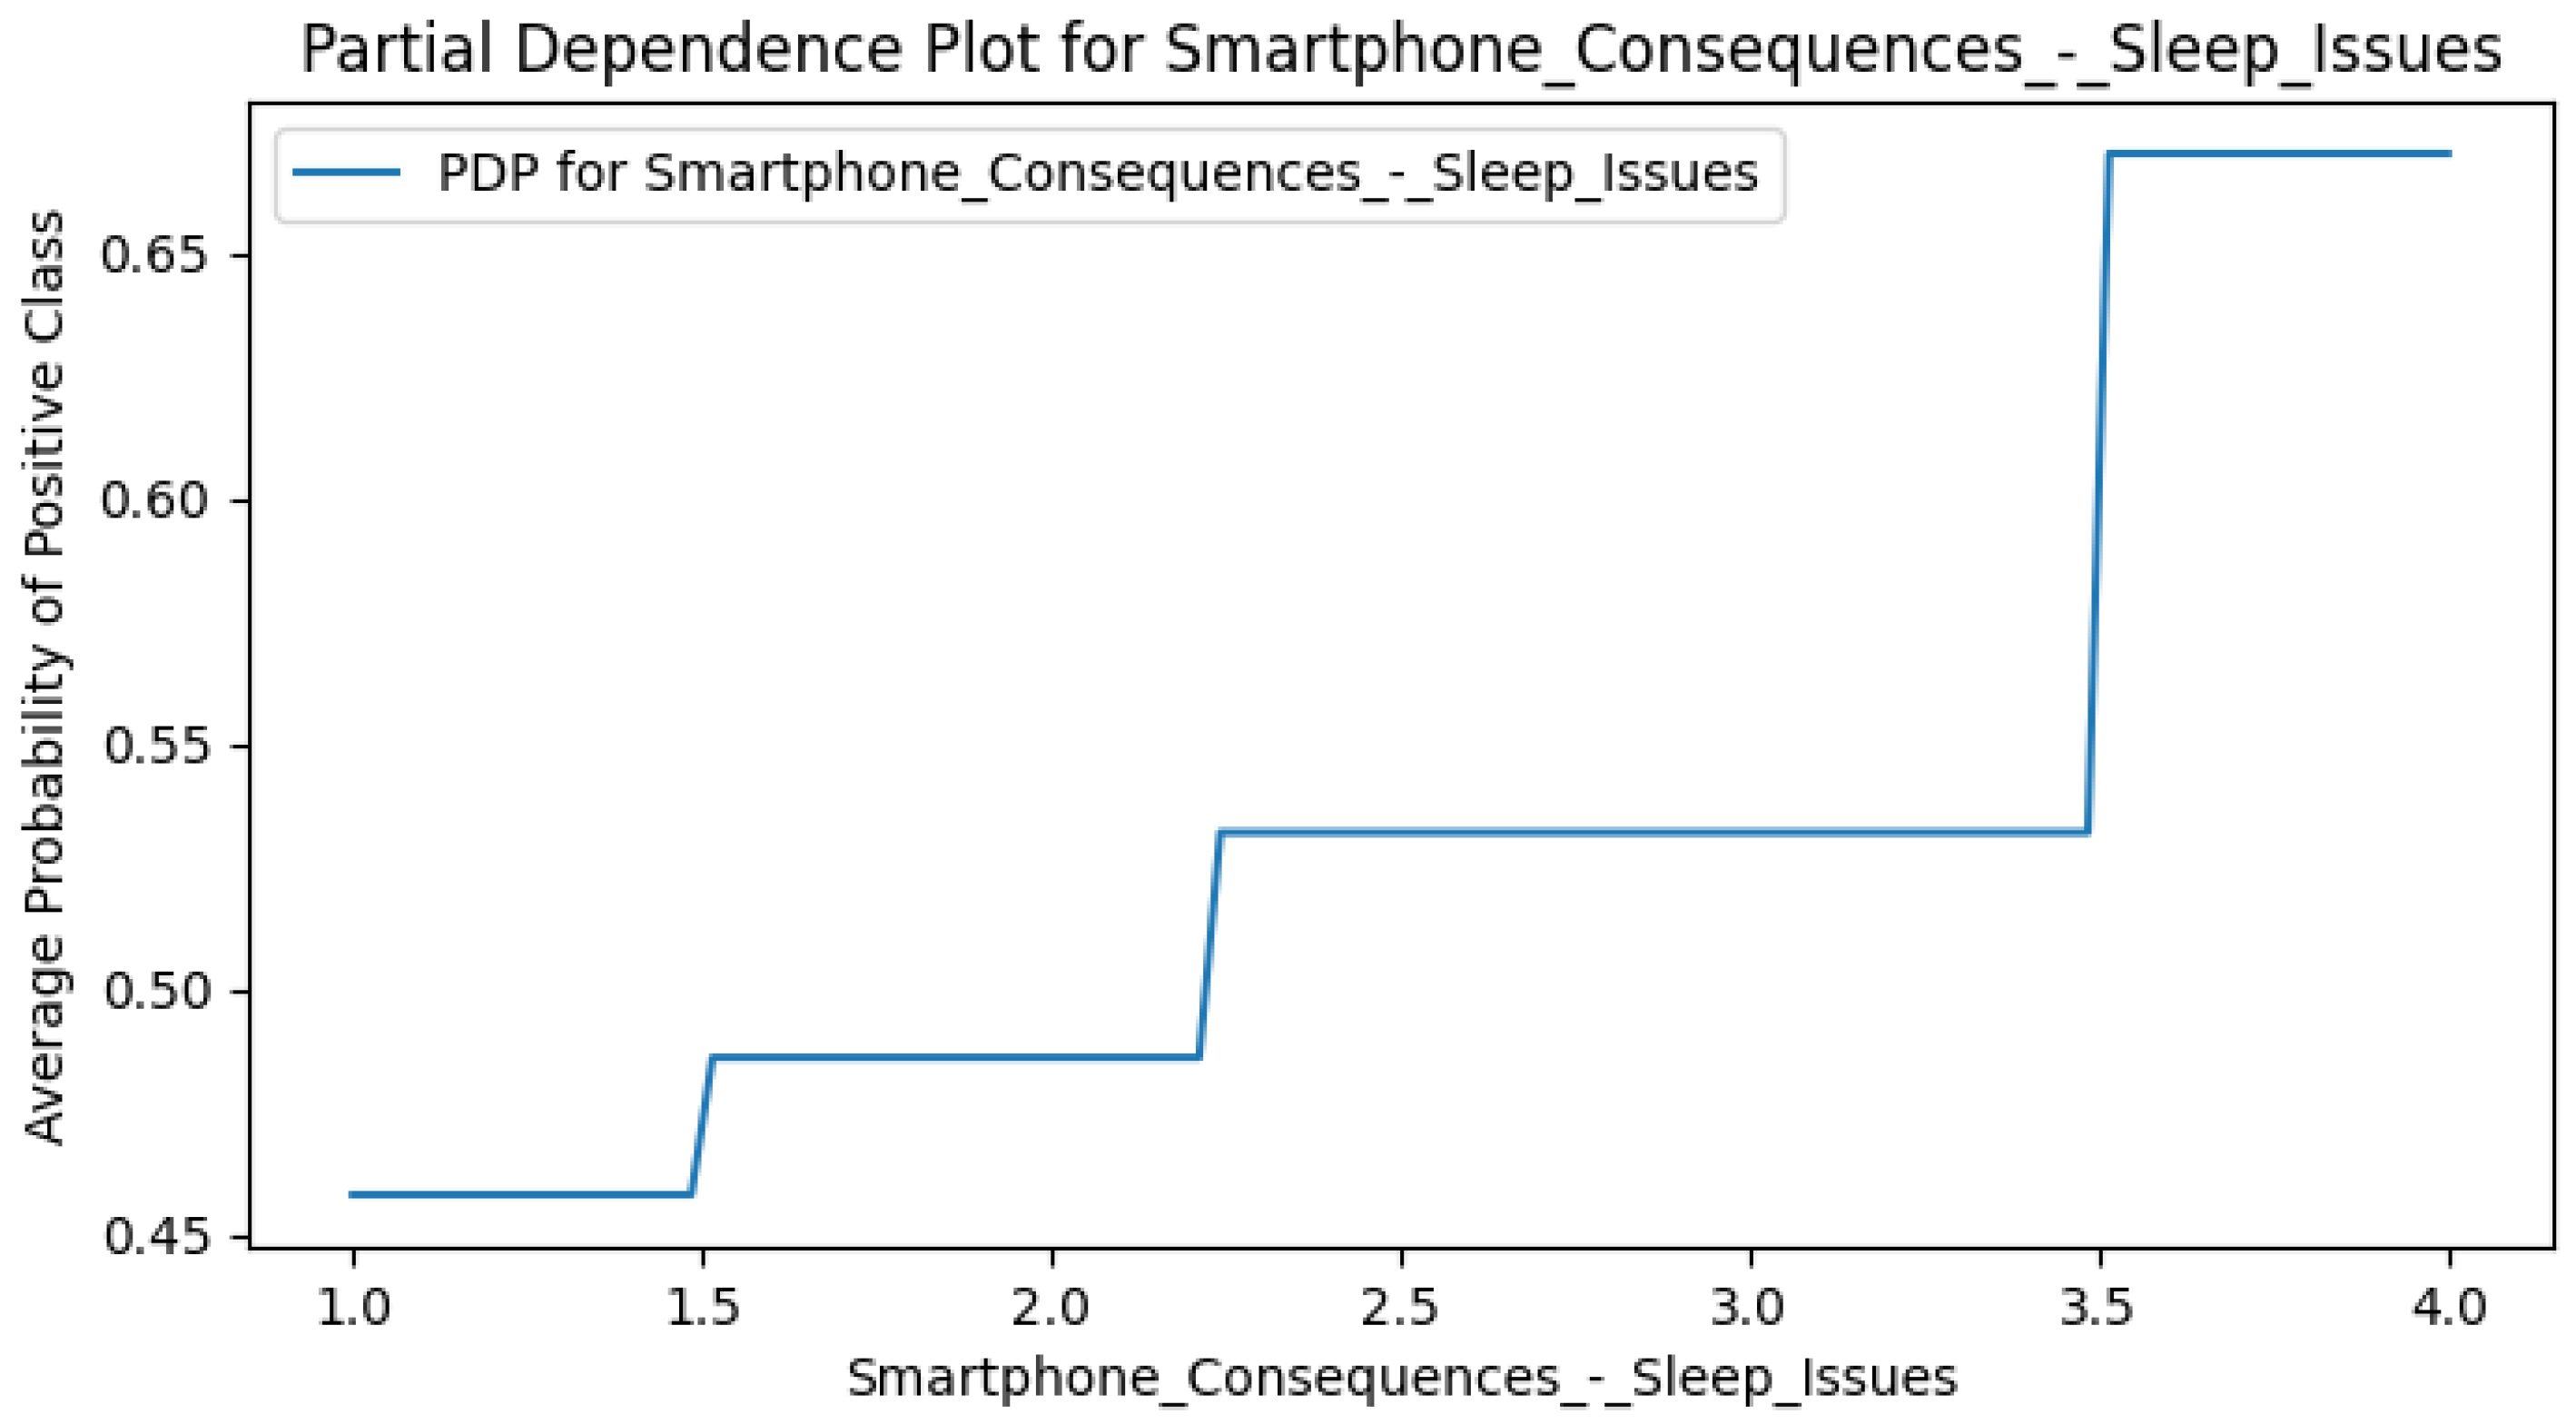
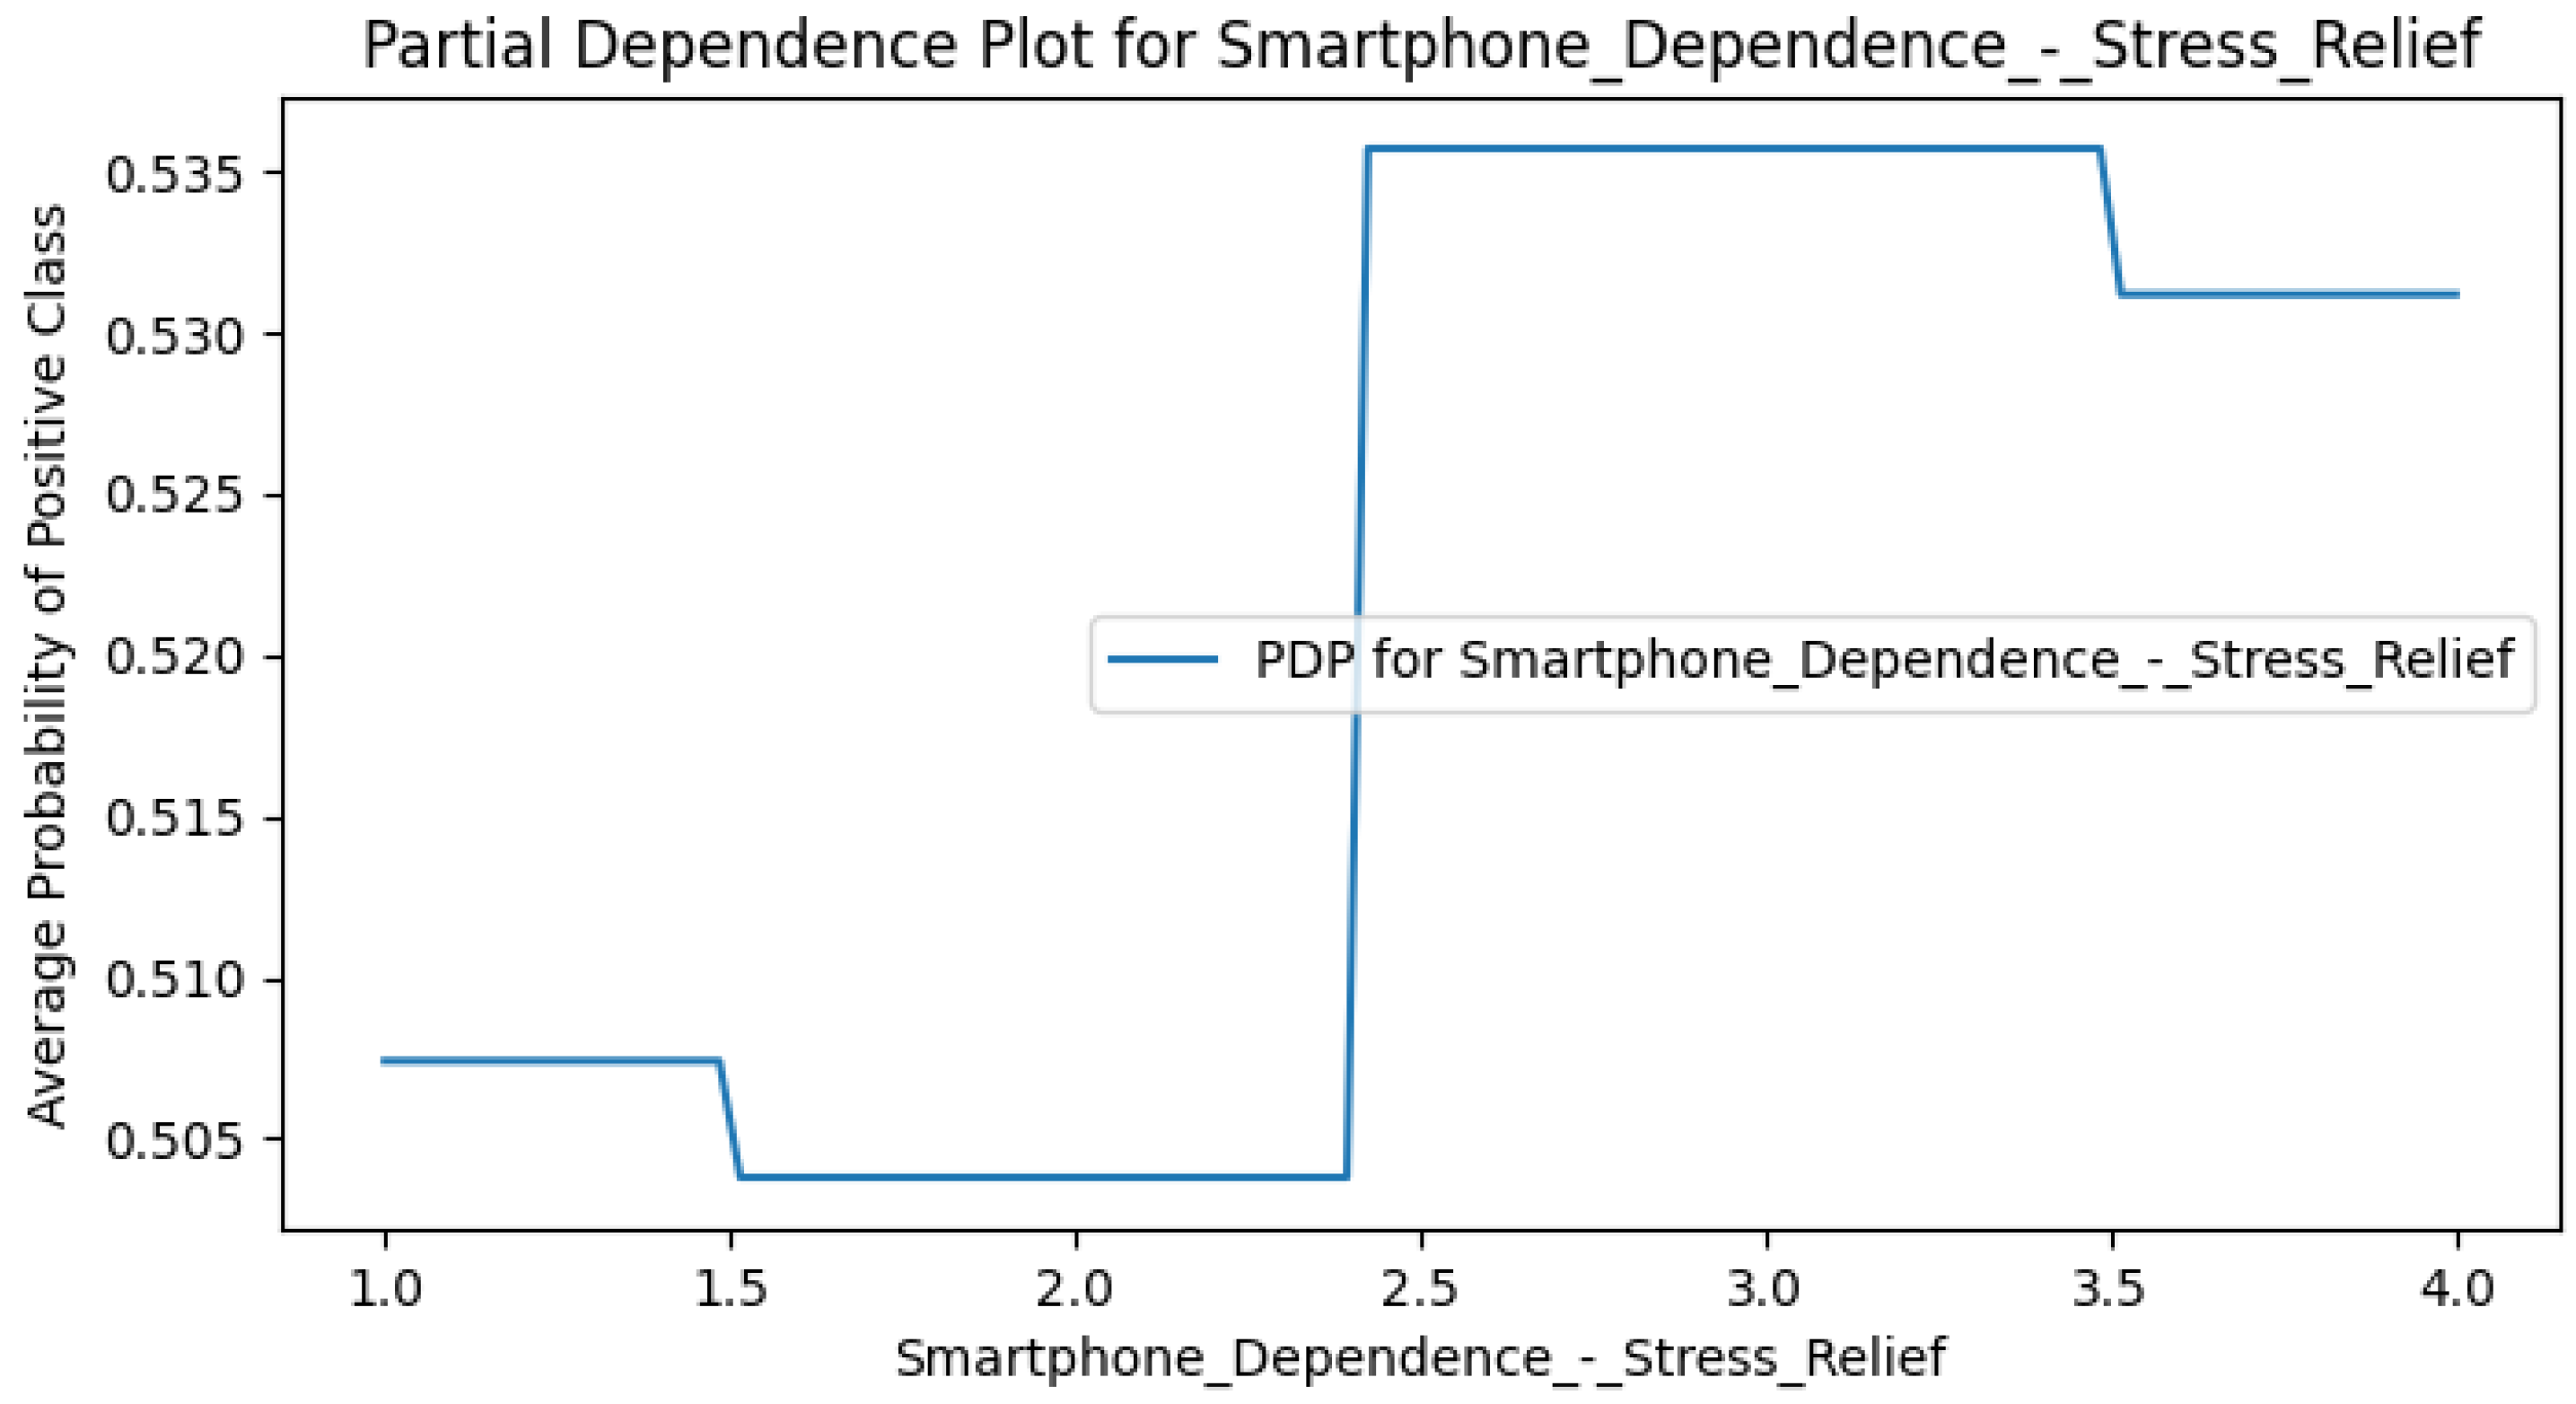
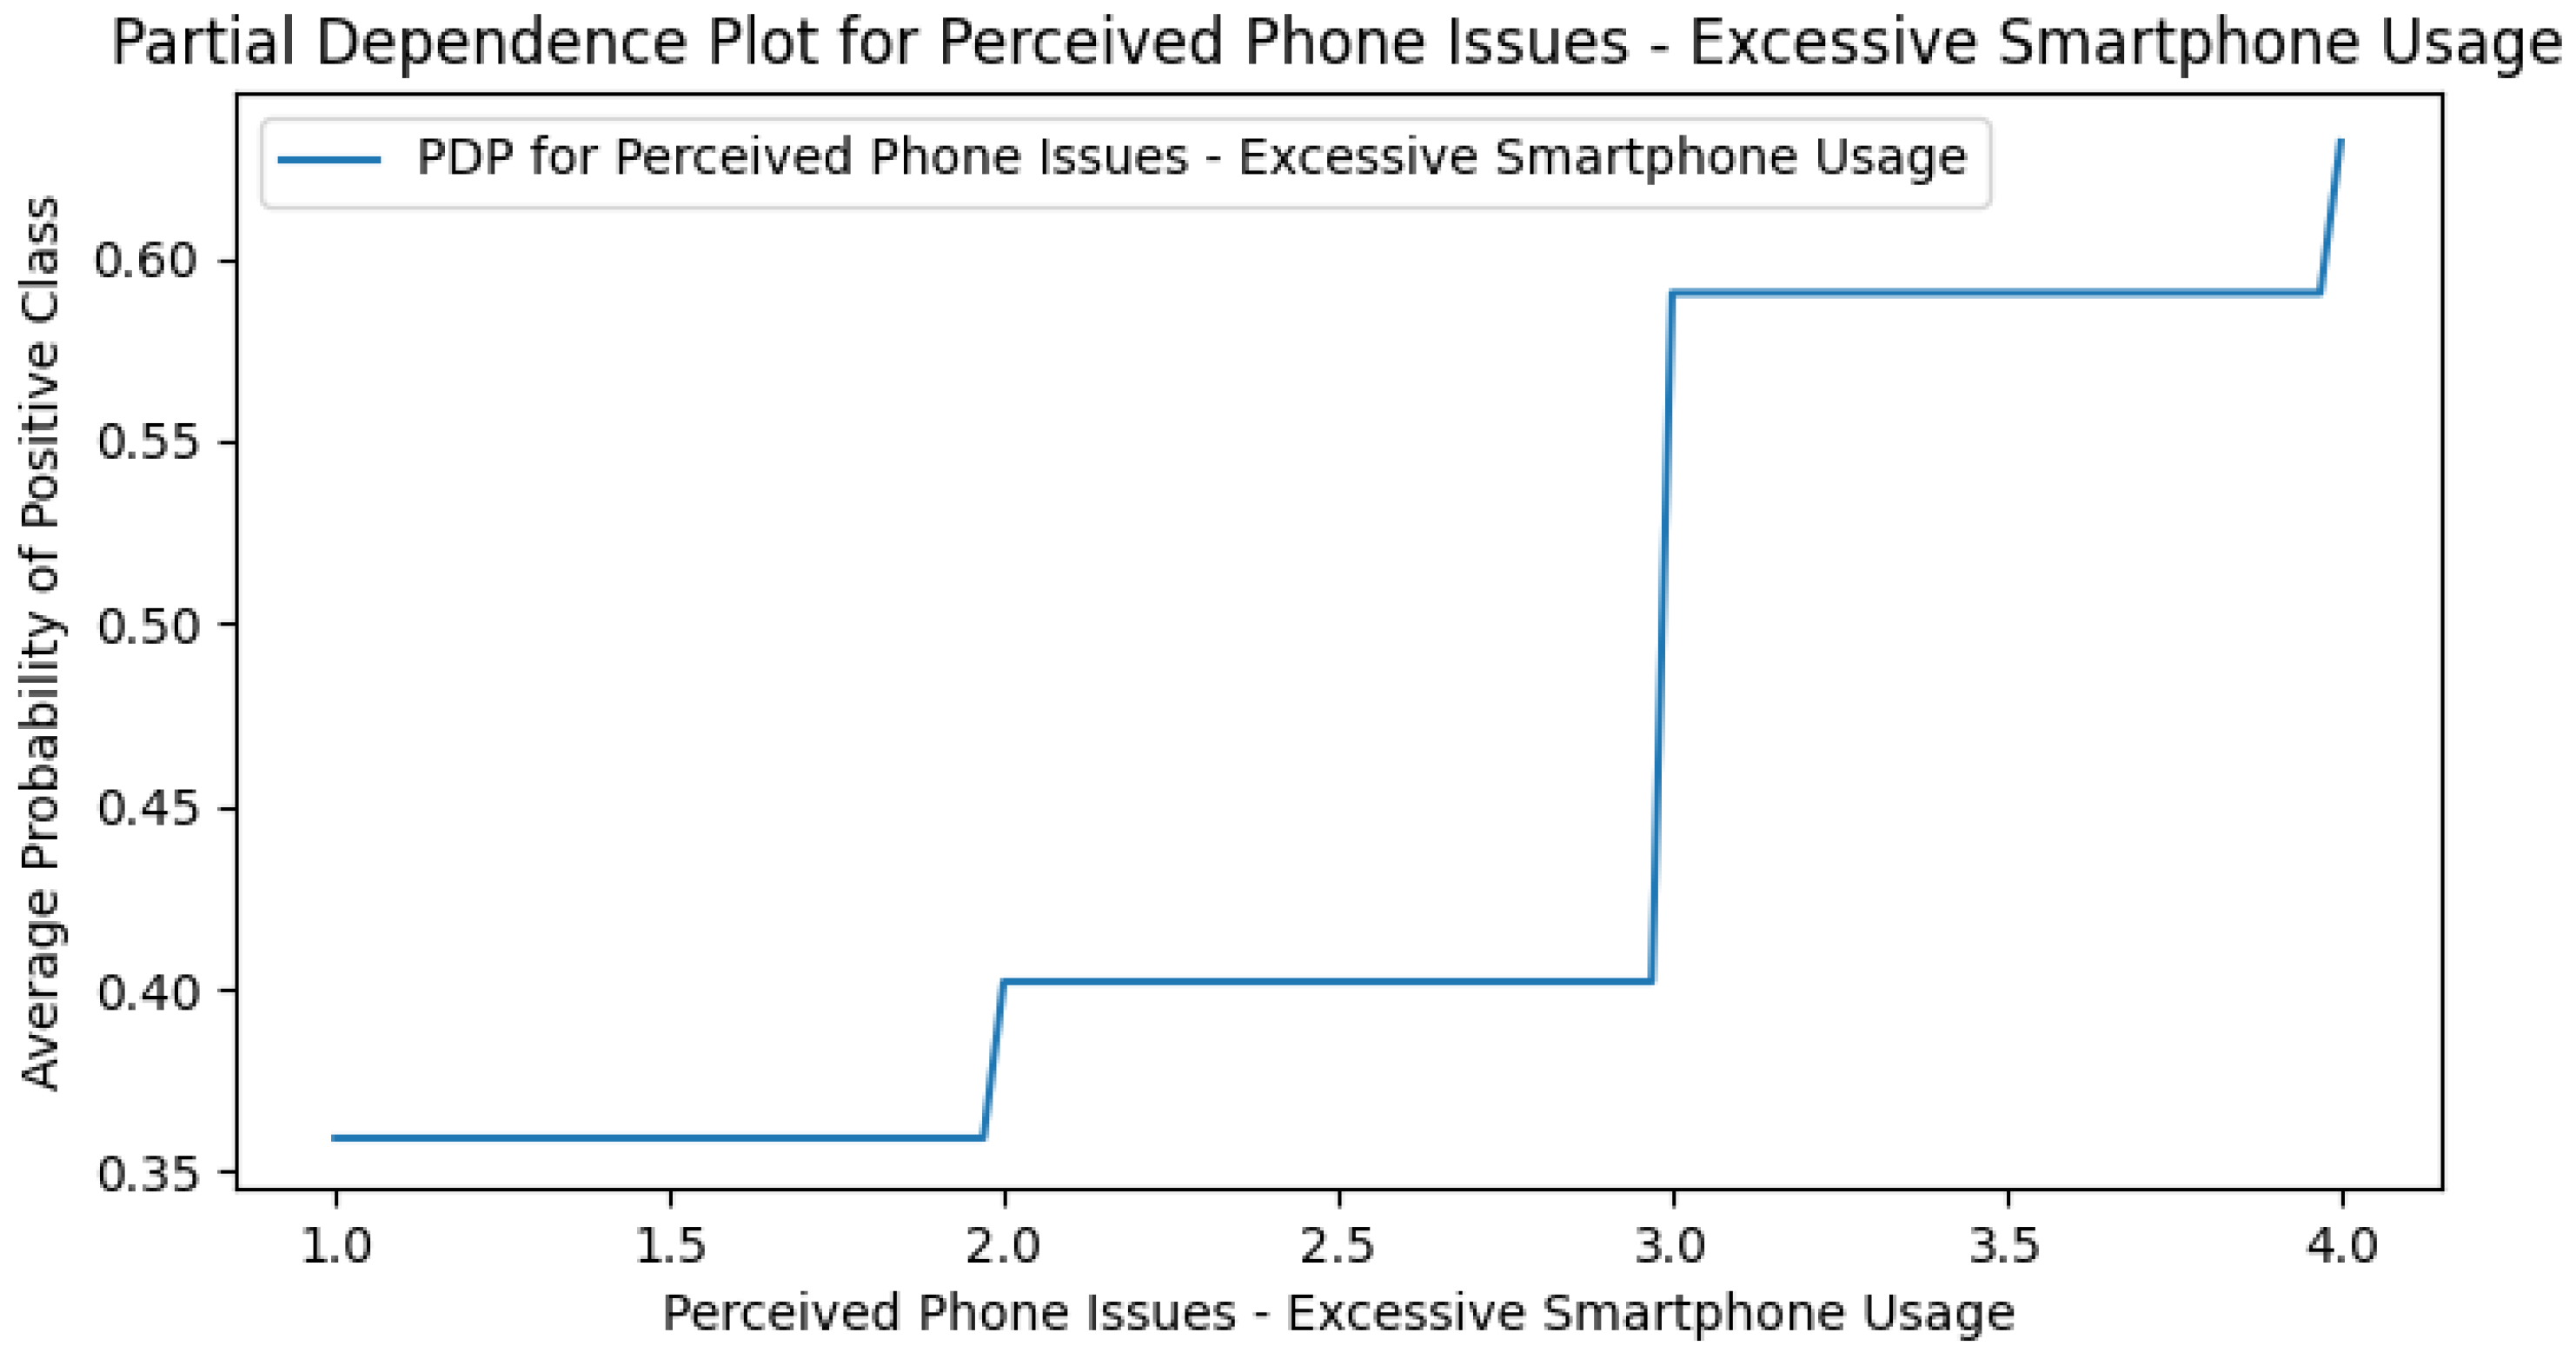
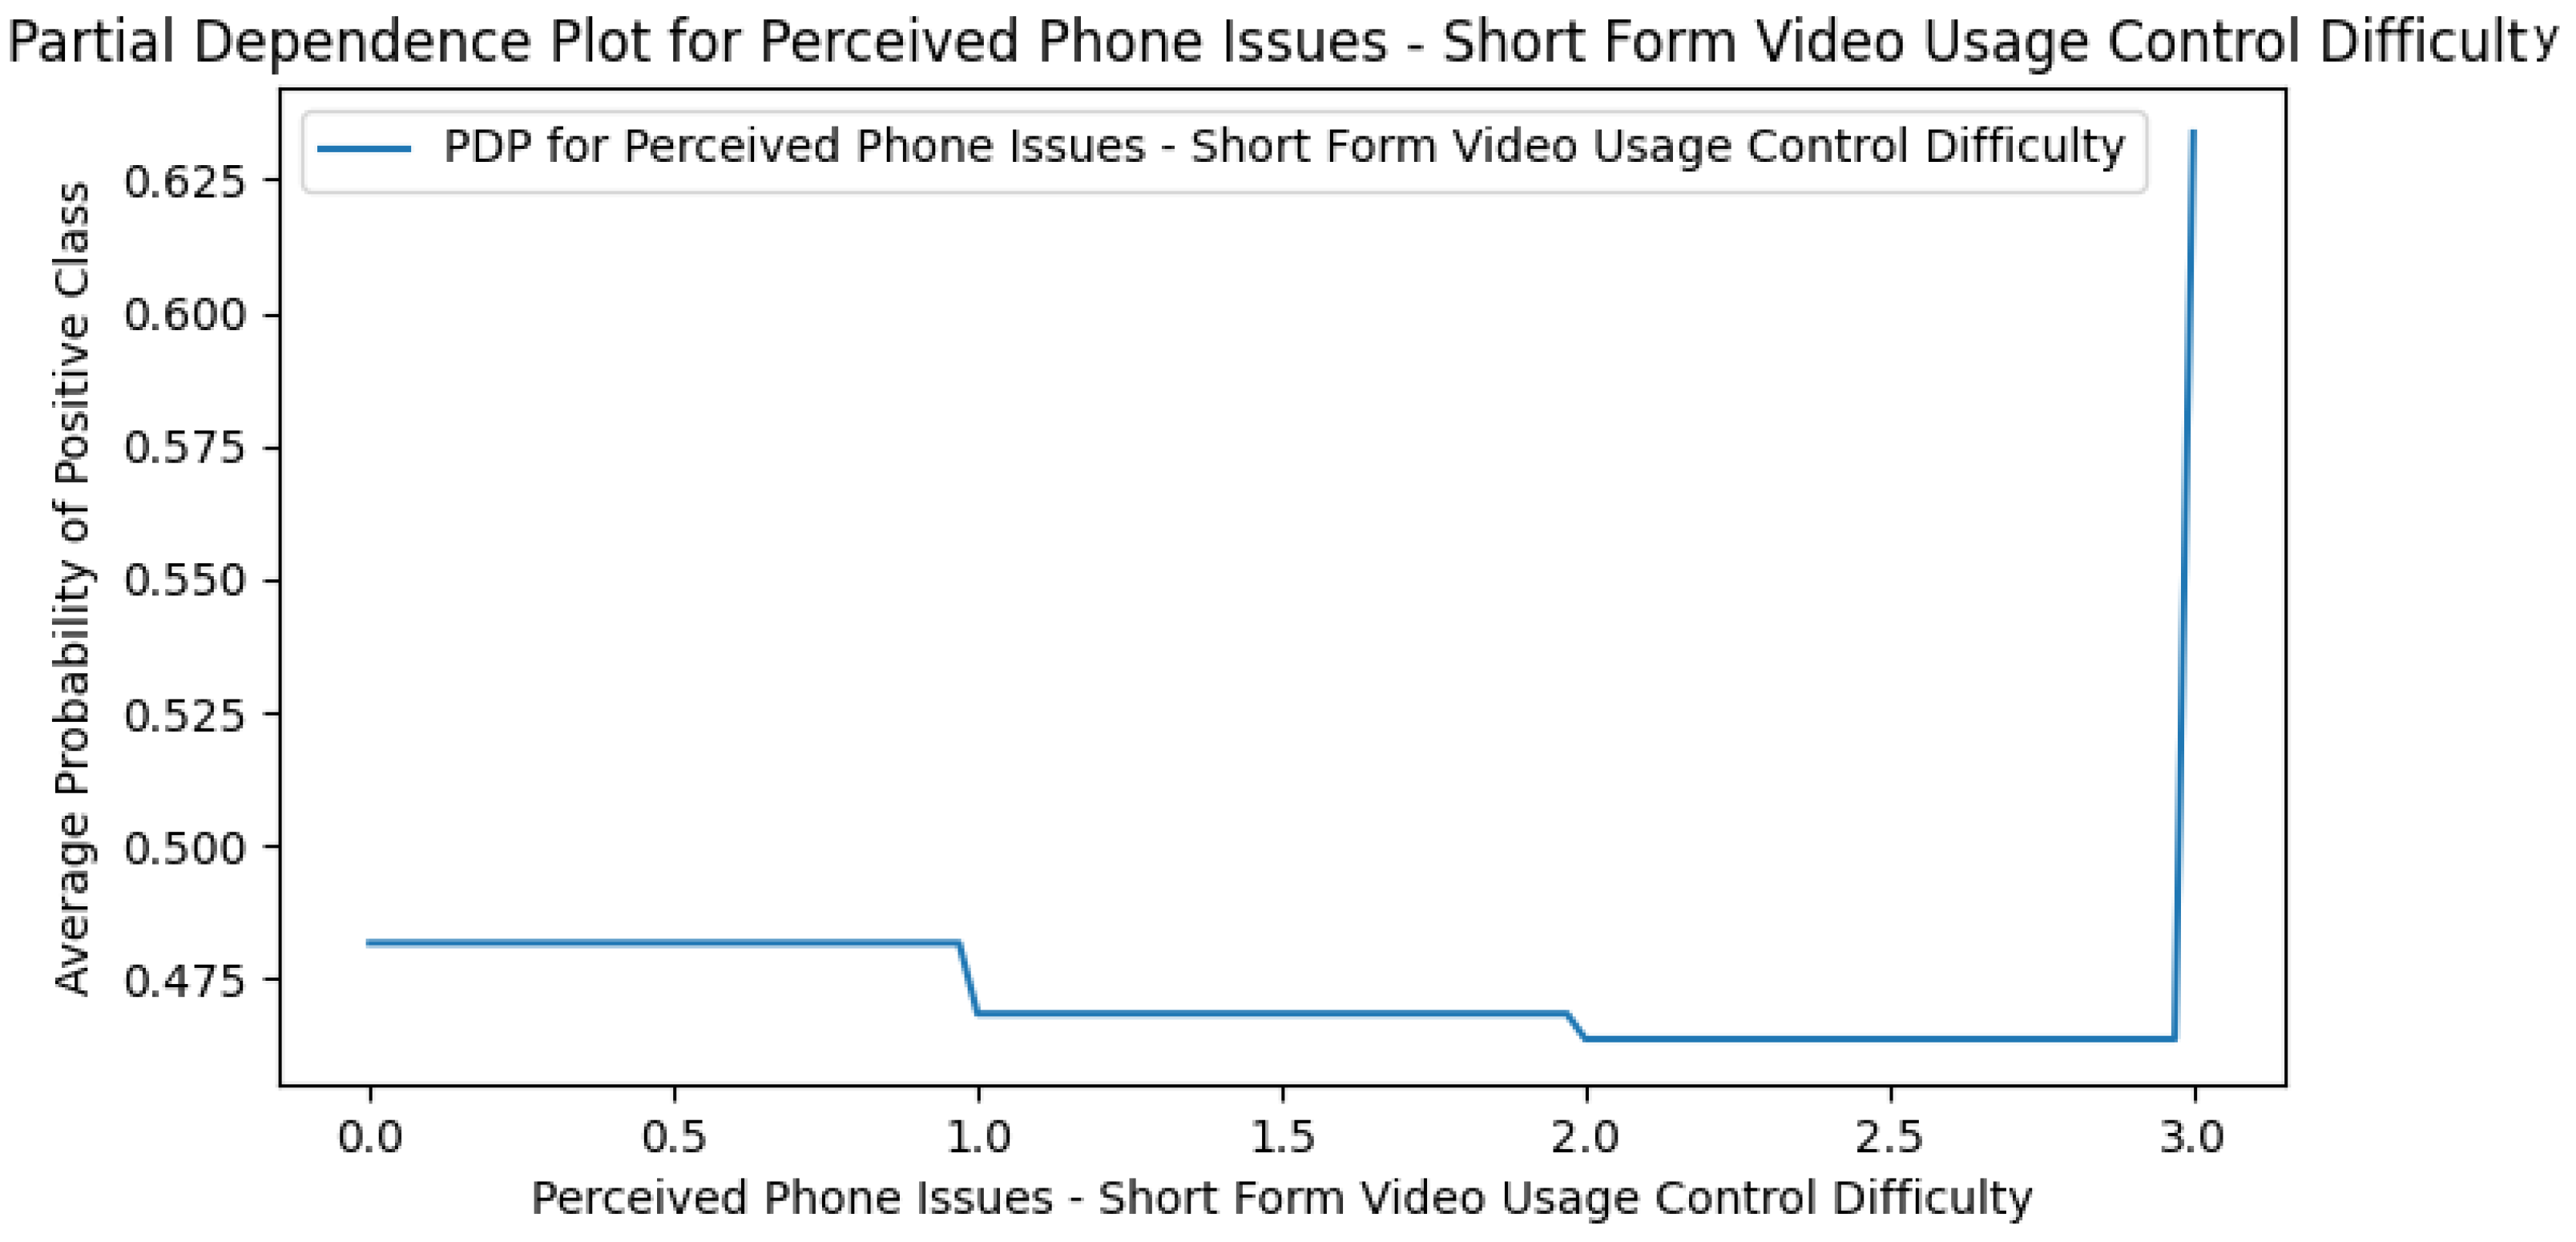
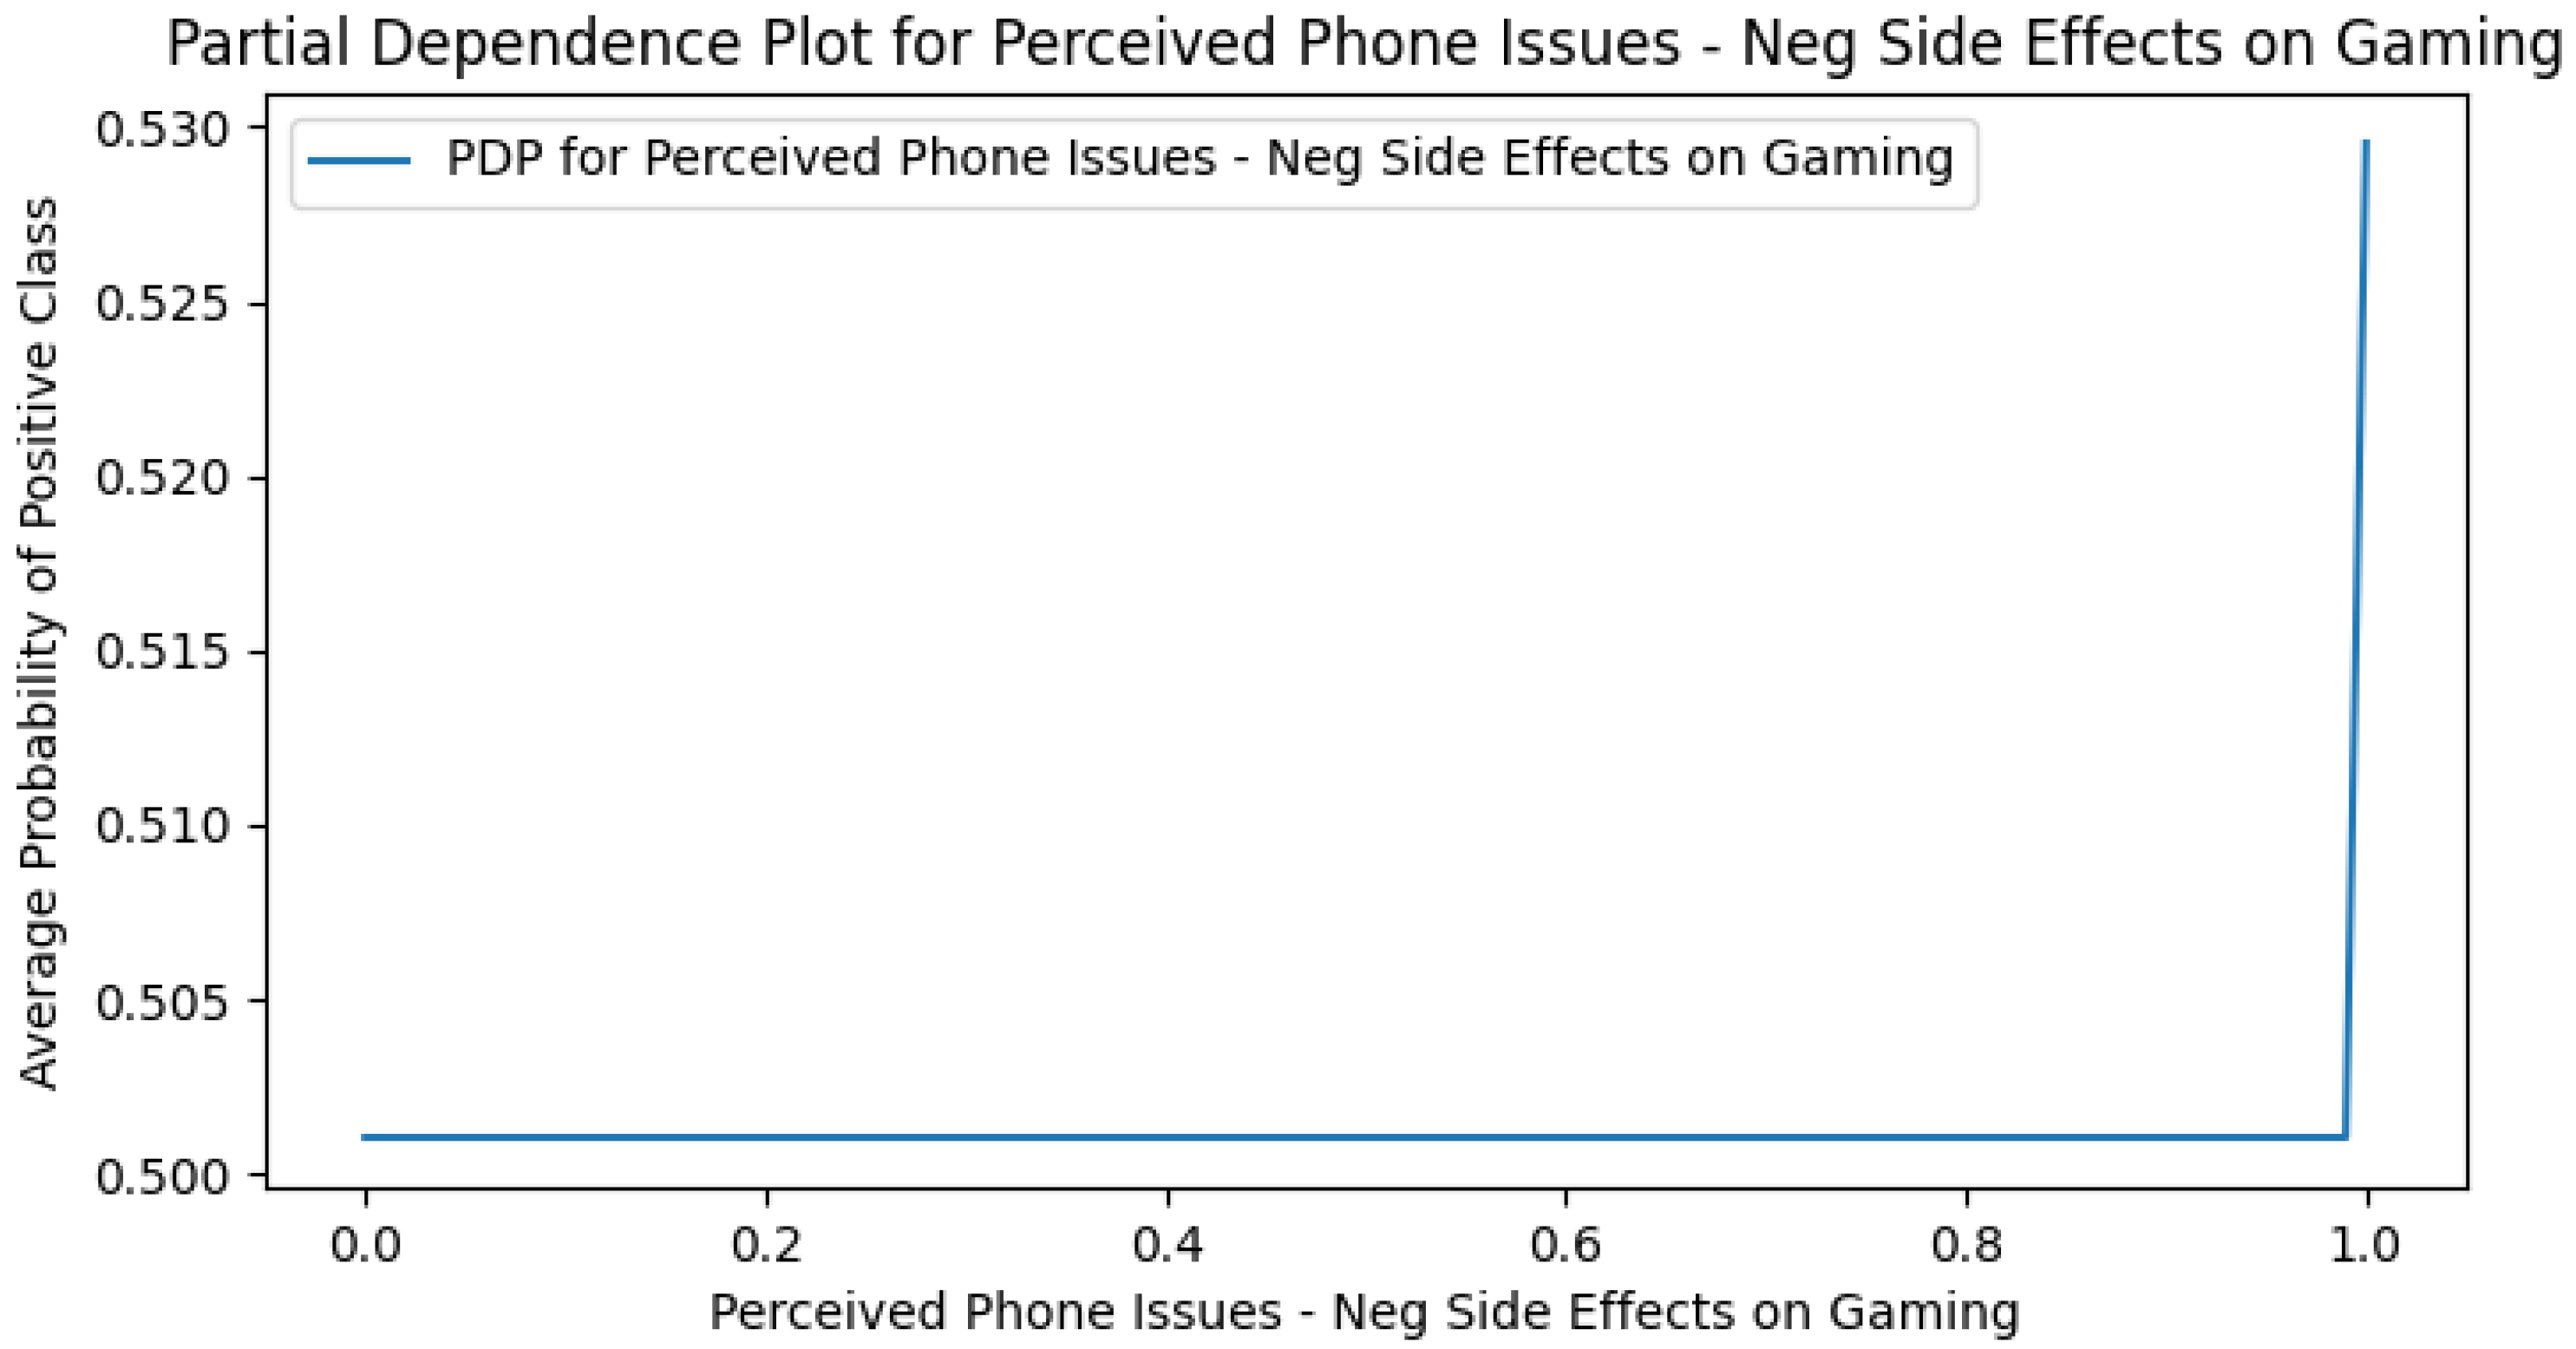
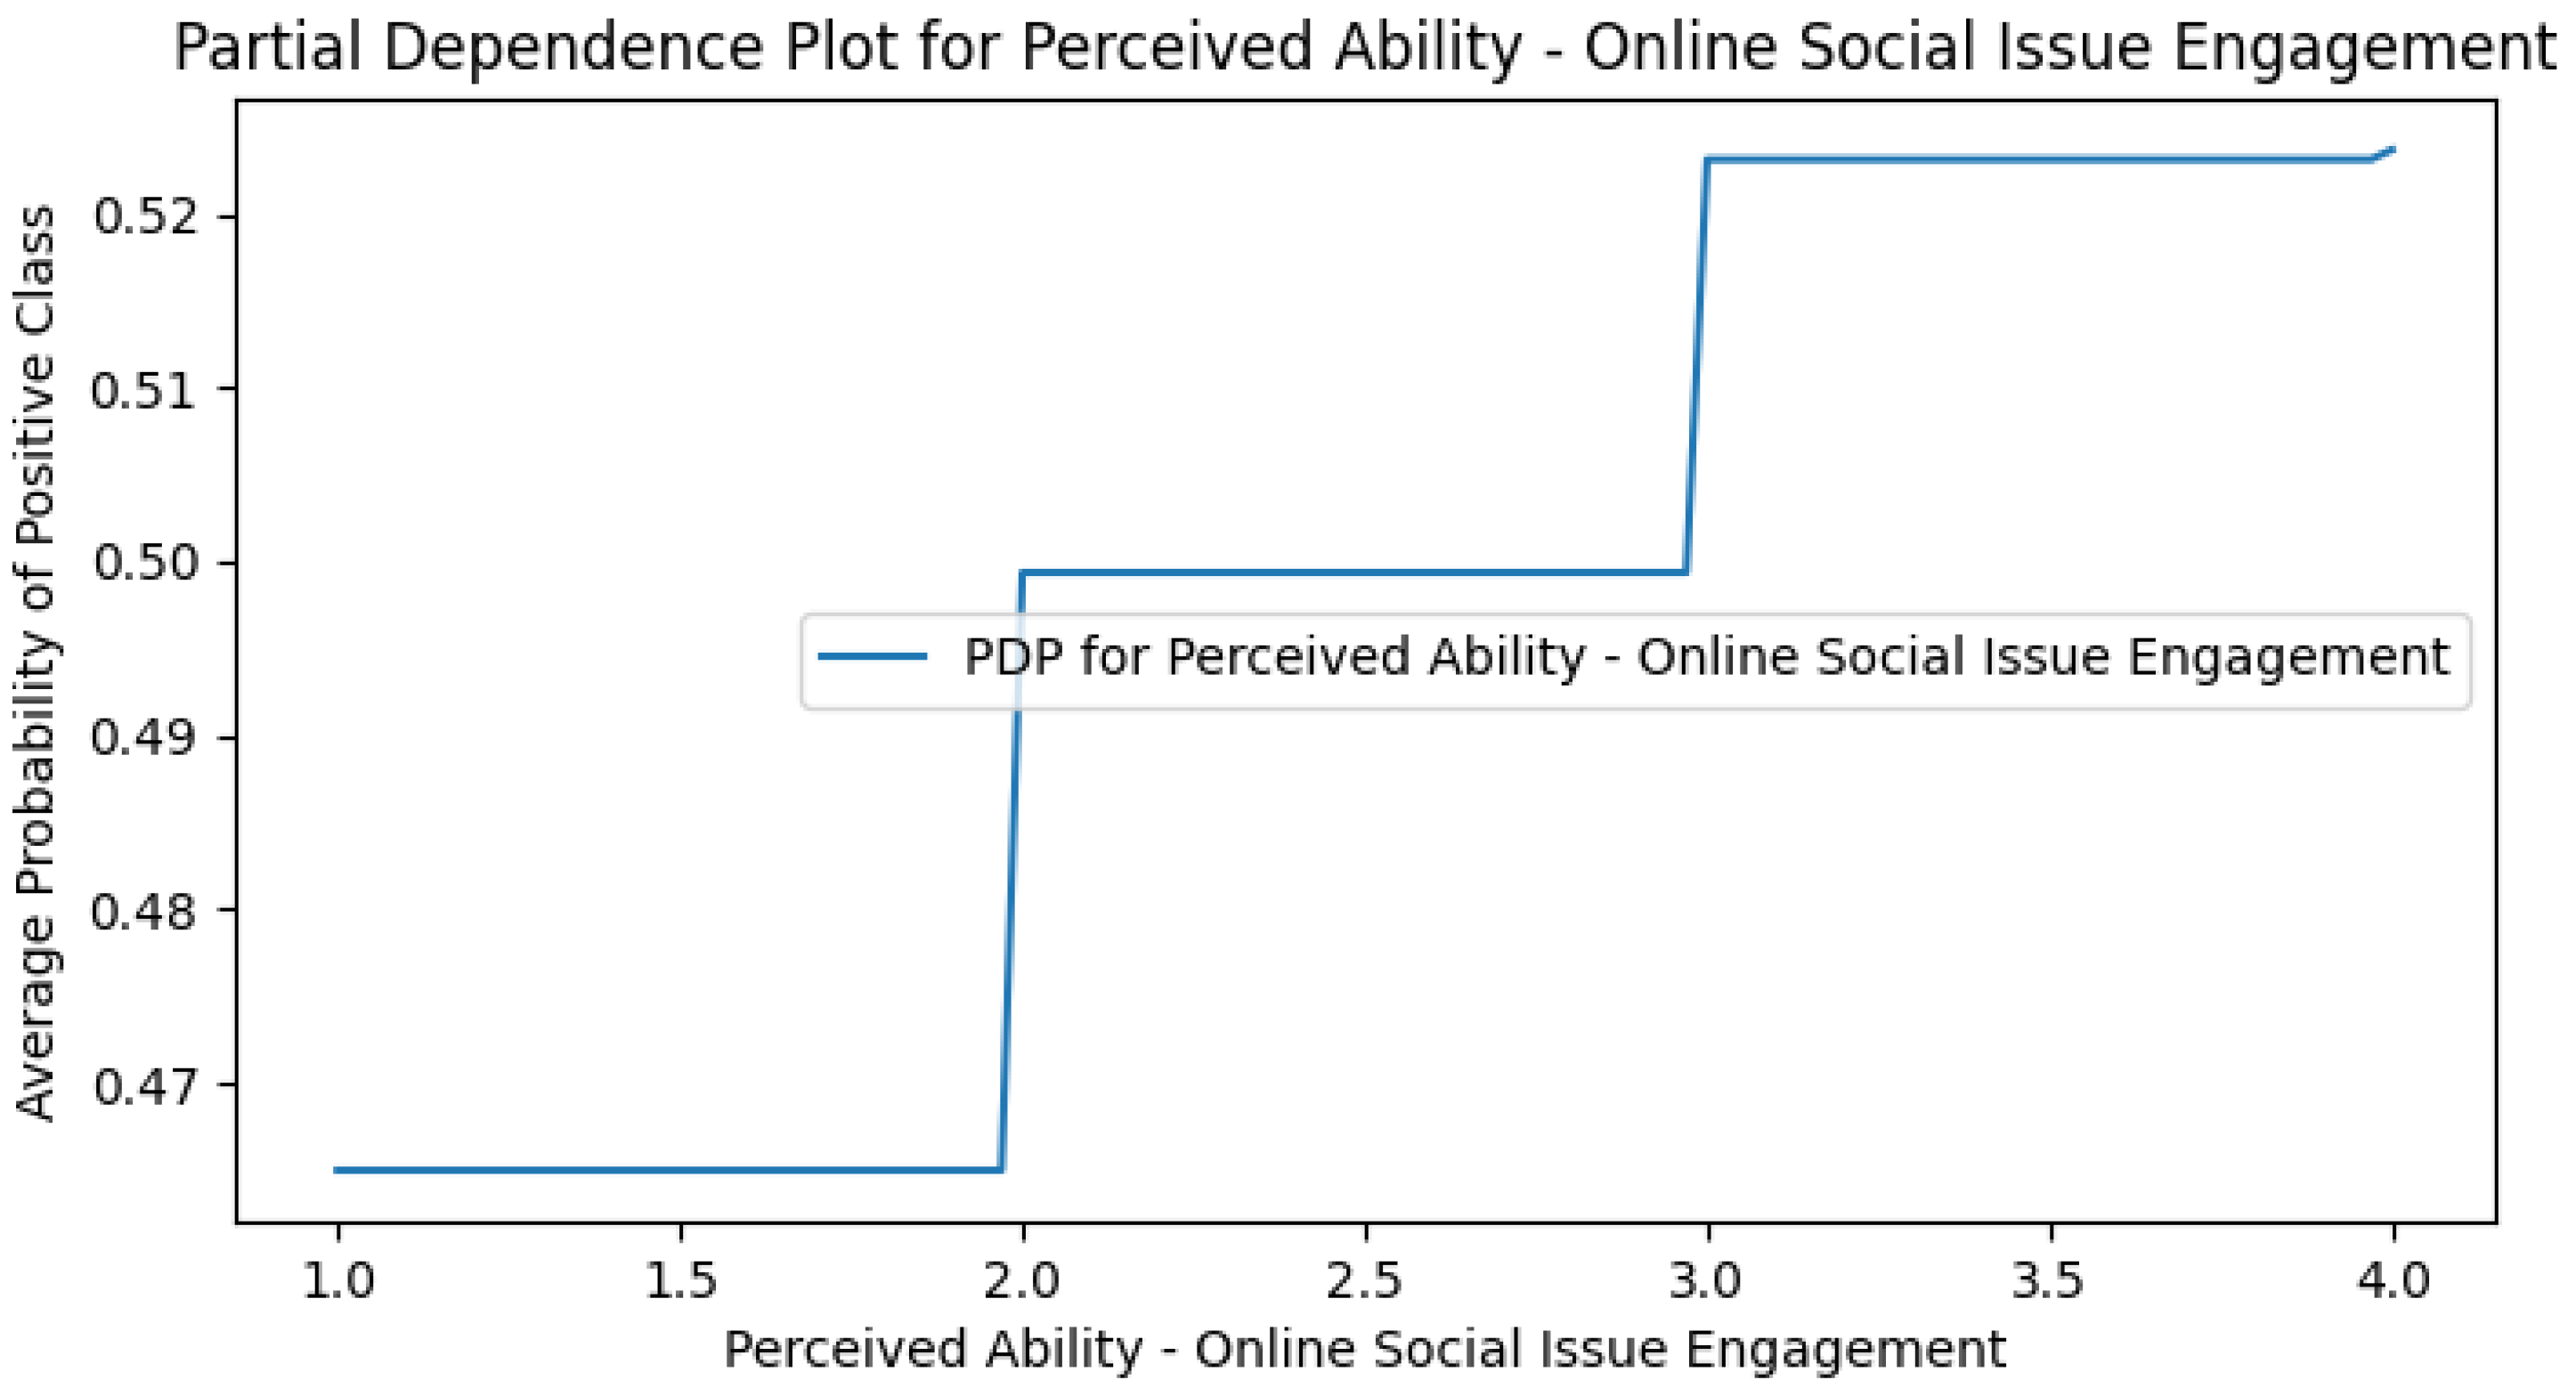
Appendix G. Perceived DCR PDPs
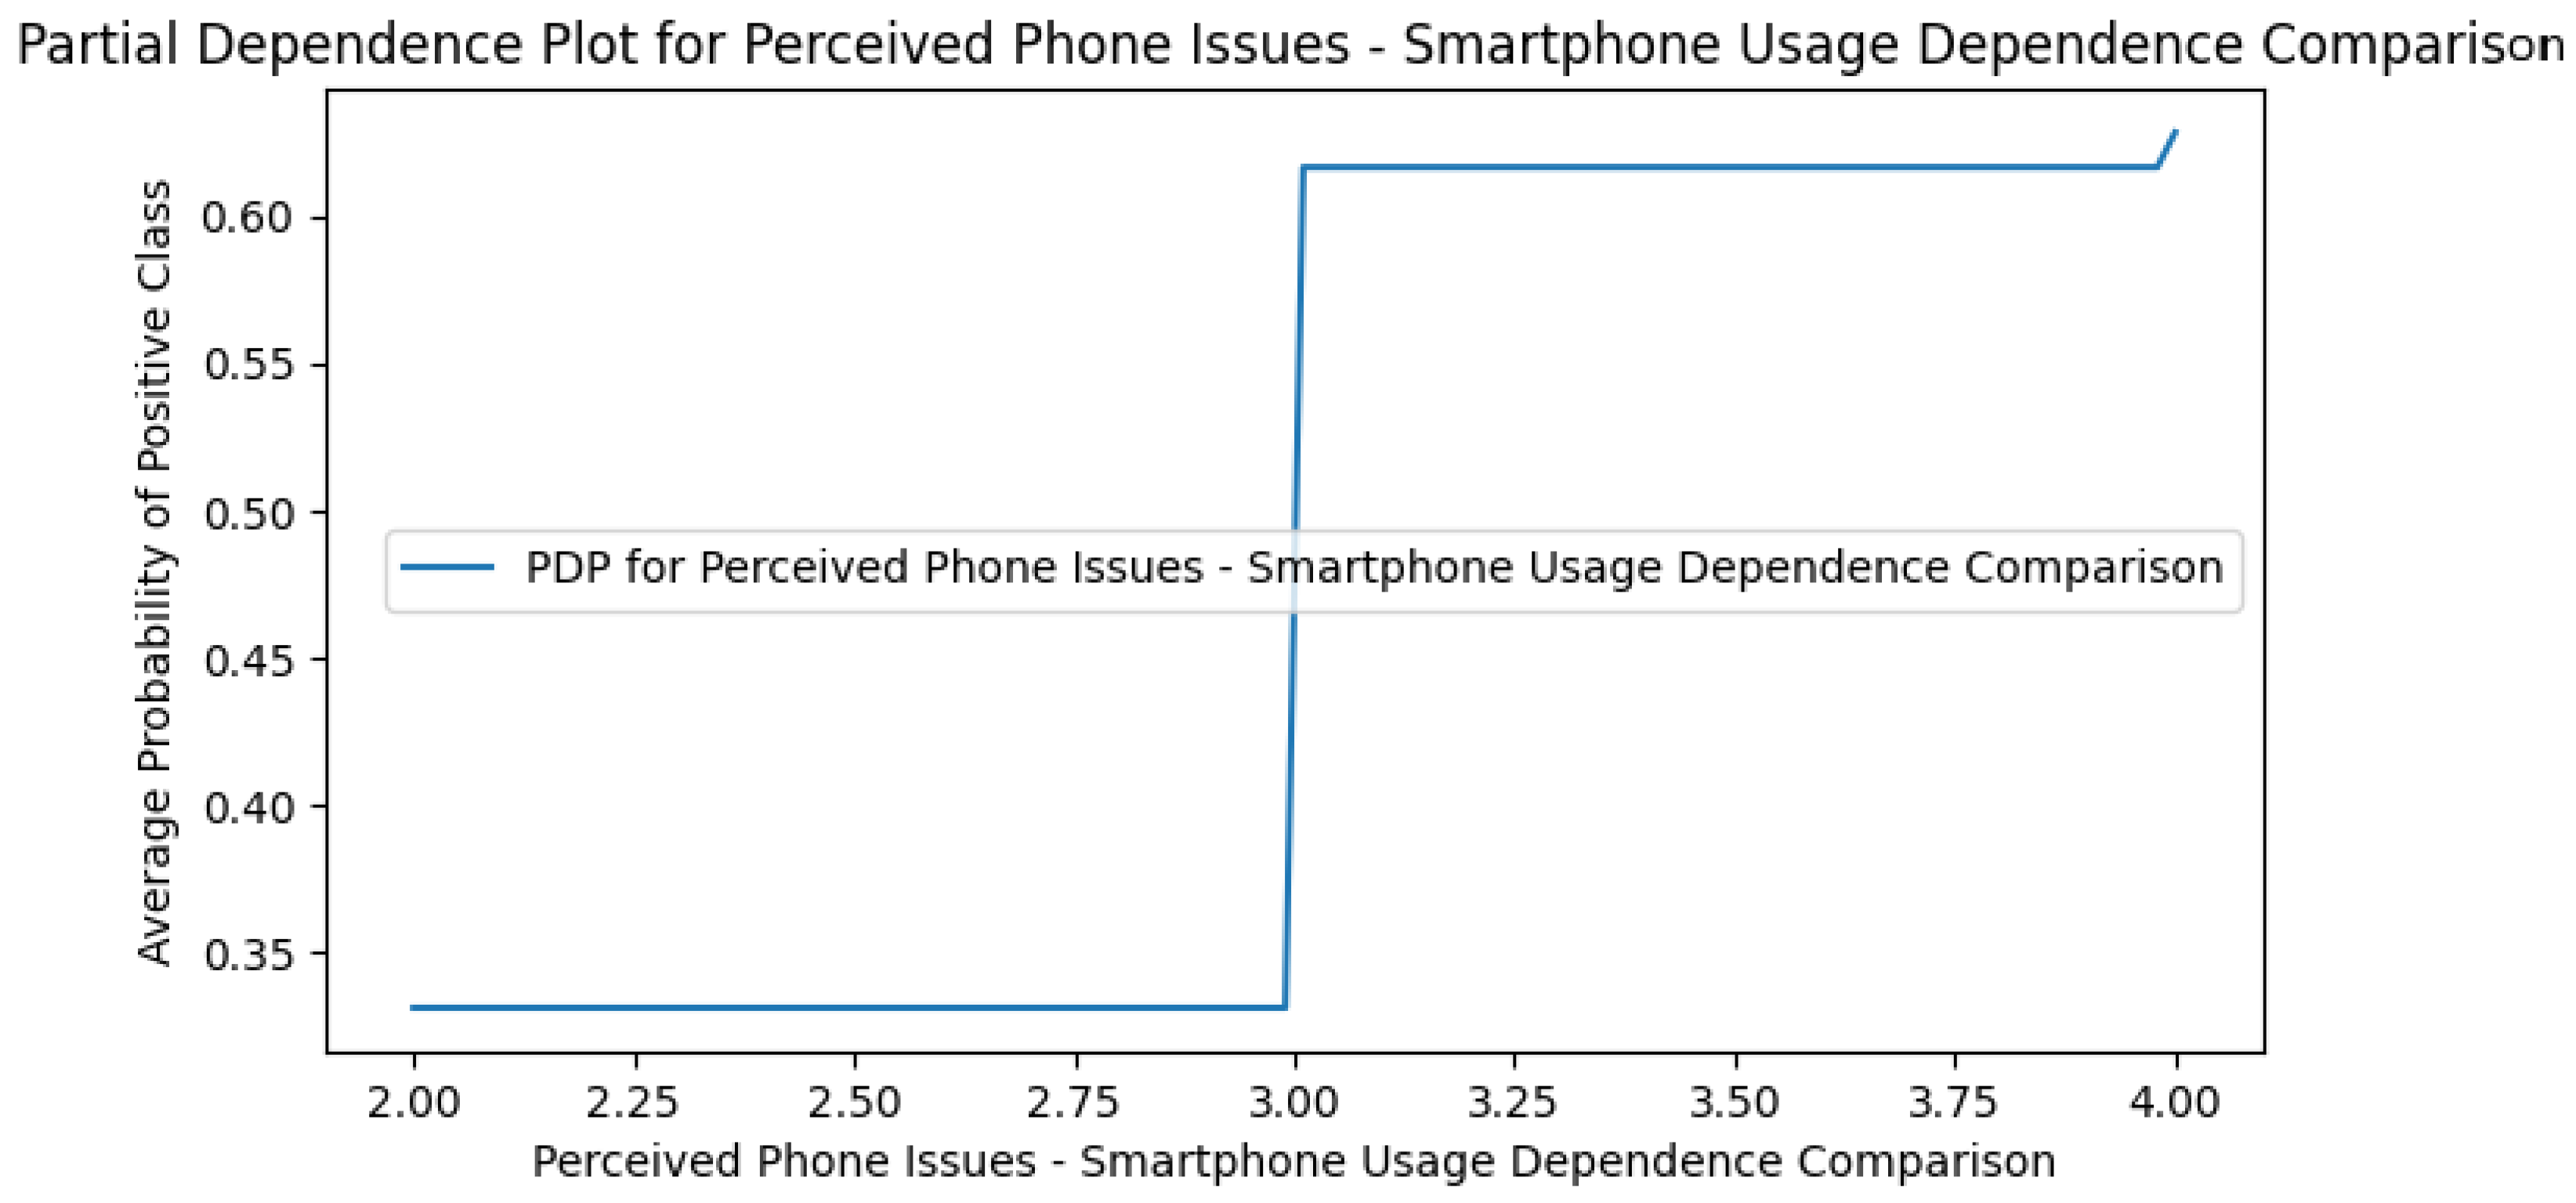
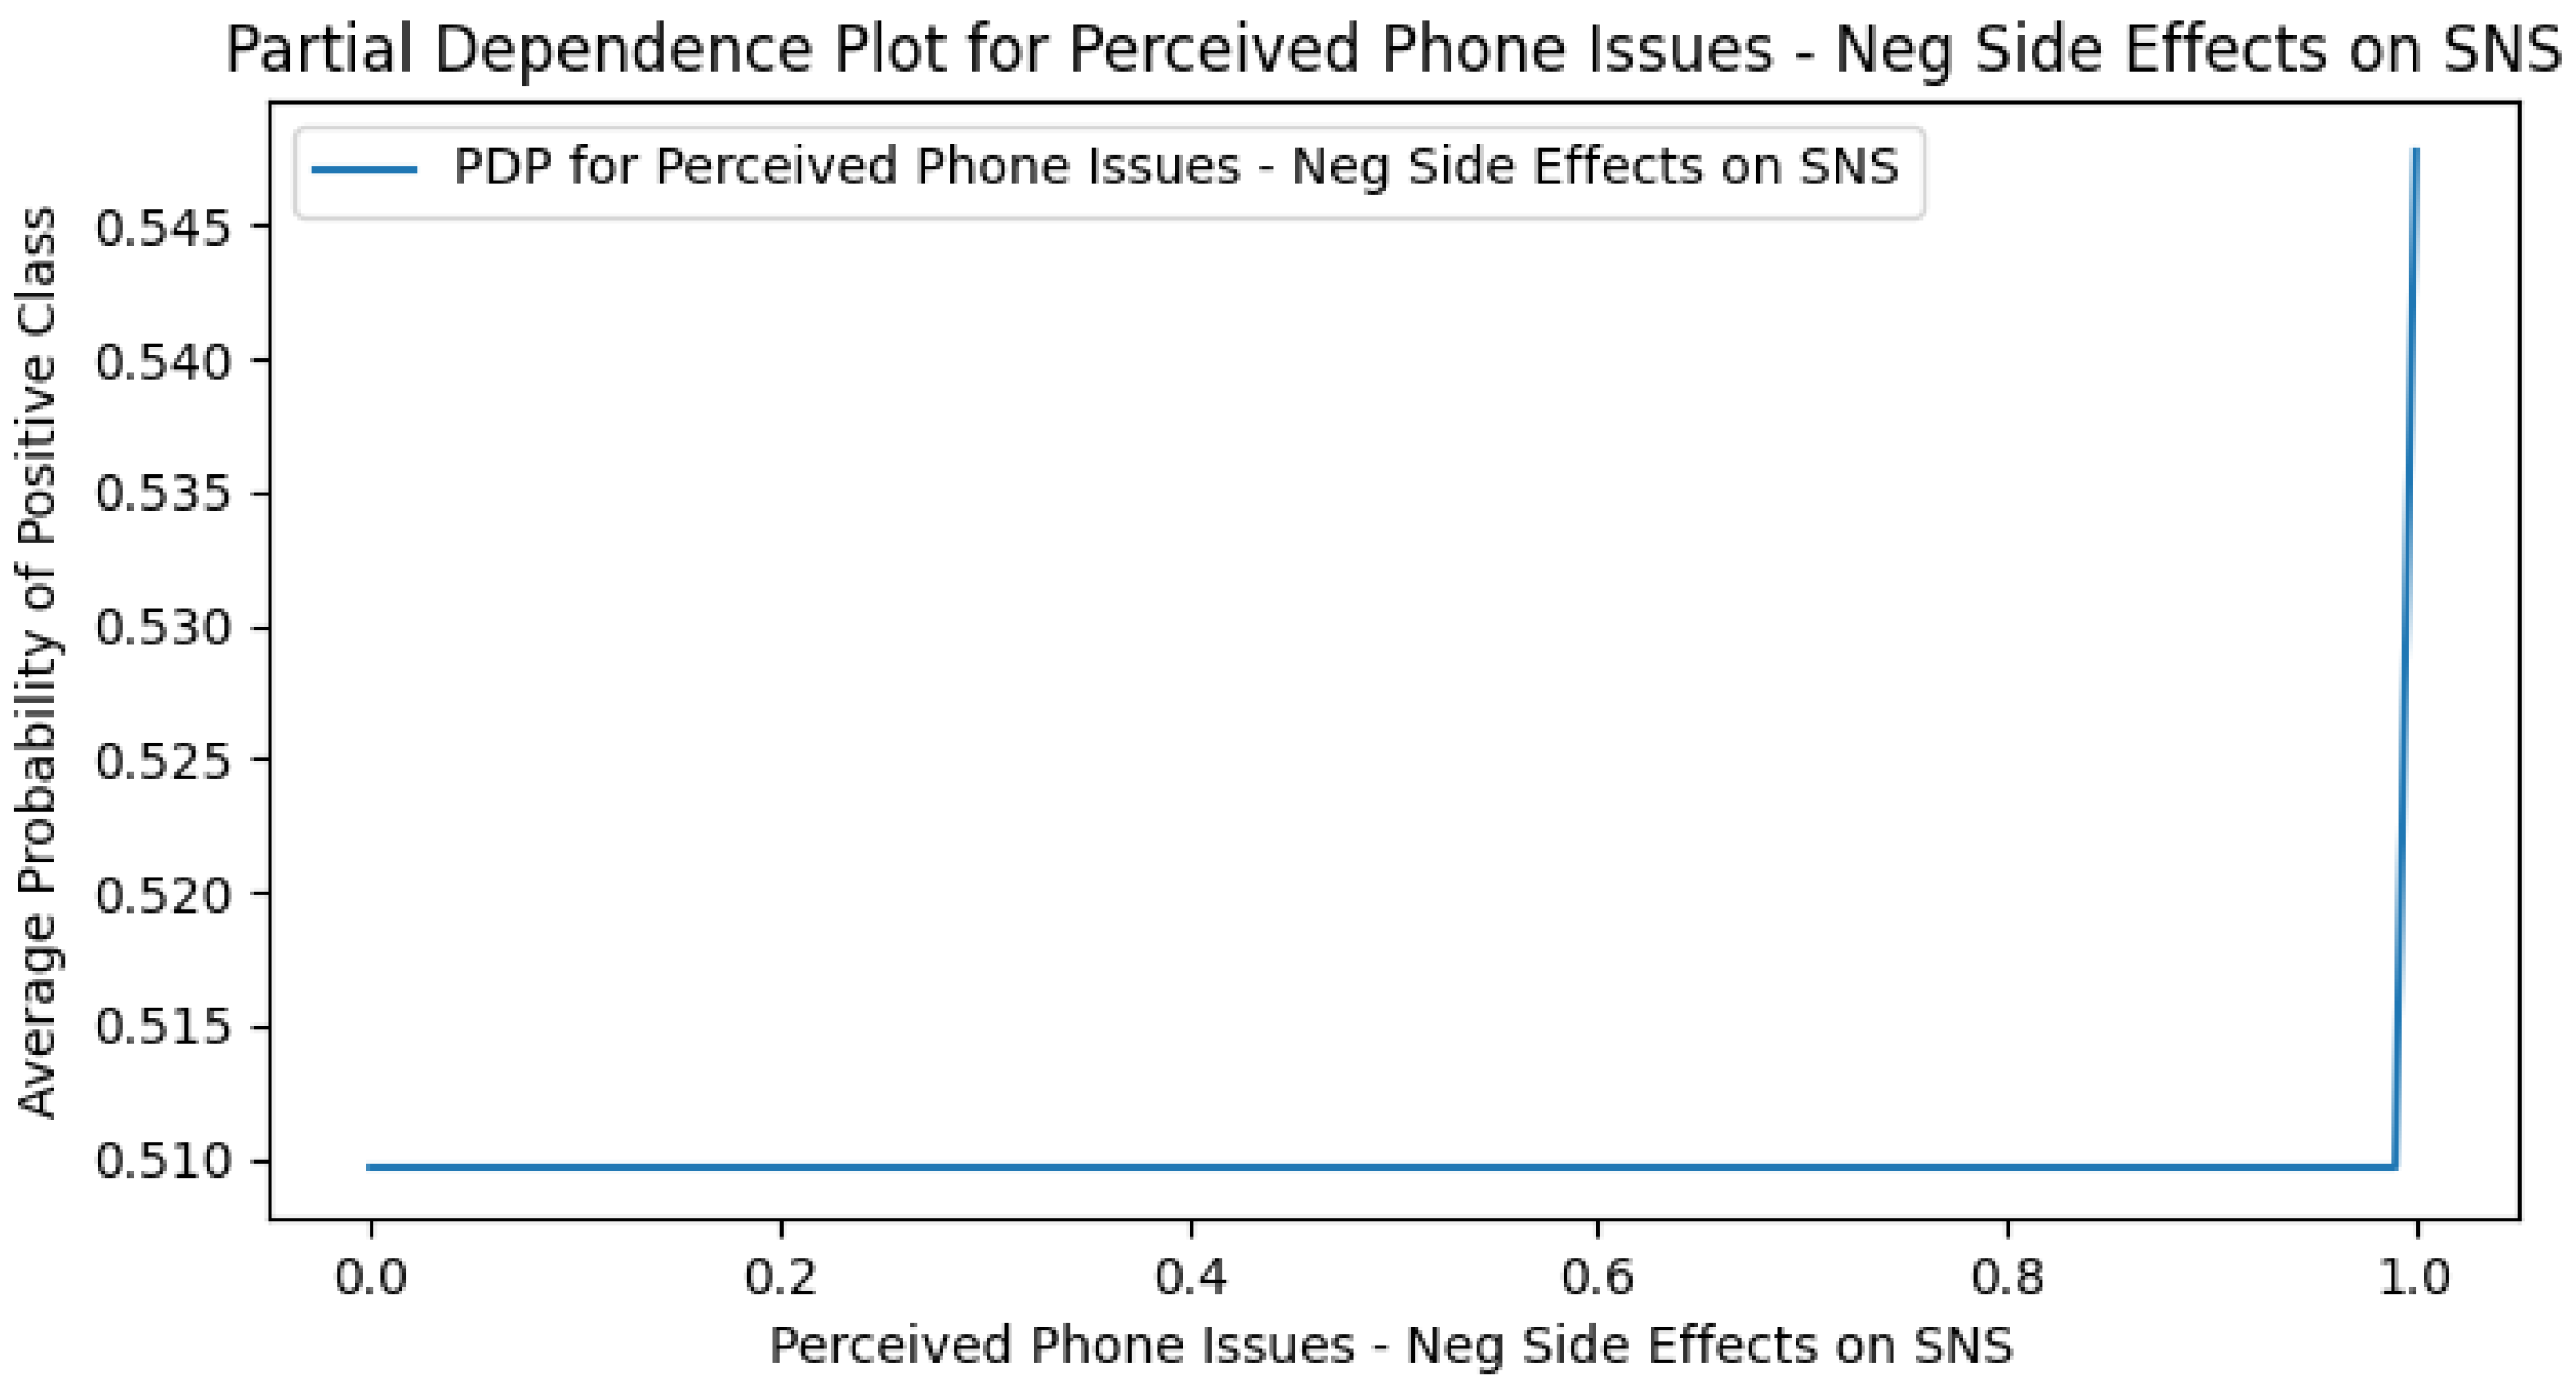
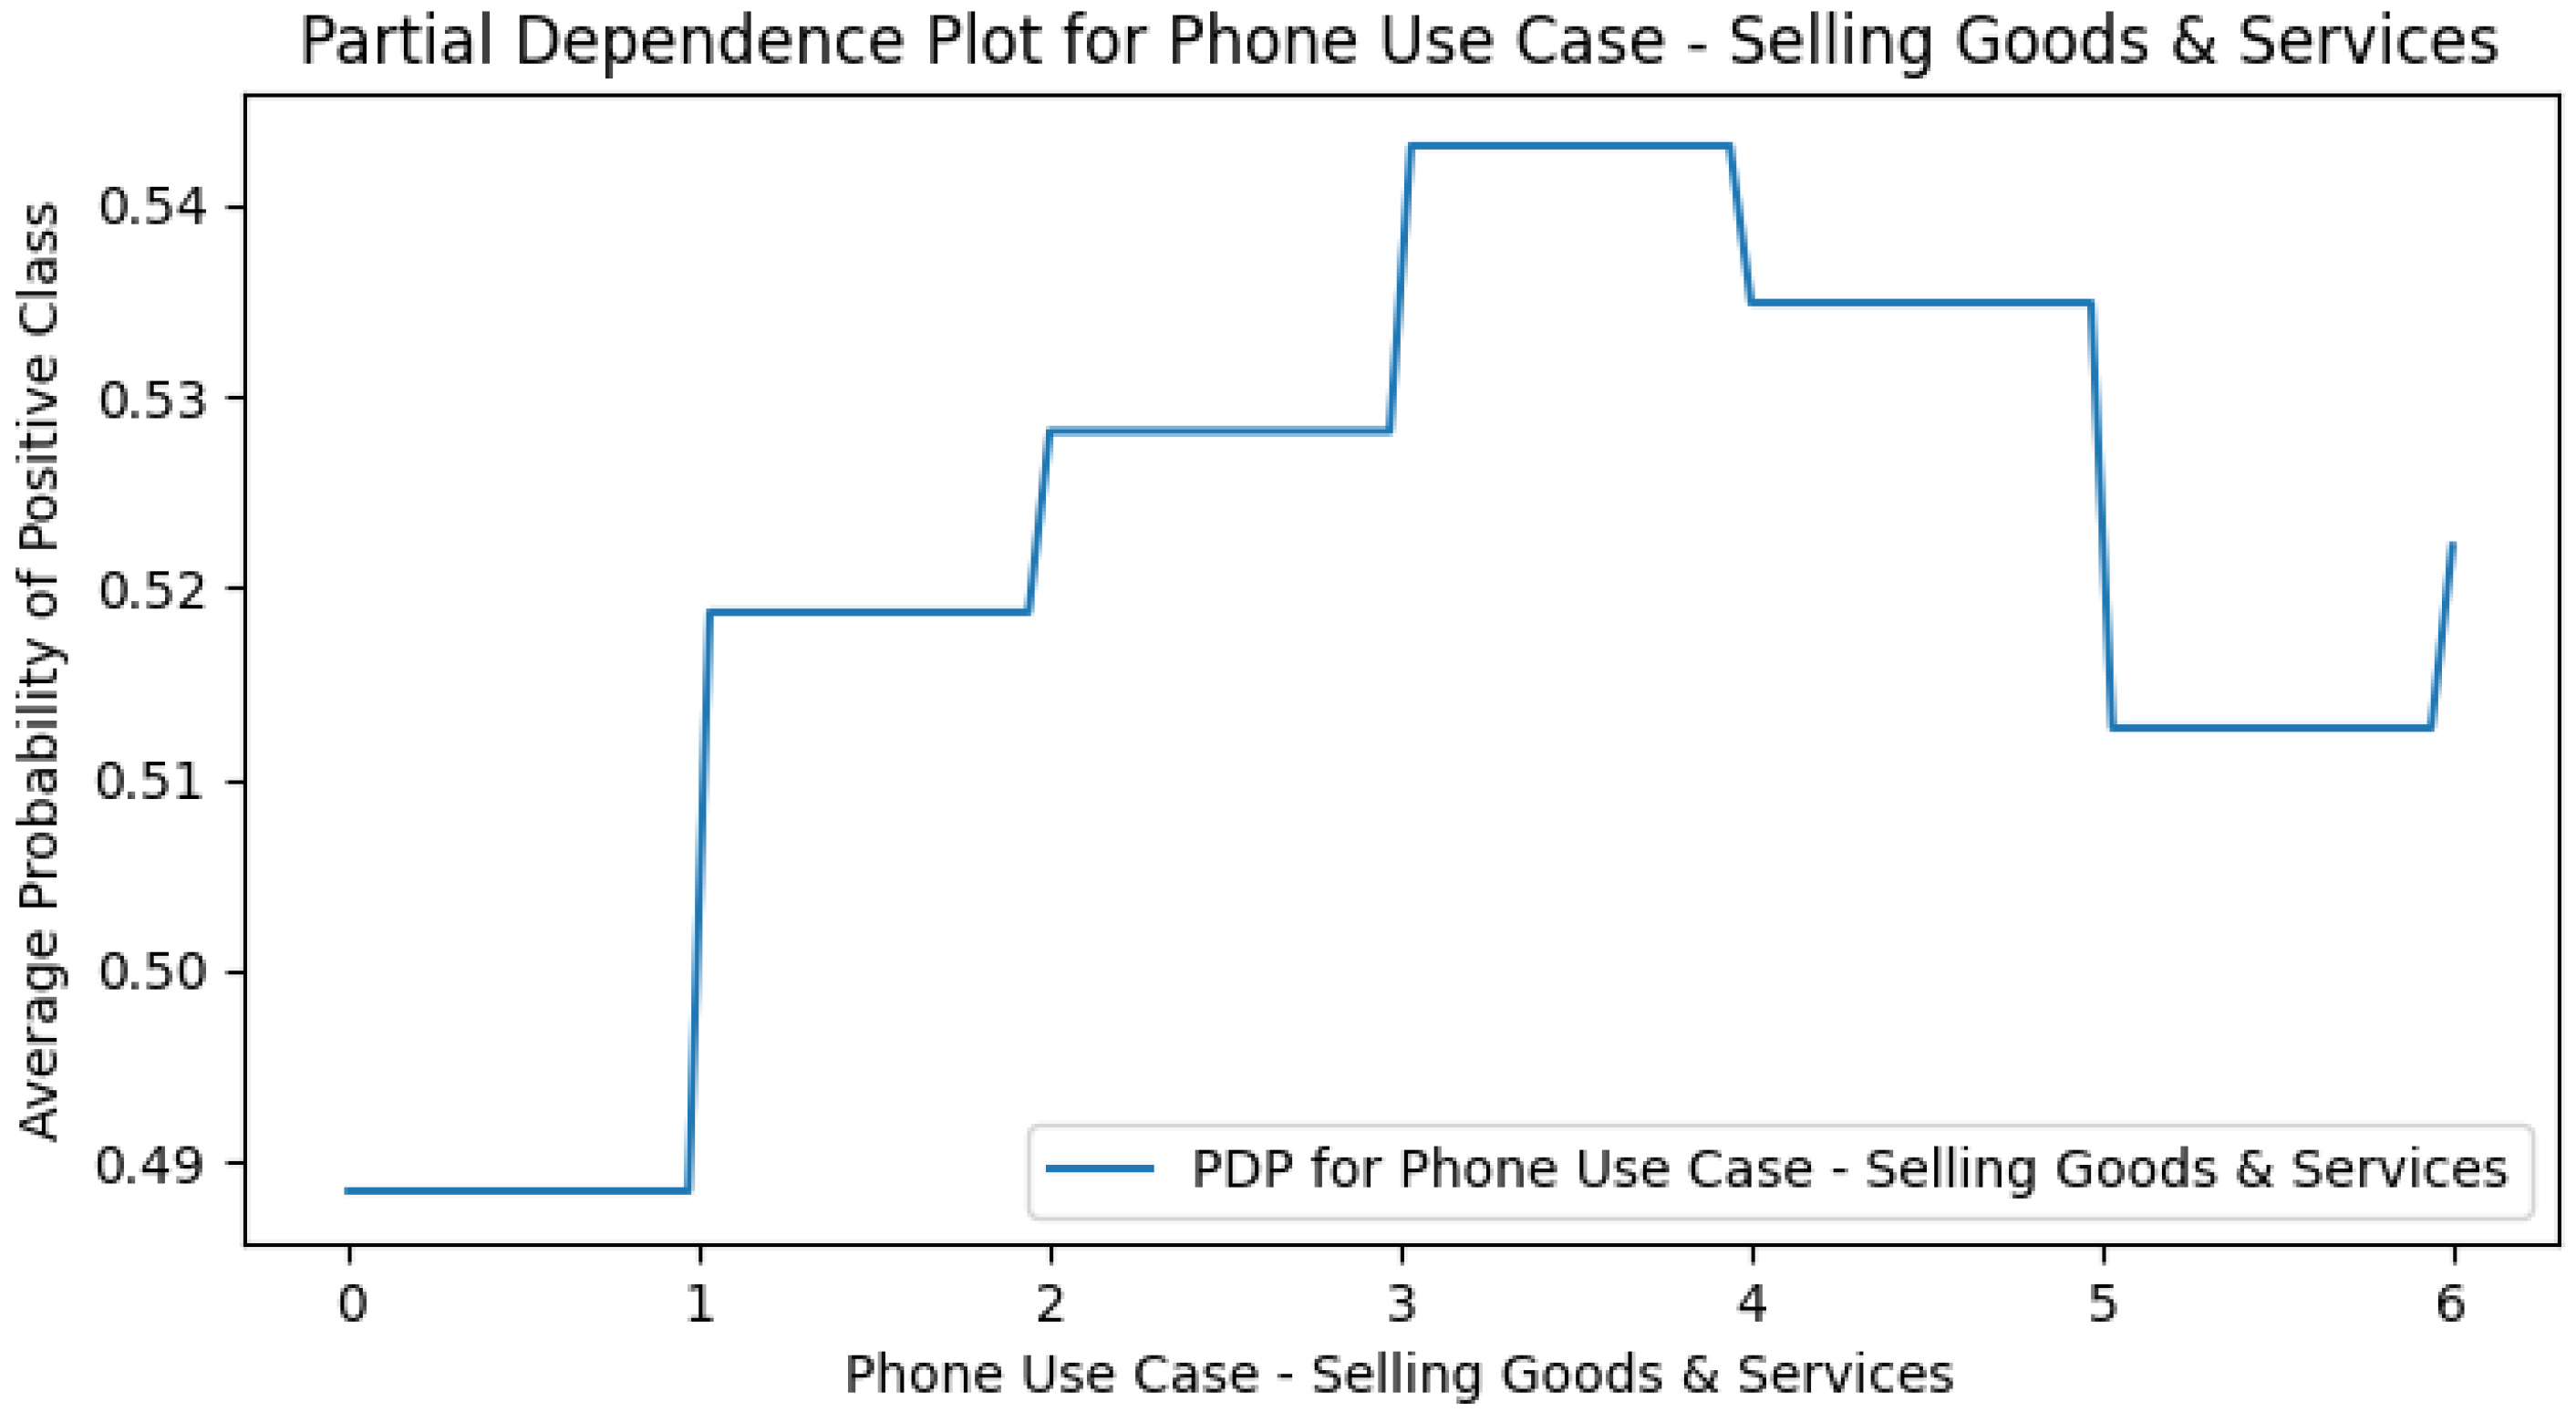
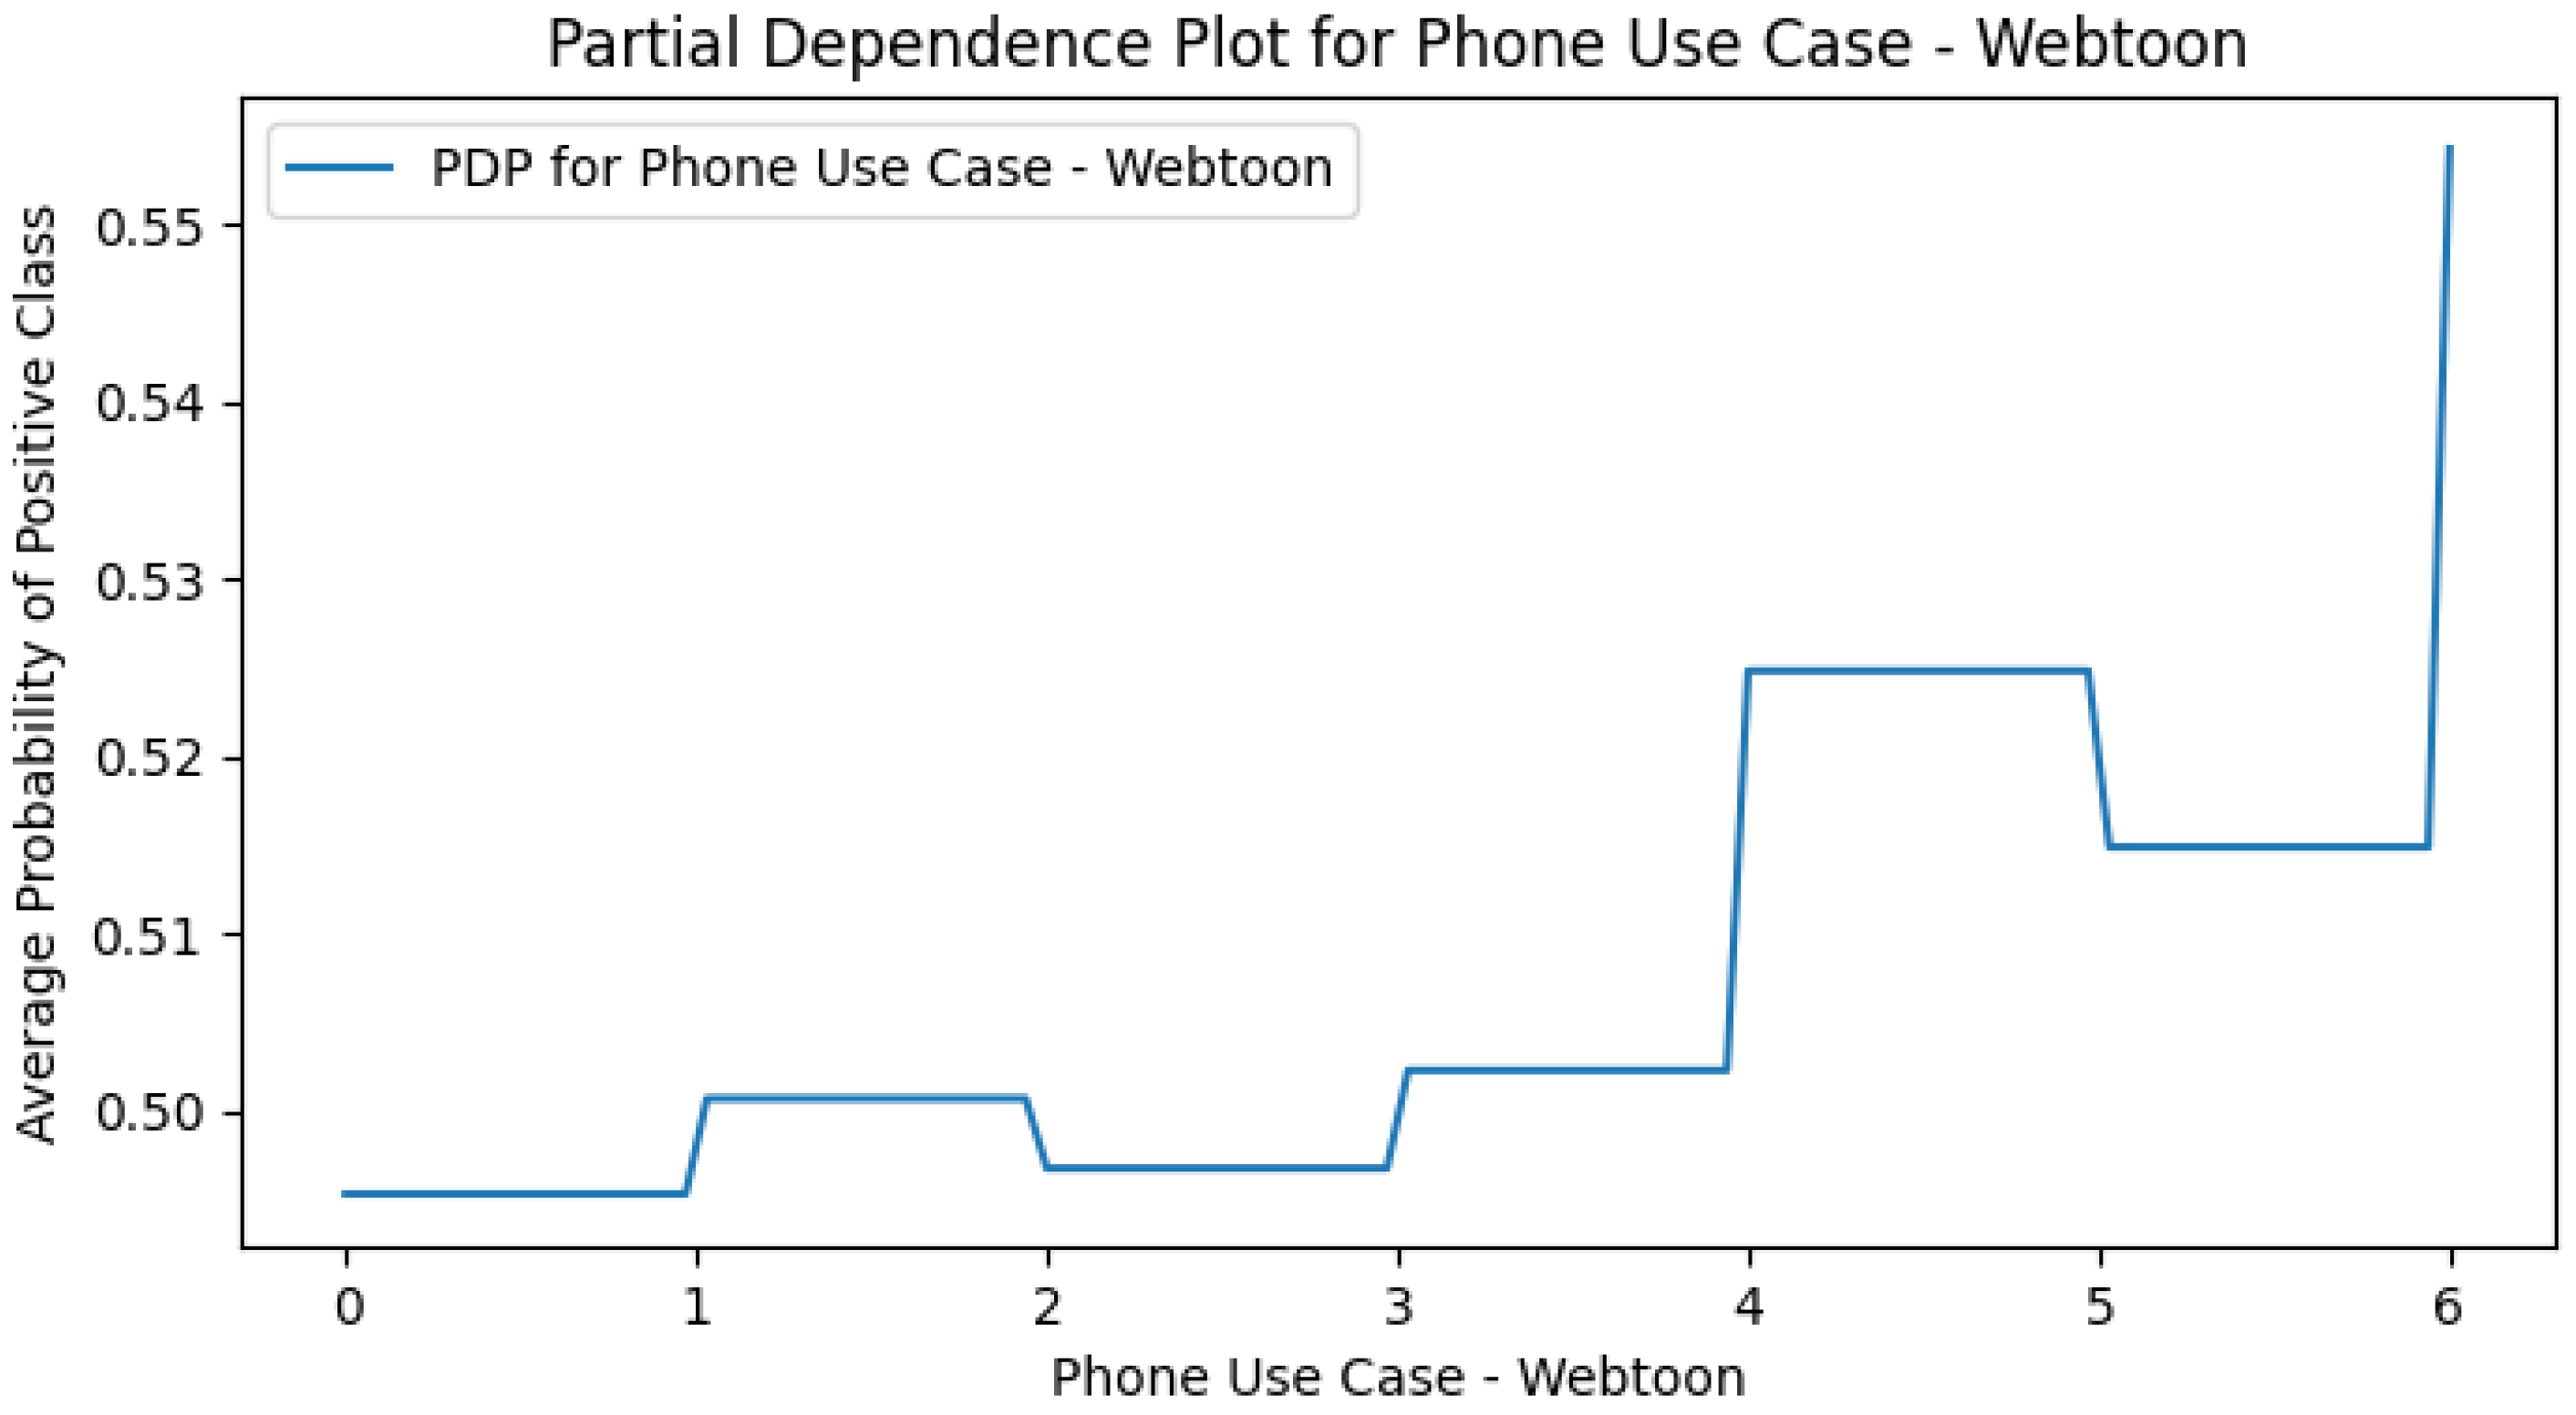
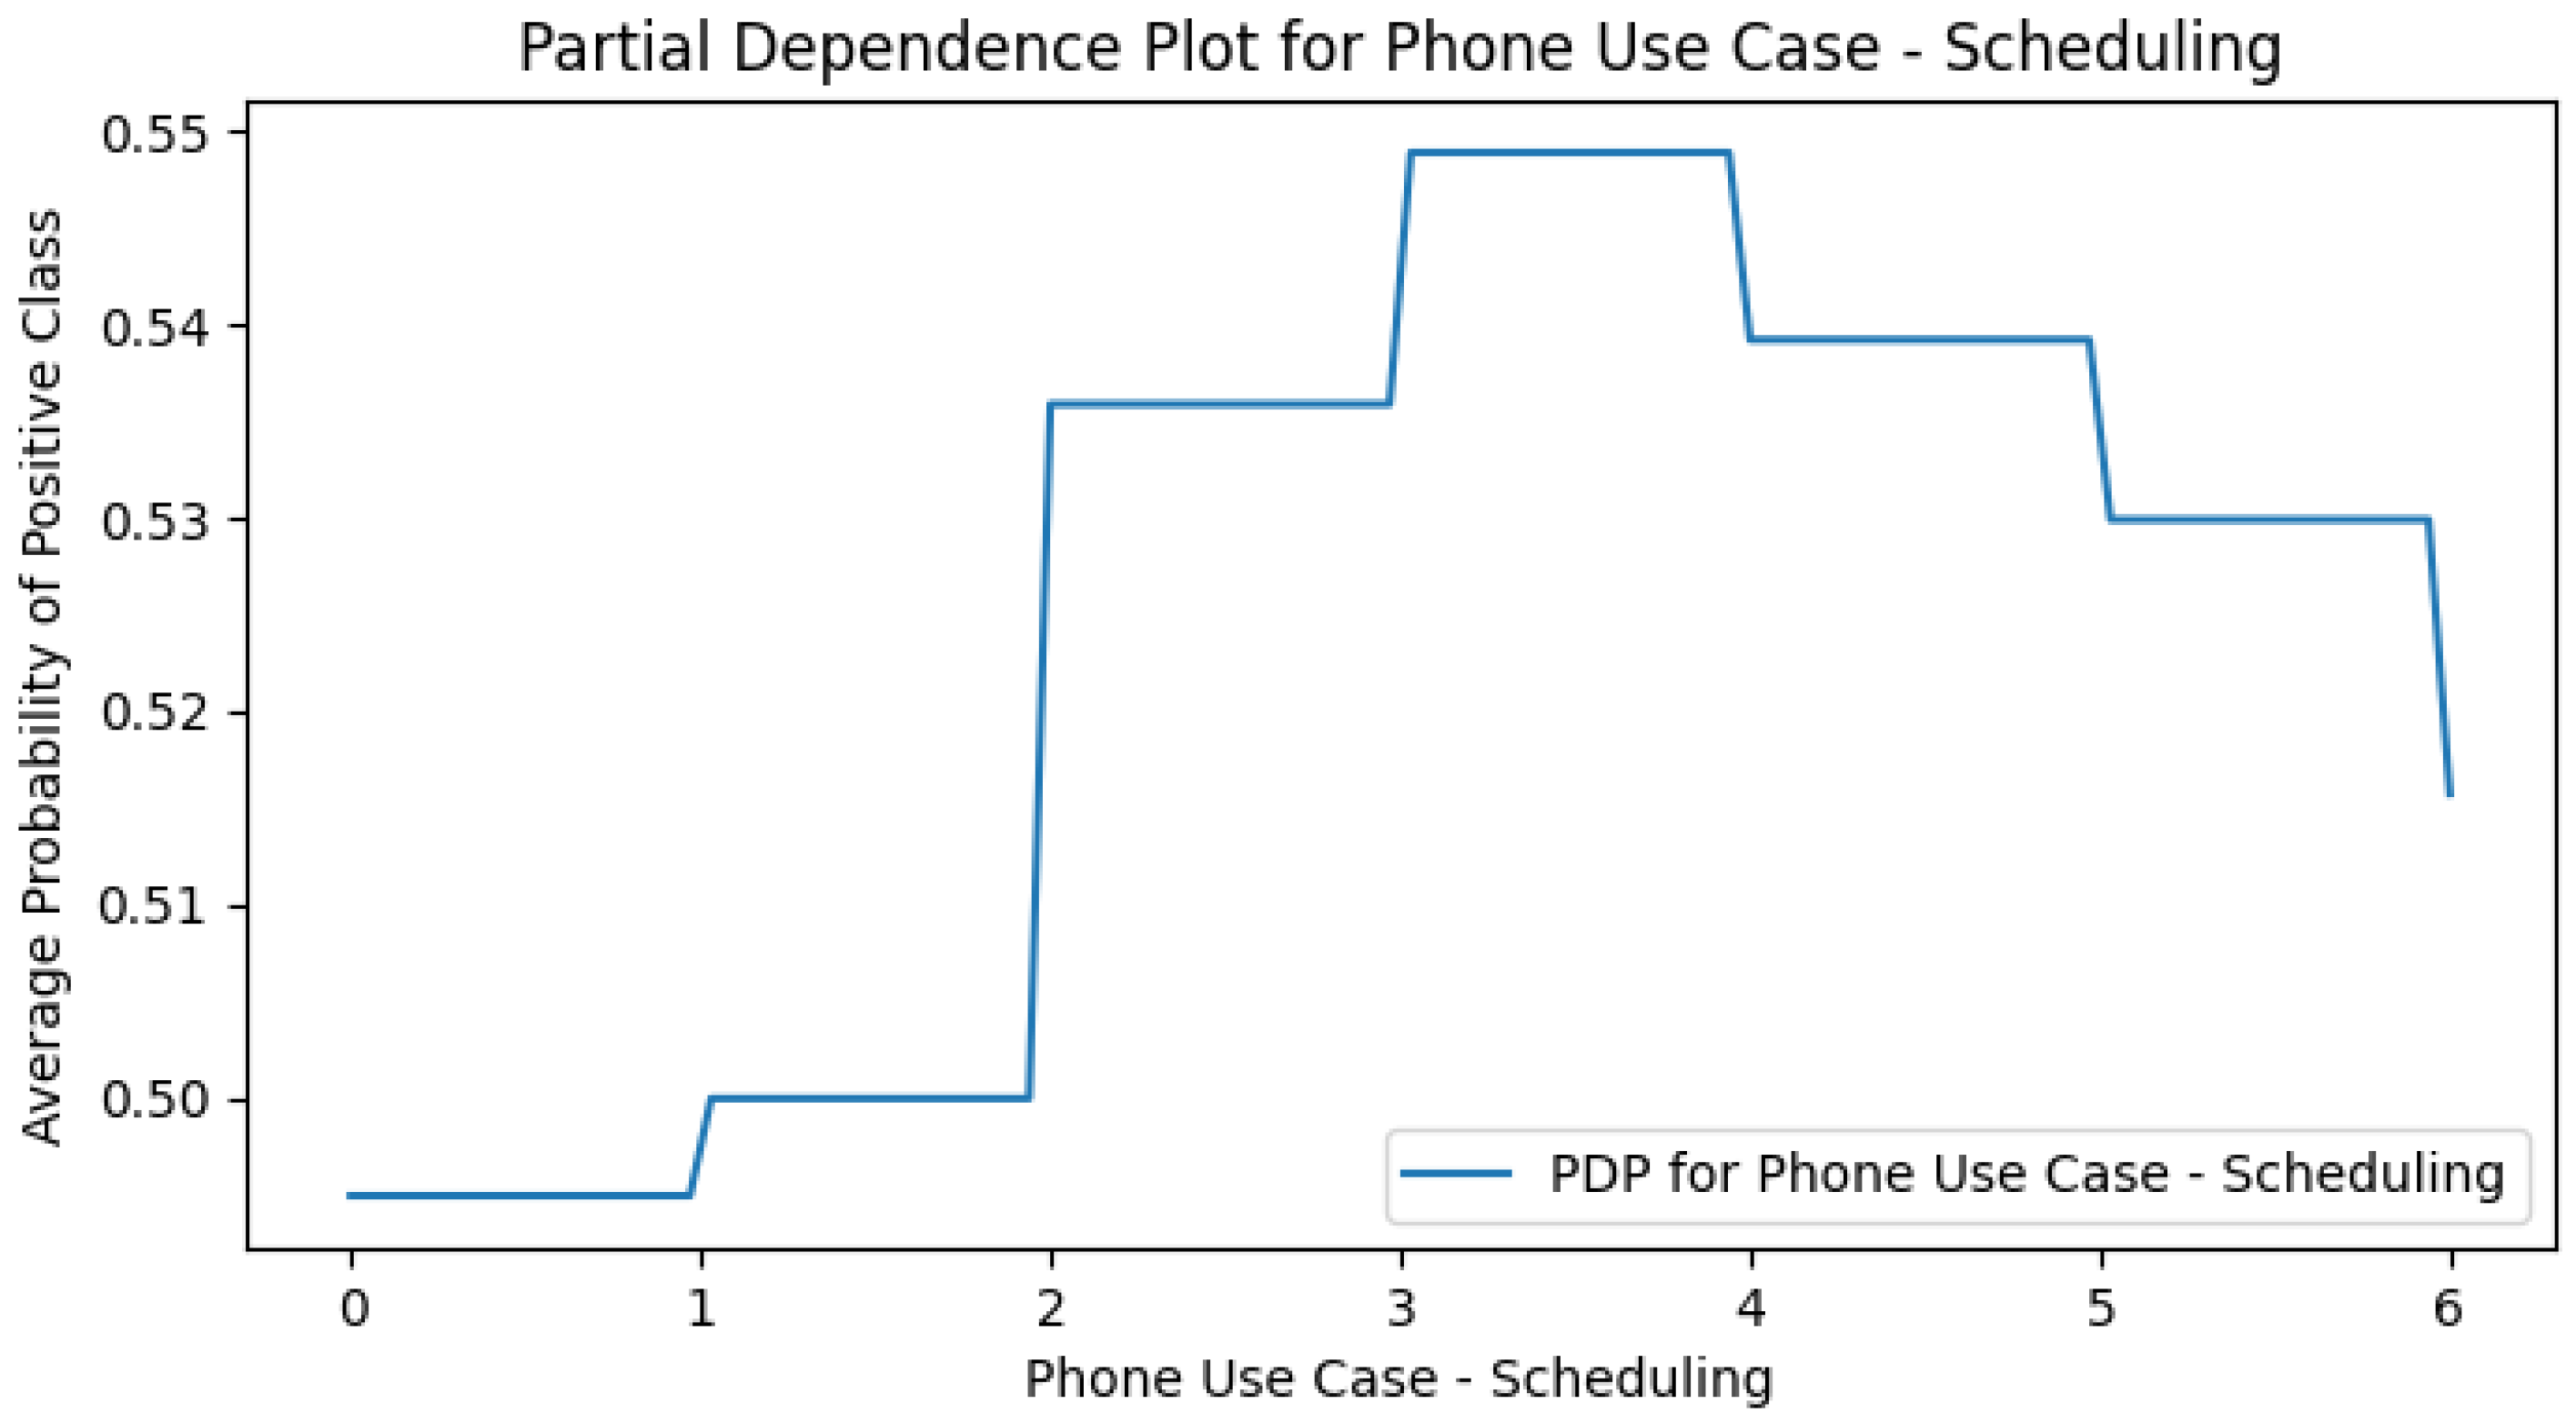
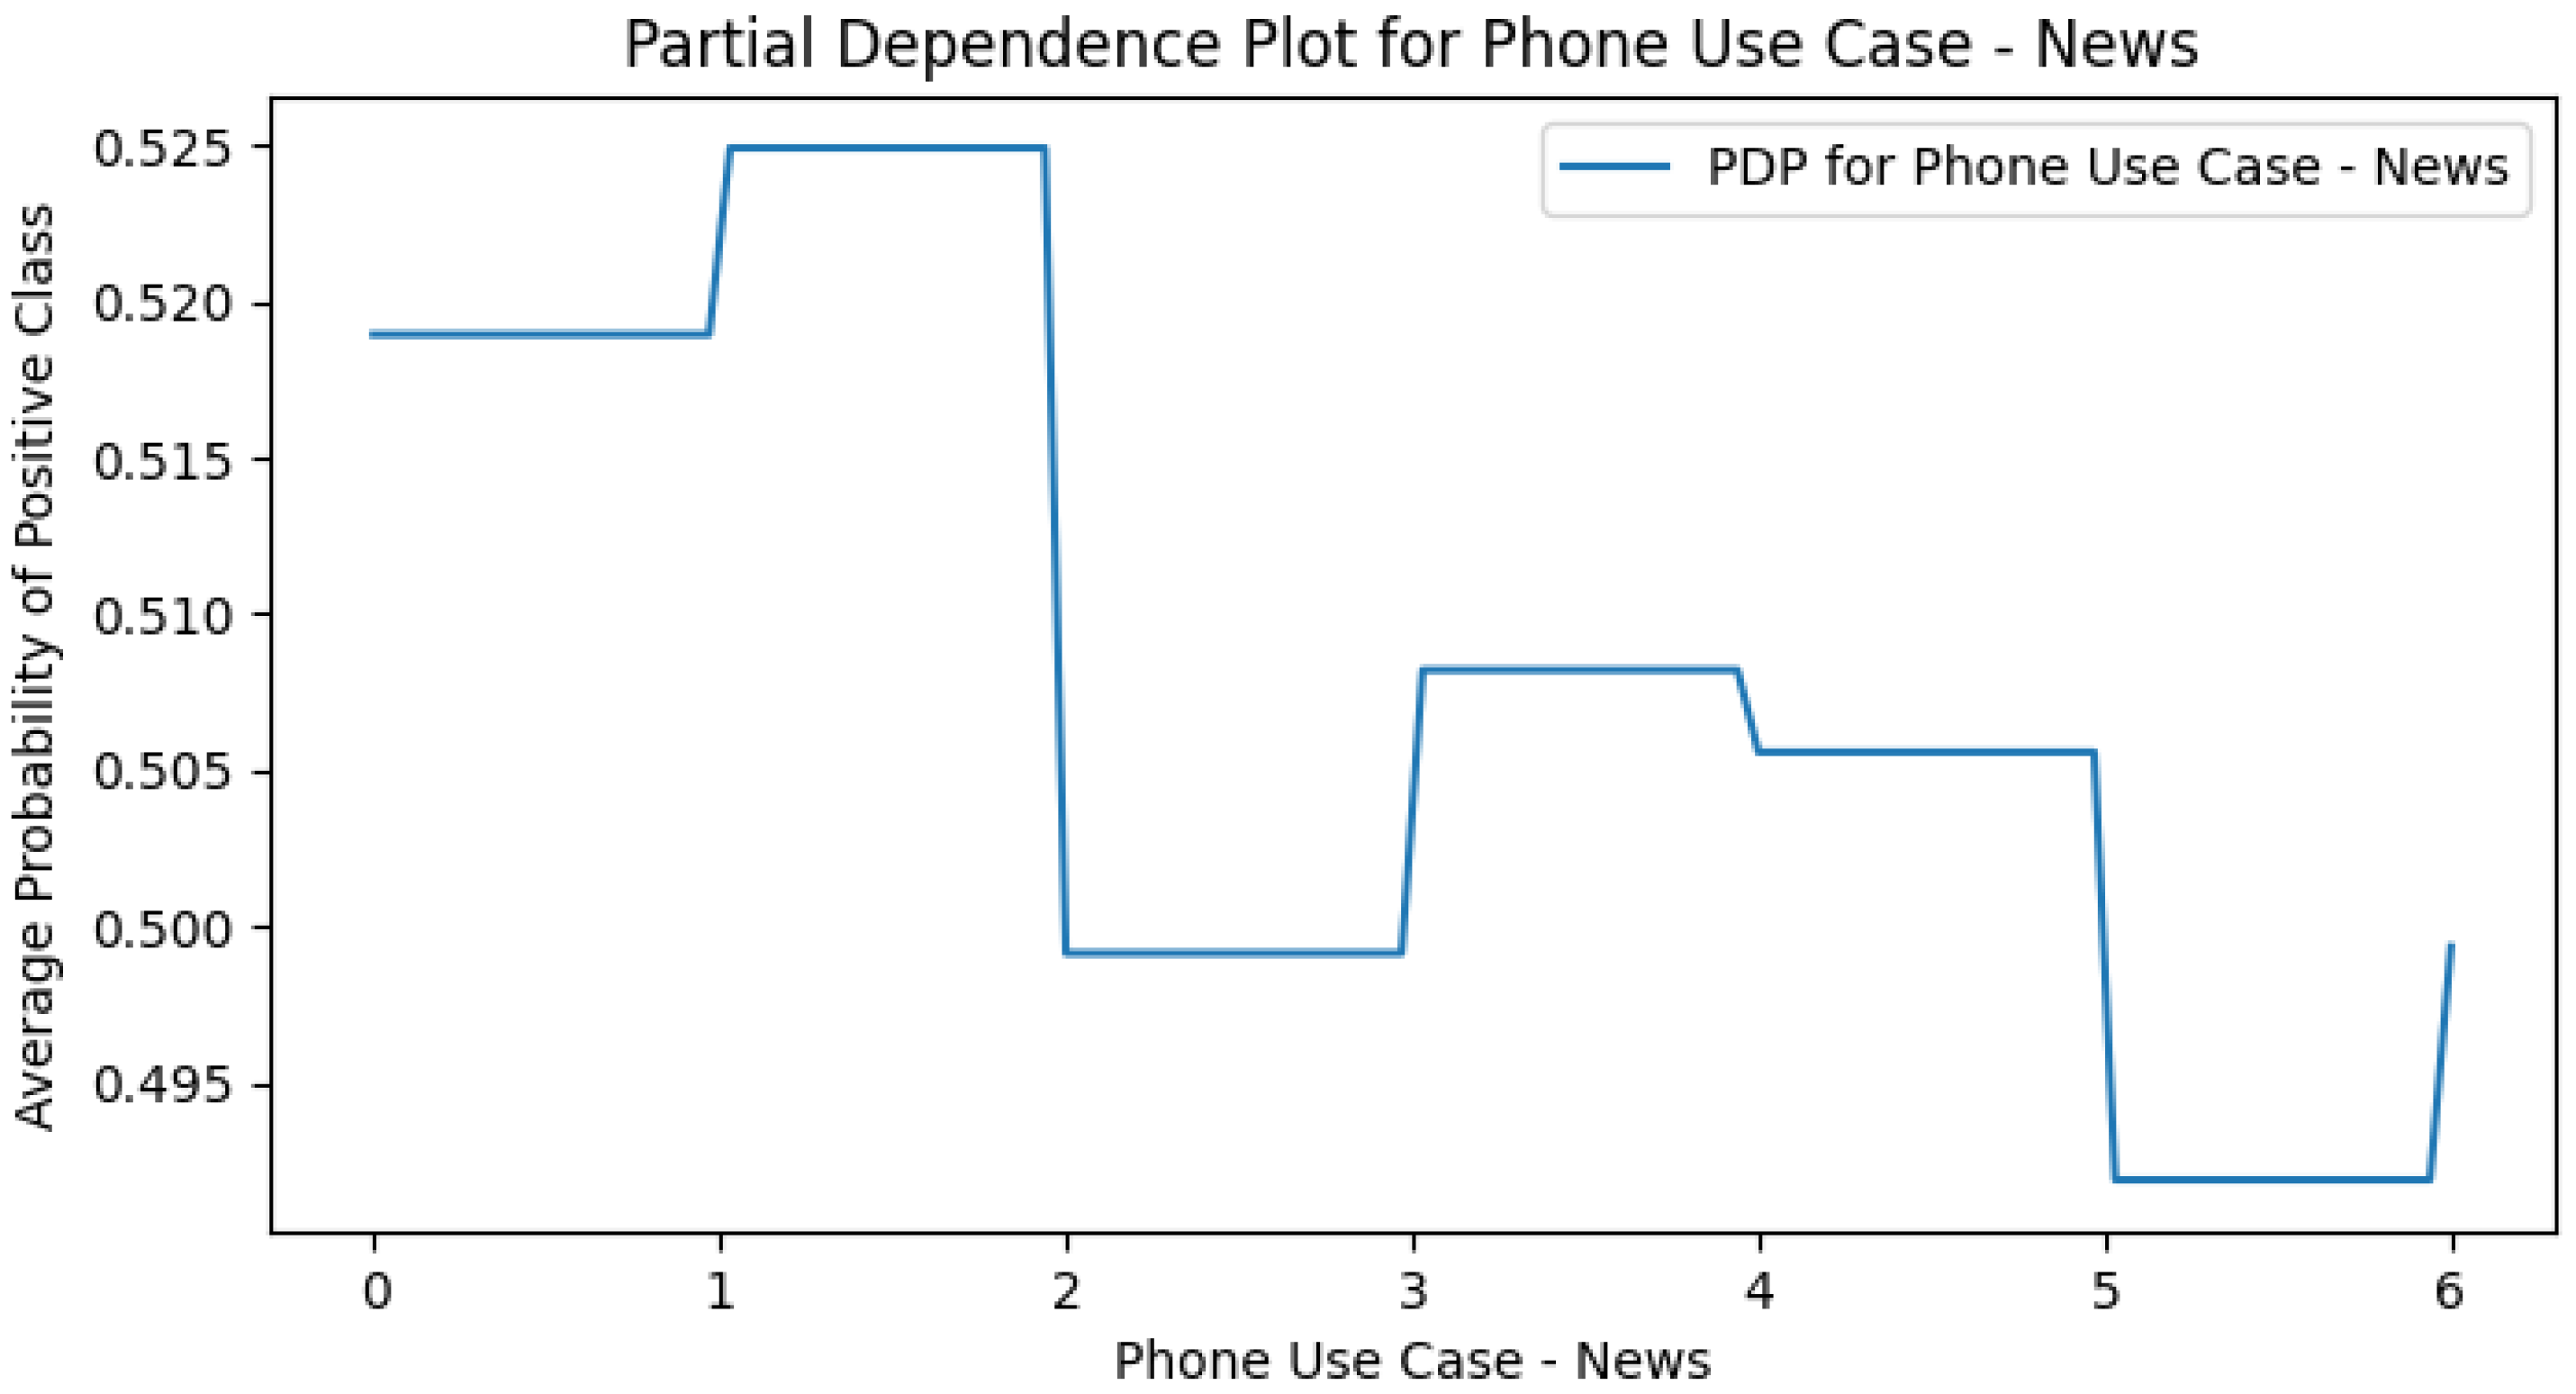
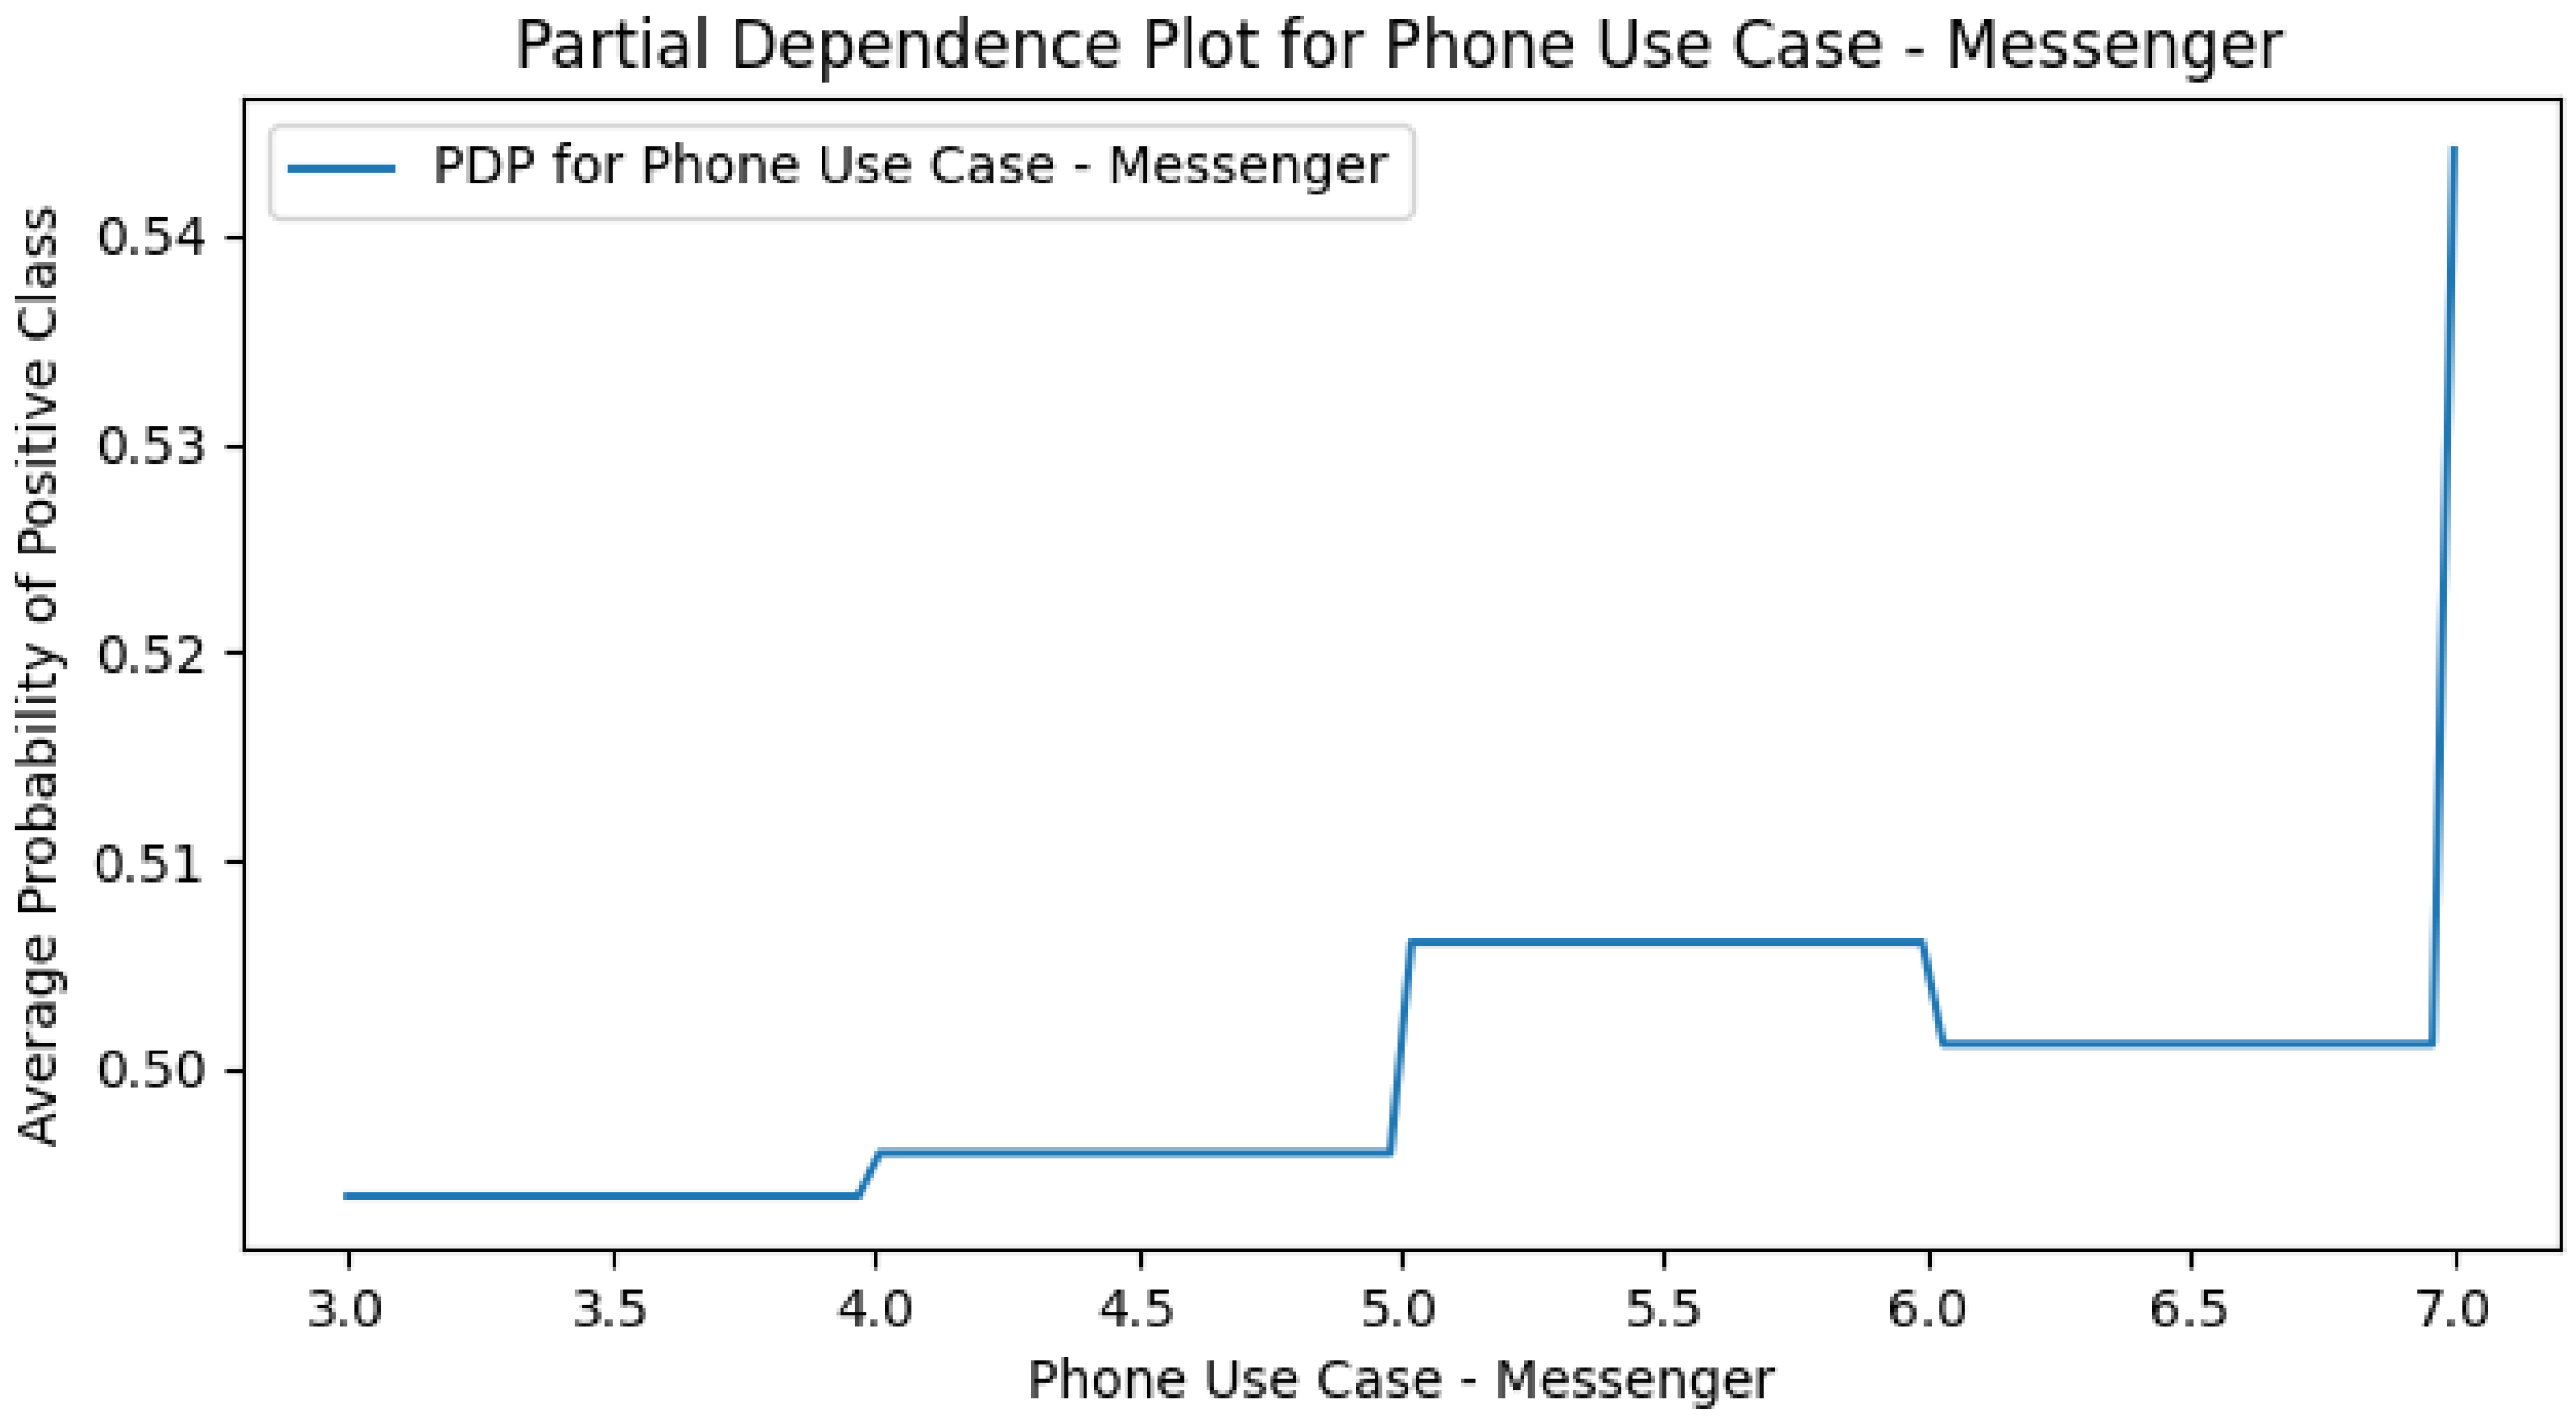
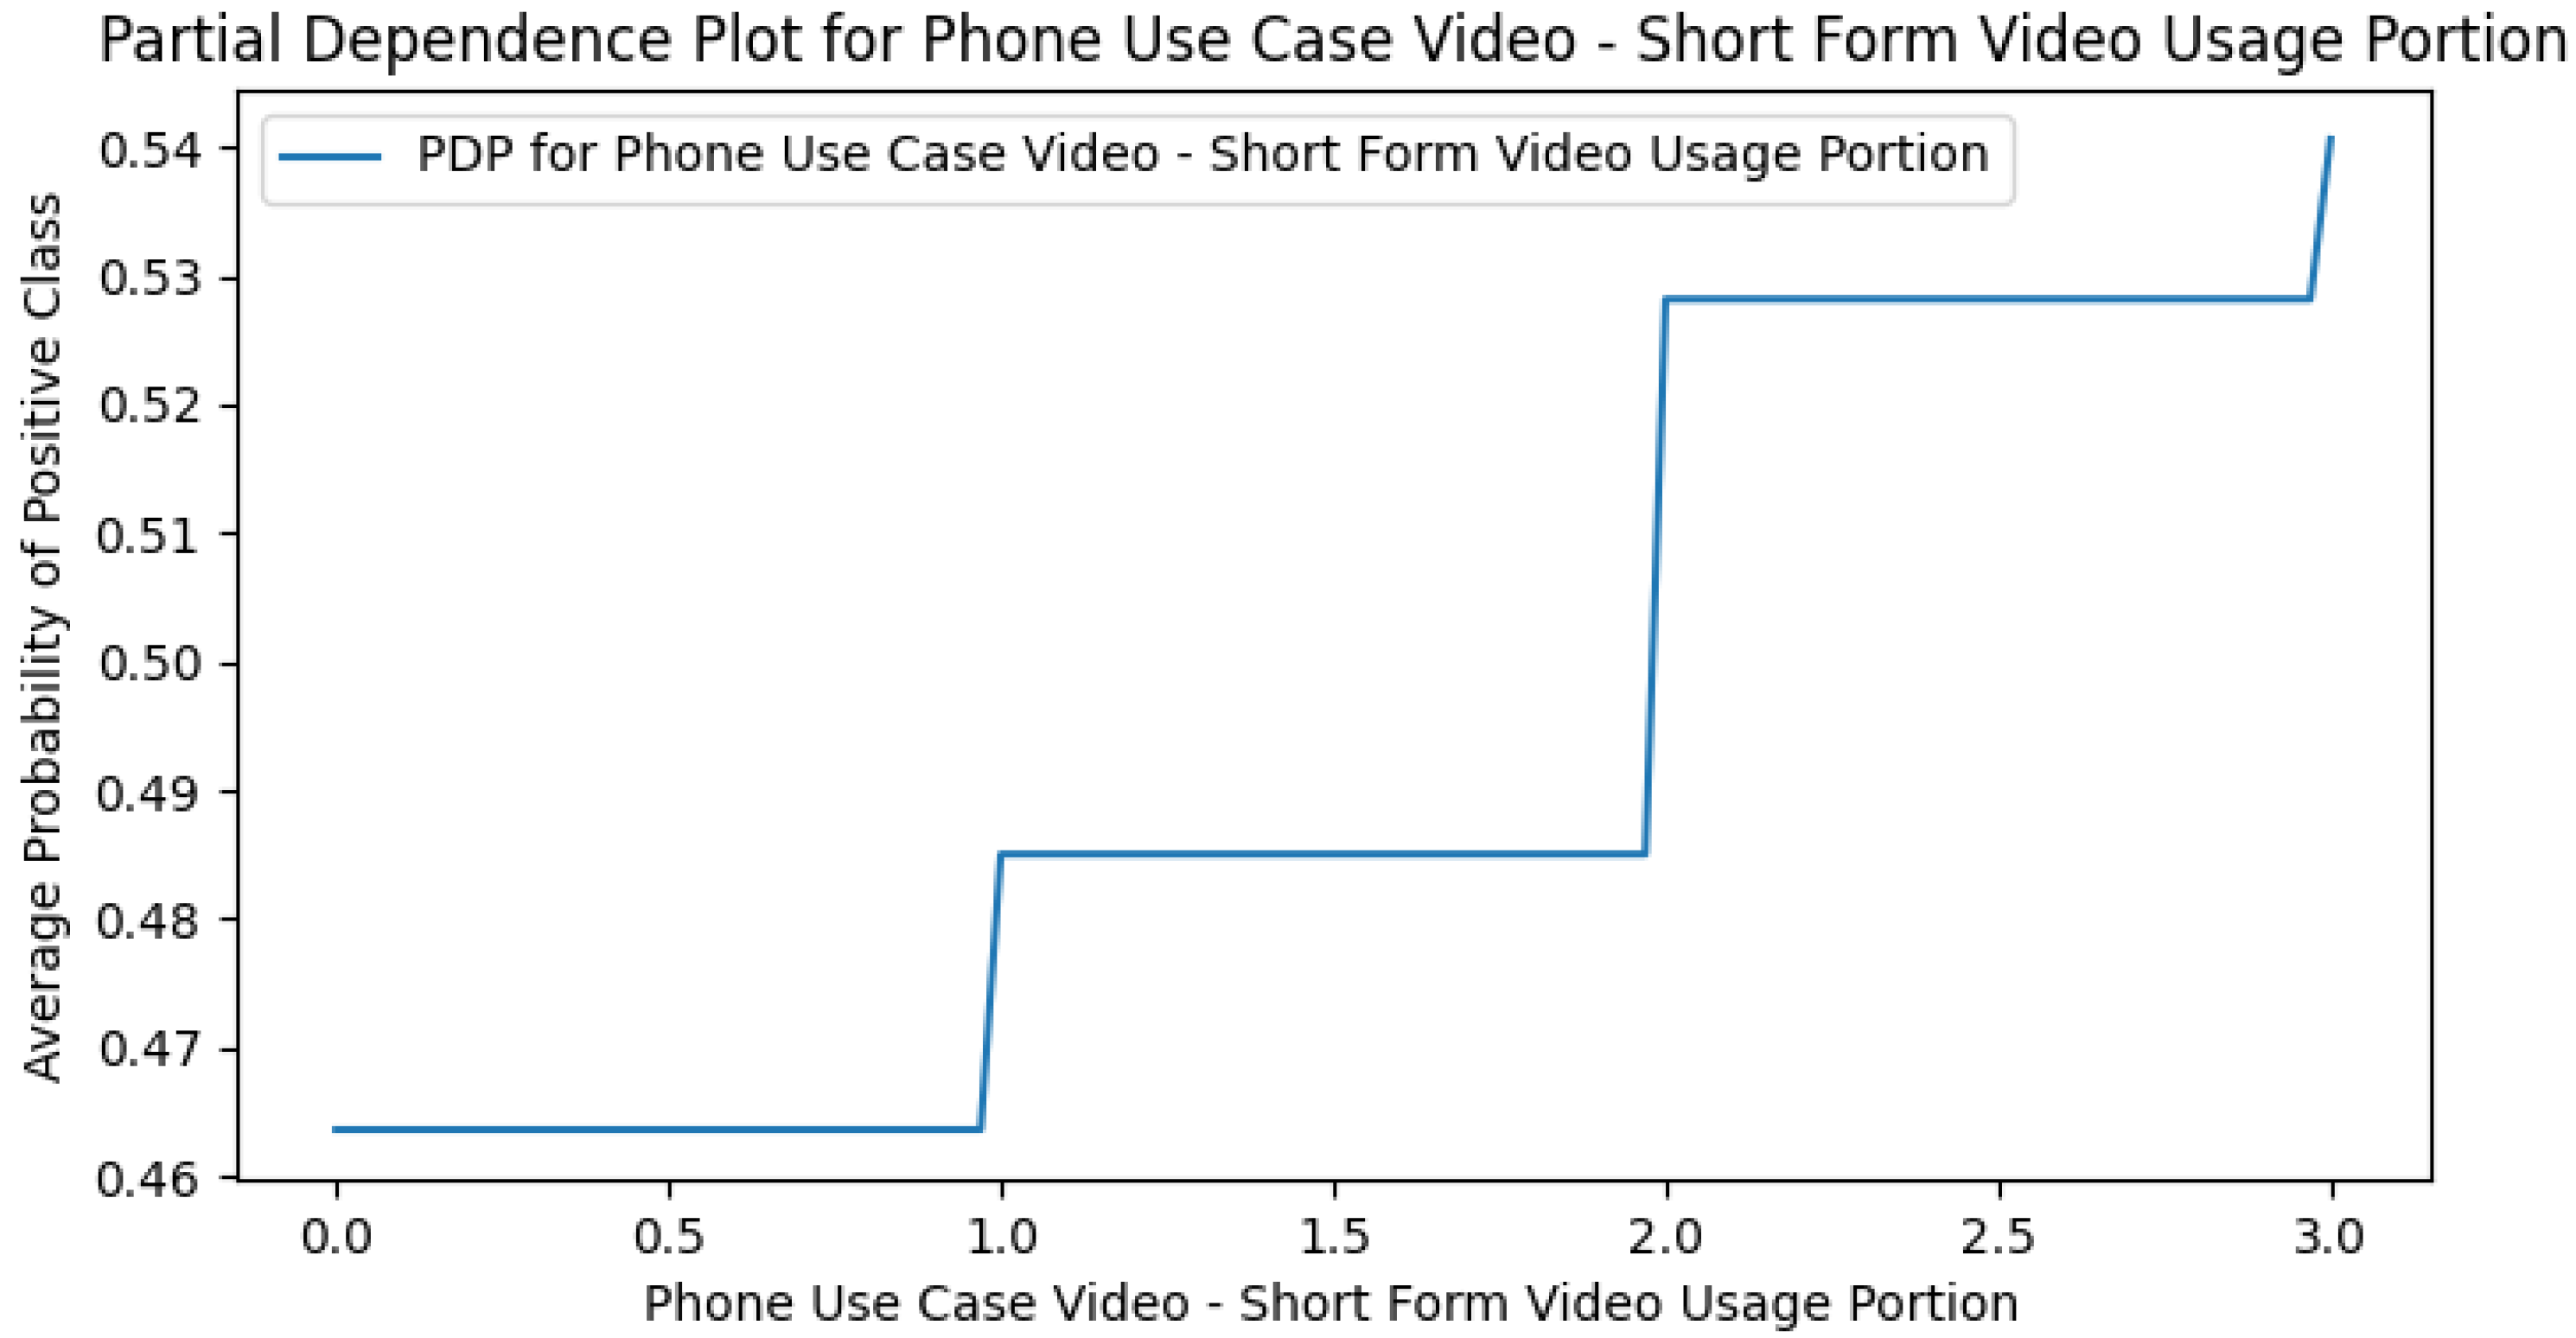
Appendix H. Use Case Only PDPs

References
- Statista. Ownership Rate of Smartphones in South Korea as of September 2022, by Age Group. 2022. Available online: https://www.statista.com/statistics/897195/south-korea-smartphone-ownership-by-age-group/ (accessed on 30 November 2023).
- Bae, S.R.; Lee, C.H.; Kim, N.D. A Study on the Status of Media Use Among Adolescents and Policy Responses by Target Group II: 648 Teenagers; Technical report; National Youth Policy Institute: Sejong, Republic of Korea, 2021. [Google Scholar]
- Oh, J.; Kim, M.; Rhee, S.Y.; Rahmati, M.; Koyanagi, A.; Smith, L.; Kim, M.S.; Fond, G.; Boyer, L.; Kim, S.; et al. National trends in the prevalence of screen time and its association with biopsychosocial risk factors among Korean adolescents, 2008–2021. J. Adolesc. Health 2024, 74, 504–513. [Google Scholar] [CrossRef] [PubMed]
- Billieux, J.; Maurage, P.; Lopez-Fernandez, O.; Kuss, D.J.; Griffiths, M.D. Can disordered mobile phone use be considered a behavioral addiction? An update on current evidence and a comprehensive model for future research. Curr. Addict. Rep. 2015, 2, 156–162. [Google Scholar] [CrossRef]
- Panova, T.; Carbonell, X. Is smartphone addiction really an addiction? J. Behav. Addict. 2018, 7, 252–259. [Google Scholar] [CrossRef]
- World Health Organization. International Classification of Diseases, 11th ed.; World Health Organization: Geneva, Switzerland, 2019. [Google Scholar]
- National Information Society Agency. 2020 Survey on Smartphone Overdependence; Research Report NIA VIII-RSE-C-19067; National Information Society Agency: Seoul, Republic of Korea, 2020.
- Noh, D.; Shim, M.S. Factors influencing smartphone overdependence among adolescents. Sci. Rep. 2024, 14, 7725. [Google Scholar] [CrossRef]
- Cho, J.; Kim, H. The role of impulsivity and emotional dysregulation in smartphone overdependence explored through network analysis. Sci. Rep. 2025, 15, 1852. [Google Scholar] [CrossRef]
- Elhai, J.D.; Levine, J.C.; Dvorak, R.D.; Hall, B.J. Fear of missing out, need for touch, anxiety and depression are related to problematic smartphone use. Comput. Hum. Behav. 2016, 63, 509–516. [Google Scholar] [CrossRef]
- Seo, B.K.; Hwang, Y.; Cho, H. Mental health and personality characteristics of university students at risk of smartphone overdependence. Int. J. Environ. Res. Public Health 2023, 20, 2331. [Google Scholar] [CrossRef]
- Hwang, I.W.; Choe, J.P.; Park, J.H.; Lee, J.M. Association between physical activity, sedentary behavior, satisfaction with sleep fatigue recovery and smartphone dependency among Korean adolescents: An age-and gender-matched study. Int. J. Environ. Res. Public Health 2022, 19, 16034. [Google Scholar] [CrossRef]
- Park, E.J.; Hwang, S.S.H.; Lee, M.S.; Bhang, S.Y. Food addiction and emotional eating behaviors co-occurring with problematic smartphone use in adolescents? Int. J. Environ. Res. Public Health 2022, 19, 4939. [Google Scholar] [CrossRef]
- Shinetsetseg, O.; Jung, Y.H.; Park, Y.S.; Park, E.C.; Jang, S.Y. Association between smartphone addiction and suicide. Int. J. Environ. Res. Public Health 2022, 19, 11600. [Google Scholar] [CrossRef]
- Bae, S.M. Influence of smartphone usage types and excessive expectation for smartphone on adolescents’ smartphone overdependence. Informatiz. Policy 2018, 25, 65–83. [Google Scholar]
- Cha, J.H.; Choi, Y.J.; Ryu, S.; Moon, J.H. Association between smartphone usage and health outcomes of adolescents: A propensity analysis using the Korea Youth Risk Behavior Survey. PLoS ONE 2023, 18, e0294553. [Google Scholar] [CrossRef]
- Yun, H.; Choi, E.K. Association between smartphone overdependence and mental health in South Korean adolescents: A secondary data analysis. Child Health Nurs. Res. 2024, 30, 87–96. [Google Scholar] [CrossRef]
- Lee, Y.S.; Joo, J.H.; Shin, J.; Nam, C.M.; Park, E.C. Association between smartphone overdependence and generalized anxiety disorder among Korean adolescents. J. Affect. Disord. 2023, 321, 108–113. [Google Scholar] [CrossRef]
- Wacks, Y.; Weinstein, A.M. Excessive smartphone use is associated with health problems in adolescents and young adults. Front. Psychiatry 2021, 12, 669042. [Google Scholar] [CrossRef]
- Ministry of Science and ICT (Republic of Korea). Intelligent Informatization Basic Act [Act No. 17344, revised 9 June 2020, effective 10 December 2020], Article 54. 2020. Retrieved from Ministry of Government Legislation. Available online: https://www.law.go.kr/LSW/lsInfoP.do?lsiSeq=233999 (accessed on 20 May 2025).
- France 24. Digital Pause: France Pilots School Mobile Phone Ban. 2024. Available online: https://phys.org/visualstories/2024-09-digital-france-school-mobile.amp (accessed on 20 May 2025).
- Camera, L. Which States Ban or Restrict Cellphones in Schools? U.S. News & World Report. 2024. Available online: https://www.awayfortheday.org/latest-news/which-states-ban-or-restrict-cellphones-in-schools (accessed on 20 May 2025).
- Joung, J.; Oh, E.; Lee, E.J. The experiences of counselors caring for children and adolescents with problematic smartphone use. Sci. Rep. 2023, 13, 12297. [Google Scholar] [CrossRef]
- Qudah, M.F.A.; Albursan, I.S.; Bakhiet, S.F.A.; Hassan, E.M.A.H.; Alfnan, A.A.; Aljomaa, S.S.; Al-Khadher, M.M.A. Smartphone addiction and its relationship with cyberbullying among university students. Int. J. Ment. Health Addict. 2019, 17, 628–643. [Google Scholar] [CrossRef]
- Tourangeau, R.; Yan, T. Sensitive questions in surveys. Psychol. Bull. 2007, 133, 859–883. [Google Scholar] [CrossRef] [PubMed]
- Agostino, H.; Toulany, A. Considerations for privacy and confidentiality in adolescent health care service delivery. Paediatr. Child Health 2023, 28, 172–177. [Google Scholar] [CrossRef] [PubMed]
- Thrall, J.S.; McCloskey, L.; Ettner, S.L.; Rothman, E.; Tighe, J.E.; Emans, S.J. Confidentiality and adolescents’ use of providers for health information and for pelvic examinations. Arch. Pediatr. Adolesc. Med. 2000, 154, 885–892. [Google Scholar] [CrossRef]
- Department of Health, Education, and Welfare. The Belmont Report: Ethical Principles and Guidelines for the Protection of Human SUBJECTS of Research; Technical report; DHEW Publication No. (OS) 78-0012; U.S. Government Printing Office: Washington, DC, USA, 1979.
- American Psychological Association. Ethical Principles of Psychologists and Code of Conduct (2002, amended June 1, 2010 and January 1, 2017). 2017. Available online: https://www.apa.org/ethics/code (accessed on 20 May 2025).
- Hasking, P.; Tatnell, R.C.; Martin, G. Adolescents’ reactions to participating in ethically sensitive research: A prospective self-report study. Child Adolesc. Psychiatry Ment. Health 2015, 9, 39. [Google Scholar] [CrossRef]
- Cruz-Gonzalez, P.; He, A.W.J.; Lam, E.P.; Ng, I.M.C.; Li, M.W.; Hou, R.; Chan, J.N.M.; Sahni, Y.; Guasch, N.V.; Miller, T.; et al. Artificial intelligence in mental health care: A systematic review of diagnosis, monitoring, and intervention applications. Psychol. Med. 2025, 55, e18. [Google Scholar] [CrossRef] [PubMed]
- Topol, E. Deep Medicine: How Artificial Intelligence Can Make Healthcare Human Again; Hachette: London, UK, 2019. [Google Scholar]
- Kim, E.; Song, M.K. Smartphone dependency latent profile classification and association with emotional and behavioral difficulties among high school students in Korea. Res. Community Public Health Nurs. 2024, 35, 84–98. [Google Scholar] [CrossRef]
- Lee, J.; Kim, W. Prediction of problematic smartphone use: A machine learning approach. Int. J. Environ. Res. Public Health 2021, 18, 6458. [Google Scholar] [CrossRef] [PubMed]
- Giraldo-Jiménez, C.F.; Gaviria-Chavarro, J.; Sarria-Paja, M.; Bermeo Varón, L.A.; Villarejo-Mayor, J.J.; Rodacki, A.L.F. Smartphones dependency risk analysis using machine-learning predictive models. Sci. Rep. 2022, 12, 22649. [Google Scholar] [CrossRef] [PubMed]
- Xiao, B.; Parent, N.; Rahal, L.; Shapka, J. Using machine learning to explore the risk factors of problematic smartphone use among Canadian adolescents during COVID-19: The important role of fear of missing out (FoMO). Appl. Sci. 2023, 13, 4970. [Google Scholar] [CrossRef]
- Sapienza, A.; Lítlá, M.; Lehmann, S.; Alessandretti, L. Exposure to urban and rural contexts shapes smartphone usage behavior. PNAS Nexus 2023, 2, pgad357. [Google Scholar] [CrossRef]
- Yoo, J.D.; Lee, I.S.; Yang, J.H. A Study on Regional Smartphone Addiction with Demographic and Sociodemographic Factors. J. Soc. Sci. Res. 2014, 40, 51–75. [Google Scholar] [CrossRef]
- Luo, J.; Cai, G.; Zu, X.; Huang, Q.; Cao, Q. Mobile phone addiction and negative emotions: An empirical study among adolescents in Jiangxi Province. Front. Psychiatry 2025, 16, 1541605. [Google Scholar] [CrossRef]
- Wang, J.; Luo, Y.; Yan, N.; Wang, Y.; Shiferaw, B.D.; Tang, J.; Pei, Y.; Chen, Q.; Zhu, Y.; Wang, W. Network structure of mobile phone addiction and anxiety symptoms among rural Chinese adolescents. BMC Psychiatry 2023, 23, 491. [Google Scholar] [CrossRef]
- Korea Legislation Research Institute (KLRI). Local Autonomy Act (지방자치법), Articles 3 & 10. Defines Population Thresholds and Administrative Subdivision Powers for Cities; see Articles 3 & 10. 2021. Available online: https://elaw.klri.re.kr/eng_service/lawView.do?hseq=44511&lang=ENG (accessed on 5 October 2021).
- Jun, M.; Lee, S.; Shim, T. First-year college student life experiences during COVID-19 in South Korea. Int. J. Environ. Res. Public Health 2021, 18, 9895. [Google Scholar] [CrossRef]
- Lee, G.W.; Moon, J.; Lee, D. Changes in Smartphone Usage among Adolescents and Associated Subjective Health Concerns: A Secondary Analysis of the Korea Youth Risk Behavior Survey. Children 2024, 11, 890. [Google Scholar] [CrossRef]
- Song, H.Y.; Kim, J.H. Smartphone use type, fear of missing out, social support, and smartphone screen time among adolescents in Korea: Interactive effects. Front. Public Health 2022, 10, 822741. [Google Scholar] [CrossRef]
- National Information Society Agency. Development of Smartphone Overdependence Scale: Final Report. In Digital Culture Forum Policy Research Report; National Information Society Agency, Ed.; National Information Society Agency: Daegu, Republic of Korea, 2016; pp. 253–281. [Google Scholar]
- Kim, N.H.; Lee, J.M.; Yang, S.H.; Lee, J.M. Association between smartphone overdependency and mental health in Korean adolescents during the COVID pandemic; age-and gender-matched study. Front. Public Health 2022, 10, 1056693. [Google Scholar] [CrossRef]
- Jaeyoung, L. Mediating Effect of Loneliness on Anxiety and Smartphone Overdependence among Korean Adolescents: Based on the 16th Korea Youth Risk Behavior Survey. Korean J. Health Promot. 2024, 24, 29–36. [Google Scholar]
- Kim, S.K.; Shin, H.R.; Kim, Y.S. Study on Relation Between Education Level and Overdependence on Smartphone for Middle-Aged and Elderly People: Focused on Mediator Effect of Willingness to Participate in Smartphone Overdependence Prevention Program. J. Soc. Sci. 2020, 31, 31–46. [Google Scholar] [CrossRef]
- Qiu, L.; Wangzhou, K.; Liu, Y.; Ding, J.; Li, H.; Ma, J. Status of professional mental health help-seeking intention associated factors among medical students: A cross-sectional study in China. Front. Psychiatry 2024, 15, 1376170. [Google Scholar] [CrossRef]
- Carter, B.; Payne, M.; Rees, P.; Sohn, S.Y.; Brown, J.; Kalk, N.J. A multi-school study in England, to assess problematic smartphone usage and anxiety and depression. Acta Paediatr. 2024, 113, 2240–2248. [Google Scholar] [CrossRef]
- Yang, X.; Ding, N.; Tu, X.; Zhao, C.; Xu, H.; Lai, X.; Zhang, G. The role of illness representations of internet gaming disorder (IGD) in help-seeking intention among undergraduates: A longitudinal study. Addict. Behav. 2022, 128, 107233. [Google Scholar] [CrossRef] [PubMed]
- Osiesi, M.P.; Adeniran, S.A.; Akomolafe, O.D. Moderating effect of health knowledge and mental health on the association between undergraduates’ attitudes toward help-seeking and internet addiction. BMC Public Health 2025, 25, 1–12. [Google Scholar] [CrossRef]
- Lee, Y.G. Factors Affecting Help-Seeking for Smartphone Overdependence Among Adolescents. J. Inf. Policy 2018, 25, 82–98. [Google Scholar] [CrossRef]
- Ministry of Science and ICT and Korea Intelligent Information Society Agency. 2023 년 스마트폰 과의존 실태조사 보고서. 2024. See Appendix 2 (Questionnaire) for Prevention Education Item Wording. Available online: https://seoulmentalhealth.kr/library/paper-collections/454 (accessed on 23 September 2025).
- Kwon, M.S.; Yu, J.S. Development and effect of a smartphone overdependence prevention program for university students based on self-determination theory. J. Korean Acad. Nurs. 2020, 50, 116–131. [Google Scholar] [CrossRef]
- Yu, J.S.; Ham, O.K.; Kwon, M.S. Effects of on-campus and off-campus smartphone overdependence prevention programs among university students. Asian Nurs. Res. 2022, 16, 215–223. [Google Scholar] [CrossRef]
- Choi, E.H.; Chun, M.Y.; Lee, I.; Yoo, Y.G.; Kim, M.J. The effect of mind subtraction meditation intervention on smartphone addiction and the psychological wellbeing among adolescents. Int. J. Environ. Res. Public Health 2020, 17, 3263. [Google Scholar] [CrossRef] [PubMed]
- Yum, J.; Choi, S.; Chung, M.; Choi, I.; Jeong, S. The effects of smartphone addiction intervention for elementary school students. J. Cybercommun. Acad. Soc. 2016, 33, 125–160. [Google Scholar]
- Cha, S.S.; Seo, B.K. Smartphone use and smartphone addiction in middle school students in Korea: Prevalence, social networking service, and game use. Health Psychol. Open 2018, 5, 2055102918755046. [Google Scholar] [CrossRef]
- Kim, D.I.; Keum, C.M.; Park, A.T.; Lee, S.H. The effectiveness of an internet and smartphone addiction prevention program for youth. Asian J. Educ. 2017, 18, 293–314. [Google Scholar] [CrossRef]
- National Information Society Agency. 2023 Survey on Smartphone Overdependence; Research Report NIA VIII-RSE-C-23065; National Information Society Agency: Seoul, Republic of Korea, 2023.
- Chan, S.J.; Yeo, K.J.; Handayani, L. Types of smartphone usage and problematic smartphone use among adolescents: A review of literature. Int. J. Eval. Res. Educ. 2023, 12, 563–570. [Google Scholar] [CrossRef]
- Cho, S.; Lee, S.; Woo, H.J.; Ko, Y.H.; Jeong, K.H. Relationship Between Types of Smartphone Use Among Adolescents and Smartphone Addiction: Focusing on Gender Differences. J. Men’s Health 2025, 21, 33–43. [Google Scholar] [CrossRef]
- Khan, F.N.; Begum, M.; Imad, M. Relationship Between Students’ Home Environment and Their Academic Achievement at Secondary School Level. Pak. J. Distance Online Learn. 2019, 5, 223–234. [Google Scholar]
- Conley, D. A Room with a View or a Room of One’s Own? Housing and Social Stratification. Sociol. Forum 2001, 16, 263–280. [Google Scholar] [CrossRef]
- Carlson, M.J.; Corcoran, M.E. Family Structure and Children’s Behavioral and Cognitive Outcomes. J. Marriage Fam. 2001, 63, 779–792. [Google Scholar] [CrossRef]
- Männikkö, N.; Ruotsalainen, H.; Miettunen, J.; Marttila-Tornio, K.; Kääriäinen, M. Parental socioeconomic status, adolescents’ screen time and sports participation through externalizing and internalizing characteristics. Heliyon 2020, 6, e03415. [Google Scholar] [CrossRef]
- Sasson, H.; Mesch, G.S. Parental Mediation. In The International Encyclopedia of Media Literacy; Hobbs, R., Mihailidis, P., Eds.; Wiley: Hoboken, NJ, USA, 2019; pp. 1–6. [Google Scholar] [CrossRef]
- Nagata, J.M.; Paul, A.; Yen, F.; Smith-Russack, Z.; Shao, I.Y.; Al-Shoaibi, A.A.; Ganson, K.T.; Testa, A.; Kiss, O.; He, J.; et al. Associations between media parenting practices and early adolescent screen use. Pediatr. Res. 2025, 97, 403–410. [Google Scholar] [CrossRef]
- Efrati, Y.; Rosenberg, H.; Ophir, Y. Effective parental strategies against problematic smartphone use among adolescents: A 6-month prospective study. Addict. Behav. 2024, 154, 108024. [Google Scholar] [CrossRef] [PubMed]
- Chen, Y.; Gu, Q.; Xu, Y.; Liang, J.; Ni, C. A chain mediation model reveals the association between parental mediation and smartphone addiction of Chinese adolescents. Sci. Rep. 2025, 15, 15777. [Google Scholar] [PubMed]
- Lee, J.; Lee, S.; Shin, Y. Lack of Parental Control Is Longitudinally Associated With Higher Smartphone Addiction Tendency in Young Children: A Population-Based Cohort Study. J. Korean Med Sci. 2024, 39, e254. [Google Scholar] [CrossRef] [PubMed]
- Meng, Z.; Min, K.; Ma, R.; Yang, J.; Zhang, H.; Li, Q. The mediating effect of parental monitoring in the association between parent–child relationship harmony and smartphone addiction: Findings from a nationwide youth survey in China. BMC Public Health 2025, 25, 1184. [Google Scholar] [CrossRef]
- Liu, Z.; Wang, S.; Zhao, X. Relationship between parental psychological control and problematic smartphone use among College students in China during and after the COVID-19 pandemic: A mediation analysis. Sustainability 2023, 15, 12967. [Google Scholar] [CrossRef]
- Li, Q.; Liu, Z. Parental psychological control and adolescent smartphone addiction: Roles of reactance and resilience. BMC Psychol. 2025, 13, 139. [Google Scholar] [CrossRef]
- Cobb, S. Social support as a moderator of life stress. Biopsychosoc. Sci. Med. 1976, 38, 300–314. [Google Scholar] [CrossRef] [PubMed]
- Zhong, G.; Shu, Y.; Zhou, Y.; Li, H.; Zhou, J.; Yang, L. The relationship between social support and smartphone addiction: The mediating role of negative emotions and self-control. BMC Psychiatry 2025, 25, 167. [Google Scholar] [CrossRef] [PubMed]
- Karoly, P. Mechanisms of Self-Regulation: A View. Annu. Rev. Psychol. 1993, 44, 23–52. [Google Scholar] [CrossRef]
- Baumeister, R.F.; Vohs, K.D. Self-Regulation, ego depletion, and motivation. Soc. Personal. Psychol. Compass 2007, 1, 115–128. [Google Scholar] [CrossRef]
- Duckworth, A.L.; Gendler, T.S.; Gross, J.J. Situational strategies for self-control. Perspect. Psychol. Sci. 2016, 11, 35–55. [Google Scholar] [CrossRef]
- Ding, Y.; Wan, X.; Lu, G.; Huang, H.; Liang, Y.; Yu, J.; Chen, C. The Associations Between Smartphone Addiction and Self-Esteem, Self-Control, and Social Support Among Chinese Adolescents: A Meta-Analysis. Front. Psychol. 2022, 13. [Google Scholar] [CrossRef]
- Bibi, A.; Mushtaq, A.; Aurangzeb, W.; Ahmed, S.Z.; Ahmad, M. Role of self-regulation in controlling cyber loafing and smartphone addiction: Reducing health risk at the university level. J. Educ. Health Promot. 2025, 14, 125. [Google Scholar] [CrossRef]
- Livingstone, S.; Helsper, E. Balancing opportunities and risks in teenagers’ use of the internet: The role of online skills and internet self-efficacy. New Media Soc. 2010, 12, 309–329. [Google Scholar] [CrossRef]
- Beck, A.T. Thinking and depression: I. Idiosyncratic content and cognitive distortions. Arch. Gen. Psychiatry 1963, 9, 324–333. [Google Scholar] [CrossRef]
- Jeong, J.H.; Bae, S.M. The relationship between types of smartphone use, digital literacy, and smartphone addiction in the elderly. Psychiatry Investig. 2022, 19, 832. [Google Scholar] [CrossRef] [PubMed]
- Shin, D.C.; Johnson, D.M. Avowed Happiness as an Overall Assessment of the Quality of Life. Soc. Indic. Res. 1978, 5, 475–492. [Google Scholar] [CrossRef]
- Pavot, W.; Diener, E. Review of the satisfaction with life scale. Psychol. Assess. 1993, 5, 164. [Google Scholar] [CrossRef]
- Diener, E.; Oishi, S.; Tay, L. Advances in subjective well-being research. Nat. Hum. Behav. 2018, 2, 253–260. [Google Scholar] [CrossRef]
- Kartol, A.; Üztemur, S. Let Me Check My Phone: Smartphone Addiction and Its Links to Life Satisfaction and Psychological Resilience. Br. J. Guid. Couns. 2025, 53, 167–178. [Google Scholar] [CrossRef]
- Mirowsky, J.; Ross, C.E. Measurement for a Human Science. J. Health Soc. Behav. 2002, 43, 152–170. [Google Scholar] [CrossRef] [PubMed]
- Chen, H.; Ma, J.; Guan, J.; Yin, L.; Shi, Z.; Zhang, Y. The impact of psychological distress on problematic smartphone use among college students: The mediating role of metacognitions about smartphone use. Front. Psychol. 2022, 13, 932838. [Google Scholar] [CrossRef] [PubMed]
- Song, X.; Zhu, W.; Zhang, Y.; Lan, Y. Smartphone dependence and its influence on physical and mental health. Front. Psychiatry 2025, 16, 1281841. [Google Scholar] [CrossRef] [PubMed]
- Pedregosa, F.; Varoquaux, G.; Gramfort, A.; Michel, V.; Thirion, B.; Grisel, O.; Blondel, M.; Prettenhofer, P.; Weiss, R.; Dubourg, V.; et al. Scikit-learn: Machine Learning in Python. J. Mach. Learn. Res. 2011, 12, 2825–2830. [Google Scholar]
- Hosmer, D.W., Jr.; Lemeshow, S. Applied Logistic Regression, 2nd ed.; Wiley: New York, NY, USA, 2000. [Google Scholar] [CrossRef]
- Quinlan, J.R. Induction of Decision Trees. Mach. Learn. 1986, 1, 81–106. [Google Scholar] [CrossRef]
- Breiman, L. Random Forests. Mach. Learn. 2001, 45, 5–32. [Google Scholar] [CrossRef]
- Chen, T.; Guestrin, C. XGBoost: A Scalable Tree Boosting System. In Proceedings of the 22nd ACM SIGKDD International Conference on Knowledge Discovery and Data Mining, New York, NY, USA, 13–17 August 2016; pp. 785–794. [Google Scholar] [CrossRef]
- Ke, G.; Meng, Q.; Finley, T.; Wang, T.; Chen, W.; Ma, W.; Ye, Q.; Liu, T.Y. LightGBM: A Highly Efficient Gradient Boosting Decision Tree. In Proceedings of the 31st International Conference on Neural Information Processing Systems, Long Beach, CA, USA, 4–9 December 2017; pp. 3146–3154. [Google Scholar]
- Akiba, T.; Sano, S.; Yanase, T.; Ohta, T.; Koyama, M. Optuna: A Next-generation Hyperparameter Optimization Framework. In Proceedings of the 25th ACM SIGKDD International Conference on Knowledge Discovery and Data Mining, Anchorage, AK, USA, 4–8 August 2019. [Google Scholar]
- Carter, J.V.; Pan, J.; Rai, S.N.; Galandiuk, S. ROC-ing along: Evaluation and interpretation of receiver operating characteristic curves. Surgery 2016, 159, 1638–1645. [Google Scholar] [CrossRef] [PubMed]
- Hastie, T.; Tibshirani, R.; Friedman, J.H.; Friedman, J.H. The Elements of Statistical Learning: Data Mining, Inference, and Prediction; Springer: Berlin/Heidelberg, Germany, 2009; Volume 2. [Google Scholar]
- Holzinger, A.; Saranti, A.; Molnar, C.; Biecek, P.; Samek, W. Explainable AI Methods-A Brief Overview. In Explainable AI Methods; Springer International Publishing: Cham, Switzerland, 2022; pp. 13–38. [Google Scholar] [CrossRef]
- Ignatiev, A. Towards Trustable Explainable AI. In Proceedings of the Twenty-Ninth International Joint Conference on Artificial Intelligence, Yokohama, Japan, 11–17 July 2020; pp. 5154–5158. [Google Scholar] [CrossRef]
- Aumann, R. The Shapley Value. In Game Theory and Applications; Elsevier: Amsterdam, The Netherlands, 1990; pp. 158–165. [Google Scholar]
- Lundberg, S.M.; Lee, S.I. A unified approach to interpreting model predictions. In Proceedings of the 31st International Conference on Neural Information Processing Systems, Long Beach, CA, USA, 4–9 December 2017; Volume 30. [Google Scholar]
- Molnar, C. Interpretable Machine Learning. 2020. Available online: https://christophm.github.io/interpretable-ml-book/ (accessed on 19 January 2024).
- Beck, A.T.; Rush, A.J.; Shaw, B.F.; Emery, G.; DeRubeis, R.J.; Hollon, S.D. Cognitive Therapy of Depression; Guilford Publications: New York, NY, USA, 2024. [Google Scholar]
- Gao, L.; Zhu, X.; Caselli, G.; Wang, Y.; Chu, X.; Chen, H. Distinct roles of specific metacognitive beliefs in adolescent problematic mobile phone use: A cross-lagged panel network analysis. Addict. Behav. 2025, 165, 108291. [Google Scholar] [CrossRef] [PubMed]
- Davis, R.A. A cognitive-behavioral model of pathological Internet use. Comput. Hum. Behav. 2001, 17, 187–195. [Google Scholar] [CrossRef]
- Young, K.S. CBT-IA: The first treatment model for Internet addiction. J. Cogn. Psychother. 2011, 25, 304–312. [Google Scholar] [CrossRef]
- Lee, S.; Im, J.; Cho, K. Understanding spatial inequalities and stratification in transportation accessibility to social infrastructures in South Korea: Multi-dimensional planning insights. Sci. Rep. 2024, 14, 18445. [Google Scholar] [CrossRef]
- Parker, K.; Horowitz, J.; Brown, A.; Fry, R.; Cohn, D.; Igielnik, R. What Unites and Divides Urban, Suburban and Rural Communities. 2018. Available online: https://repository.gheli.harvard.edu/repository/12733/ (accessed on 5 September 2025).
- Song, I. The effects of adolescents’ relationships with parents and school/institute teachers as protective factors on smartphone addiction: Comparative analysis of elementary, middle, and high school levels in South Korea. Asian J. Public Opin. Res. 2021, 9, 106–141. [Google Scholar]
- Lee, B.R.; Lee, J.H. Association between smartphone overdependence and sexual behavior in adolescents: A secondary data analysis of the 19th Youth Health Behavior Survey. Child Health Nurs. Res. 2025, 31, 134. [Google Scholar] [CrossRef]
- Chen, B.; Liu, F.; Ding, S.; Ying, X.; Wang, L.; Wen, Y. Gender differences in factors associated with smartphone addiction: A cross-sectional study among medical college students. BMC Psychiatry 2017, 17, 341. [Google Scholar] [CrossRef]
- Yoo, Y.S.; Cho, O.H.; Cha, K.S. Associations between overuse of the internet and mental health in adolescents. Nurs. Health Sci. 2014, 16, 193–200. [Google Scholar] [CrossRef] [PubMed]


| Construct | Variable | Metropolitan City | Medium or | Town or |
|---|---|---|---|---|
| Small City | Rural District | |||
| (n = 831) | (n = 714) | (n = 328) | ||
| Home Environment | House (n (%)) * | 167 (20.1%) | 152 (21.3%) | 90 (27.4%) |
| Smartphone Use Cases | Messenger (M (SD)) *** | 5.31 (1.46) | 5.41 (1.42) | 5.02 (1.75) |
| Scheduling (M (SD)) ** | 2.06 (2.13) | 1.86 (2.06) | 1.62 (2.08) | |
| Health (M (SD)) * | 1.76 (2.04) | 1.59 (1.91) | 1.46 (1.98) | |
| Zoom Meetings (M (SD)) * | 0.73 (1.57) | 0.54 (1.33) | 0.59 (1.41) | |
| Investment (M (SD)) *** | 0.86 (1.52) | 0.63 (1.28) | 0.62 (1.29) | |
| Watching Videos (M (SD)) * | 5.25 (1.62) | 5.32 (1.58) | 5.02 (1.81) | |
| Listening Music (M (SD)) *** | 4.51 (1.97) | 4.48 (2.04) | 4.03 (2.35) | |
| Adult Content (M (SD)) *** | 0.50 (1.15) | 0.33 (0.94) | 0.30 (0.94) | |
| Gambling (M (SD)) *** | 0.48 (1.20) | 0.29 (0.87) | 0.32 (1.04) | |
| News (M (SD)) ** | 2.57 (2.21) | 2.30 (2.04) | 2.16 (2.16) | |
| Educational Web Search (M (SD)) ** | 4.06 (1.81) | 3.84 (1.78) | 3.64 (2.26) | |
| Navigation (M (SD)) * | 2.42 (1.92) | 2.37 (1.95) | 2.12 (2.00) | |
| Short-Form YouTube (n (%)) ** | 443 (53.3%) | 315 (44.1%) | 162 (49.4%) | |
| TikTok (n (%)) * | 145 (17.4%) | 165 (23.1%) | 68 (20.7%) | |
| Mostly Food (n (%)) * | 130 (15.6%) | 80 (11.2%) | 47 (14.3%) | |
| Perceived Digital Competence and Risk | Gaming Side Effects (n (%)) ** | 353 (42.5%) | 313 (43.8%) | 108 (32.9%) |
| Issue Engagement (M (SD)) * | 2.80 (0.85) | 2.70 (0.85) | 2.81 (0.81) | |
| Content Creation (M (SD)) * | 2.49 (0.98) | 2.43 (0.98) | 2.62 (0.99) | |
| Privacy Awareness (M (SD)) *** | 2.66 (0.88) | 2.57 (0.86) | 2.79 (0.86) | |
| Info for School/Work (M (SD)) *** | 2.89 (0.87) | 2.67 (0.94) | 2.81 (0.92) | |
| Consequences and Dependence | Low-Battery Nervousness (M (SD)) ** | 2.71 (0.83) | 2.85 (0.86) | 2.75 (0.85) |
| Parental Prevention | Teaches Use (n (%)) ** | 397 (47.8%) | 284 (39.8%) | 130 (39.6%) |
| Teaches Pros/Cons (n (%)) * | 514 (61.9%) | 422 (59.1%) | 176 (53.7%) | |
| Recommends Apps (n (%)) *** | 396 (47.7%) | 277 (38.8%) | 152 (46.3%) | |
| Social Support | Family Support (M (SD)) ** | 3.29 (0.69) | 3.17 (0.75) | 3.26 (0.66) |
| Friend Support (M (SD)) * | 3.13 (0.67) | 3.07 (0.69) | 3.17 (0.68) | |
| Fairness Perception (M (SD)) *** | 2.93 (0.71) | 2.81 (0.75) | 3.03 (0.79) | |
| Self-Regulation | Digital Detox (n (%)) ** | 210 (25.3%) | 153 (21.4%) | 55 (16.8%) |
| Designated Placement (n (%)) * | 286 (34.4%) | 200 (28.0%) | 105 (32.0%) | |
| Work Mode (n (%)) * | 414 (49.8%) | 316 (44.3%) | 136 (41.5%) |
| Model Name/Construct | Shorthand | Algorithm | AUC | Mean Val Loss | Test Loss | Num Features |
|---|---|---|---|---|---|---|
| +Smartphone Use Cases | M4 | RF | 0.81 | 0.58 | 0.55 | 59 |
| Smartphone Consequences and Dependence | Smart CD | LightGBM | 0.89 | 0.50 | 0.42 | 7 |
| Perceived Digital Competence and Risk | Perceived DCR | XGB | 0.84 | 0.52 | 0.49 | 34 |
| Smartphone Use Cases | Use Case | XGB | 0.80 | 0.59 | 0.54 | 48 |
| Model | National AUC | Place-Stratified AUC | ||
|---|---|---|---|---|
| Metropolitan City | Medium or Small City | Town or Rural District | ||
| M4 (+Smartphone Use Cases) | 0.81 | 0.87 | 0.75 | 0.80 |
| Smart CD Construct | 0.89 | 0.91 | 0.87 | 0.87 |
| Perceived DCR Construct | 0.84 | 0.85 | 0.83 | 0.83 |
| Use Case Construct | 0.80 | 0.88 | 0.70 | 0.79 |
Disclaimer/Publisher’s Note: The statements, opinions and data contained in all publications are solely those of the individual author(s) and contributor(s) and not of MDPI and/or the editor(s). MDPI and/or the editor(s) disclaim responsibility for any injury to people or property resulting from any ideas, methods, instructions or products referred to in the content. |
© 2025 by the authors. Licensee MDPI, Basel, Switzerland. This article is an open access article distributed under the terms and conditions of the Creative Commons Attribution (CC BY) license (https://creativecommons.org/licenses/by/4.0/).
Share and Cite
Kim, A.H.; Lee, U.; Cho, Y.; Kim, S.; Shah, V. Adolescent Smartphone Overdependence in South Korea: A Place-Stratified Evaluation of Conceptually Informed AI/ML Modeling. Int. J. Environ. Res. Public Health 2025, 22, 1515. https://doi.org/10.3390/ijerph22101515
Kim AH, Lee U, Cho Y, Kim S, Shah V. Adolescent Smartphone Overdependence in South Korea: A Place-Stratified Evaluation of Conceptually Informed AI/ML Modeling. International Journal of Environmental Research and Public Health. 2025; 22(10):1515. https://doi.org/10.3390/ijerph22101515
Chicago/Turabian StyleKim, Andrew H., Uibin Lee, Yohan Cho, Sangmi Kim, and Vatsal Shah. 2025. "Adolescent Smartphone Overdependence in South Korea: A Place-Stratified Evaluation of Conceptually Informed AI/ML Modeling" International Journal of Environmental Research and Public Health 22, no. 10: 1515. https://doi.org/10.3390/ijerph22101515
APA StyleKim, A. H., Lee, U., Cho, Y., Kim, S., & Shah, V. (2025). Adolescent Smartphone Overdependence in South Korea: A Place-Stratified Evaluation of Conceptually Informed AI/ML Modeling. International Journal of Environmental Research and Public Health, 22(10), 1515. https://doi.org/10.3390/ijerph22101515


