
Sociodemographic and Population Exposure to Upstream Oil and Gas Operations in Canada


Abstract
1. Introduction
2. Materials and Methods
2.1. Study Area
2.2. Inventory Methods
2.3. Exposure Assessment
2.4. ECCC National Air Pollution Surveillance Program
2.5. Satellite Remote Sensing Dataset
2.6. Airshed Ground Monitoring Data
2.7. Review of Literature
3. Results and Discussion
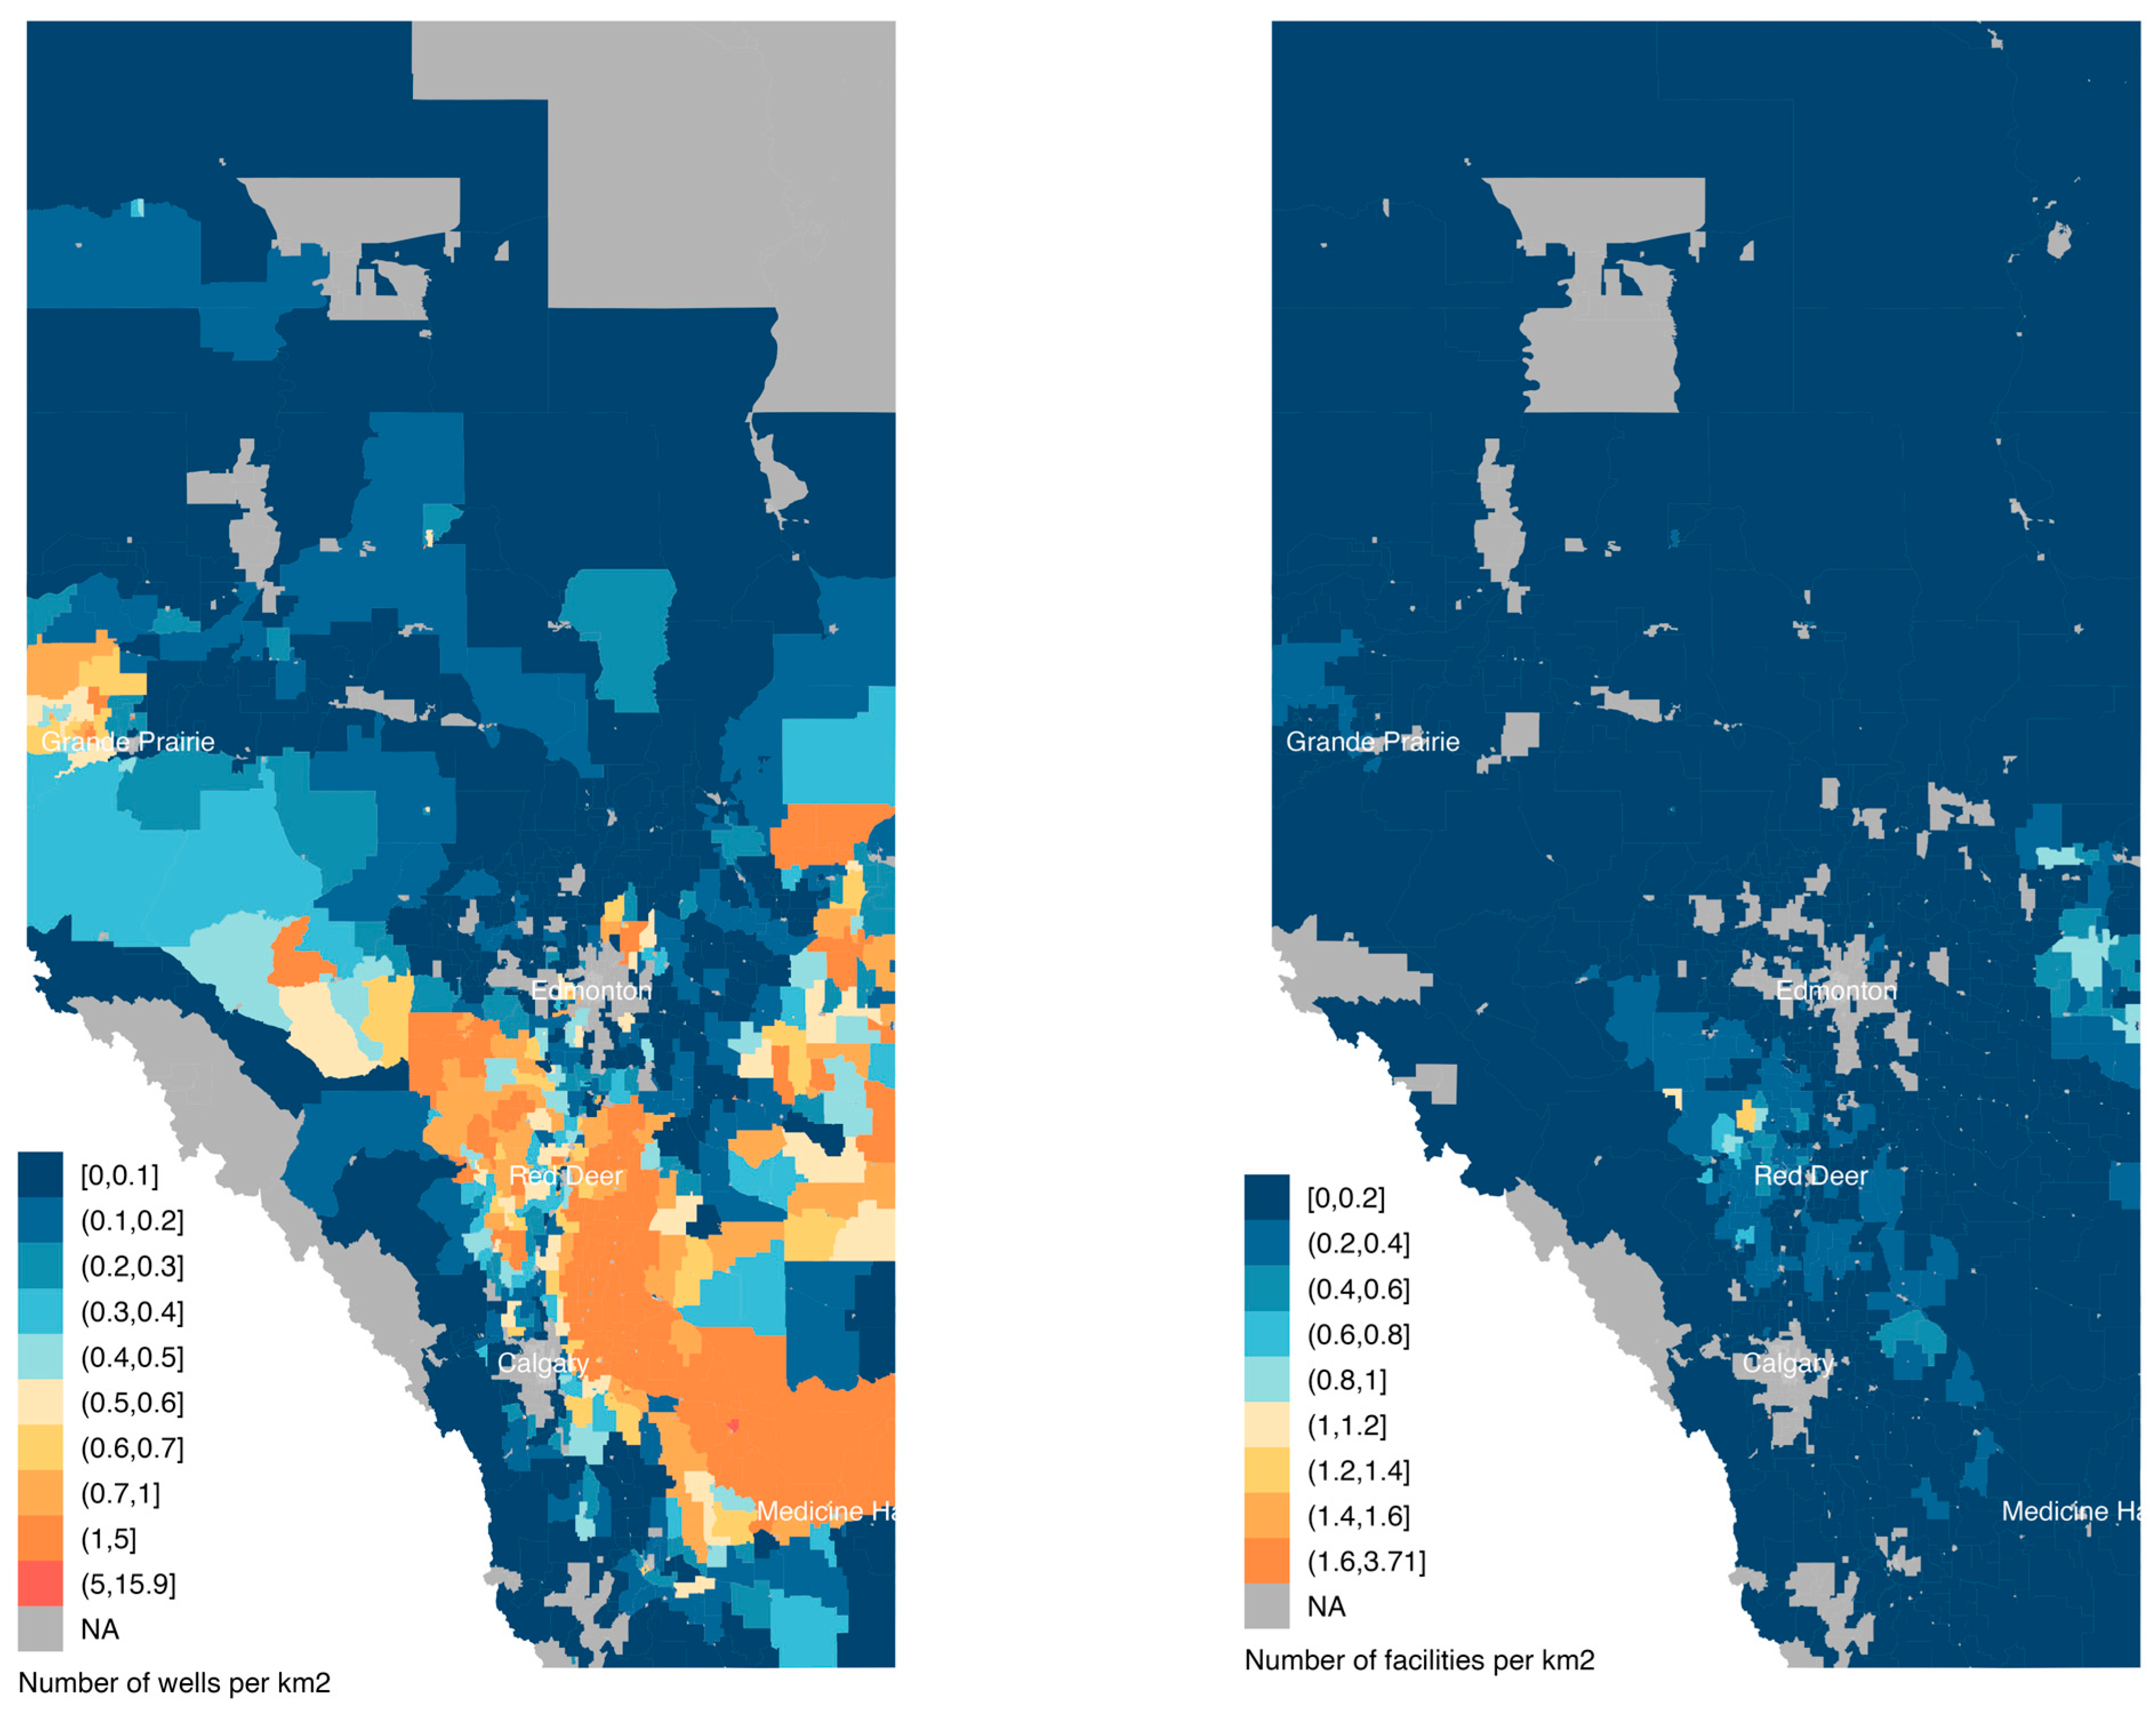
3.1. Oil and Gas Activities
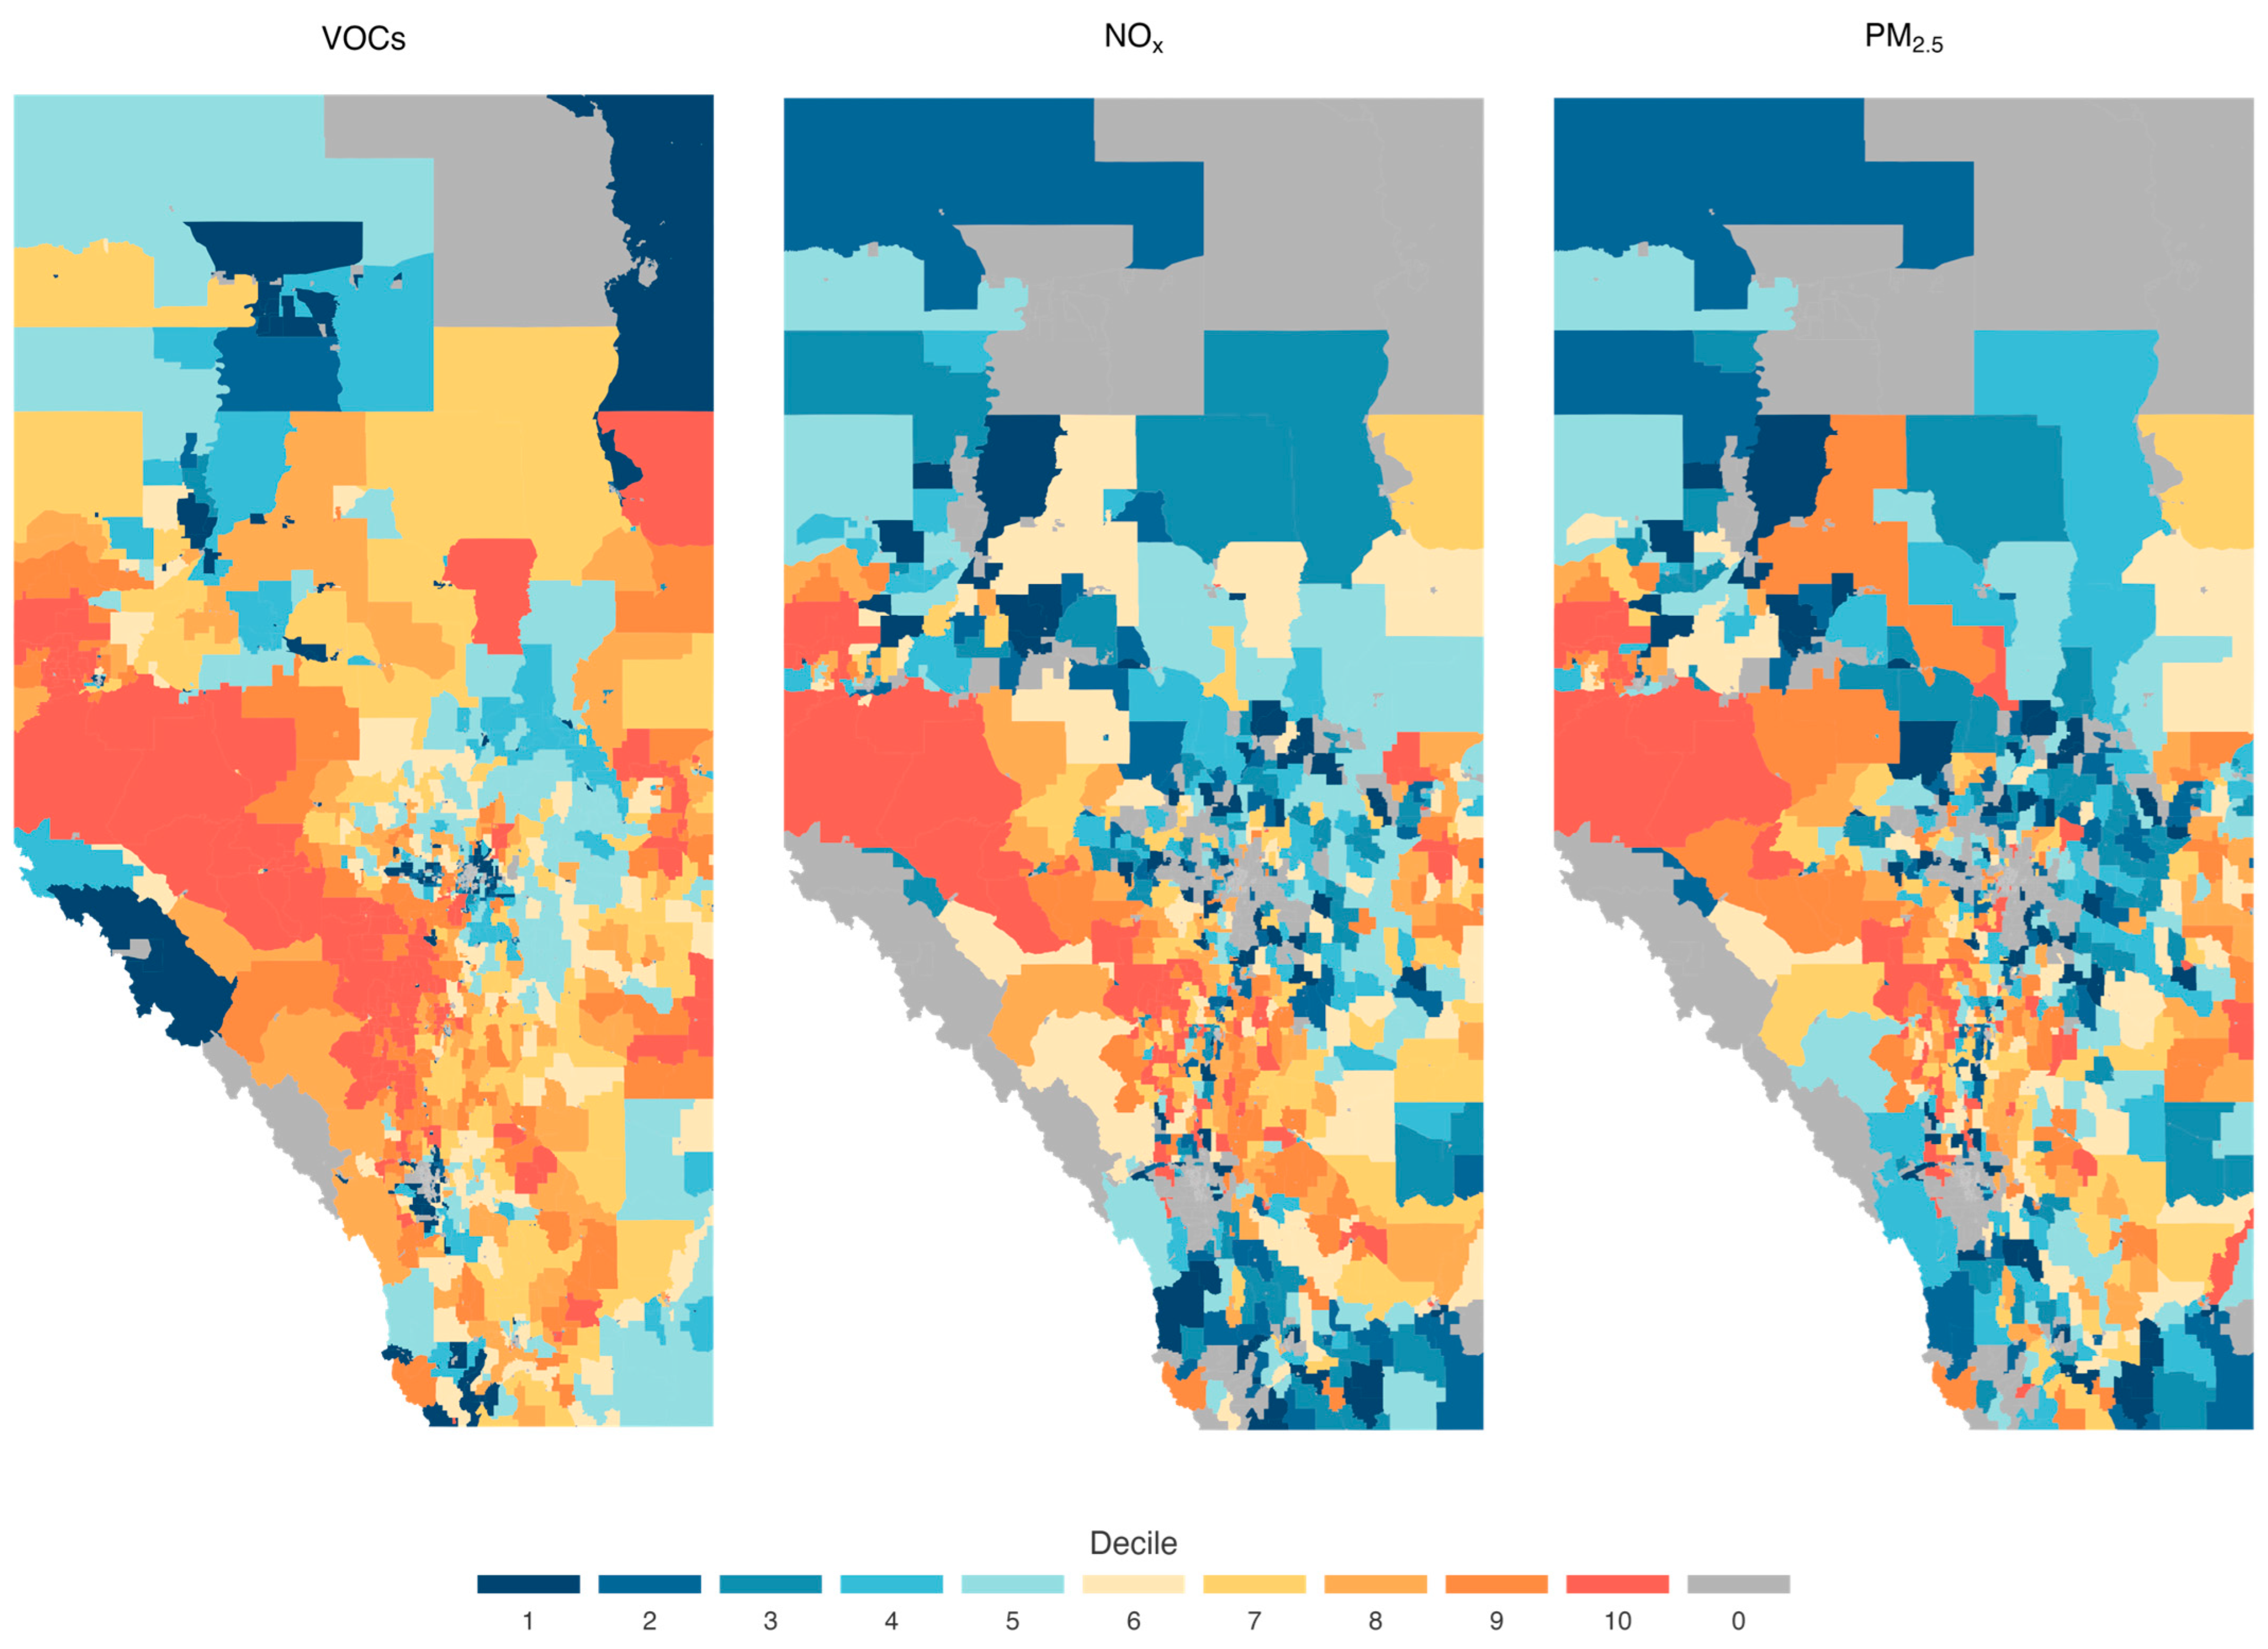
3.2. Pollutant Emissions
3.3. Proximity to Active Wells
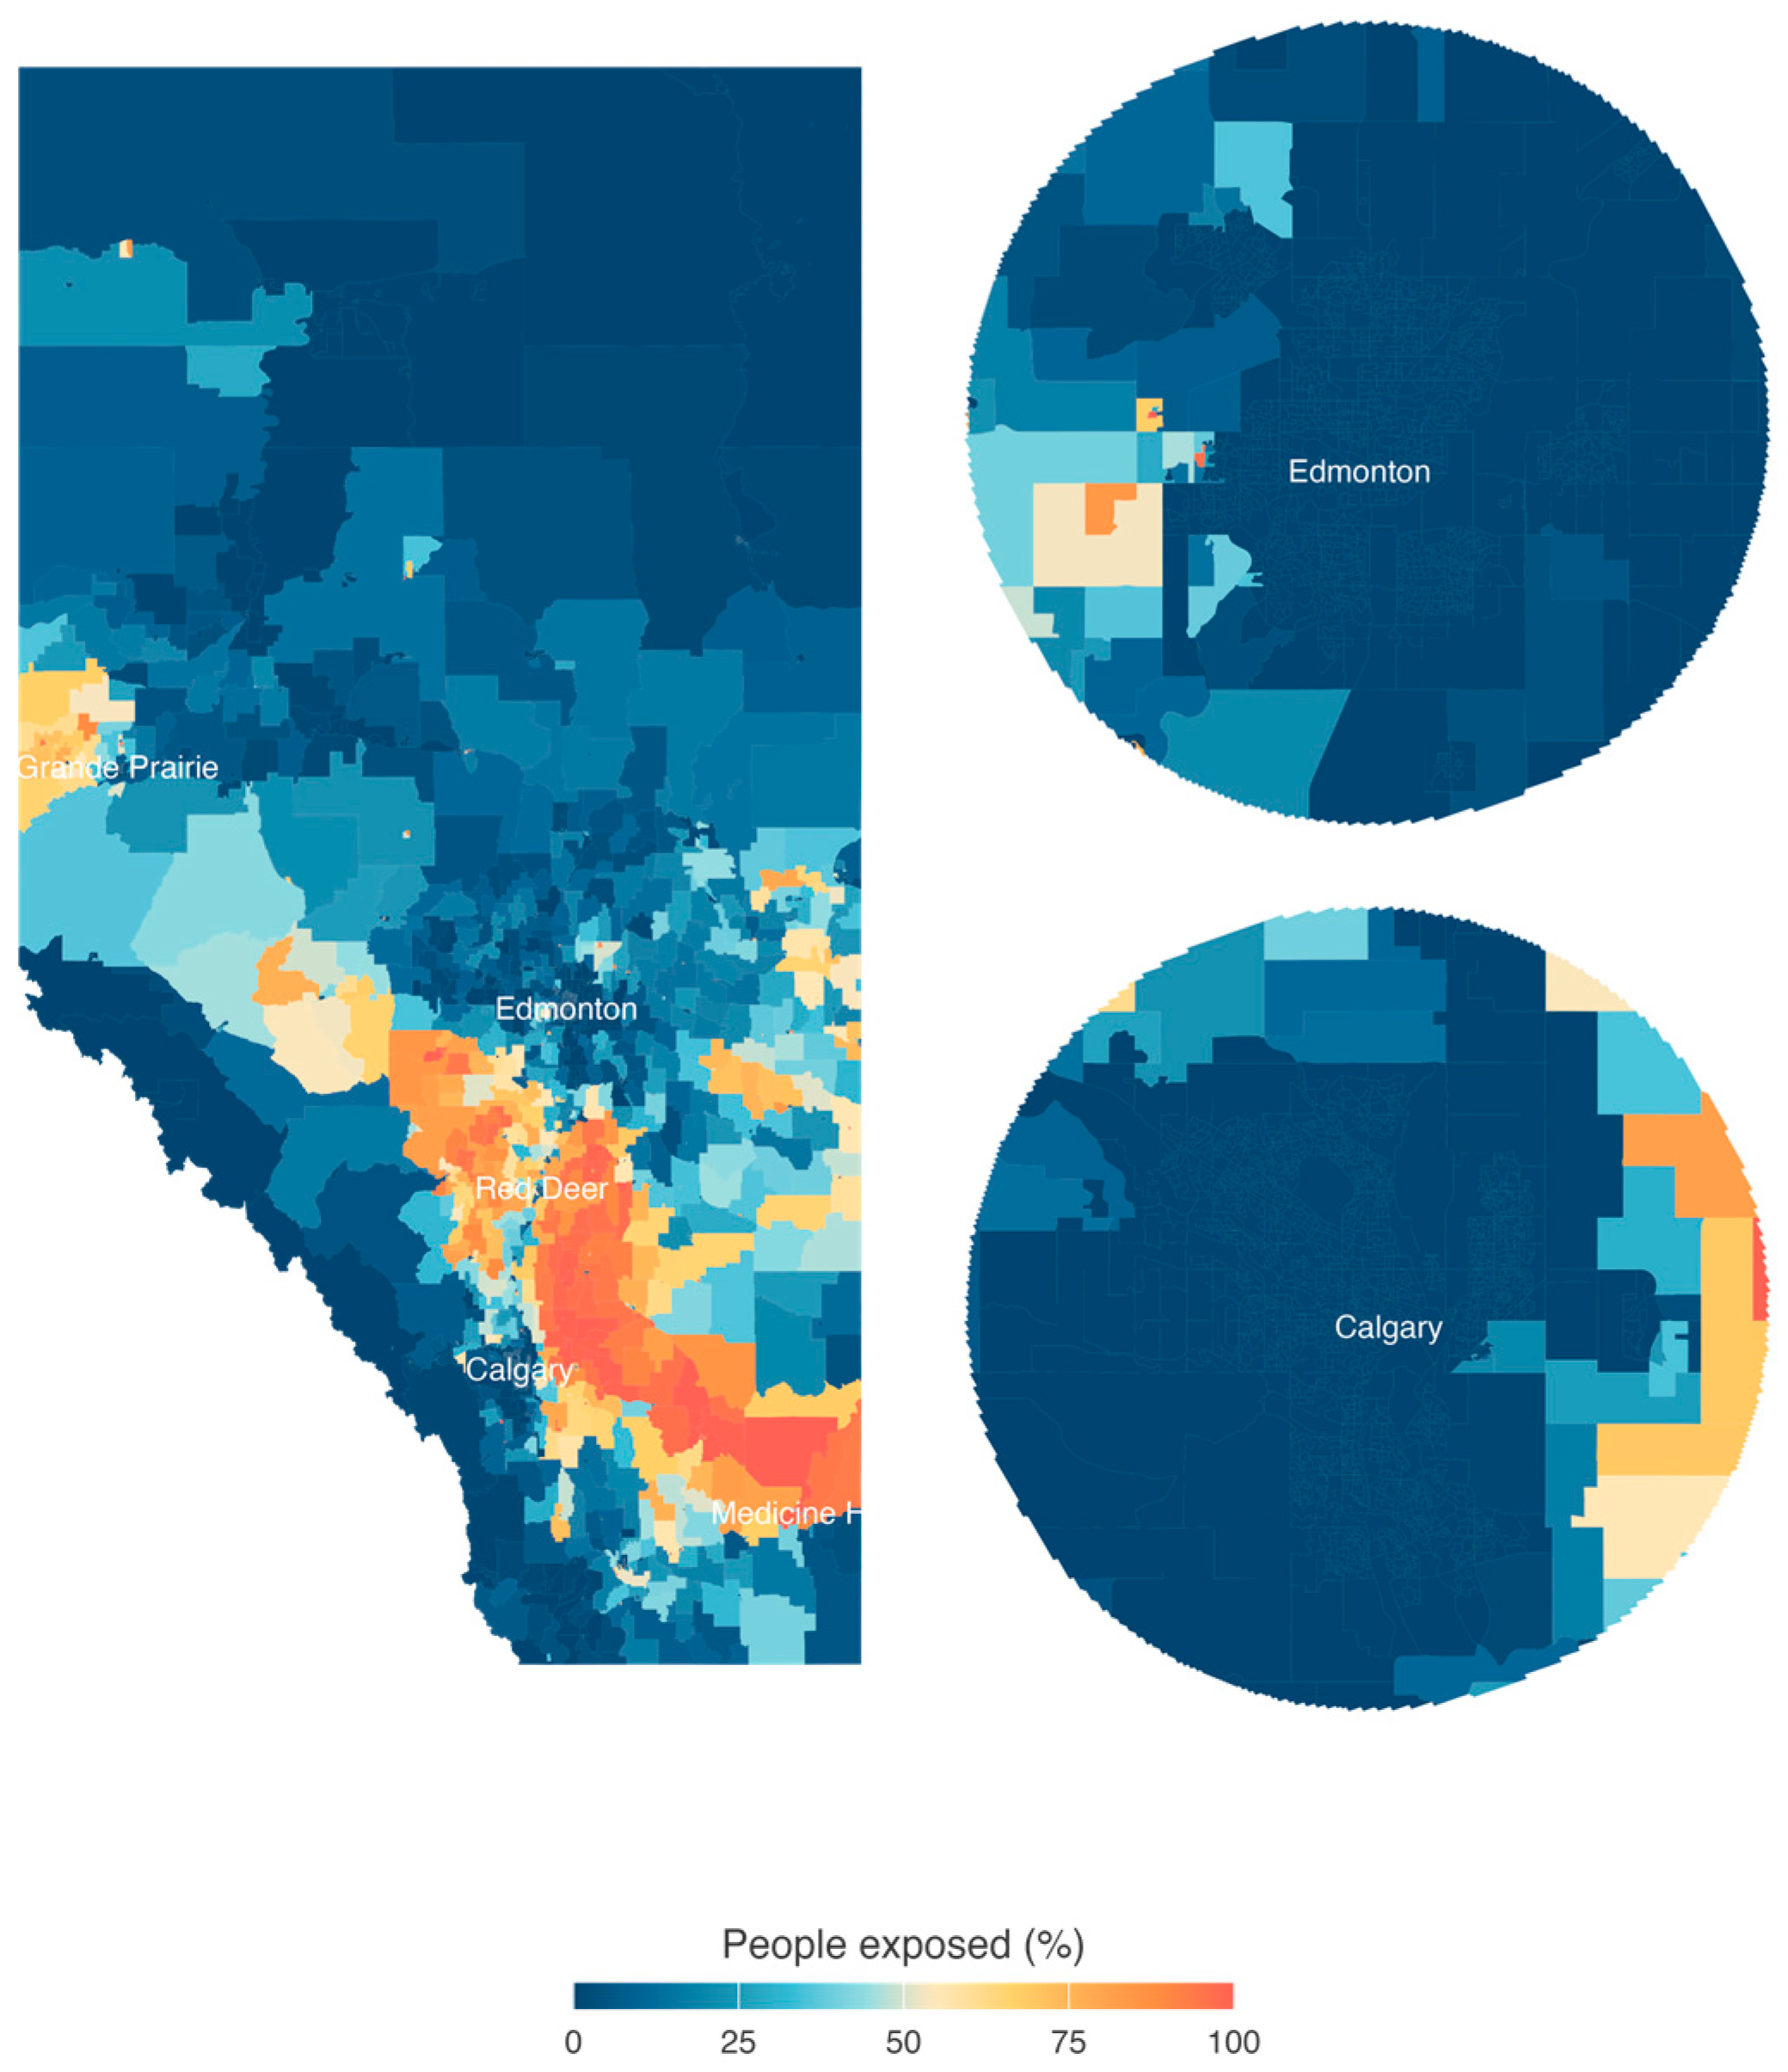
3.4. Population Exposure
3.5. Exposure Inequality
3.6. Effects of Oil and Gas Activities on Cardio-Respiratory Outcomes
3.7. Limitations
3.8. Extensibility to Other Jurisdictions
- −
- Emissions Profiles and Trends: Similar nations may exhibit comparable emissions patterns, with flaring, venting, and fugitive emissions contributing significantly to methane, VOC, and NOx levels. Trends such as stable onsite fuel use but increasing flaring and venting due to regulatory shifts could also have impacts.
- −
- Geographical Distribution of Emissions: The clustering of pollutant emissions around oil-producing regions, often in rural areas, is likely a common feature. This could lead to uneven population exposure, particularly affecting rural and Indigenous communities or other socioeconomically marginalized groups.
- −
- Health Impacts: The observed link between proximity to oil and gas activities and increased odds of cardio-respiratory health outcomes underscores a pattern that could emerge in other regions with significant oil and gas infrastructure. This aligns with global studies showing similar health risks, suggesting that localized data could reveal comparable health disparities. The lack of agreement for respiratory morbidity in our study was possibly due confounding factors such as smoking, which was more prevalent in rural than urban areas, or other important pollutant/aerosols (VOCs, PM2.5) not included in the models.
- −
- Data Gaps and Policy Challenges: Like Canada, many midsized producers rely on aggregated emissions inventories or outdated factors, making accurate quantification difficult. This study highlights the importance of combining satellite-based measurements with ground data to improve accuracy and track regulatory impact.
- −
- Regulatory Implications: Our findings stress the need for targeted policies in these nations to address emissions and protect vulnerable populations. Tailored interventions could include stricter flaring and venting regulations, enhanced monitoring, and health-focused risk assessments to inform public health strategies. Efforts aligned with these objectives are being carried out by the United Nations Environment Programme and the World Bank, and they must continue.
4. Conclusions
Supplementary Materials
Author Contributions
Funding
Institutional Review Board Statement
Informed Consent Statement
Data Availability Statement
Acknowledgments
Conflicts of Interest
References
- IPCC. IPCC Climate Change 2021: The Physical Science Basis. In Contribution of Working Group I to the Sixth Assessment Report of the Intergovernmental Panel on Climate Change 2021; Cambridge University Press: Cambridge, UK; New York, NY, USA, 2023. [Google Scholar]
- Garcia-Gonzales, D.A.; Shonkoff, S.B.C.; Hays, J.; Jerrett, M. Hazardous Air Pollutants Associated with Upstream Oil and Natural Gas Development: A Critical Synthesis of Current Peer-Reviewed Literature. Annu. Rev. Public Health 2019, 40, 283–304. [Google Scholar] [CrossRef] [PubMed]
- Warneke, C.; Geiger, F.; Edwards, P.M.; Dube, W.; Pétron, G.; Kofler, J.; Zahn, A.; Brown, S.S.; Graus, M.; Gilman, J.B.; et al. Volatile Organic Compound Emissions from the Oil and Natural Gas Industry in the Uintah Basin, Utah: Oil and Gas Well Pad Emissions Compared to Ambient Air Composition. Atmos. Chem. Phys. 2014, 14, 10977–10988. [Google Scholar] [CrossRef]
- O’Callaghan-Gordo, C.; Orta-Martínez, M.; Kogevinas, M. Health Effects of Non-Occupational Exposure to Oil Extraction. Environ. Health 2016, 15, 56. [Google Scholar] [CrossRef] [PubMed]
- Johnston, J.E.; Lim, E.; Roh, H. Impact of Upstream Oil Extraction and Environmental Public Health: A Review of the Evidence. Sci. Total Environ. 2019, 657, 187–199. [Google Scholar] [CrossRef]
- Buonocore, J.J.; Reka, S.; Yang, D.; Chang, C.; Roy, A.; Thompson, T.; Lyon, D.; McVay, R.; Michanowicz, D.; Arunachalam, S. Air Pollution and Health Impacts of Oil & Gas Production in the United States. Environ. Res. Health 2023, 1, 021006. [Google Scholar] [CrossRef]
- Johnston, J.E.; Enebish, T.; Eckel, S.P.; Navarro, S.; Shamasunder, B. Respiratory Health, Pulmonary Function and Local Engagement in Urban Communities near Oil Development. Environ. Res. 2021, 197, 111088. [Google Scholar] [CrossRef]
- McKenzie, L.M.; Crooks, J.; Peel, J.L.; Blair, B.D.; Brindley, S.; Allshouse, W.B.; Malin, S.; Adgate, J.L. Relationships between Indicators of Cardiovascular Disease and Intensity of Oil and Natural Gas Activity in Northeastern Colorado. Environ. Res. 2019, 170, 56–64. [Google Scholar] [CrossRef]
- Okorn, K.; Jimenez, A.; Collier-Oxandale, A.; Johnston, J.; Hannigan, M. Characterizing Methane and Total Non-Methane Hydrocarbon Levels in Los Angeles Communities with Oil and Gas Facilities Using Air Quality Monitors. Sci. Total Environ. 2021, 777, 146194. [Google Scholar] [CrossRef]
- Weisner, M.L.; Allshouse, W.B.; Erjavac, B.W.; Valdez, A.P.; Vahling, J.L.; McKenzie, L.M. Health Symptoms and Proximity to Active Multi-Well Unconventional Oil and Gas Development Sites in the City and County of Broomfield, Colorado. Int. J. Environ. Res. Public Health 2023, 20, 2634. [Google Scholar] [CrossRef]
- Roest, G.S.; Schade, G.W. Air Quality Measurements in the Western Eagle Ford Shale. Elem. Sci. Anthr. 2020, 8, 18. [Google Scholar] [CrossRef]
- Schade, G.W.; Roest, G. Source Apportionment of Non-Methane Hydrocarbons, NOx and H2S Data from a Central Monitoring Station in the Eagle Ford Shale, Texas. Elem. Sci. Anthr. 2018, 6, 35. [Google Scholar] [CrossRef]
- Cushing, L.J.; Vavra-Musser, K.; Chau, K.; Franklin, M.; Johnston, J.E. Flaring from Unconventional Oil and Gas Development and Birth Outcomes in the Eagle Ford Shale in South Texas. Environ. Health Perspect. 2020, 128, 077003. [Google Scholar] [CrossRef] [PubMed]
- Giwa, S.O.; Nwaokocha, C.N.; Kuye, S.I.; Adama, K.O. Gas Flaring Attendant Impacts of Criteria and Particulate Pollutants: A Case of Niger Delta Region of Nigeria. J. King Saud Univ. Eng. Sci. 2019, 31, 209–217. [Google Scholar] [CrossRef]
- Willis, M.D.; Campbell, E.J.; Selbe, S.; Koenig, M.R.; Gradus, J.L.; Nillni, Y.I.; Casey, J.A.; Deziel, N.C.; Hatch, E.E.; Wesselink, A.K.; et al. Residential Proximity to Oil and Gas Development and Mental Health in a North American Preconception Cohort Study: 2013–2023. Am. J. Public Health 2024, 114, 923–934. [Google Scholar] [CrossRef]
- Willis, M.D.; Jusko, T.A.; Halterman, J.S.; Hill, E.L. Unconventional Natural Gas Development and Pediatric Asthma Hospitalizations in Pennsylvania. Environ. Res. 2018, 166, 402–408. [Google Scholar] [CrossRef]
- Doris, M.; Daley, C.; Zalzal, J.; Chesnaux, R.; Minet, L.; Kang, M.; Caron-Beaudoin, É.; MacLean, H.L.; Hatzopoulou, M. Modelling Spatial & Temporal Variability of Air Pollution in an Area of Unconventional Natural Gas Operations. Environ. Pollut. 2024, 348, 123773. [Google Scholar] [CrossRef]
- Waldner, C.L. Risk of Abortion and Stillbirth in Cow-Calf Herds Exposed to the Oil and Gas Industry in Western Canada. Arch. Environ. Occup. Health 2009, 64, 29–45. [Google Scholar] [CrossRef]
- Waldner, C.L. Western Canada Study of Animal Health Effects Associated with Exposure to Emissions From Oil and Natural Gas Field Facilities. Study Design and Data Collection II. Location of Study Herds Relative to the Oil and Gas Industry in Western Canada. Arch. Environ. Occup. Health 2008, 63, 187–199. [Google Scholar] [CrossRef]
- Caron-Beaudoin, É.; Whyte, K.P.; Bouchard, M.F.; Chevrier, J.; Haddad, S.; Copes, R.; Frohlich, K.L.; Dokkie, D.; Juul, S.; Bouchard, M.; et al. Volatile Organic Compounds (VOCs) in Indoor Air and Tap Water Samples in Residences of Pregnant Women Living in an Area of Unconventional Natural Gas Operations: Findings from the EXPERIVA Study. Sci. Total Environ. 2022, 805, 150242. [Google Scholar] [CrossRef]
- Daley, C.; Doris, M.; Verner, M.-A.; Zalzal, J.; Chesnaux, R.; Minet, L.; Kang, M.; MacLean, H.L.; Hatzopoulou, M.; Owens-Beek, N.; et al. Residential Proximity to Conventional and Unconventional Wells and Exposure to Indoor Air Volatile Organic Compounds in the Exposures in the Peace River Valley (EXPERIVA) Study. Int. J. Hyg. Environ. Health 2025, 263, 114462. [Google Scholar] [CrossRef]
- Caron-Beaudoin, É.; Subramanian, A.; Daley, C.; Lakshmanan, S.; Whitworth, K.W. Estimation of Exposure to Particulate Matter in Pregnant Individuals Living in an Area of Unconventional Oil and Gas Operations: Findings from the EXPERIVA Study. J. Toxicol. Environ. Health A 2023, 86, 383–396. [Google Scholar] [CrossRef] [PubMed]
- Aker, A.M.; Whitworth, K.W.; Bosson-Rieutort, D.; Wendling, G.; Ibrahim, A.; Verner, M.-A.; Benoit, A.C.; Caron-Beaudoin, É. Proximity and Density of Unconventional Natural Gas Wells and Mental Illness and Substance Use among Pregnant Individuals: An Exploratory Study in Canada. Int. J. Hyg. Environ. Health 2022, 242, 113962. [Google Scholar] [CrossRef] [PubMed]
- Cairncross, Z.F.; Couloigner, I.; Ryan, M.C.; McMorris, C.; Muehlenbachs, L.; Nikolaou, N.; Wong, R.C.-K.; Hawkins, S.M.; Bertazzon, S.; Cabaj, J.; et al. Association between Residential Proximity to Hydraulic Fracturing Sites and Adverse Birth Outcomes. JAMA Pediatr. 2022, 176, 585–592. [Google Scholar] [CrossRef] [PubMed]
- Jost, E.; Dingley, B.; Jost, C.; Cheung, W.Y.; Quan, M.L.; Bouchard-Fortier, A.; Kong, S.; Xu, Y. Associations between the Density of Oil and Gas Infrastructure and the Incidence, Stage and Outcomes of Solid Tumours: A Population-Based Geographic Analysis. Front. Oncol. 2021, 11, 757875. [Google Scholar] [CrossRef] [PubMed]
- Claustre, L.; Bouchard, M.; Gasparyan, L.; Bosson-Rieutort, D.; Owens-Beek, N.; Caron-Beaudoin, É.; Verner, M.-A. Assessing Gestational Exposure to Trace Elements in an Area of Unconventional Oil and Gas Activity: Comparison with Reference Populations and Evaluation of Variability. J. Expo. Sci. Environ. Epidemiol. 2023, 33, 94–101. [Google Scholar] [CrossRef]
- Aker, A.M.; Friesen, M.; Ronald, L.A.; Doyle-Waters, M.M.; Takaro, T.J.; Thickson, W.; Levin, K.; Meyer, U.; Caron-Beaudoin, E.; McGregor, M.J. The Human Health Effects of Unconventional Oil and Gas Development (UOGD): A Scoping Review of Epidemiologic Studies. Can. J. Public Health. 2024, 115, 446–467. [Google Scholar] [CrossRef]
- Czolowski, E.D.; Santoro, R.L.; Srebotnjak, T.; Shonkoff, S.B.C. Toward Consistent Methodology to Quantify Populations in Proximity to Oil and Gas Development: A National Spatial Analysis and Review. Environ. Health Perspect. 2017, 125, 086004. [Google Scholar] [CrossRef]
- Cushing, L.J.; Chau, K.; Franklin, M.; Johnston, J.E. Up in Smoke: Characterizing the Population Exposed to Flaring from Unconventional Oil and Gas Development in the Contiguous US. Environ. Res. Lett. 2021, 16, 034032. [Google Scholar] [CrossRef]
- Johnston, J.E.; Chau, K.; Franklin, M.; Cushing, L. Environmental Justice Dimensions of Oil and Gas Flaring in South Texas: Disproportionate Exposure among Hispanic Communities. Environ. Sci. Technol. 2020, 54, 6289–6298. [Google Scholar] [CrossRef]
- Gonzalez, D.J.X.; Morton, C.M.; Hill, L.A.L.; Michanowicz, D.R.; Rossi, R.J.; Shonkoff, S.B.C.; Casey, J.A.; Morello-Frosch, R. Temporal Trends of Racial and Socioeconomic Disparities in Population Exposures to Upstream Oil and Gas Development in California. GeoHealth 2023, 7, e2022GH000690. [Google Scholar] [CrossRef]
- Johnston, J.E.; Quist, A.J.L.; Navarro, S.; Farzan, S.F.; Shamasunder, B. Cardiovascular Health and Proximity to Urban Oil Drilling in Los Angeles, California. J. Expo. Sci. Environ. Epidemiol. 2023, 34, 505–511. [Google Scholar] [CrossRef] [PubMed]
- McKenzie, L.; Allshouse, W.B.; Abrahams, B.; Tompkins, C. Oil and Gas Development Exposure and Atrial Fibrillation Exacerbation: A Retrospective Study of Atrial Fibrillation Exacerbation Using Colorado’s All Payer Claims Dataset. Front. Epidemiol. 2024, 4, 1379271. [Google Scholar] [CrossRef] [PubMed]
- Bushong, A.; McKeon, T.; Boland, M.R.; Field, J. Publicly Available Data Reveals Association between Asthma Hospitalizations and Unconventional Natural Gas Development in Pennsylvania. PLoS ONE 2022, 17, e0265513. [Google Scholar] [CrossRef] [PubMed]
- Petrinex. Petrinex—Public Data Access. Available online: https://www.petrinex.ca/PD/Pages/default.aspx (accessed on 19 May 2023).
- Government of Canada. National Inventory Report: Greenhouse Gas Sources and Sinks in Canada; En81-4E-PDF; Government of Canada Publications: Ottawa, ON, Canada, 2024. Available online: https://publications.gc.ca/site/eng/9.506002/publication.html (accessed on 25 February 2023).
- Chan, E.; Worthy, D.E.J.; Chan, D.; Ishizawa, M.; Moran, M.D.; Delcloo, A.; Vogel, F. Eight-Year Estimates of Methane Emissions from Oil and Gas Operations in Western Canada Are Nearly Twice Those Reported in Inventories. Environ. Sci. Technol. 2020, 54, 14899–14909. [Google Scholar] [CrossRef]
- MacKay, K.; Lavoie, M.; Bourlon, E.; Atherton, E.; O’Connell, E.; Baillie, J.; Fougère, C.; Risk, D. Methane Emissions from Upstream Oil and Gas Production in Canada Are Underestimated. Sci. Rep. 2021, 11, 8041. [Google Scholar] [CrossRef]
- Festa-Bianchet, S.A.; Tyner, D.R.; Seymour, S.P.; Johnson, M.R. Methane Venting at Cold Heavy Oil Production with Sand (CHOPS) Facilities Is Significantly Underreported and Led by High-Emitting Wells with Low or Negative Value. Environ. Sci. Technol. 2023, 57, 3021–3030. [Google Scholar] [CrossRef]
- Johnson, M.R.; Tyner, D.R.; Conley, S.; Schwietzke, S.; Zavala-Araiza, D. Comparisons of Airborne Measurements and Inventory Estimates of Methane Emissions in the Alberta Upstream Oil and Gas Sector. Environ. Sci. Technol. 2017, 51, 13008–13017. [Google Scholar] [CrossRef]
- Seymour, S.P.; Xie, D.; Li, H.Z.; MacKay, K. Sources and Reliability of Reported Methane Reductions from the Oil and Gas Industry in Alberta, Canada. Elem. Sci. Anthr. 2022, 10, 00073. [Google Scholar] [CrossRef]
- Williams, J.P.; Regehr, A.; Kang, M. Methane Emissions from Abandoned Oil and Gas Wells in Canada and the United States. Environ. Sci. Technol. 2021, 55, 563–570. [Google Scholar] [CrossRef]
- DiGiulio, D.C.; Rossi, R.J.; Lebel, E.D.; Bilsback, K.R.; Michanowicz, D.R.; Shonkoff, S.B.C. Chemical Characterization of Natural Gas Leaking from Abandoned Oil and Gas Wells in Western Pennsylvania. ACS Omega 2023, 8, 19443–19454. [Google Scholar] [CrossRef]
- El Hachem, K.; Kang, M. Methane and Hydrogen Sulfide Emissions from Abandoned, Active, and Marginally Producing Oil and Gas Wells in Ontario, Canada. Sci. Total Environ. 2022, 823, 153491. [Google Scholar] [CrossRef] [PubMed]
- Environment and Climate Change Canada (ECCC). Canada’s Air Pollutant Emissions Inventory Report; En81-30E-PDF; Government of Canada Publications: Gatineau, QC, Canada, 2021; Available online: https://publications.gc.ca/site/eng/9.869731/publication.html (accessed on 1 February 2023).
- Statistics Canada Dissemination Area Boundary Files. Available online: https://www150.statcan.gc.ca/n1/en/catalogue/92-169-X (accessed on 19 May 2023).
- Gonzalez, D.J.X.; Francis, C.K.; Shaw, G.M.; Cullen, M.R.; Baiocchi, M.; Burke, M. Upstream Oil and Gas Production and Ambient Air Pollution in California. Sci. Total Environ. 2022, 806, 150298. [Google Scholar] [CrossRef]
- Rabinowitz, P.M.; Slizovskiy, I.B.; Lamers, V.; Trufan, S.J.; Holford, T.R.; Dziura, J.D.; Peduzzi, P.N.; Kane, M.J.; Reif, J.S.; Weiss, T.R.; et al. Proximity to Natural Gas Wells and Reported Health Status: Results of a Household Survey in Washington County, Pennsylvania. Environ. Health Perspect. 2015, 123, 21–26. [Google Scholar] [CrossRef]
- Statistics Canada. Guide to the Census of Population, 2016; Statistics Canada: Ottawa, ON, Canada, 2016. [Google Scholar]
- Caron-Beaudoin, É.; Whitworth, K.W.; Bosson-Rieutort, D.; Wendling, G.; Liu, S.; Verner, M.-A. Density and Proximity to Hydraulic Fracturing Wells and Birth Outcomes in Northeastern British Columbia, Canada. J. Expo. Sci. Environ. Epidemiol. 2021, 31, 53–61. [Google Scholar] [CrossRef]
- Tjepkema, M.; Christidis, T.; Bushnik, T.; Pinault, L. Cohort Profile: The Canadian Census Health and Environment Cohorts (CanCHECs). Health Rep. 2019, 30, 18–26. [Google Scholar] [CrossRef]
- Canadian Institute for Health Information. DAD Data Elements, 2022–2023; Canadian Institute for Health Information: Ottawa, ON, Canada, 2022. [Google Scholar]
- Olaniyan, T.; Pinault, L.; Li, C.; van Donkelaar, A.; Meng, J.; Martin, R.V.; Hystad, P.; Robichaud, A.; Ménard, R.; Tjepkema, M.; et al. Ambient Air Pollution and the Risk of Acute Myocardial Infarction and Stroke: A National Cohort Study. Environ. Res. 2022, 204, 111975. [Google Scholar] [CrossRef]
- Cakmak, S.; Toyib, O.; Hebbern, C.; Mitchell, K.; Cakmak, J.D.; Lavigne, E.; Tjepkema, M.; Zhao, N. Industrial Air Pollutant Emissions and Mortality from Alzheimer’s Disease in Canada. Hyg. Environ. Health Adv. 2022, 4, 100019. [Google Scholar] [CrossRef]
- World Health Organization. ICD-10: International Statistical Classification of Diseases and Related Health Problems Tenth Revision; ICD-10; World Health Organization: Geneva, Switzerland, 2004. [Google Scholar]
- Environment and Climate Change Canada (ECCC). National Air Pollution Surveillance Program. Available online: https://www.canada.ca/en/environment-climate-change/services/air-pollution/monitoring-networks-data/national-air-pollution-program.html (accessed on 21 June 2023).
- Environment and Climate Change Canada (ECCC). Canadian Environmental Sustainability Indicators: Air Pollutant Emissions; Environment and Climate Change Canada: Gatineau, QC, Canada, 2023. [Google Scholar]
- Goldberg, D.L.; Anenberg, S.C.; Kerr, G.H.; Mohegh, A.; Lu, Z.; Streets, D.G. TROPOMI NO2 in the United States: A Detailed Look at the Annual Averages, Weekly Cycles, Effects of Temperature, and Correlation with Surface NO2 Concentrations. Earths Future 2021, 9, e2020EF001665. [Google Scholar] [CrossRef]
- Sun, K.; Zhu, L.; Cady-Pereira, K.; Chan Miller, C.; Chance, K.; Clarisse, L.; Coheur, P.-F.; González Abad, G.; Huang, G.; Liu, X.; et al. A Physics-Based Approach to Oversample Multi-Satellite, Multispecies Observations to a Common Grid. Atmos. Meas. Tech. 2018, 11, 6679–6701. [Google Scholar] [CrossRef]
- Cooper, J.; Dubey, L.; Hawkes, A. Methane Detection and Quantification in the Upstream Oil and Gas Sector: The Role of Satellites in Emissions Detection, Reconciling and Reporting. Environ. Sci. Atmos. 2022, 2, 9–23. [Google Scholar] [CrossRef]
- Dix, B.; de Bruin, J.; Roosenbrand, E.; Vlemmix, T.; Francoeur, C.; Gorchov-Negron, A.; McDonald, B.; Zhizhin, M.; Elvidge, C.; Veefkind, P.; et al. Nitrogen Oxide Emissions from U.S. Oil and Gas Production: Recent Trends and Source Attribution. Geophys. Res. Lett. 2020, 47, e2019GL085866. [Google Scholar] [CrossRef]
- Goldberg, D.L.; Lu, Z.; Streets, D.G.; de Foy, B.; Griffin, D.; McLinden, C.A.; Lamsal, L.N.; Krotkov, N.A.; Eskes, H. Enhanced Capabilities of TROPOMI NO2: Estimating NOX from North American Cities and Power Plants. Environ. Sci. Technol. 2019, 53, 12594–12601. [Google Scholar] [CrossRef] [PubMed]
- Government of Alberta. Air Indicators—Nitrogen Dioxide|Alberta.Ca. Available online: https://www.alberta.ca/air-indicators-nitrogen-dioxide (accessed on 19 August 2024).
- Alberta Airshed Council. Alberta Airshed Council; 2021. Available online: https://www.alberta.ca/access-air-data (accessed on 23 May 2024).
- Alberta Energy Regulator. Directive 060: Upstream Petroleum Industry Flaring, Incinerating, and Venting; Alberta Energy Regulator: Calgary, AB, Canada, 2022. [Google Scholar]
- Environment and Climate Change Canada. National Inventory Report 1990–2021: Greenhouse Gas Sources and Sinks in Canada; Environment and Climate Change Canada: Toronto, ON, Canada, 2023. [Google Scholar]
- Environment and Climate Change Canada. National Inventory Report 1990–2022: Greenhouse Gas Sources and Sinks in Canada; Environment and Climate Change Canada: Toronto, ON, Canada, 2024. [Google Scholar]
- Zhang, Z.; Sherwin, E.D.; Brandt, A.R. Estimating Global Oilfield-Specific Flaring with Uncertainty Using a Detailed Geographic Database of Oil and Gas Fields. Environ. Res. Lett. 2021, 16, 124039. [Google Scholar] [CrossRef]
- Clearstone Engineering Ltd. Volume 2 Overview of CAC and Other Priority Substance Emissions Inventory; Clearstone Engineering Ltd.: Calgary, AB, Canada, 2014. [Google Scholar]
- Alberta Energy Regulator. ST60B: Upstream Petroleum Industry Flaring and Venting Report: 2022; Alberta Energy Regulator: Calgary, AB, Canada, 2024. [Google Scholar]
- Alberta Energy Regulator. ST60B: Upstream Petroleum Industry Flaring and Venting Report: 2014; Alberta Energy Regulator: Calgary, AB, Canada, 2016. [Google Scholar]
- Fann, N.; Baker, K.R.; Chan, E.A.W.; Eyth, A.; Macpherson, A.; Miller, E.; Snyder, J. Assessing Human Health PM2.5 and Ozone Impacts from U.S. Oil and Natural Gas Sector Emissions in 2025. Environ. Sci. Technol. 2018, 52, 8095–8103. [Google Scholar] [CrossRef]
- Dix, B.; Francoeur, C.; Li, M.; Serrano-Calvo, R.; Levelt, P.F.; Veefkind, J.P.; McDonald, B.C.; de Gouw, J. Quantifying NOx Emissions from U.S. Oil and Gas Production Regions Using TROPOMI NO2. ACS Earth Space Chem. 2022, 6, 403–414. [Google Scholar] [CrossRef]
- Maasakkers, J.D.; Varon, D.J.; Elfarsdóttir, A.; McKeever, J.; Jervis, D.; Mahapatra, G.; Pandey, S.; Lorente, A.; Borsdorff, T.; Foorthuis, L.R.; et al. Using Satellites to Uncover Large Methane Emissions from Landfills. Sci. Adv. 2022, 8, eabn9683. [Google Scholar] [CrossRef]
- van Donkelaar, A.; Hammer, M.S.; Bindle, L.; Brauer, M.; Brook, J.R.; Garay, M.J.; Hsu, N.C.; Kalashnikova, O.V.; Kahn, R.A.; Lee, C.; et al. Monthly Global Estimates of Fine Particulate Matter and Their Uncertainty. Environ. Sci. Technol. 2021, 55, 15287–15300. [Google Scholar] [CrossRef]
- Pu, D.; Zhu, L.; Shen, H.; Smedt, I.D.; Ye, J.; Li, J.; Shu, L.; Wang, D.; Li, X.; Zuo, X.; et al. Integrated Satellite Observations Unravel the Relationship between Urbanization and Anthropogenic Non-Methane Volatile Organic Compound Emissions Globally. npj Clim. Atmos. Sci. 2024, 7, 125. [Google Scholar] [CrossRef]
- Sorensen, M. Rural Alberta Profile—A Fifteen-Year Census Analysis. In Prepared for Rural Development, Government of Alberta, Rural and Co-Operatives Secretariat, Government of Canada; Agriculture and Agri-Food Canada: Edmonton, AB, Canada, 2010. [Google Scholar]
- Angel, A.C. Voices from the Shadows: Investigating the Identity and Wellbeing of Male Mobile Workers in the Contemporary ‘Boom-Sphere’ Context of the Alberta Oil Sands. Available online: https://era.library.ualberta.ca/items/5c0b7c3e-e24f-452e-9f9b-035671a22ce6 (accessed on 29 September 2024).
- Employment and Labour Data. Available online: https://careersinenergy.ca/employment-and-labour-data/ (accessed on 29 September 2024).
- Onyije, F.M.; Hosseini, B.; Togawa, K.; Schüz, J.; Olsson, A. Cancer Incidence and Mortality among Petroleum Industry Workers and Residents Living in Oil Producing Communities: A Systematic Review and Meta-Analysis. Int. J. Environ. Res. Public. Health 2021, 18, 4343. [Google Scholar] [CrossRef]
- Robinson, T.; Sussell, A.; Yeoman, K.; Retzer, K.; Poplin, G. Health Conditions in Retired Manual Labor Miners and Oil and Gas Extraction Workers: National Health Interview Survey, 2007–2017. Am. J. Ind. Med. 2021, 64, 118–126. [Google Scholar] [CrossRef]
- Gonzalez, D.J.X.; Sherris, A.R.; Yang, W.; Stevenson, D.K.; Padula, A.M.; Baiocchi, M.; Burke, M.; Cullen, M.R.; Shaw, G.M. Oil and Gas Production and Spontaneous Preterm Birth in the San Joaquin Valley, CA: A Case–Control Study. Environ. Epidemiol. 2020, 4, e099. [Google Scholar] [CrossRef] [PubMed]
- Denham, A.; Willis, M.D.; Croft, D.P.; Liu, L.; Hill, E.L. Acute Myocardial Infarction Associated with Unconventional Natural Gas Development: A Natural Experiment. Environ. Res. 2021, 195, 110872. [Google Scholar] [CrossRef] [PubMed]
- Apergis, N.; Mustafa, G.; Dastidar, S.G. An Analysis of the Impact of Unconventional Oil and Gas Activities on Public Health: New Evidence across Oklahoma Counties. Energy Econ. 2021, 97, 105223. [Google Scholar] [CrossRef]
- Dales, R.E.; Spitzer, W.O.; Suissa, S.; Schechter, M.T.; Tousignant, P.; Steinmetz, N. Respiratory Health of a Population Living Downwind from Natural Gas Refineries. Am. Rev. Respir. Dis. 1989, 139, 595–600. [Google Scholar] [CrossRef]
- de Bont, J.; Jaganathan, S.; Dahlquist, M.; Persson, Å.; Stafoggia, M.; Ljungman, P. Ambient Air Pollution and Cardiovascular Diseases: An Umbrella Review of Systematic Reviews and Meta-Analyses. J. Intern. Med. 2022, 291, 779–800. [Google Scholar] [CrossRef]
- de Vries, W. Impacts of Nitrogen Emissions on Ecosystems and Human Health: A Mini Review. Curr. Opin. Environ. Sci. Health 2021, 21, 100249. [Google Scholar] [CrossRef]
- Pope, C.A.I.; Burnett, R.T. Confounding in Air Pollution Epidemiology: The Broader Context. Epidemiology 2007, 18, 424. [Google Scholar] [CrossRef]
- Jerrett, M.; Burnett, R.T.; Beckerman, B.S.; Turner, M.C.; Krewski, D.; Thurston, G.; Martin, R.V.; van Donkelaar, A.; Hughes, E.; Shi, Y.; et al. Spatial Analysis of Air Pollution and Mortality in California. Am. J. Respir. Crit. Care Med. 2013, 188, 593–599. [Google Scholar] [CrossRef]
- Mainka, A.; Żak, M. Synergistic or Antagonistic Health Effects of Long- and Short-Term Exposure to Ambient NO2 and PM2.5: A Review. Int. J. Environ. Res. Public. Health 2022, 19, 14079. [Google Scholar] [CrossRef]
- Goldberg, D.L.; Anenberg, S.; Mohegh, A.; Lu, Z.; Streets, D.G. TROPOMI NO2 in the United States: A Detailed Look at the Annual Averages, Weekly Cycles, Effects of Temperature, and Correlation with PM2.5. 2020. Available online: https://essopenarchive.org/doi/full/10.1002/essoar.10503422.1 (accessed on 23 August 2024).
- Cooper, M.J.; Martin, R.V.; McLinden, C.A.; Brook, J.R. Inferring Ground-Level Nitrogen Dioxide Concentrations at Fine Spatial Resolution Applied to the TROPOMI Satellite Instrument. Environ. Res. Lett. 2020, 15, 104013. [Google Scholar] [CrossRef]
- Li, F.X.; Robson, P.J.; Ashbury, F.D.; Hatcher, J.; Bryant, H.E. Smoking Frequency, Prevalence and Trends, and Their Socio-Demographic Associations in Alberta, Canada. Can. J. Public Health. 2009, 100, 453–458. [Google Scholar] [CrossRef]
- Alberta Government. Rural Health Action Plan 2024–2027; Alberta Health: Edmonton, AB, Canada, 2023.


| Variables | Alberta |
|---|---|
| Population, n | 4,067,175 |
| Census dissemination areas, n | 5803 |
| Race/ethnicity, n (%) | |
| European, n (% population) | 2,875,370 (70.6) |
| Aboriginal identity, n (% population) | 258,640 (6.4) |
| Visible minority, n (% population) | 933,165 (23.0) |
| Latin American, n (% of Visible minority) | 55,090 (5.9) |
| Black n, (% of Visible minority) | 129,390 (13.9) |
| Asian n, (% of Visible minority) | 487,535 (52.2) |
| Other n, (% of Visible minority) | 261,150 (28.0) |
| Education, n (% population aged 15 years and over) | |
| No diploma | 540,775 (16.9) |
| Secondary high school diploma | 895,885 (27.9) |
| Post-secondary diploma | 1,769,500 (55.2) |
| Renter-occupied households, n (% household type) | 412,150 (30.0) |
| Income, n (% population aged 15 years and over) | |
| Under CAD 30,000 | 1,139,730 (37.4) |
| CAD 30,000 to CAD 60,000 | 840,125 (27.5) |
| CAD 60,000 to CAD 90,000 | 504,200 (16.5) |
| Over CAD 90,000 | 569,420 (18.6) |
| Age characteristics, n (% population) | |
| 0–4 years | 266,515 (6.6) |
| 5 to 9 years | 270,715 (6.7) |
| 10 to 14 years | 241,920 (5.9) |
| 65 years and over | 500,215 (12.3) |
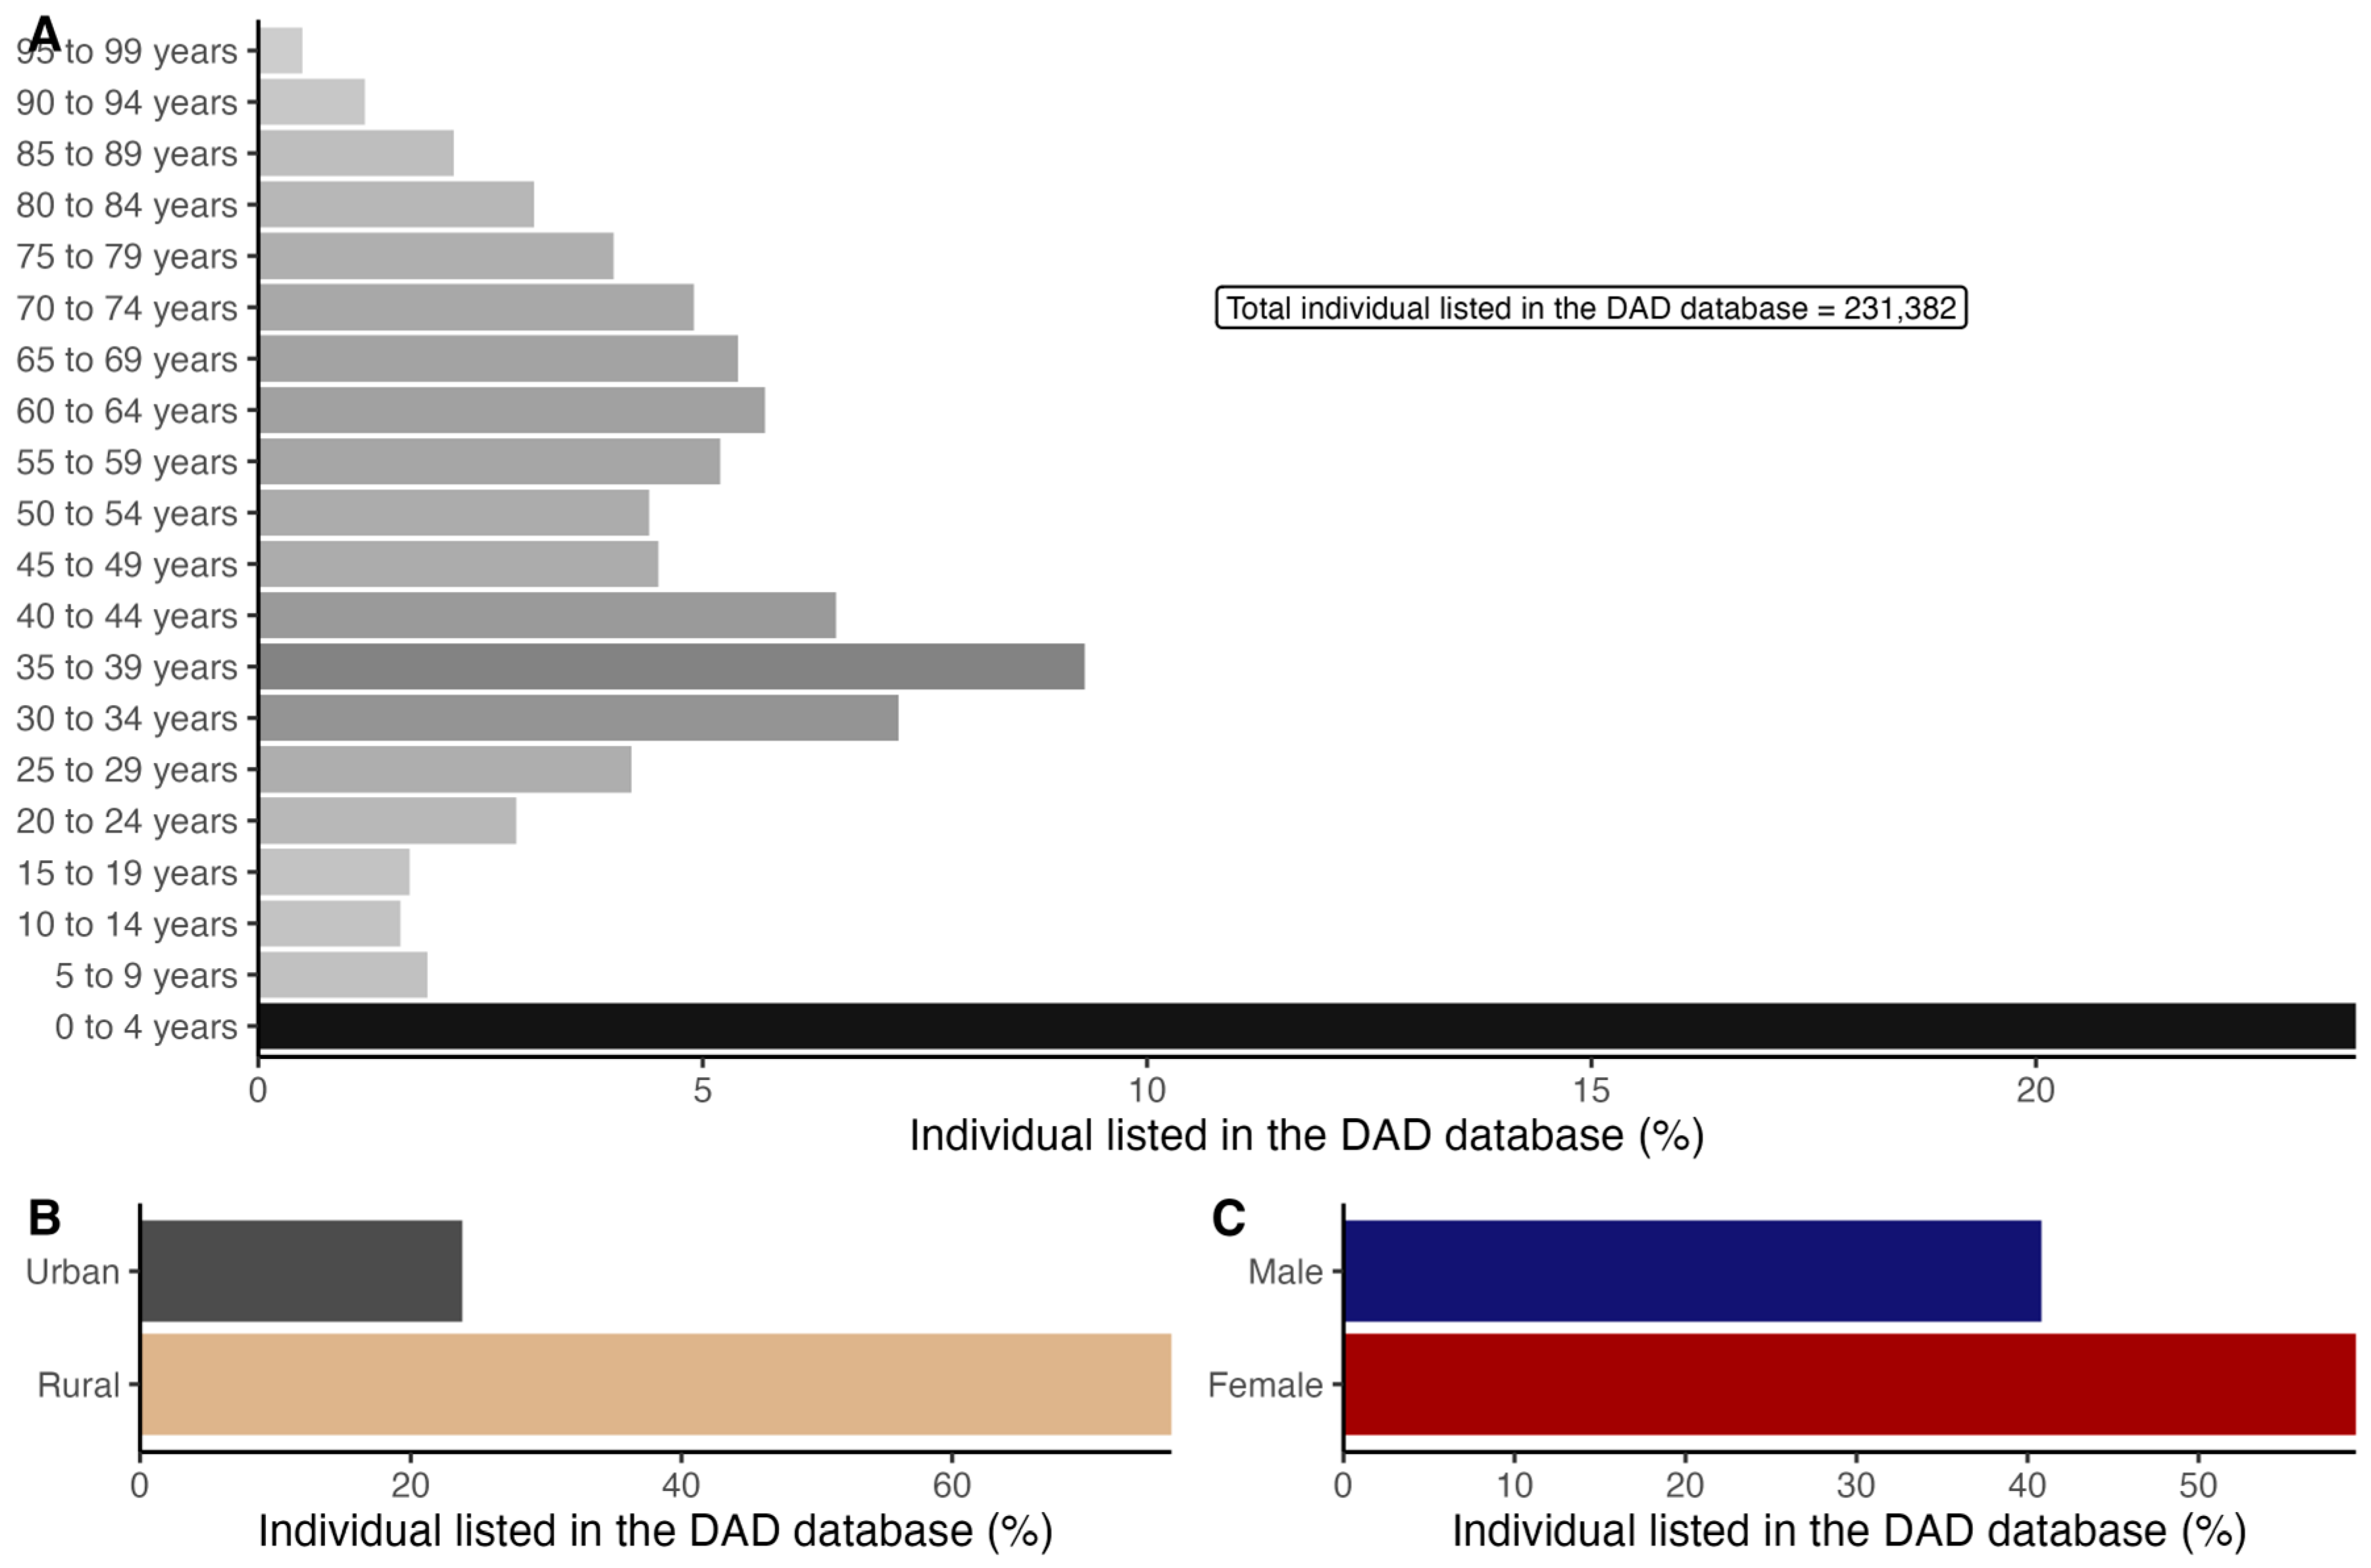
| Predictors | Cardiovascular | Respiratory |
|---|---|---|
| Sex [M] | 2.11 [2.05–2.16] | 1.59 [1.54–1.63] |
| Age | 1.42 [1.41–1.42] | 1.08 [1.08–1.09] |
| Location [rural] | 1.10 [1.04–1.15] | 1.44 [1.37–1.51] |
| Income | ||
| QABTIPPE [2] | 0.93 [0.89–0.97] | 0.77 [0.74–0.80] |
| QABTIPPE [3] | 0.93 [0.89–0.97] | 0.75 [0.72–0.79] |
| QABTIPPE [4] | 0.94 [0.90–0.98] | 0.71 [0.68–0.74] |
| QABTIPPE [5] | 0.88 [0.84–0.92] | 0.67 [0.64–0.70] |
| TROPOMI NO2 | ||
| Low | 1.03 [0.99–1.07] | 0.90 [0.86–0.93] |
| Medium | 1.03 [0.98–1.08] | 0.83 [0.78–0.87] |
| High | 1.13 [1.08–1.19] | 0.86 [0.82–0.91] |
| Active Well Density | ||
| Low | 1.21 [1.13–1.29] | 1.10 [1.03–1.17] |
| Medium | 1.05 [0.98–1.12] | 0.92 [0.86–0.98] |
| High | 1.04 [0.97–1.11] | 0.94 [0.88–1.01] |
| Abandoned Well Density | ||
| Low | 1.03 [0.97–1.08] | 1.13 [1.07–1.19] |
| Medium | 1.09 [1.03–1.15] | 1.09 [1.07–1.16] |
| High | 1.00 [0.96–1.06] | 1.10 [1.05–1.16] |
Disclaimer/Publisher’s Note: The statements, opinions and data contained in all publications are solely those of the individual author(s) and contributor(s) and not of MDPI and/or the editor(s). MDPI and/or the editor(s) disclaim responsibility for any injury to people or property resulting from any ideas, methods, instructions or products referred to in the content. |
© 2024 by the authors. Licensee MDPI, Basel, Switzerland. This article is an open access article distributed under the terms and conditions of the Creative Commons Attribution (CC BY) license (https://creativecommons.org/licenses/by/4.0/).
Share and Cite
Lavoie, M.; Risk, D.; Rainham, D. Sociodemographic and Population Exposure to Upstream Oil and Gas Operations in Canada. Int. J. Environ. Res. Public Health 2024, 21, 1692. https://doi.org/10.3390/ijerph21121692
Lavoie M, Risk D, Rainham D. Sociodemographic and Population Exposure to Upstream Oil and Gas Operations in Canada. International Journal of Environmental Research and Public Health. 2024; 21(12):1692. https://doi.org/10.3390/ijerph21121692
Chicago/Turabian StyleLavoie, Martin, David Risk, and Daniel Rainham. 2024. "Sociodemographic and Population Exposure to Upstream Oil and Gas Operations in Canada" International Journal of Environmental Research and Public Health 21, no. 12: 1692. https://doi.org/10.3390/ijerph21121692
APA StyleLavoie, M., Risk, D., & Rainham, D. (2024). Sociodemographic and Population Exposure to Upstream Oil and Gas Operations in Canada. International Journal of Environmental Research and Public Health, 21(12), 1692. https://doi.org/10.3390/ijerph21121692