Association between Non-Dietary Cardiovascular Health and Expenditures Related to Acute Coronary Syndrome in the US between 2008–2018
Abstract
1. Introduction
2. Materials and Methods
2.1. Study Design
2.2. Study Population
2.3. Primary Outcome
2.4. Measuring Non-Dietary Cardiovascular Health
2.5. Covariates
2.6. Statistical Analysis
- 1st Stage: Two-Part Model (Probit)
- 2nd Stage: Two-Part Model (GLM)
- PExpi: represents the likelihood of healthcare expenditure.
- CVHmetricsi: represents CVH metrics.
- Agei represents the patient’s age.
- I.incomcati represents individuals’ income category based on the Federal poverty level.
- GCCIi: Charlson’s Comorbidity Index.
- Malei: 1 if the subject self-identifies as male, 0 otherwise.
- I.educleveli: indicates the level of highest education attained.
- ACSi: ACS indicator.
- trendi: represents the effect of trend.
- I.insurancei: represents categorical variable for insurance with three categories.
- I.racei: represents the impact of race utilized as a categorical variable.
- YExpi represents the total annual healthcare expenditure.
- ei: Error term with normal distribution (0 = mean, 1 = SD)
3. Results
3.1. Characteristics of the Sample
3.2. Differences between ACS and Non-ACS Populations
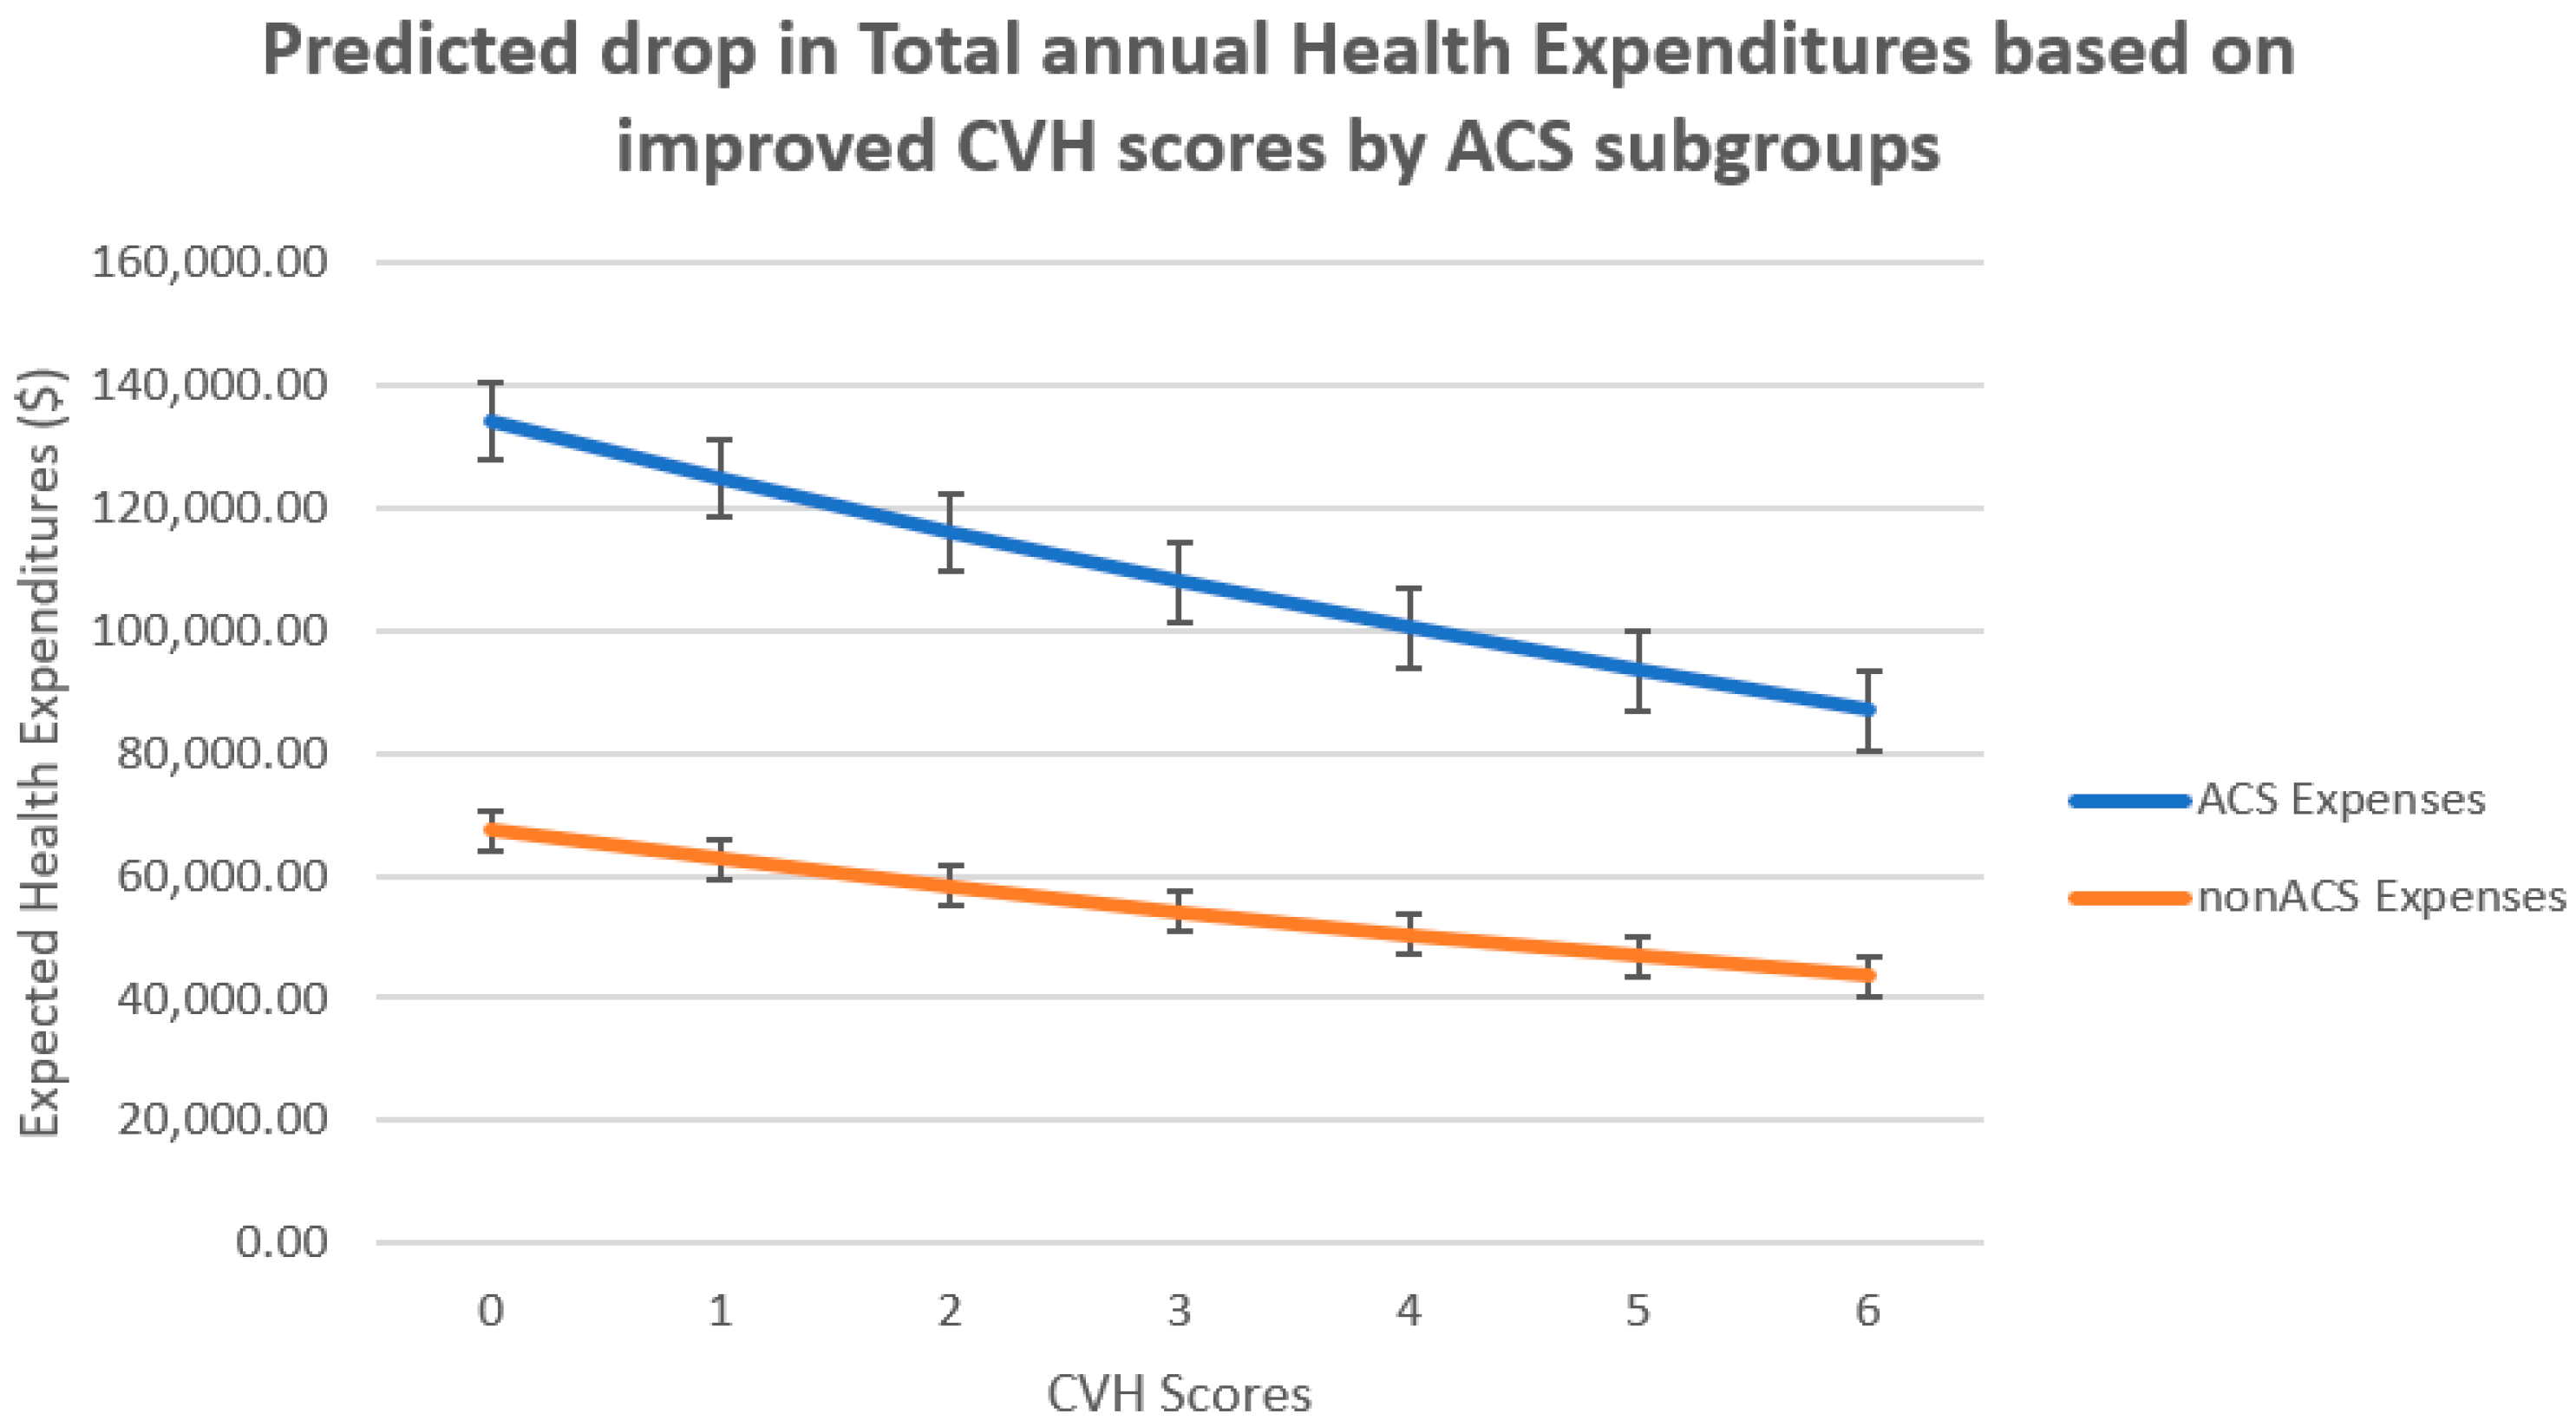
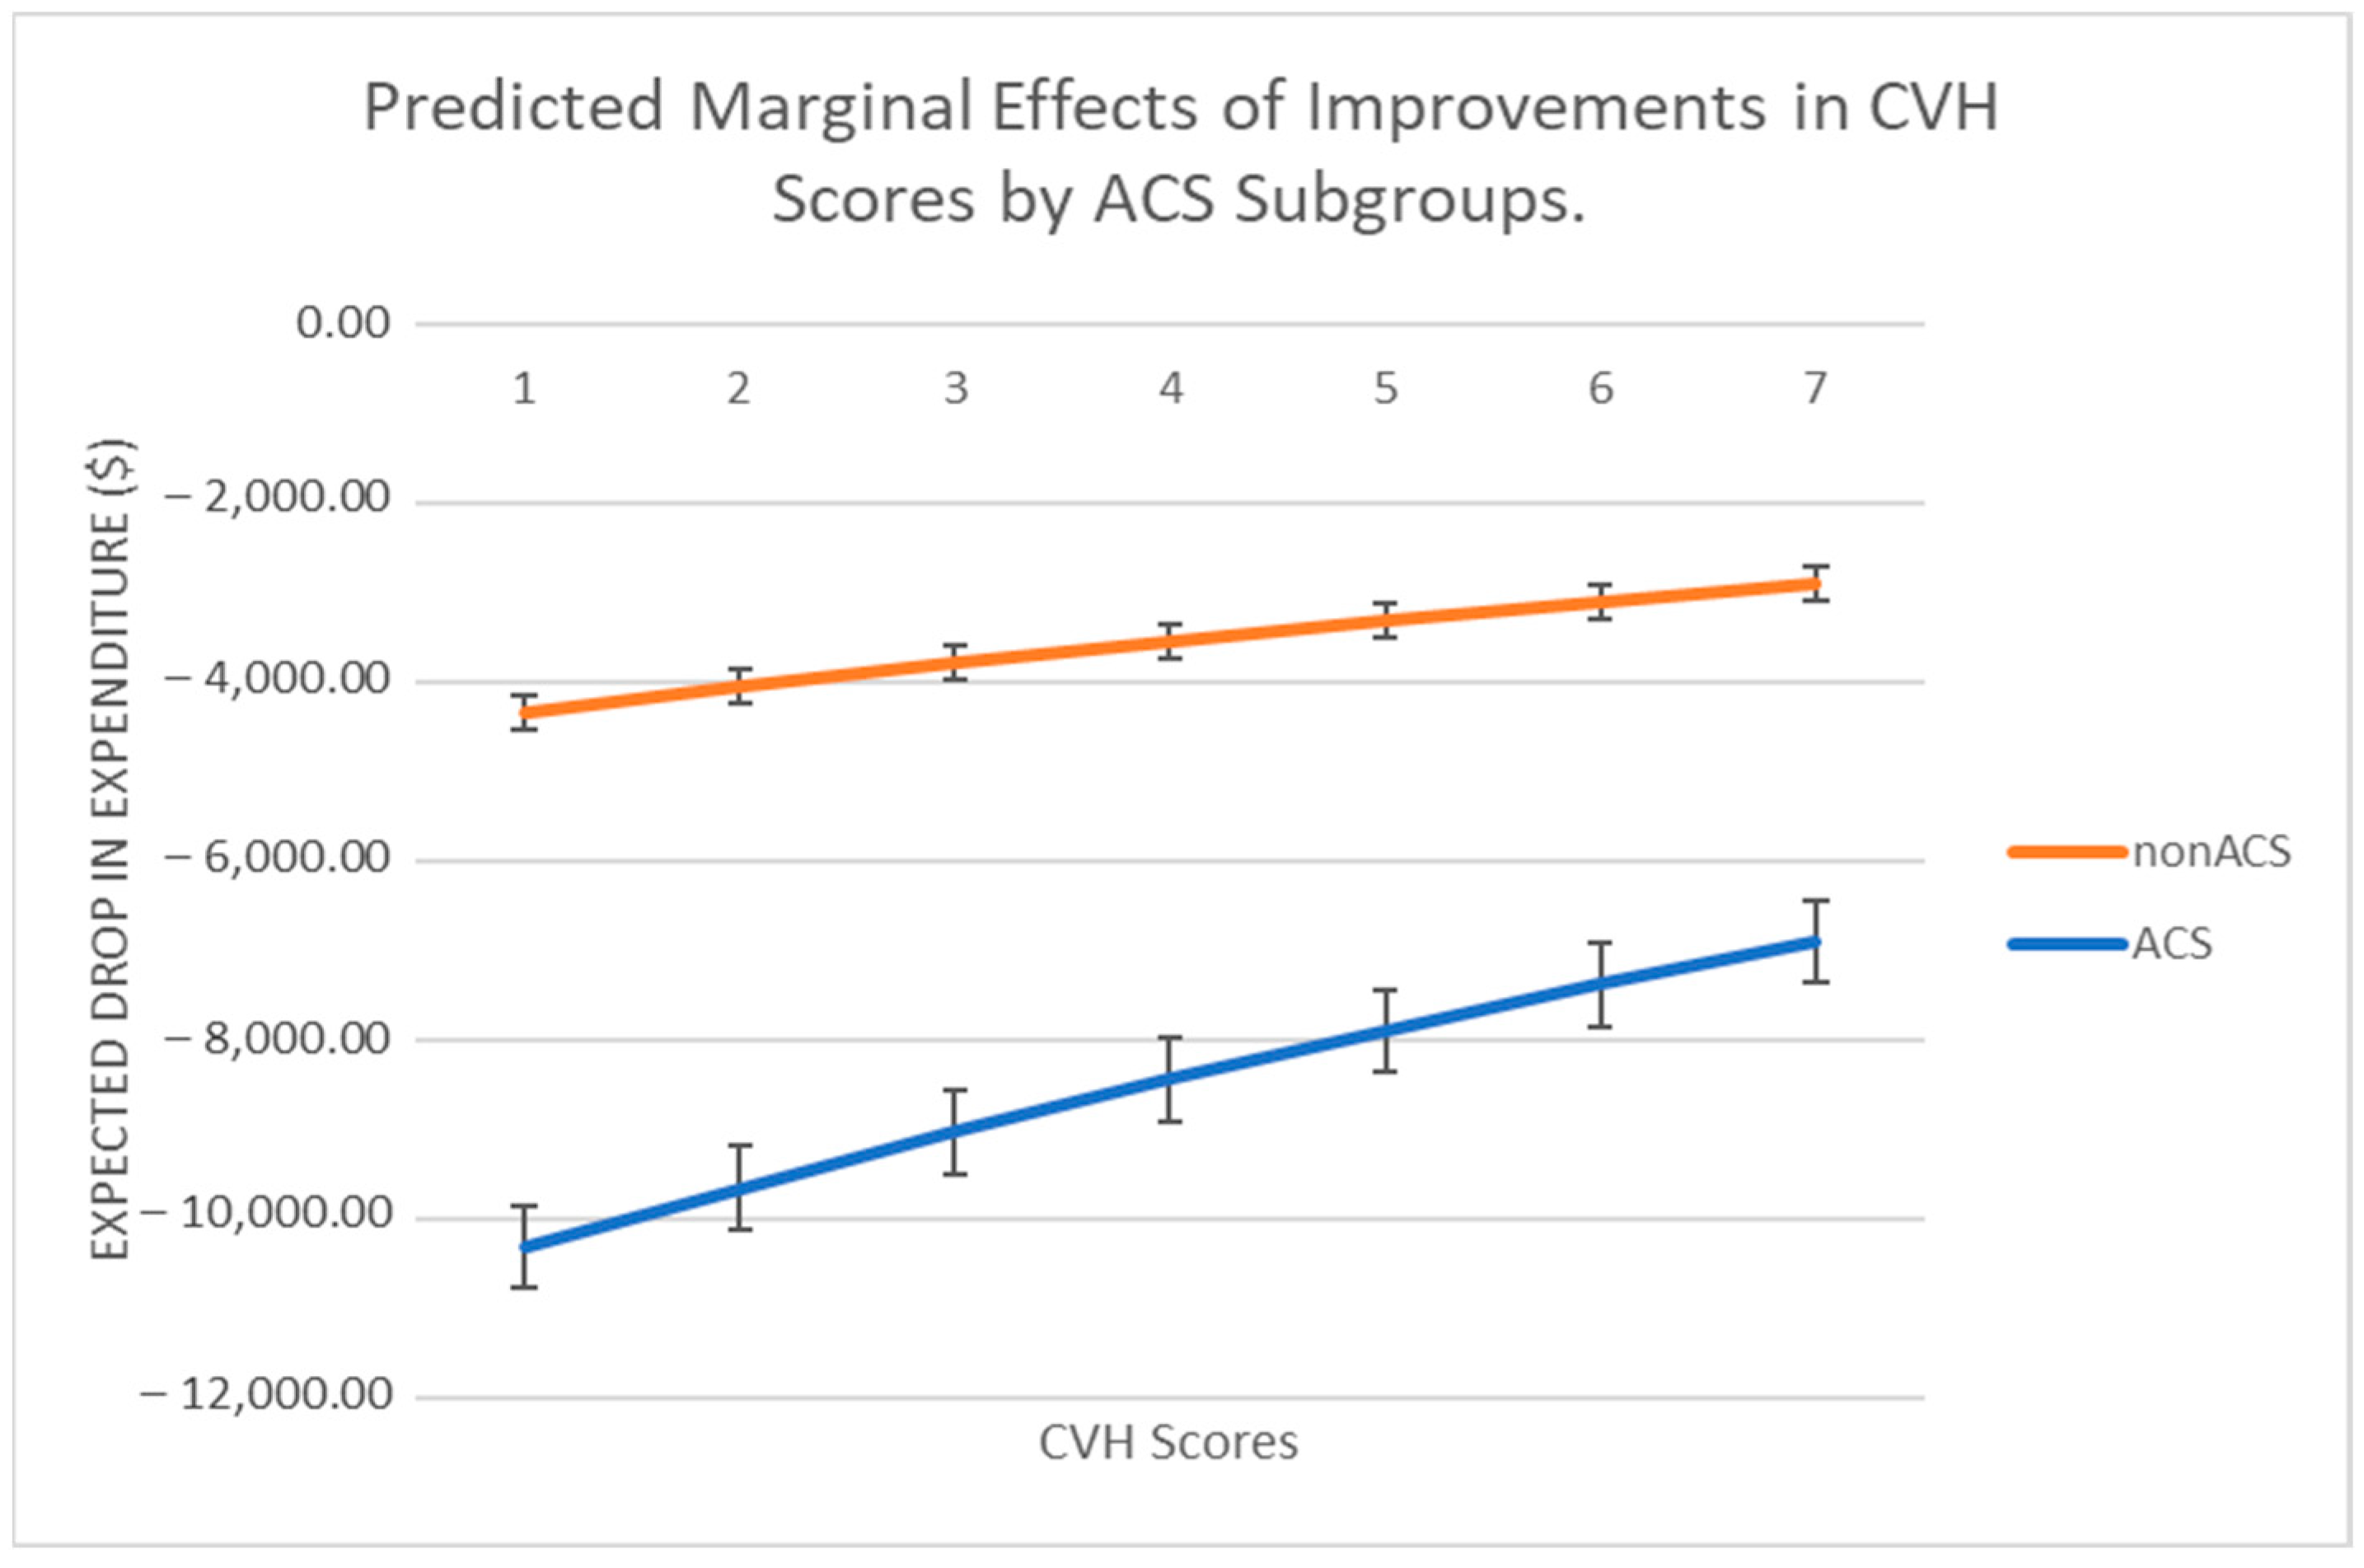
3.3. Association of Cardiovascular Health with Expenditure
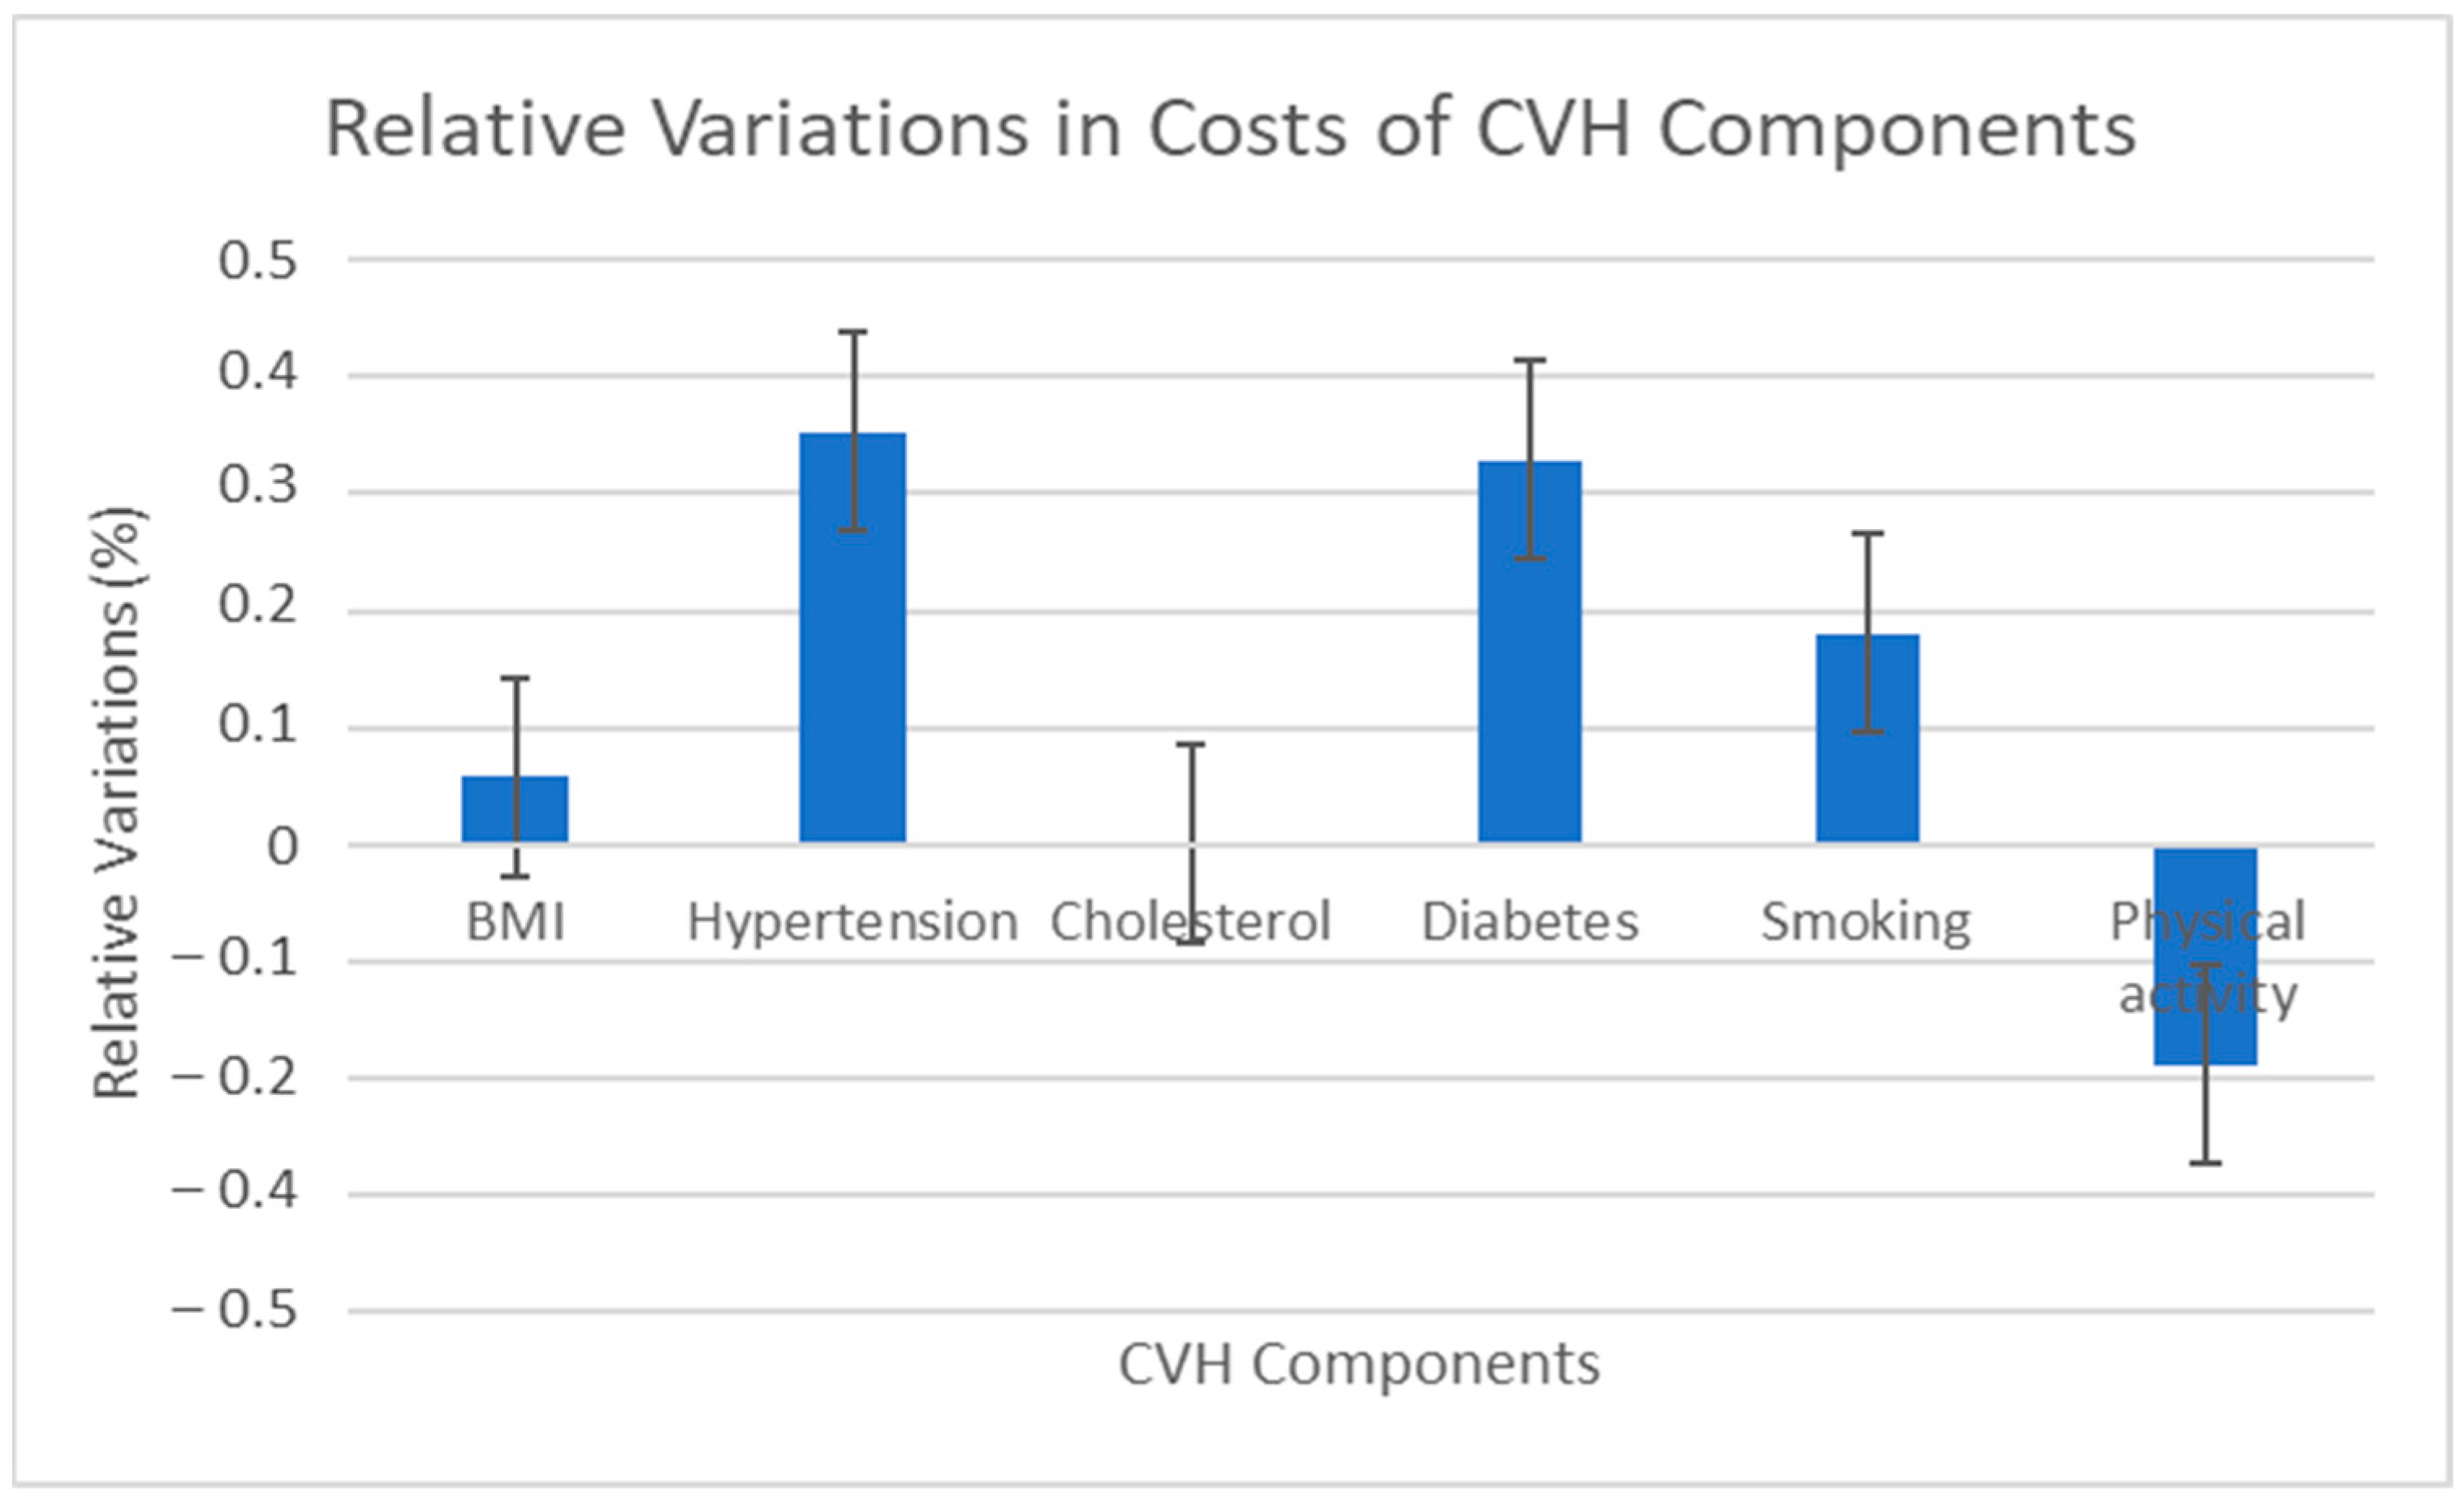
3.4. Relative Variations in Expenditures of Life’s Simple 7 Components
4. Discussion
5. Conclusions
Author Contributions
Funding
Institutional Review Board Statement
Informed Consent Statement
Data Availability Statement
Conflicts of Interest
Appendix A
| ICD-9 CM Codes of Diseases Classified as ACS | ICD-10 CM Codes of Diseases Classified as ACS | ||
|---|---|---|---|
| ICD-9 CM Code | Disease description | ICD-10 CM Code | Disease description |
| 410 | Acute myocardial infarction | I20 | Angina pectoris |
| 411 | Other acute and subacute forms of ischemic heart disease | I21 | Subsequent ST elevation (STEMI) and non-ST elevation (NSTEMI) myocardial infarction |
| 412 | Old myocardial infarction | I22 | Certain current complications following ST elevation (STEMI) and non-ST elevation (NSTEMI) myocardial infarction (within the 28-day period) |
| 413 | Angina pectoris | I23 | Other acute ischemic heart diseases |
| 414 | Other forms of chronic ischemic heart disease | I24 | Chronic ischemic heart disease |
| Probit Model (Positive Expenditures) (SE) | Predicted Change in Expenditures on Health Care (SE) | Dy/Dx Marginal Expenditures ($1000) (SE) | |
|---|---|---|---|
| Had ACS event | 0.173 (0.067–0.280) | 0.850 * (0.772–0.930) | 49.75 * (44.88–54.62) |
| CVH metric (0–6) | −0.010 (−0.028–0.008) | −0.070 * (−0.090–−0.05) | −4.08 * (−5.23–−2.93) |
| ($) <125–200% of FPL | 0.141 * (0.068–0.214) | −0.073 (−0.160–0.013) | −3.79 (−8.79–1.21) |
| ($) 200–400% of FPL | 0.207 * (0.135–0.280) | −0.107 * (−0.183–−0.030) | −5.20 * (−9.92–−1.16) |
| ($) >400% of FPL | 0.286 * (0.210–0.363) | −0.154 * (−0.241–−0.068) | −8.04 * (−12.97–−3.11) |
| GCCI | 0.170 * (0.112–0.228) | 0.530 * (0.476–0.584) | 31.22 * (27.56–34.87) |
| Male | −0.062 * (−0.100–−0.024) | −0.054 * (−0.108–−0.000) | −3.38 * (−6.45–−0.215) |
| Hispanic | −0.029 (−0.081–0.023) | −0.053 (−0.127–0.020) | −3.17 (−7.45–1.103) |
| Black | −0.027 (−0.086–0.032) | 0.130 * (0.056–0.204) | 7.44 * (3.19–11.69) |
| Asian | −0.175 * (−0.259–−0.090) | −0.348 * (−0.457–−0.238) | −20.66 * (−27.07–−14.26) |
| Multi-Race/Ethnic | 0.195 * (0.051–0.338) | 0.102 (−0.046–0.250) | 6.53 (−2.04–15.10) |
| Bachelors/MA | 0.105 * (0.053–0.156) | 0.225 * (0.161–0.286) | 13.28 * (9.62–16.94) |
| Terminal Degree | 0.312 * (0.173–0.451) | 0.228 * (0.013–0.016) | 14.24 * (8.35–20.12) |
| (Age)/10 | 0.054 (0.039–0.071) | 0.140 * (0.131–0.163) | 8.71 * (7.78–9.64) |
| Trend | 0.101 (0.097–0.104) | 0.003 (−0.005–0.011) | 0.500 * (0.37–0.961) |
| Private Insurance | 0.143 (0.068–0.219) | 0.337 (0.233–0.442) | 20.01 * (13.93–26.03) |
| Public Insurance | 0.341 (0.269–0.412) | 0.737 (0.632–0.842) | 43.71 * (37.45–4997) |
References
- Go, A.S.; Mozaffarian, D.; Roger, V.L.; Benjamin, E.; Berry, J.D.; Borden, W.B.; Bravata, D.M.; Dai, S.; Ford, E.S.; Fox, C.S.; et al. Executive Summary: Heart Disease and Stroke Statistics—2013 Update. Circulation 2013, 127, 143–152. [Google Scholar] [CrossRef]
- Makki, N.; Brennan, T.M.; Girotra, S. Acute Coronary Syndrome. J. Intensive Care Med. 2015, 30, 186–200. [Google Scholar] [CrossRef]
- Cowper, P.A.; Knight, J.D.; Davidson-Ray, L.; Peterson, E.D.; Wang, T.Y.; Mark, D.B. Acute and 1-Year Hospitalization Costs for Acute Myocardial Infarction Treated with Percutaneous Coronary Intervention: Results from the TRANSLATE-ACS Registry. J. Am. Heart Assoc. 2019, 8, e011322. [Google Scholar] [CrossRef]
- Zhao, Z.; Winget, M. Economic burden of illness of acute coronary syndromes: Medical and productivity costs. BMC Health Serv. Res. 2011, 11, 35. [Google Scholar] [CrossRef]
- Silverio, A.; Cancro, F.P.; Esposito, L.; Bellino, M.; D’elia, D.; Verdoia, M.; Vassallo, M.G.; Ciccarelli, M.; Vecchione, C.; Galasso, G.; et al. Secondary Cardiovascular Prevention after Acute Coronary Syndrome: Emerging Risk Factors and Novel Therapeutic Targets. J. Clin. Med. 2023, 12, 2161. [Google Scholar] [CrossRef]
- Page, R.L., 2nd; Ghushchyan, V.; Van Den Bos, J.; Gray, T.J.; Hoetzer, G.L.; Bhandary, D.; Nair, K.V. The cost of inpatient death associated with acute coronary syndrome. Vasc. Health Risk Manag. 2016, 12, 13–21. [Google Scholar] [CrossRef]
- Cawley, J.; Biener, A.; Meyerhoefer, C.; Ding, Y.; Zvenyach, T.; Smolarz, B.G.; Ramasamy, A. Direct medical costs of obesity in the United States and the most populous states. J. Manag. Care Spéc. Pharm. 2021, 27, 354–366. [Google Scholar] [CrossRef]
- Collado, L.; Brownell, I. The crippling financial toxicity of cancer in the United States. Cancer Biol. Ther. 2019, 20, 1301–1303. [Google Scholar] [CrossRef]
- Singh, J.; Valero-Elizondo, J.; Salami, J.A.; Warraich, H.J.; Ogunmoroti, O.; Spatz, E.S.; Desai, N.; Rana, J.S.; Virani, S.S.; Blankstein, R.; et al. Favorable Modifiable Cardiovascular Risk Profile Is Associated with Lower Healthcare Costs among Cancer Patients: The 2012–2013 Medical Expenditure Panel Survey. J. Am. Heart Assoc. 2018, 7, e007874. [Google Scholar] [CrossRef]
- Mok, Y.; Sang, Y.; Ballew, S.H.; Rebholz, C.M.; Rosamond, W.D.; Heiss, G.; Folsom, A.R.; Coresh, J.; Matsushita, K. American Heart Association’s Life’s Simple 7 at Middle Age and Prognosis after Myocardial Infarction in Later Life. J. Am. Heart Assoc. 2018, 7, e007658. [Google Scholar] [CrossRef]
- Bancks, M.P.; Allen, N.B.; Dubey, P.; Launer, L.J.; Lloyd-Jones, D.M.; Reis, J.P.; Sidney, S.; Yano, Y.; Schreiner, P.J. Cardiovascular health in young adulthood and structural brain MRI in midlife. Neurology 2017, 89, 680–686. [Google Scholar] [CrossRef]
- Uijl, A.; Koudstaal, S.; Vaartjes, I.; Boer, J.M.; Verschuren, W.M.; van der Schouw, Y.T.; Asselbergs, F.W.; Hoes, A.W.; Sluijs, I. Risk for Heart Failure: The Opportunity for Prevention with the American Heart Association’s Life’s Simple 7. JACC Heart Fail. 2019, 7, 637–647. [Google Scholar] [CrossRef]
- Aaron, K.J.; Colantonio, L.; Deng, L.; Judd, S.E.; Locher, J.L.; Safford, M.M.; Cushman, M.; Kilgore, M.L.; Becker, D.J.; Muntner, P. Cardiovascular Health and Healthcare Utilization and Expenditures among Medicare Beneficiaries: The REasons for Geographic And Racial Differences in Stroke (REGARDS) Study. J. Am. Heart Assoc. 2017, 6, e005106. [Google Scholar] [CrossRef]
- Osondu, C.U.; Aneni, E.C.; Valero-Elizondo, J.; Salami, J.A.; Rouseff, M.; Das, S.; Guzman, H.; Younus, A.; Ogunmoroti, O.; Feldman, T.; et al. Favorable Cardiovascular Health Is Associated with Lower Health Care Expenditures and Resource Utilization in a Large US Employee Population: The Baptist Health South Florida Employee Study. Mayo Clin. Proc. 2017, 92, 512–524. [Google Scholar] [CrossRef]
- Garg, P.K.; O’Neal, W.T.; Ogunsua, A.; Thacker, E.L.; Howard, G.; Soliman, E.Z.; Cushman, M. Usefulness of the American Heart Association’s Life Simple 7 to Predict the Risk of Atrial Fibrillation (from the REasons for Geographic And Racial Differences in Stroke [REGARDS] Study). Am. J. Cardiol. 2017, 121, 199–204. [Google Scholar] [CrossRef]
- Lloyd-Jones, D.M.; Hong, Y.; Labarthe, D.; Mozaffarian, D.; Appel, L.J.; Van Horn, L.; Greenlund, K.; Daniels, S.; Nichol, G.; Tomaselli, G.F.; et al. Defining and setting national goals for cardiovascular health promotion and disease reduction: The American heart association’s strategic impact goal through 2020 and beyond. Circulation 2010, 121, 586–613. [Google Scholar] [CrossRef]
- Schwartz, S.M.; Schwartz, H.T.; Horvath, S.; Schadt, E.; Lee, S.-I. A Systematic Approach to Multifactorial Cardiovascular Disease. Arter. Thromb. Vasc. Biol. 2012, 32, 2821–2835. [Google Scholar] [CrossRef]
- Ademi, Z.; Liew, D.; Hollingsworth, B.; Steg, P.G.; Bhatt, D.L.; Reid, C.M. Predictors of annual pharmaceutical costs in australia for community-based individuals with, or at risk of, cardiovascular disease: Analysis of australian data from the reach registry. Am. J. Cardiovasc. Drugs 2010, 10, 85–94. [Google Scholar] [CrossRef]
- Zuvekas, S.H.; Olin, G.L. Validating Household Reports of Health Care Use in the Medical Expenditure Panel Survey. Health Serv. Res. 2009, 44, 1679–1700. [Google Scholar] [CrossRef]
- Dalal, A.A.; Shah, M.; Lunacsek, O.; Hanania, N.A. Clinical and economic burden of patients diagnosed with COPD with comorbid cardiovascular disease. Respir. Med. 2011, 105, 1516–1522. [Google Scholar] [CrossRef]
- Tibuakuu, M.; Okunrintemi, V.; Savji, N.; Stone, N.J.; Virani, S.S.; Blankstein, R.; Thamman, R.; Blumenthal, R.S.; Michos, E.D. Nondietary cardiovascular health metrics with patient experience and loss of productivity among us adults without cardiovascular disease: The medical expenditure panel survey 2006 to 2015. J. Am. Heart Assoc. 2020, 9, e016744. [Google Scholar] [CrossRef]
- Glasheen, W.P.; Cordier, T.; Gumpina, R.; Haugh, G.; Davis, J.; Renda, A. Charlson Comorbidity Index: ICD-9 Update and ICD-10 Translation. Am. Health Drug Benefits 2019, 12, 188–197. [Google Scholar]
- Salami, J.A.; Valero-Elizondo, J.; Ogunmoroti, O.; Spatz, E.S.; Rana, J.S.; Virani, S.; Blankstein, R.; Younus, A.; Arrieta, A.; Blaha, M.J.; et al. Association between Modifiable Risk Factors and Pharmaceutical Expenditures Among Adults with Atherosclerotic Cardiovascular Disease in the United States: 2012–2013 Medical Expenditures Panel Survey. J. Am. Heart Assoc. 2017, 6, e004996. [Google Scholar] [CrossRef]
- Murakami, Y.; Okamura, T.; Nakamura, K.; Miura, K.; Ueshima, H. The clustering of cardiovascular disease risk factors and their impacts on annual medical expenditure in Japan: Community-based cost analysis using Gamma regression models. BMJ Open 2013, 3, e002234. [Google Scholar] [CrossRef]
- Benjamin, E.J.; Virani, S.S.; Callaway, C.W.; Chamberlain, A.M.; Chang, A.R.; Cheng, S.; Chiuve, S.E.; Cushman, M.; Delling, F.N.; Deo, R.; et al. Heart Disease and Stroke Statistics-2018 Update: A Report from the American Heart Association. Circulation 2018, 137, e67–e492. [Google Scholar] [CrossRef]


| Prevalence, % (95% CI) | ACS | Non-ACS | Diff (p-Values) | Combined Sample |
|---|---|---|---|---|
| Outcomes | ||||
| Health Expenditures = 0 | 1.7 (1.6–2.3) | 3.8 (3.6–3.9) | p < 0.001 | 3.7 (3.5–3.8) |
| Average Healthcare Expenditures if >0 ($) | 177,657 (168,339–186,974) | 46,981 (45,962–47,999) | p < 0.001 | 54,498 (53,382–55,615) |
| CVH Components | ||||
| Inadeq. Phy. Activity | 47.7 (46.4–49.0) | 56.1 (55.8–56.5) | p < 0.001 | 55.7 (55.3–56.0) |
| High Cholesterol | 80.2 (79.1–81.3) | 37.7 (37.3–38.0) | p < 0.001 | 40.1 (39.8–40.5) |
| Hypertension | 85.3 (84.4–86.3) | 37.7 (41.7–42.4) | p < 0.001 | 44.5 (44.2–44.9) |
| Diabetes Mellitus | 39.9 (38.5–41.2) | 14.7 (14.5–14.9) | p < 0.001 | 16.1 (15.9–16.3) |
| Normal BMI (18–25) | 30.3 (29.1–31.6) | 33.3 (33.0–33.6) | p < 0.001 | 33.1 (32.8–33.r5) |
| Smokers | 19.8 (8.7–20.8) | 17.4 (17.1–17.6) | p < 0.001 | 17.5 (17.3–17.8) |
| Self-identified gender | ||||
| Male | 59.7 (58.4–61.0) | 42.9 (42.6–43.2) | p < 0.001 | 43.9 (43.6–44.2) |
| Mean Age | ||||
| Age | 67.1 (66.8–67.5) | 48.8 (48.6–49.0) | p < 0.001 | 49.8 (49.7–50.0) |
| Race/Ethnicity | ||||
| White | 60.4 (59.1–61.7) | 51.1 (50.8–51.5) | p < 0.001 | 51.7 (51.3–52.0) |
| Black | 17.7 (16.7–18.8) | 17.9 (17.6–18.2) | 0.7812 | 17.9 (17.6–18.2) |
| Hispanic | 15.2 (14.3–16.7) | 22.5 (22.2–22.8) | p < 0.001 | 22.1 (21.8–22.3) |
| Asian | 4.1 (3.6–4.7) | 6.1 (6.0–6.3) | p < 0.001 | 6.0 (5.9–6.2) |
| Multi Racial | 1.8 (1.4–2.2) | 1.9 (1.8–2.0) | 0.6721 | 1.9 (1.8–2.0) |
| Prevalence, % (95% CI) | ACS | non-ACS | Diff (p-values) | Combined Sample |
| Household Income (Federal poverty level [FPL]) | ||||
| <125% | 18.3 (17.3–19.4) | 18.3 (17.9–18.5) | 0.8017 | 18.2 (17.3–19.4) |
| 125–200% | 15.9 (14.9–16.9) | 14.1 (13.9–14.3) | p < 0.001 | 14.2 (14.0–14.5) |
| 200–400% | 30.5 (29.4–31.9) | 29.4 (29.1–29) | 0.0609 | 29.5 (29.2–29.9) |
| >400% | 35.0 (33.7–36.2) | 38.1 (37.8–38.4) | p < 0.001 | 37.9 (37.6–38.3) |
| GCCI (Grouped Charlson’s Comorbidity Index) | ||||
| Average GCCI: 0–6 | 3.8 (3.6–3.9) | 1.4 (1.3–1.5) | p < 0.001 | 1.5 (1.4–1.6) |
| GCCI = 0 | 67.5 (66.1–68.7) | 88.5 (88.0–89.0) | p < 0.001 | 87.3 (87.3–87.8) |
| GCCI = 1 | 28.2 (27.0–29.1) | 9.4 (9.2–9.7) | p < 0.001 | 10.8 (10.4–10.7) |
| GCCI = 2 | 3.2 (2.8–3.7) | 1.0 (0.9–1.1) | p < 0.001 | 1.2 (1.0–1.22) |
| GCCI = 3 | 0.9 (0.7—1.2) | 0.6 (0.5–0.67) | p < 0.001 | 0.6 (0.58–0.59) |
| GCCI = 6 | 0.1 (0.02–0.20) | 0.1 (0.08–0.12) | 0.8751 | 0.1 (0.08–0.12) |
| Highest attained educational level | ||||
| High school diploma | 72.2 (71.0–73.4) | 58.7 (58.3–59.0) | p < 0.001 | 59.5 (59.1–59.8) |
| Bach/Master’s degree | 25.8 (24.6–26.9) | 30.1 (29.8–30.5) | p < 0.001 | 29.9 (29.6–30.3) |
| PhD/Prof degree | 3.8 (3.3–4.4) | 3.9 (3.7–4.0) | 0.8680 | 3.8 (3.8–4.1) |
| Sample size | 5391 | 88,319 | - | 93,710 |
| Probit Model (Positive Expenditures) (95% CI) | Predicted Change in Log Expenditures on Healthcare (95% CI) | Dy/Dx Marginal Expenditures ($1000) (95% CI) | |
|---|---|---|---|
| Had ACS event | 0.567 * (0.153–0.982) | 1.51 * (1.23–1.83) | 88.56 * (70.2–106.9) |
| CVH metric (0–6) | −0.004 (−0.028–0.011) | −0.071 * (−0.090–0.05) | −4.16 * (−5.39–2.95) |
| ACS * CVH metrics | −0.028 (−0.090–0.030) | 0.072 * (0.022–0.113) | 3.85 * (1.0–6.70) |
| <125–200% of FPL | 0.143 * (0.007–0.215) | −0.073 (−0.158–0.013) | −3.82 (−8.6–1.37) |
| 200–400% of FPL | 0.206 * (0.140–0.282) | −0.111 * (−0.190–0.032) | −5.76 * (−9.93–1.2) |
| >400% of FPL | 0.276 * (0.210–0.363) | −0.161 * (−0.240–0.072) | −8.07 * (−12.9–32.0) |
| GCCI | 0.179 * (0.117–0.242) | 0.544 * (0.485–0.603) | 31.68 * (27.8–35.6) |
| ACS * GCCI index | −0.110 (−0.300–0.084) | −0.145 * (−0.236–0.003) | −7.19 * (−13.9–4.97) |
| Male | −0.063 * (−0.102–0.025) | −0.059 * (−0.113–0.005) | −3.55 * (−6.63–0.468) |
| Hispanic | −0.029 (−0.082–0.023) | −0.053 (−0.125–0.022) | −3.06 (−7.29–1.16) |
| Black | −0.028 * (−0.0086–0.031) | 0.126 * (0.054–0.201) | 7.22 * (3.01–11.42) |
| Asian | −0.175 * (−0.260–0.091) | −0.350 * (−0.460–−0.24) | −20.67 * (−26.9–14.31) |
| Multi-Race/Ethnic | 0.193 * (0.050–0.336) | 0.105 (−0.043–0.25.4) | 6.65 (−18.88–15.17) |
| Bachelors/MA | 0.095 * (0.043–0.147) | 0.227 * (0.163–0.291) | 13.30 * (9.58–17.04) |
| ACS * Bach/MA | 0.334 * (0.067–0.601) | −0.125 * (−0.263–0.012) | −3.43 (−13.98–1.73) |
| Terminal Degree | 0.306 * (0.164–0.448) | 0.231 * (0.124–0.337) | 14.20 * (8.08–20.32) |
| ACS * Term. Degree | 0.140 * (−0.484–0.780) | 0.003(−0.244–0.252) | 6.91 (−13.64–15.02) |
| (Age-18)/10 | 0.059 (0.041–0.073) | 0.153 * (0.136–0.170) | 0.893 * (0.798–0.988) |
| ACS * (Age-18)/10 | −0.060 (−0.145–0.007) | −0.165 (−0.221–0.109) | −0.969 * (−1.29–−641) |
| Trend | 0.101 * (0.097–0.104) | 0.003 (−0.005–0.011) | 0.51 * (0.475–0.963) |
| Private Insurance | 0.145 * (0.070–0.220) | 0.337 (0.233–0.442) | 19.70 * (13.88–25.80) |
| Public Insurance | 0.343 * (0.271–0.416) | 0.736 (0.630–0.842) | 43.88 * (37.03–49.45) |
Disclaimer/Publisher’s Note: The statements, opinions and data contained in all publications are solely those of the individual author(s) and contributor(s) and not of MDPI and/or the editor(s). MDPI and/or the editor(s) disclaim responsibility for any injury to people or property resulting from any ideas, methods, instructions or products referred to in the content. |
© 2023 by the authors. Licensee MDPI, Basel, Switzerland. This article is an open access article distributed under the terms and conditions of the Creative Commons Attribution (CC BY) license (https://creativecommons.org/licenses/by/4.0/).
Share and Cite
Enyeji, A.M.; Barengo, N.C.; Ibrahimou, B.; Ramirez, G.; Arrieta, A. Association between Non-Dietary Cardiovascular Health and Expenditures Related to Acute Coronary Syndrome in the US between 2008–2018. Int. J. Environ. Res. Public Health 2023, 20, 5743. https://doi.org/10.3390/ijerph20095743
Enyeji AM, Barengo NC, Ibrahimou B, Ramirez G, Arrieta A. Association between Non-Dietary Cardiovascular Health and Expenditures Related to Acute Coronary Syndrome in the US between 2008–2018. International Journal of Environmental Research and Public Health. 2023; 20(9):5743. https://doi.org/10.3390/ijerph20095743
Chicago/Turabian StyleEnyeji, Abraham M., Noël C. Barengo, Boubakari Ibrahimou, Gilbert Ramirez, and Alejandro Arrieta. 2023. "Association between Non-Dietary Cardiovascular Health and Expenditures Related to Acute Coronary Syndrome in the US between 2008–2018" International Journal of Environmental Research and Public Health 20, no. 9: 5743. https://doi.org/10.3390/ijerph20095743
APA StyleEnyeji, A. M., Barengo, N. C., Ibrahimou, B., Ramirez, G., & Arrieta, A. (2023). Association between Non-Dietary Cardiovascular Health and Expenditures Related to Acute Coronary Syndrome in the US between 2008–2018. International Journal of Environmental Research and Public Health, 20(9), 5743. https://doi.org/10.3390/ijerph20095743


