
How Does the Experience Quality of Recreational Activities Organized within the Scope of Public Health Affect Perceived Value, Satisfaction and Behavioral Intentions of Individuals?

 ,
,  ,
,  and
and
Abstract
1. Introduction
2. Conceptional Framework
2.1. Experience Quality and Perceived Value
2.2. Experience Quality and Satisfaction
2.3. Perceived Value and Satisfaction
2.4. Perceived Value and Behavioral Intention
2.5. Satisfaction and Behavioral Intention
3. Materials and Methods
3.1. Research Instrument
3.2. Sampling and Data Collection
3.3. Common Method Bias
3.4. Data Analysis
4. Results
4.1. Demographic Profile
4.2. Confirmatory Factor Analysis Regarding the Structural Model
4.3. Hypothesis Testing
5. Discussion and Implications
6. Limitations and Future Research Directions
7. Conclusions
Author Contributions
Funding
Institutional Review Board Statement
Informed Consent Statement
Data Availability Statement
Conflicts of Interest
References
- Pucci, G.; Reis, R.S.; Rech, C.R.; Hallal, P.C. Quality of Life and Physical Activity among Adults: Population-Based Study in Brazilian Adults. Qual. Life Res. 2012, 21, 1537–1543. [Google Scholar] [CrossRef] [PubMed]
- Heesch, K.C.; Van Gellecum, Y.R.; Burton, N.W.; Van Uffelen, J.G.; Brown, W.J. Physical Activity, Walking, and Quality of Life in Women with Depressive Symptoms. Am. J. Prev. Med. 2015, 48, 281–291. [Google Scholar] [CrossRef] [PubMed]
- Ilgar Doğan, Y.; Şahin, B. Açık Rekreasyon Alanı Ziyaretçilerinin Aktivitelere Katılım Durumlarına Göre Yenilenme Deneyimi ve Deneyimleme Kalitesi Düzeylerinin İncelenmesi. Sportif Bakış: Spor ve Eğitim Bilimleri Dergisi 2022, 443–455. [Google Scholar] [CrossRef]
- Solunoğlu, A.; Yayla, Ö. Deneyim Kalitesinin Memnuniyet ve Yaşam Kalitesine Etkisi: Kırıkkale Büyük Şehir Parkında Bir Uygulama. Seyahat Ve Otel İşletmeciliği Derg. 2020, 17, 20–31. [Google Scholar] [CrossRef]
- Tsaur, S.-H.; Liang, Y.-W.; Hsu, H.-J. A Multidimensional Measurement of Work-Leisure Conflict. Leis. Sci. 2012, 34, 395–416. [Google Scholar] [CrossRef]
- Mansour, S.; Tremblay, D.-G. How the Need for “Leisure Benefit Systems” as a “Resource Passageways” Moderates the Effect of Work-Leisure Conflict on Job Burnout and Intention to Leave: A Study in the Hotel Industry in Quebec. J. Hosp. Tour. Manag. 2016, 27, 4–11. [Google Scholar] [CrossRef]
- Kılbaş, Ş. Rekreasyon Boş Zamanı Değerlendirme; Gazi Kitabevi: Ankara, Türkiye, 2010. [Google Scholar]
- Litwiller, F.; White, C.; Gallant, K.A.; Gilbert, R.; Hutchinson, S.; Hamilton-Hinch, B.; Lauckner, H. The Benefits of Recreation for the Recovery and Social Inclusion of Individuals with Mental Illness: An Integrative Review. Leis. Sci. 2017, 39, 1–19. [Google Scholar] [CrossRef]
- Zhang, Z.; Chen, W. A Systematic Review of the Relationship between Physical Activity and Happiness. J. Happiness Stud. 2019, 20, 1305–1322. [Google Scholar] [CrossRef]
- Mutz, M.; Reimers, A.K.; Demetriou, Y. Leisure Time Sports Activities and Life Satisfaction: Deeper Insights Based on a Representative Survey from Germany. Appl. Res. Qual. Life 2021, 16, 2155–2171. [Google Scholar] [CrossRef]
- Veal, A.J. The Serious Leisure Perspective and the Experience of Leisure. Leis. Sci. 2017, 39, 205–223. [Google Scholar] [CrossRef]
- Spangler, K.J.; Caldwell, L.L. The Implications of Public Policy Related to Parks, Recreation, and Public Health: A Focus on Physical Activity. J. Phys. Act. Health 2007, 4, S64–S71. [Google Scholar] [CrossRef] [PubMed]
- Chen, C.-F.; Chen, F.-S. Experience Quality, Perceived Value, Satisfaction and Behavioral Intentions for Heritage Tourists. Tour. Manag. 2010, 31, 29–35. [Google Scholar] [CrossRef]
- Ellis, G.D.; Lacanienta, A.; Freeman, P.A.; Hill, B.J. Evaluating Theory of Structured Experience Propositions: Effects of Service Quality and Experience Industry Techniques on Quality of Immediate Leisure Experiences. Ann. Leis. Res. 2019, 22, 587–606. [Google Scholar] [CrossRef]
- Stewart, W.P.; Cole, D.N. Number of Encounters and Experience Quality in Grand Canyon Backcountry: Consistently Negative and Weak Relationships. J. Leis. Res. 2001, 33, 106–120. [Google Scholar] [CrossRef]
- Bassi, M.; Fave, A.D. Impact of Extreme Weather Conditions on High-Altitude Climbers’ Goals and Quality of Experience. J. Leis. Res. 2010, 42, 469–487. [Google Scholar] [CrossRef]
- Schroeder, S.A.; Cornicelli, L.; Fulton, D.C.; Merchant, S.S. The Influence of Motivation versus Experience on Recreation Satisfaction: How Appreciative-versus Achievement-Oriented Recreation Experience Preferences Relate to Hunter Satisfaction. J. Leis. Res. 2019, 50, 107–131. [Google Scholar] [CrossRef]
- Sharpe, E.K. Resources at the Grassroots of Recreation: Organizational Capacity and Quality of Experience in a Community Sport Organization. Leis. Sci. 2006, 28, 385–401. [Google Scholar] [CrossRef]
- Ponsignon, F.; Smart, A.; Williams, M.; Hall, J. Healthcare Experience Quality: An Empirical Exploration Using Content Analysis Techniques. J. Serv. Manag. 2015, 26, 460–485. [Google Scholar] [CrossRef]
- Moliner, M.A. Loyalty, Perceived Value and Relationship Quality in Healthcare Services. J. Serv. Manag. 2009, 20, 76–97. [Google Scholar] [CrossRef]
- Suhartanto, D.; Brien, A.; Primiana, I.; Wibisono, N.; Triyuni, N.N. Tourist Loyalty in Creative Tourism: The Role of Experience Quality, Value, Satisfaction, and Motivation. Curr. Issues Tour. 2020, 23, 867–879. [Google Scholar] [CrossRef]
- Anderson, E.W.; Sullivan, M.W. The Antecedents and Consequences of Customer Satisfaction for Firms. Mark. Sci. 1993, 12, 125–143. [Google Scholar] [CrossRef]
- Bigne, J.E.; Sanchez, M.I.; Sanchez, J. Tourism Image, Evaluation Variables and after Purchase Behaviour: Inter-Relationship. Tour. Manag. 2001, 22, 607–616. [Google Scholar] [CrossRef]
- Chen, C.-F. Investigating Structural Relationships between Service Quality, Perceived Value, Satisfaction, and Behavioral Intentions for Air Passengers: Evidence from Taiwan. Transp. Res. Part Policy Pract. 2008, 42, 709–717. [Google Scholar] [CrossRef]
- Chen, C.-F.; Tsai, D. How Destination Image and Evaluative Factors Affect Behavioral Intentions? Tour. Manag. 2007, 28, 1115–1122. [Google Scholar] [CrossRef]
- Choi, T.Y.; Chu, R. Determinants of Hotel Guests’ Satisfaction and Repeat Patronage in the Hong Kong Hotel Industry. Int. J. Hosp. Manag. 2001, 20, 277–297. [Google Scholar] [CrossRef]
- Cronin, J.J., Jr.; Taylor, S.A. Measuring Service Quality: A Reexamination and Extension. J. Mark. 1992, 56, 55–68. [Google Scholar] [CrossRef]
- De Rojas, C.; Camarero, C. Visitors’ Experience, Mood and Satisfaction in a Heritage Context: Evidence from an Interpretation Center. Tour. Manag. 2008, 29, 525–537. [Google Scholar] [CrossRef]
- Fornell, C. A National Customer Satisfaction Barometer: The Swedish Experience. J. Mark. 1992, 56, 6–21. [Google Scholar] [CrossRef]
- Oliver, R.L. A Cognitive Model of the Antecedents and Consequences of Satisfaction Decisions. J. Mark. Res. 1980, 17, 460–469. [Google Scholar] [CrossRef]
- Petrick, J.F.; Backman, S.J. An Examination of the Construct of Perceived Value for the Prediction of Golf Travelers’ Intentions to Revisit. J. Travel Res. 2002, 41, 38–45. [Google Scholar] [CrossRef]
- Tarn, J.L. The Effects of Service Quality, Perceived Value and Customer Satisfaction on Behavioral Intentions. J. Hosp. Leis. Mark. 1999, 6, 31–43. [Google Scholar] [CrossRef]
- Otto, J.E.; Ritchie, J.B. The Service Experience in Tourism. Tour. Manag. 1996, 17, 165–174. [Google Scholar] [CrossRef]
- Parasuraman, A.; Zeithaml, V.A.; Berry, L. SERVQUAL: A Multiple-Item Scale for Measuring Consumer Perceptions of Service Quality. J. Retail. 1988, 64, 12–40. [Google Scholar]
- MacKay, K.J.; Crompton, J.L. Measuring the Quality of Recreation Services. J. Park Recreat. Adm. 1990, 8, 47–56. [Google Scholar]
- McDonald, M.; Sutton, W. TEAMQUAL: Measuring Service Quality in Professional Team Sports. Sport Mark. Q. 1995, 4, 9–15. [Google Scholar]
- Çetiner, H.; Yaylı, A. Animasyon Aktivitelerinde Deneyim Kalitesinin Otel Işletmelerinin Imajı, Konukların Değer Algısı ve Tekrar Satın Alma Niyetine Etkisi. İşletme Araştırmaları Derg. 2020, 12, 749–768. [Google Scholar]
- Wu, H.-C.; Li, T. A Study of Experiential Quality, Perceived Value, Heritage Image, Experiential Satisfaction, and Behavioral Intentions for Heritage Tourists. J. Hosp. Tour. Res. 2017, 41, 904–944. [Google Scholar] [CrossRef]
- Vander Elst, T.; De Witte, H.; De Cuyper, N. The Job Insecurity Scale: A Psychometric Evaluation across Five European Countries. Eur. J. Work Organ. Psychol. 2014, 23, 364–380. [Google Scholar] [CrossRef]
- Lin, C.-H.; Sher, P.J.; Shih, H.-Y. Past Progress and Future Directions in Conceptualizing Customer Perceived Value. Int. J. Serv. Ind. Manag. 2005, 16, 318–336. [Google Scholar] [CrossRef]
- García-Fernández, J.; Gálvez-Ruíz, P.; Fernández-Gavira, J.; Vélez-Colón, L.; Pitts, B.; Bernal-García, A. The Effects of Service Convenience and Perceived Quality on Perceived Value, Satisfaction and Loyalty in Low-Cost Fitness Centers. Sport Manag. Rev. 2018, 21, 250–262. [Google Scholar] [CrossRef]
- Dodds, W.B.; Monroe, K.B.; Grewal, D. Effects of Price, Brand, and Store Information on Buyers’ Product Evaluations. J. Mark. Res. 1991, 28, 307–319. [Google Scholar]
- Rapp, S.; Collins, T. The Great Marketing Turnaround; Routledge: New York, NY, USA, 1990. [Google Scholar]
- Cronin, J.J., Jr.; Brady, M.K.; Hult, G.T.M. Assessing the Effects of Quality, Value, and Customer Satisfaction on Consumer Behavioral Intentions in Service Environments. J. Retail. 2000, 76, 193–218. [Google Scholar] [CrossRef]
- Brooks, J.J.; Wallace, G.N.; Williams, D.R. Place as Relationship Partner: An Alternative Metaphor for Understanding the Quality of Visitor Experience in a Backcountry Setting. Leis. Sci. 2006, 28, 331–349. [Google Scholar] [CrossRef]
- Tian-Cole, S.; Crompton, J.L.; Willson, V.L. An Empirical Investigation of the Relationships between Service Quality, Satisfaction and Behavioral Intentions among Visitors to a Wildlife Refuge. J. Leis. Res. 2002, 34, 1–24. [Google Scholar] [CrossRef]
- Domínguez-Quintero, A.M.; González-Rodríguez, M.R.; Paddison, B. The Mediating Role of Experience Quality on Authenticity and Satisfaction in the Context of Cultural-Heritage Tourism. Curr. Issues Tour. 2020, 23, 248–260. [Google Scholar] [CrossRef]
- Oliver, R.L.; Rust, R.T. Service Quality: Insights and Managerial Implication from the Frontier. J. Serv. Qual. 1994, 15, 32–43. [Google Scholar]
- Reisinger, Y.; Turner, L. Cross-Cultural Behaviour in Tourism; Routledge: Abingdon, UK, 2012. [Google Scholar]
- Prebensen, N.K.; Woo, E.; Chen, J.S.; Uysal, M. Motivation and Involvement as Antecedents of the Perceived Value of the Destination Experience. J. Travel Res. 2013, 52, 253–264. [Google Scholar] [CrossRef]
- Lo, A.S.; Lee, C.Y. Motivations and Perceived Value of Volunteer Tourists from Hong Kong. Tour. Manag. 2011, 32, 326–334. [Google Scholar] [CrossRef]
- Shapiro, S.L.; Reams, L.; So, K.K.F. Is It Worth the Price? The Role of Perceived Financial Risk, Identification, and Perceived Value in Purchasing Pay-per-View Broadcasts of Combat Sports. Sport Manag. Rev. 2019, 22, 235–246. [Google Scholar] [CrossRef]
- Lu, H.-Y.; Wu, W.-Y.; Chen, S.-H. Influences on the Perceived Value of Medical Travel: The Moderating Roles of Risk Attitude, Self-Esteem and Word-of-Mouth. Curr. Issues Tour. 2016, 19, 477–491. [Google Scholar] [CrossRef]
- Pandža Bajs, I. Tourist Perceived Value, Relationship to Satisfaction, and Behavioral Intentions: The Example of the Croatian Tourist Destination Dubrovnik. J. Travel Res. 2015, 54, 122–134. [Google Scholar] [CrossRef]
- Williams, P.; Soutar, G.N. Value, Satisfaction and Behavioral Intentions in an Adventure Tourism Context. Ann. Tour. Res. 2009, 36, 413–438. [Google Scholar] [CrossRef]
- Wong, I.A.; Wan, Y.K.P.; Qi, S. Green Events, Value Perceptions, and the Role of Consumer Involvement in Festival Design and Performance. J. Sustain. Tour. 2015, 23, 294–315. [Google Scholar] [CrossRef]
- Wikström, S.; Normann, R.; Anell, B.; Ekvall, G.; Forslin, J.; Skärvad, P.H. Knowledge and Value: The Company as a Knowledge Processing and Value Creating System; Routledge: London, UK, 1994. [Google Scholar]
- Ravald, A.; Grönroos, C. The Value Concept and Relationship Marketing. Eur. J. Mark. 1996, 30, 19–30. [Google Scholar] [CrossRef]
- Arlinghaus, R. Understanding Recreational Angling Participation in Germany: Preparing for Demographic Change. Hum. Dimens. Wildl. 2006, 11, 229–240. [Google Scholar] [CrossRef]
- Oliver, R.L. Whence Consumer Loyalty? J. Mark. 1999, 63, 33–44. [Google Scholar] [CrossRef]
- Yang, Z.; Peterson, R.T. Customer Perceived Value, Satisfaction, and Loyalty: The Role of Switching Costs. Psychol. Mark. 2004, 21, 799–822. [Google Scholar] [CrossRef]
- Lee, C.-K.; Mjelde, J.W.; Kim, T.-K.; Lee, H.-M. Estimating the Intention–Behavior Gap Associated with a Mega Event: The Case of the Expo 2012 Yeosu Korea. Tour. Manag. 2014, 41, 168–177. [Google Scholar] [CrossRef]
- Song, H.; You, G.-J.; Reisinger, Y.; Lee, C.-K.; Lee, S.-K. Behavioral Intention of Visitors to an Oriental Medicine Festival: An Extended Model of Goal Directed Behavior. Tour. Manag. 2014, 42, 101–113. [Google Scholar] [CrossRef]
- Kruger, M.; Saayman, M. ‘All That Jazz’: The Relationship between Music Festival Visitors’ Motives and Behavioural Intentions. Curr. Issues Tour. 2019, 22, 2399–2414. [Google Scholar] [CrossRef]
- Moghimehfar, F.; Halpenny, E.A.; Walker, G.J. Front-Country Campers’ Constraints, Negotiation, and pro-Environment Behavioral Intention: An Extension to the Theory of Planned Behavior. Leis. Sci. 2018, 40, 174–193. [Google Scholar] [CrossRef]
- Lam, T.; Hsu, C.H. Predicting Behavioral Intention of Choosing a Travel Destination. Tour. Manag. 2006, 27, 589–599. [Google Scholar] [CrossRef]
- Albayrak, T.; Caber, M.; Çömen, N. Tourist Shopping: The Relationships among Shopping Attributes, Shopping Value, and Behavioral Intention. Tour. Manag. Perspect. 2016, 18, 98–106. [Google Scholar] [CrossRef]
- Park, H.-J.; Lee, T.J. Influence of the ‘Slow City’Brand Association on the Behavioural Intention of Potential Tourists. Curr. Issues Tour. 2019, 22, 1405–1422. [Google Scholar] [CrossRef]
- Eggert, A.; Ulaga, W. Customer Perceived Value: A Substitute for Satisfaction in Business Markets? J. Bus. Ind. Mark. 2002, 17, 107–118. [Google Scholar] [CrossRef]
- Zhao, X. Salon Hair Coloring in the United States: A Consumer Perceived Value Analysis of Gen Y Consumers. Int. J. Arts Commer. 2014, 3, 105–115. [Google Scholar]
- Boksberger, P.E.; Melsen, L. Perceived Value: A Critical Examination of Definitions, Concepts and Measures for the Service Industry. J. Serv. Mark. 2011, 25, 229–240. [Google Scholar] [CrossRef]
- Grewal, D. Product Quality Expectations: Towards an Understanding of Their Antecedents and Consequences. J. Bus. Psychol. 1995, 9, 225–240. [Google Scholar] [CrossRef]
- Uzkurt, C. Müşteri Değeri ve Tatmininin Satın Alım Sonrası Gelecek Eğilimlere Etkisi Üzerine Ampirik Bir Çalışma. Dumlupınar Üniversitesi Sos. Bilim. Derg. 2007, 17, 25–43. [Google Scholar]
- Dolnicar, S.; Coltman, T.; Sharma, R. Do Satisfied Tourists Really Intend to Come Back? Three Concerns with Empirical Studies of the Link between Satisfaction and Behavioral Intention. J. Travel Res. 2015, 54, 152–178. [Google Scholar] [CrossRef]
- Huang, S.; Weiler, B.; Assaker, G. Effects of Interpretive Guiding Outcomes on Tourist Satisfaction and Behavioral Intention. J. Travel Res. 2015, 54, 344–358. [Google Scholar] [CrossRef]
- Alegre, J.; Garau, J. Tourist Satisfaction and Dissatisfaction. Ann. Tour. Res. 2010, 37, 52–73. [Google Scholar] [CrossRef]
- Del Bosque, I.R.; San Martín, H. Tourist Satisfaction a Cognitive-Affective Model. Ann. Tour. Res. 2008, 35, 551–573. [Google Scholar] [CrossRef]
- Song, H.; Van der Veen, R.; Li, G.; Chen, J.L. The Hong Kong Tourist Satisfaction Index. Ann. Tour. Res. 2012, 39, 459–479. [Google Scholar] [CrossRef]
- Chen, C.-C.; Huang, W.-J.; Petrick, J.F. Holiday Recovery Experiences, Tourism Satisfaction and Life Satisfaction–Is There a Relationship? Tour. Manag. 2016, 53, 140–147. [Google Scholar] [CrossRef]
- Kalantari, H.D.; Sembada, A.Y.; Gholipour, H.F. Tourist Satisfaction in’all-in-One’branded Destinations. Ann. Tour. Res. 2020, 81. [Google Scholar] [CrossRef]
- Park, S.; Hahn, S.; Lee, T.; Jun, M. Two Factor Model of Consumer Satisfaction: International Tourism Research. Tour. Manag. 2018, 67, 82–88. [Google Scholar] [CrossRef]
- Albayrak, T.; Caber, M. The Symmetric and Asymmetric Influences of Destination Attributes on Overall Visitor Satisfaction. Curr. Issues Tour. 2013, 16, 149–166. [Google Scholar] [CrossRef]
- Huang, S.S.; Crotts, J. Relationships between Hofstede’s Cultural Dimensions and Tourist Satisfaction: A Cross-Country Cross-Sample Examination. Tour. Manag. 2019, 72, 232–241. [Google Scholar] [CrossRef]
- Wang, S. Leisure Travel Outcomes and Life Satisfaction: An Integrative Look. Ann. Tour. Res. 2017, 63, 169–182. [Google Scholar] [CrossRef]
- Radojevic, T.; Stanisic, N.; Stanic, N. Solo Travellers Assign Higher Ratings than Families: Examining Customer Satisfaction by Demographic Group. Tour. Manag. Perspect. 2015, 16, 247–258. [Google Scholar] [CrossRef]
- El-Said, O.A.; Fathy, E.A. Assessing University Students’ Satisfaction with on-Campus Cafeteria Services. Tour. Manag. Perspect. 2015, 16, 318–324. [Google Scholar] [CrossRef]
- Hyun, M.; Jordan, J.S. Athletic Goal Achievement: A Critical Antecedent of Event Satisfaction, Re-Participation Intention, and Future Exercise Intention in Participant Sport Events. Sport Manag. Rev. 2020, 23, 256–270. [Google Scholar] [CrossRef]
- Shoemaker, S.; Lewis, R.C. Customer Loyalty: The Future of Hospitality Marketing. Int. J. Hosp. Manag. 1999, 18, 345–370. [Google Scholar] [CrossRef]
- Wu, H.-C.; Li, M.-Y.; Li, T. A Study of Experiential Quality, Experiential Value, Experiential Satisfaction, Theme Park Image, and Revisit Intention. J. Hosp. Tour. Res. 2018, 42, 26–73. [Google Scholar] [CrossRef]
- Kim, H.; Woo, E.; Uysal, M. Tourism Experience and Quality of Life among Elderly Tourists. Tour. Manag. 2015, 46, 465–476. [Google Scholar] [CrossRef]
- Theodorakis, N.D.; Kaplanidou, K.; Karabaxoglou, I. Effect of Event Service Quality and Satisfaction on Happiness among Runners of a Recurring Sport Event. Leis. Sci. 2015, 37, 87–107. [Google Scholar] [CrossRef]
- Yang, F.X. Tourist Co-Created Destination Image. J. Travel Tour. Mark. 2016, 33, 425–439. [Google Scholar] [CrossRef]
- Jin, N.; Lee, S.; Lee, H. The Effect of Experience Quality on Perceived Value, Satisfaction, Image and Behavioral Intention of Water Park Patrons: New versus Repeat Visitors. Int. J. Tour. Res. 2015, 17, 82–95. [Google Scholar] [CrossRef]
- Murray, D.; Howat, G. The Relationships among Service Quality, Value, Satisfaction, and Future Intentions of Customers at an Australian Sports and Leisure Centre. Sport Manag. Rev. 2002, 5, 25–43. [Google Scholar] [CrossRef]
- Theodorakis, N.D.; Alexandris, K.; Tsigilis, N.; Karvounis, S. Predicting Spectators’ Behavioural Intentions in Professional Football: The Role of Satisfaction and Service Quality. Sport Manag. Rev. 2013, 16, 85–96. [Google Scholar] [CrossRef]
- Eskisehir Municipality. Eskisehir with Statistics. 2022. Available online: https://www.eskisehir.bel.tr/istatistiklerle-eskisehir (accessed on 25 January 2023).
- Nunnally, J.C. Psychometric Theory, 2nd ed.; McGraw: New York, NY, USA, 1978. [Google Scholar]
- Podsakoff, P.M.; MacKenzie, S.B.; Lee, J.-Y.; Podsakoff, N.P. Common Method Biases in Behavioral Research: A Critical Review of the Literature and Recommended Remedies. J. Appl. Psychol. 2003, 88, 879. [Google Scholar] [CrossRef] [PubMed]
- MacKenzie, S.B.; Podsakoff, P.M. Common Method Bias in Marketing: Causes, Mechanisms, and Procedural Remedies. J. Retail. 2012, 88, 542–555. [Google Scholar] [CrossRef]
- Hair, J.F.; Bush, R.P.; Ortinau, D.J. Marketing Research: Within a Changing Information Environment, 2nd ed.; McGraw-Hill/Irwin series in marketing; McGraw-Hill/Irwin: Boston, MA, USA, 2003. [Google Scholar]
- Tabachnick, B.G.; Fidell, L.S.; Ullman, J.B. Using Multivariate Statistics; Pearson: Boston, MA, USA, 2007. [Google Scholar]
- Anderson, J.C.; Gerbing, D.W. Structural Equation Modeling in Practice: A Review and Recommended Two-Step Approach. Psychol. Bull. 1988, 103, 411. [Google Scholar] [CrossRef]
- Hair, J.F.; Black, W.C.; Babin, B.J.; Anderson, R.E.; Tatham, R. Multivariate Data Analysis (Ed.); Pearson Prentice Hall: Hoboken, NJ, USA, 2010. [Google Scholar]
- Byrne, B.M. Structural Equation Modeling with AMOS, EQS, and LISREL: Comparative Approaches to Testing for the Factorial Validity of a Measuring Instrument. Int. J. Test. 2001, 1, 55–86. [Google Scholar] [CrossRef]
- Yuan, Y.-H.; Wu, C. Relationships among Experiential Marketing, Experiential Value, and Customer Satisfaction. J. Hosp. Tour. Res. 2008, 32, 387–410. [Google Scholar] [CrossRef]
- Petrick, J.F.; Backman, S.J.; Bixler, R.D. An Investigation of Selected Factors’ Impact on Golfer Satisfaction and Perceived Value. J. Park Recreat. Adm. 1999, 17, 40–59. [Google Scholar]
- Perera, P.; Vlosky, R. How Previous Visits Shape Trip Quality, Perceived Value, Satisfaction, and Future Behavioral Intentions: The Case of Forest-Based Ecotourism in Sri Lanka. Int. J. Sport Manag. Recreat. Tour. 2013, 11, 1–24. [Google Scholar] [CrossRef]
- Prebensen, N.K.; Kim, H.; Uysal, M. Cocreation as Moderator between the Experience Value and Satisfaction Relationship. J. Travel Res. 2016, 55, 934–945. [Google Scholar] [CrossRef]
- Pramod, S.; Nayak, J.K. Testing the Role of Tourists’ Emotional Experiences in Predicting Destination Image, Satisfaction, and Behavioral Intentions: A Case of Wellness Tourism. Tour. Manag. Perspect. 2018, 28, 41–52. [Google Scholar]
- Nienhuis, C.P.; Lesser, I.A. The Impact of COVID-19 on Women’s Physical Activity Behavior and Mental Well-Being. Int. J. Environ. Res. Public. Health 2020, 17, 9036. [Google Scholar] [CrossRef] [PubMed]
- Basso, J.C.; Suzuki, W.A. The Effects of Acute Exercise on Mood, Cognition, Neurophysiology, and Neurochemical Pathways: A Review. Brain Plast. 2017, 2, 127–152. [Google Scholar] [CrossRef] [PubMed]
- Kim, B.; Kang, S. Regular Leisure-Time Physical Activity Is Effective in Boosting Neurotrophic Factors and Alleviating Menopause Symptoms. Int. J. Environ. Res. Public. Health 2020, 17, 8624. [Google Scholar] [CrossRef] [PubMed]
- Lee, K.H. Mental Health and Recreation Opportunities. Int. J. Environ. Res. Public. Health 2020, 17, 9338. [Google Scholar] [CrossRef]
- Peña, A.I.P.; Jamilena, D.M.F.; Molina, M.Á.R. The Perceived Value of the Rural Tourism Stay and Its Effect on Rural Tourist Behaviour. J. Sustain. Tour. 2012, 20, 1045–1065. [Google Scholar] [CrossRef]


| Variables | Frequency | Percentage (%) |
|---|---|---|
| Gender | ||
| Male | 117 | 28.6 |
| Female | 292 | 71.4 |
| Age | ||
| 18–24 | 66 | 16.1 |
| 25–34 | 118 | 28.9 |
| 35–44 | 117 | 28.6 |
| 45–54 | 88 | 21.5 |
| 55 or more | 20 | 4.9 |
| Marital Status | ||
| Married | 285 | 69.7 |
| Single | 124 | 30.3 |
| Education level | ||
| Primary education | 39 | 9.5 |
| Secondary education | 102 | 24.9 |
| Graduate | 244 | 59.7 |
| Postgraduate | 24 | 5.9 |
| Construct and Indicators | Factor Loading | t-Value | C.R. | AVE |
|---|---|---|---|---|
| Experience Quality | 0.952 | 0.690 | ||
| The quality of interaction between me and the staff working at the events is unmatched. | 0.767 | 18.20 * | ||
| The interaction between me and the staff working at the events is of a high standard. | 0.751 | 17.64 * | ||
| The physical environment in which these activities are held is perfect. | 0.756 | 17.81 * | ||
| The physical environment at these events is of a high standard. | 0.749 | 17.56 * | ||
| The service provided by the personnel working at the events to the participants of the events is of high quality. | 0.849 | 21.20 * | ||
| Every time I attend events, I have a unique experience. | 0.847 | 21.05 * | ||
| I feel free to participate in this activity. | 0.851 | 21.29 * | ||
| This place, where I participate in activities, is at an accessible point. | 0.772 | 18.27 * | ||
| Participating in this activity is a good experience for me. | 0.826 | - | ||
| Perceived Value | 0.957 | 0.819 | ||
| I think I get a higher benefit from the activity compared to the price I pay. | 0.832 | - | ||
| I think I get a higher benefit from the activity compared to the effort I put in. | 0.857 | 32.10 * | ||
| I think I get a higher benefit from the activity compared to the time I spend. | 0.872 | 22.33 * | ||
| Although this activity was free or very low cost, it met my needs. | 0.881 | 22.73 * | ||
| Overall, it’s worth the time, money, and effort to participate in this activity. | 0.891 | 23.19 * | ||
| Satisfaction | 0.956 | 0.846 | ||
| I am satisfied with my experience as a result of participating in this activity. | 0.889 | - | ||
| I am happy that I decided to participate in these activities. | 0.934 | 30.40 * | ||
| I really enjoyed participating in these activities. | 0.927 | 29.80 * | ||
| Overall, I felt energized after participating in this activity. | 0.828 | 23.13 * | ||
| Behavioral Intention | 0.917 | 0.789 | ||
| I would like to attend these events again in the future. | 0.923 | 33.45 * | ||
| I will recommend participating in these events to my friends and close circle. | 0.965 | 18.11 * | ||
| I am willing to pay more to participate in these activities. | 0.765 | - |
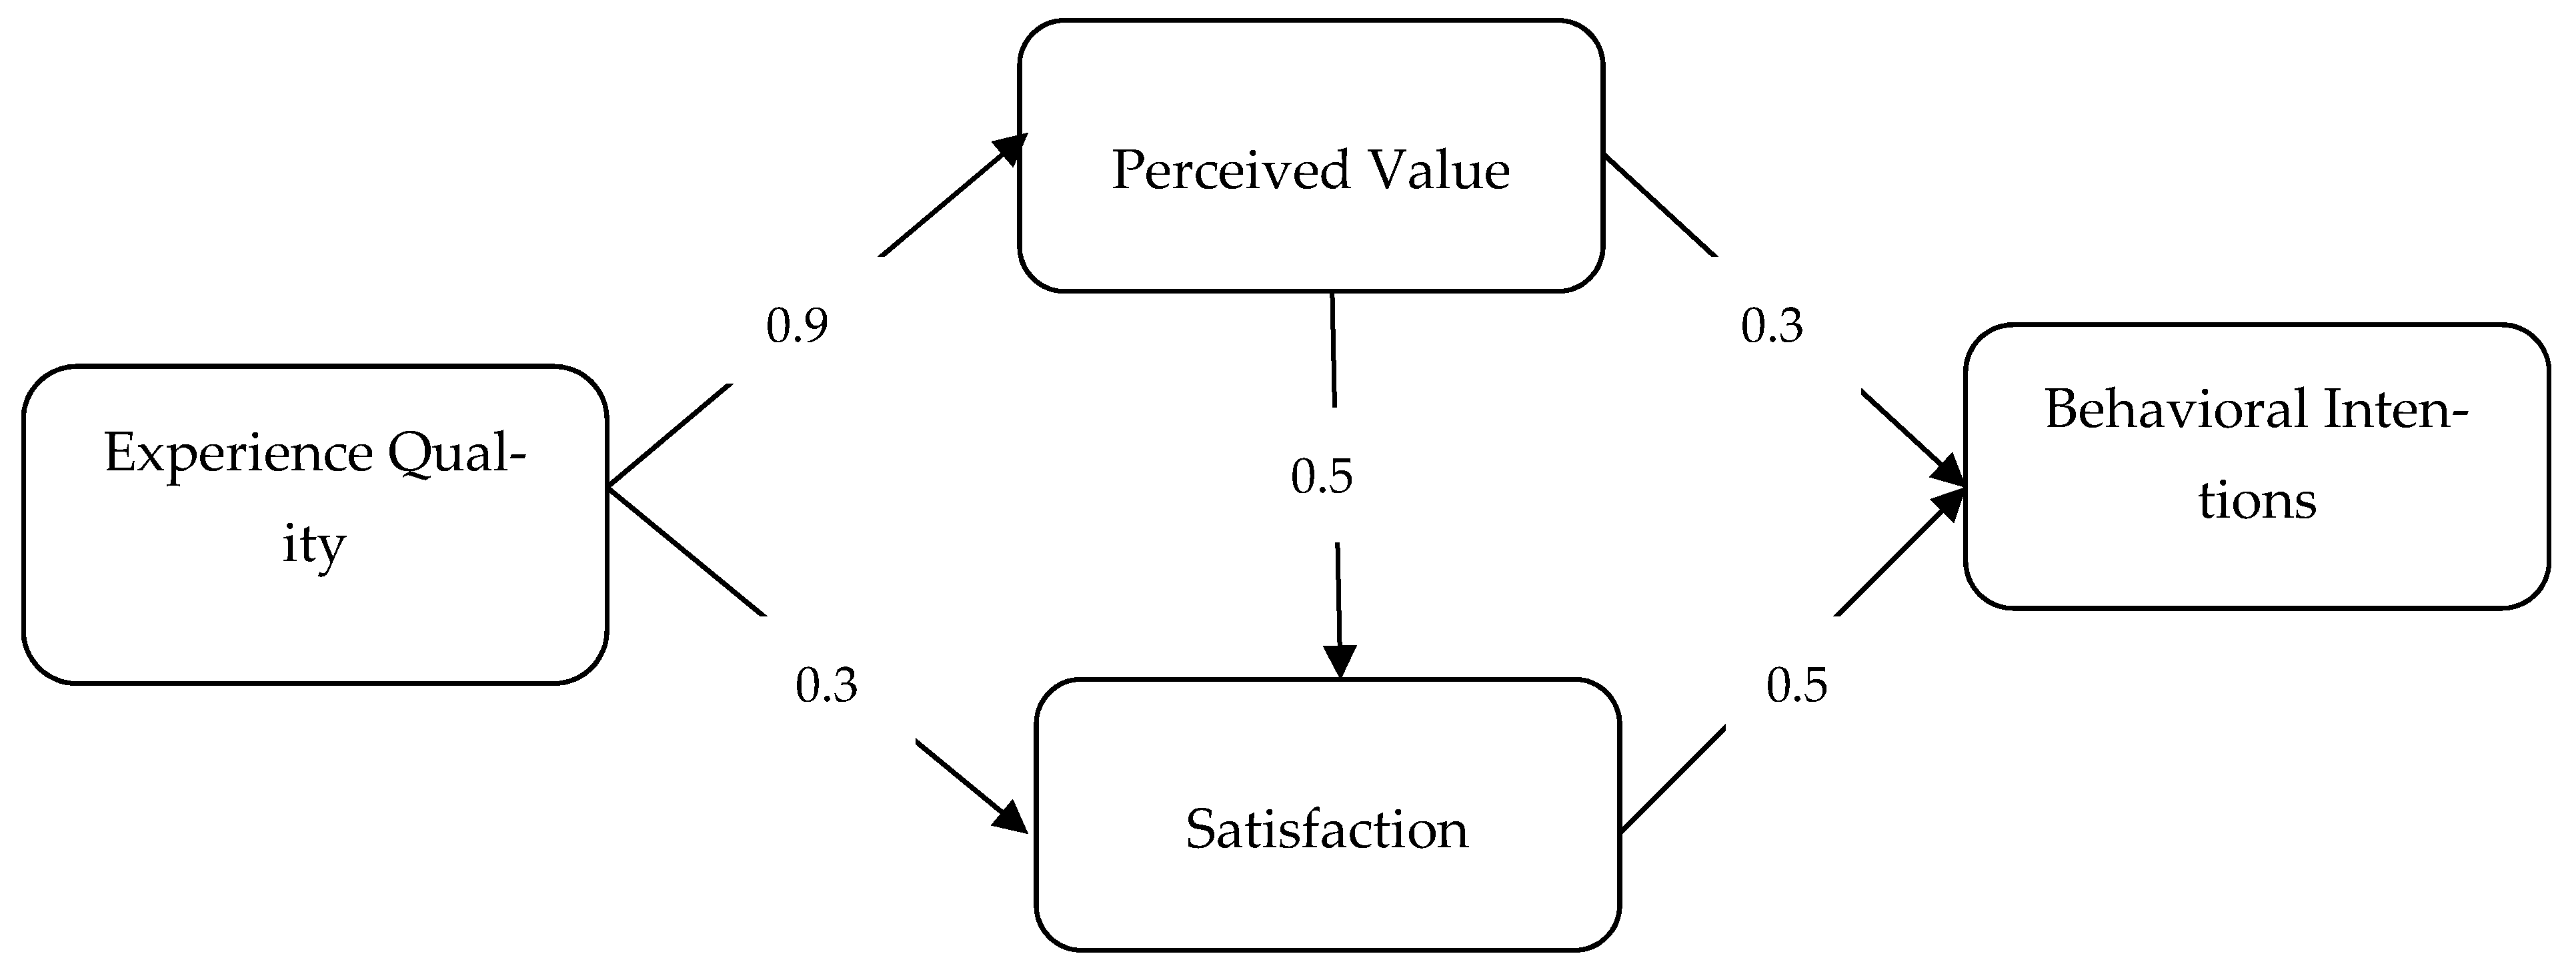
| Hypothesized Path | Standardized Coefficients | t-Value |
|---|---|---|
| H1: experience quality → perceived value | 0.91 | 16.71 * |
| H2: experience quality → satisfaction | 0.36 | 4.71 * |
| H3: perceived value → satisfaction | 0.58 | 7.34 * |
| H4: perceived value → behavioral intentions | 0.34 | 3.46 * |
| H5: satisfaction → behavioral intentions | 0.51 | 5.16 * |
Disclaimer/Publisher’s Note: The statements, opinions and data contained in all publications are solely those of the individual author(s) and contributor(s) and not of MDPI and/or the editor(s). MDPI and/or the editor(s) disclaim responsibility for any injury to people or property resulting from any ideas, methods, instructions or products referred to in the content. |
© 2023 by the authors. Licensee MDPI, Basel, Switzerland. This article is an open access article distributed under the terms and conditions of the Creative Commons Attribution (CC BY) license (https://creativecommons.org/licenses/by/4.0/).
Share and Cite
Yayla, O.; Aytekin, A.; Uslu, F.; Ergun, G.S.; Keles, H.; Guven, Y. How Does the Experience Quality of Recreational Activities Organized within the Scope of Public Health Affect Perceived Value, Satisfaction and Behavioral Intentions of Individuals? Int. J. Environ. Res. Public Health 2023, 20, 5142. https://doi.org/10.3390/ijerph20065142
Yayla O, Aytekin A, Uslu F, Ergun GS, Keles H, Guven Y. How Does the Experience Quality of Recreational Activities Organized within the Scope of Public Health Affect Perceived Value, Satisfaction and Behavioral Intentions of Individuals? International Journal of Environmental Research and Public Health. 2023; 20(6):5142. https://doi.org/10.3390/ijerph20065142
Chicago/Turabian StyleYayla, Ozgur, Arif Aytekin, Fatih Uslu, Gozde Seval Ergun, Huseyin Keles, and Yigit Guven. 2023. "How Does the Experience Quality of Recreational Activities Organized within the Scope of Public Health Affect Perceived Value, Satisfaction and Behavioral Intentions of Individuals?" International Journal of Environmental Research and Public Health 20, no. 6: 5142. https://doi.org/10.3390/ijerph20065142
APA StyleYayla, O., Aytekin, A., Uslu, F., Ergun, G. S., Keles, H., & Guven, Y. (2023). How Does the Experience Quality of Recreational Activities Organized within the Scope of Public Health Affect Perceived Value, Satisfaction and Behavioral Intentions of Individuals? International Journal of Environmental Research and Public Health, 20(6), 5142. https://doi.org/10.3390/ijerph20065142