

Exploring Factors Affecting Urban Park Use from a Geospatial Perspective: A Big Data Study in Fuzhou, China

Abstract
1. Introduction
2. Methodology
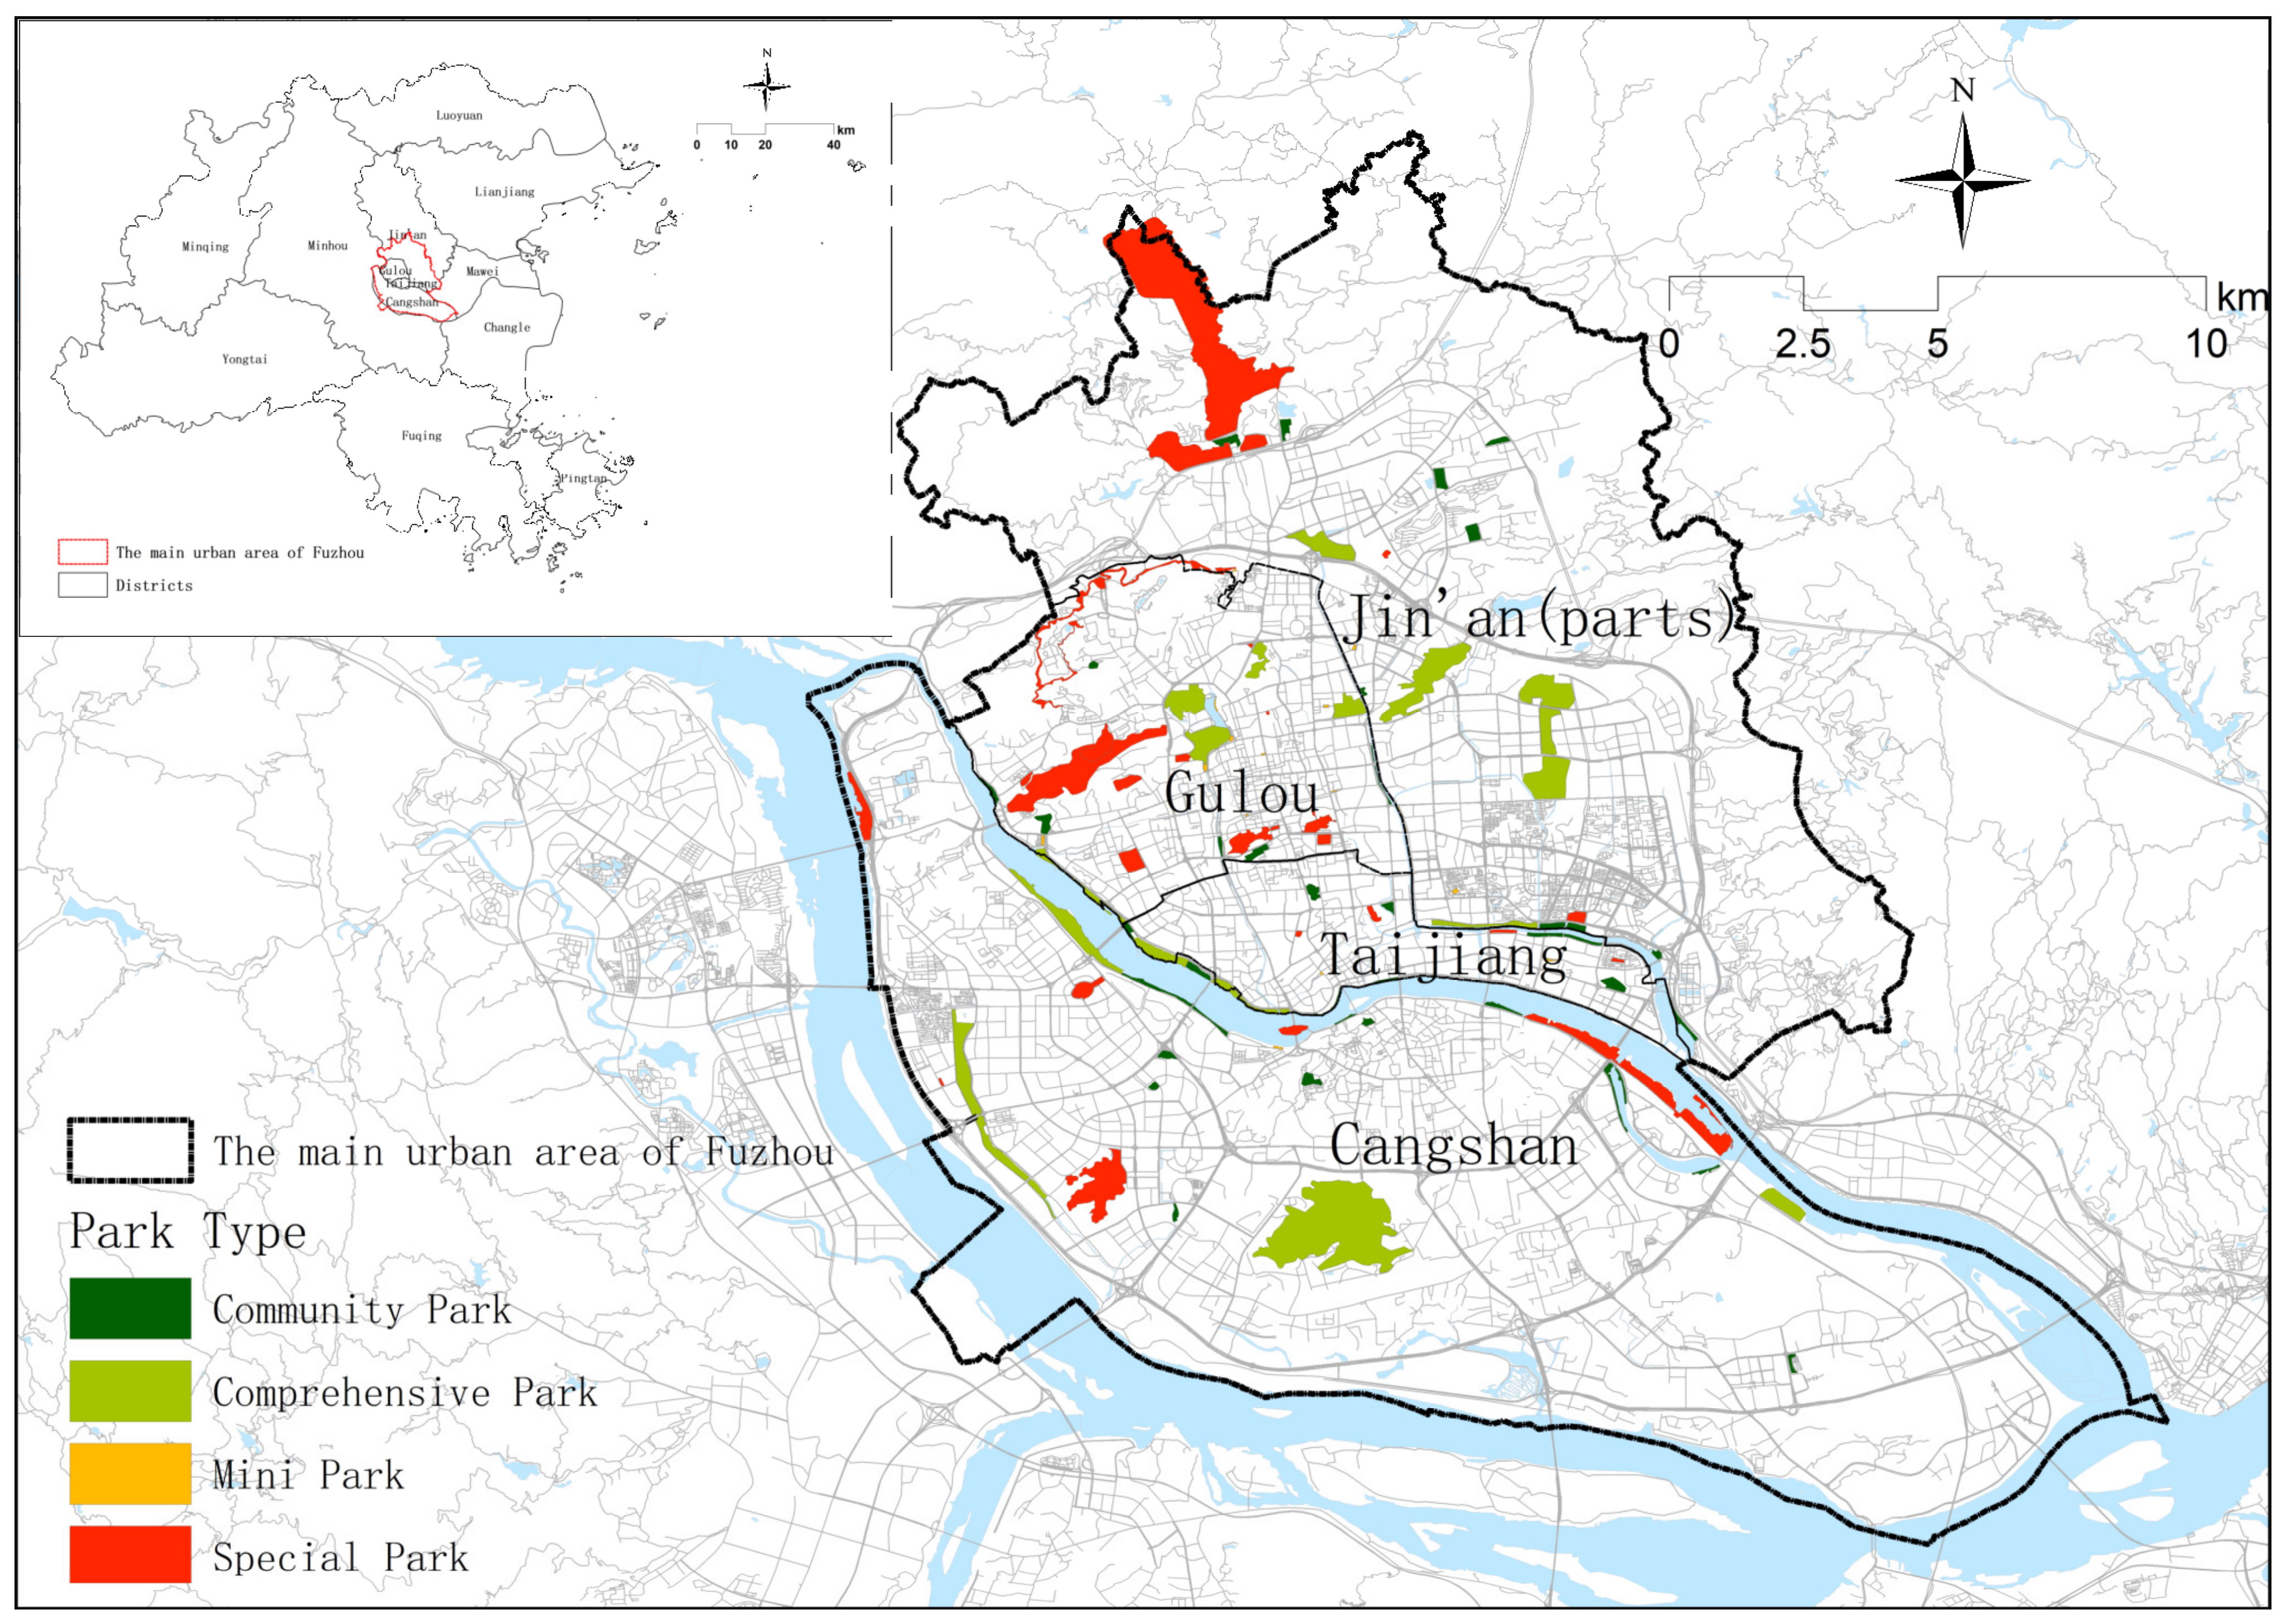
2.1. Study Area
2.2. RTUD (Real-Time Tencent User Density) Data and Processing
2.3. Selection of Influencing Factors and Data Sources
2.4. Geographical Detectors
2.5. MGWR
3. Results and Analysis
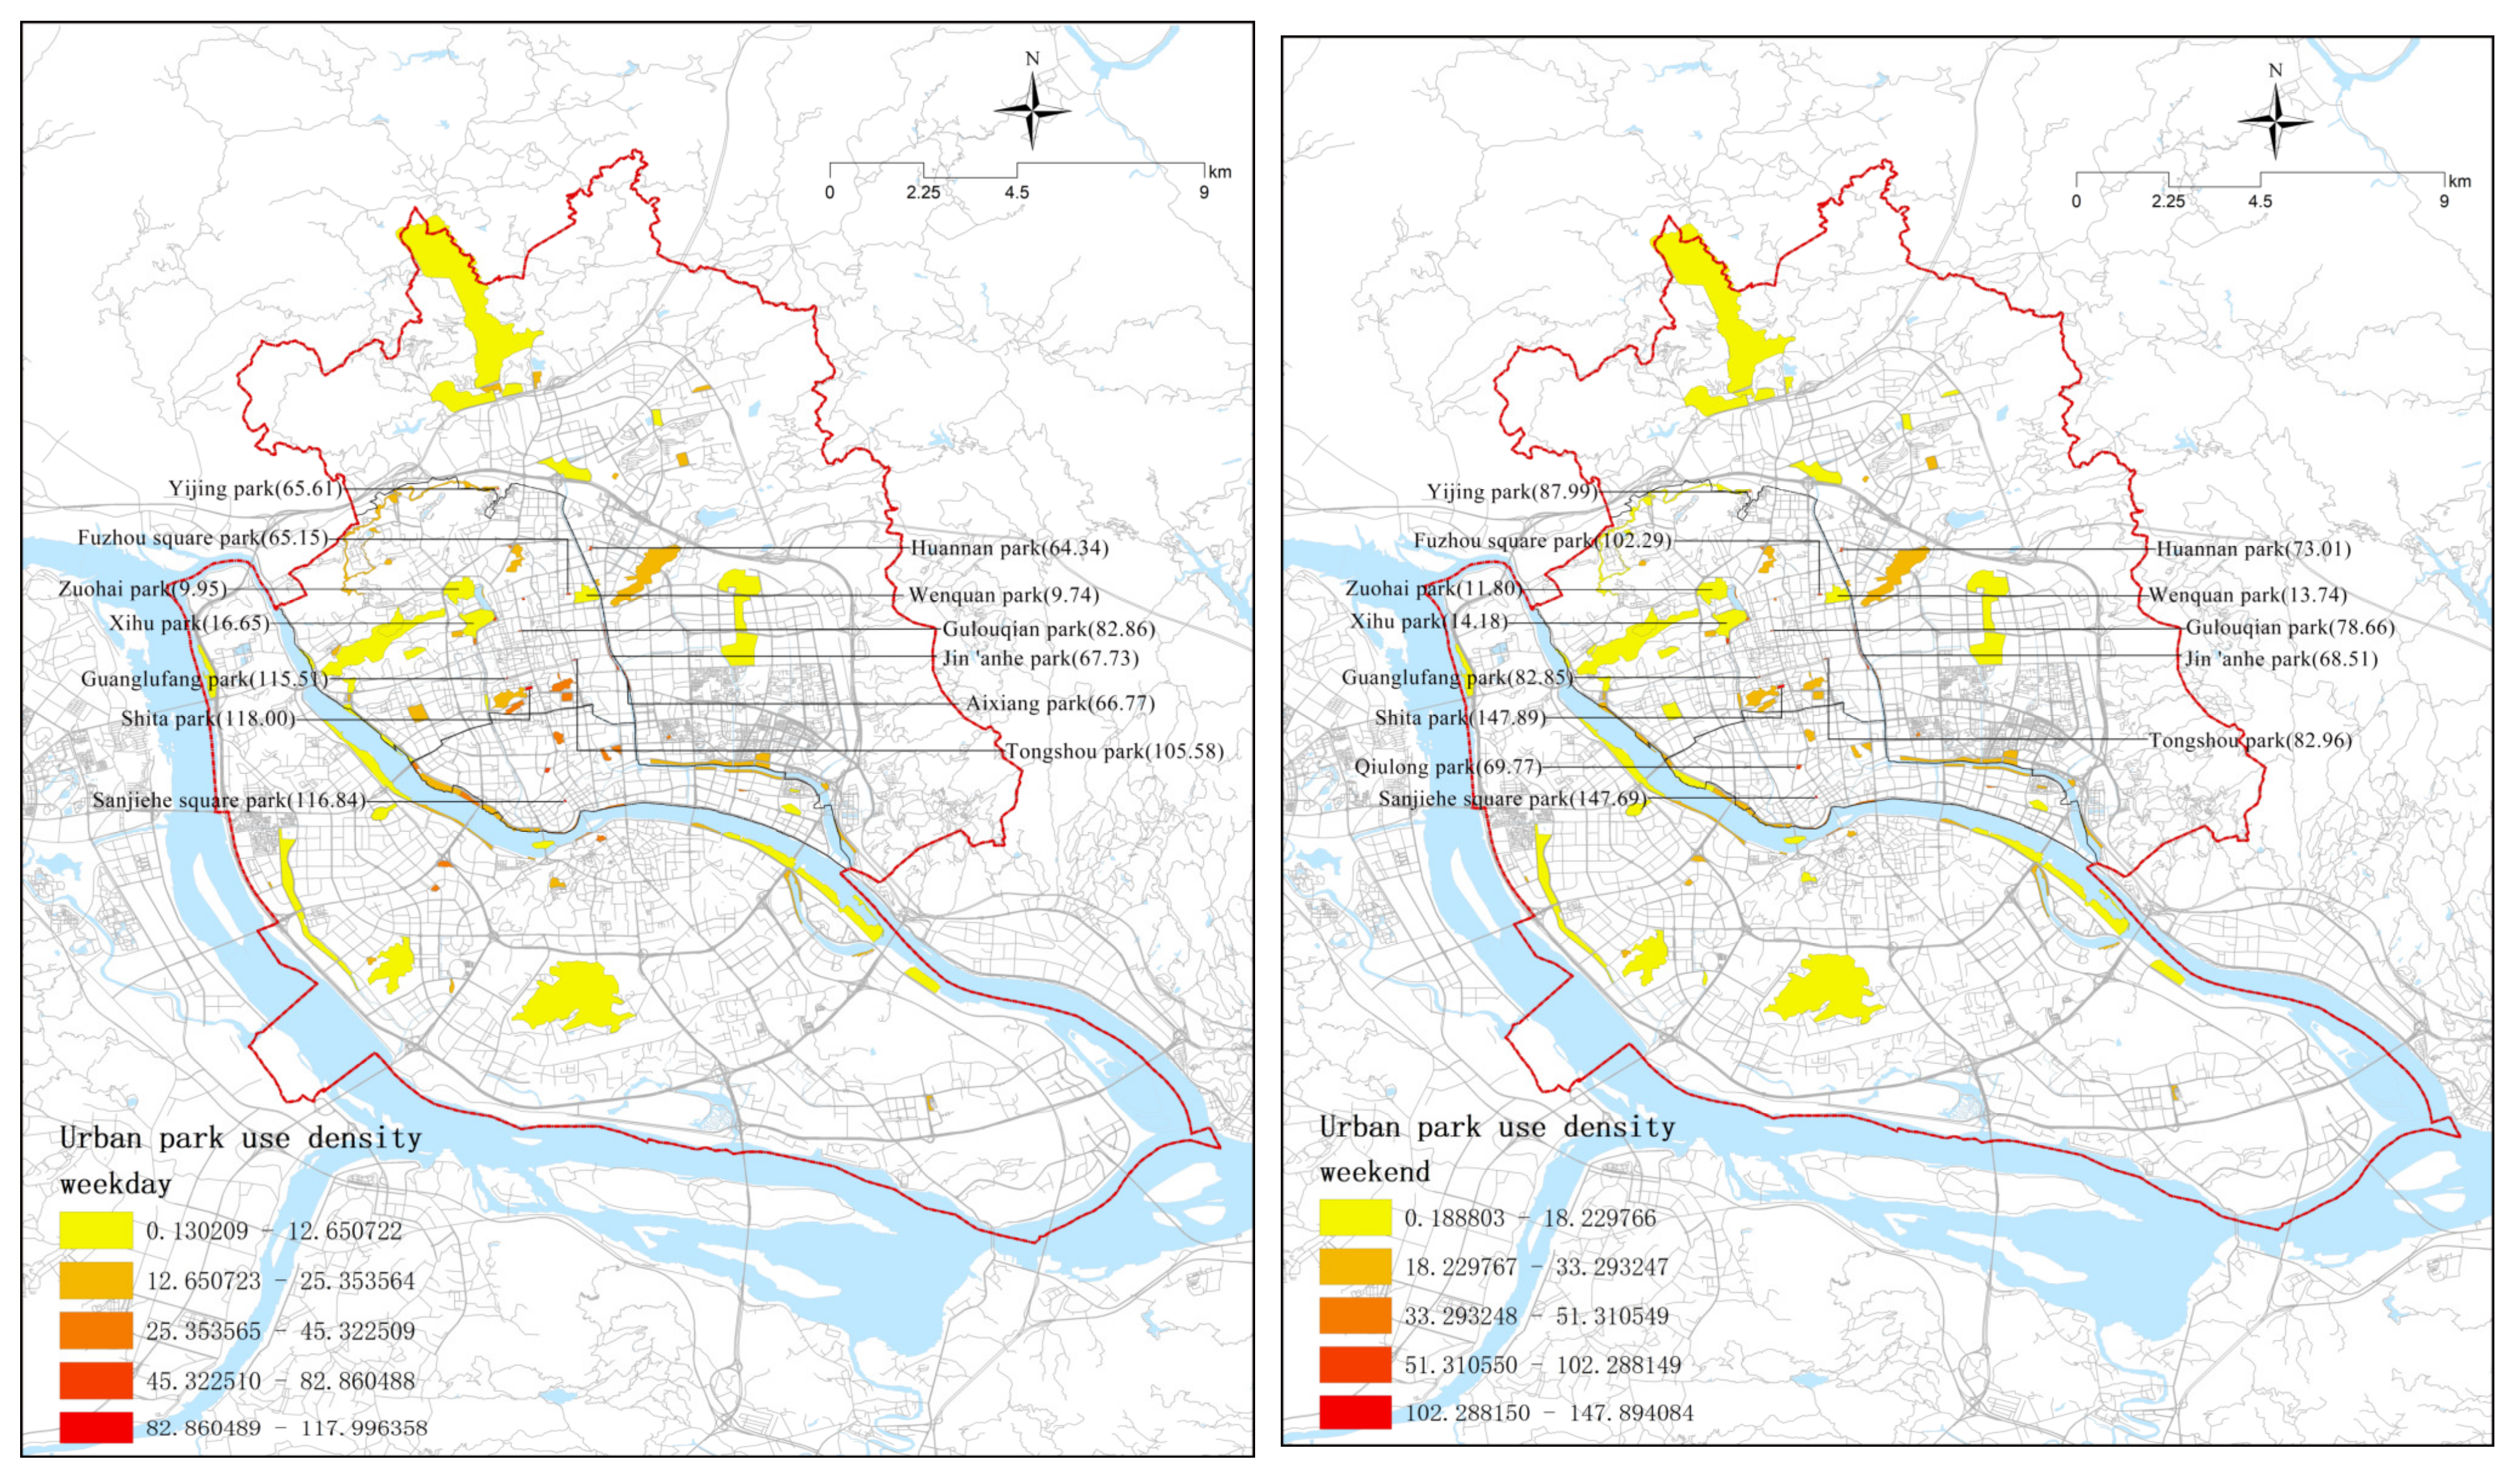
3.1. Spatial Characteristics of Urban Park Use via RTUD Data
3.2. Quantitative Attribution of Park Use via Georaphical Detectors
3.2.1. The Influence of Driving Factors on Urban Park Use
3.2.2. The Interactive Effects of Driving Factors on Urban Park Use
3.3. Spatial Variability in Factors Affecting Park Use via MGWR
3.3.1. Model Comparison
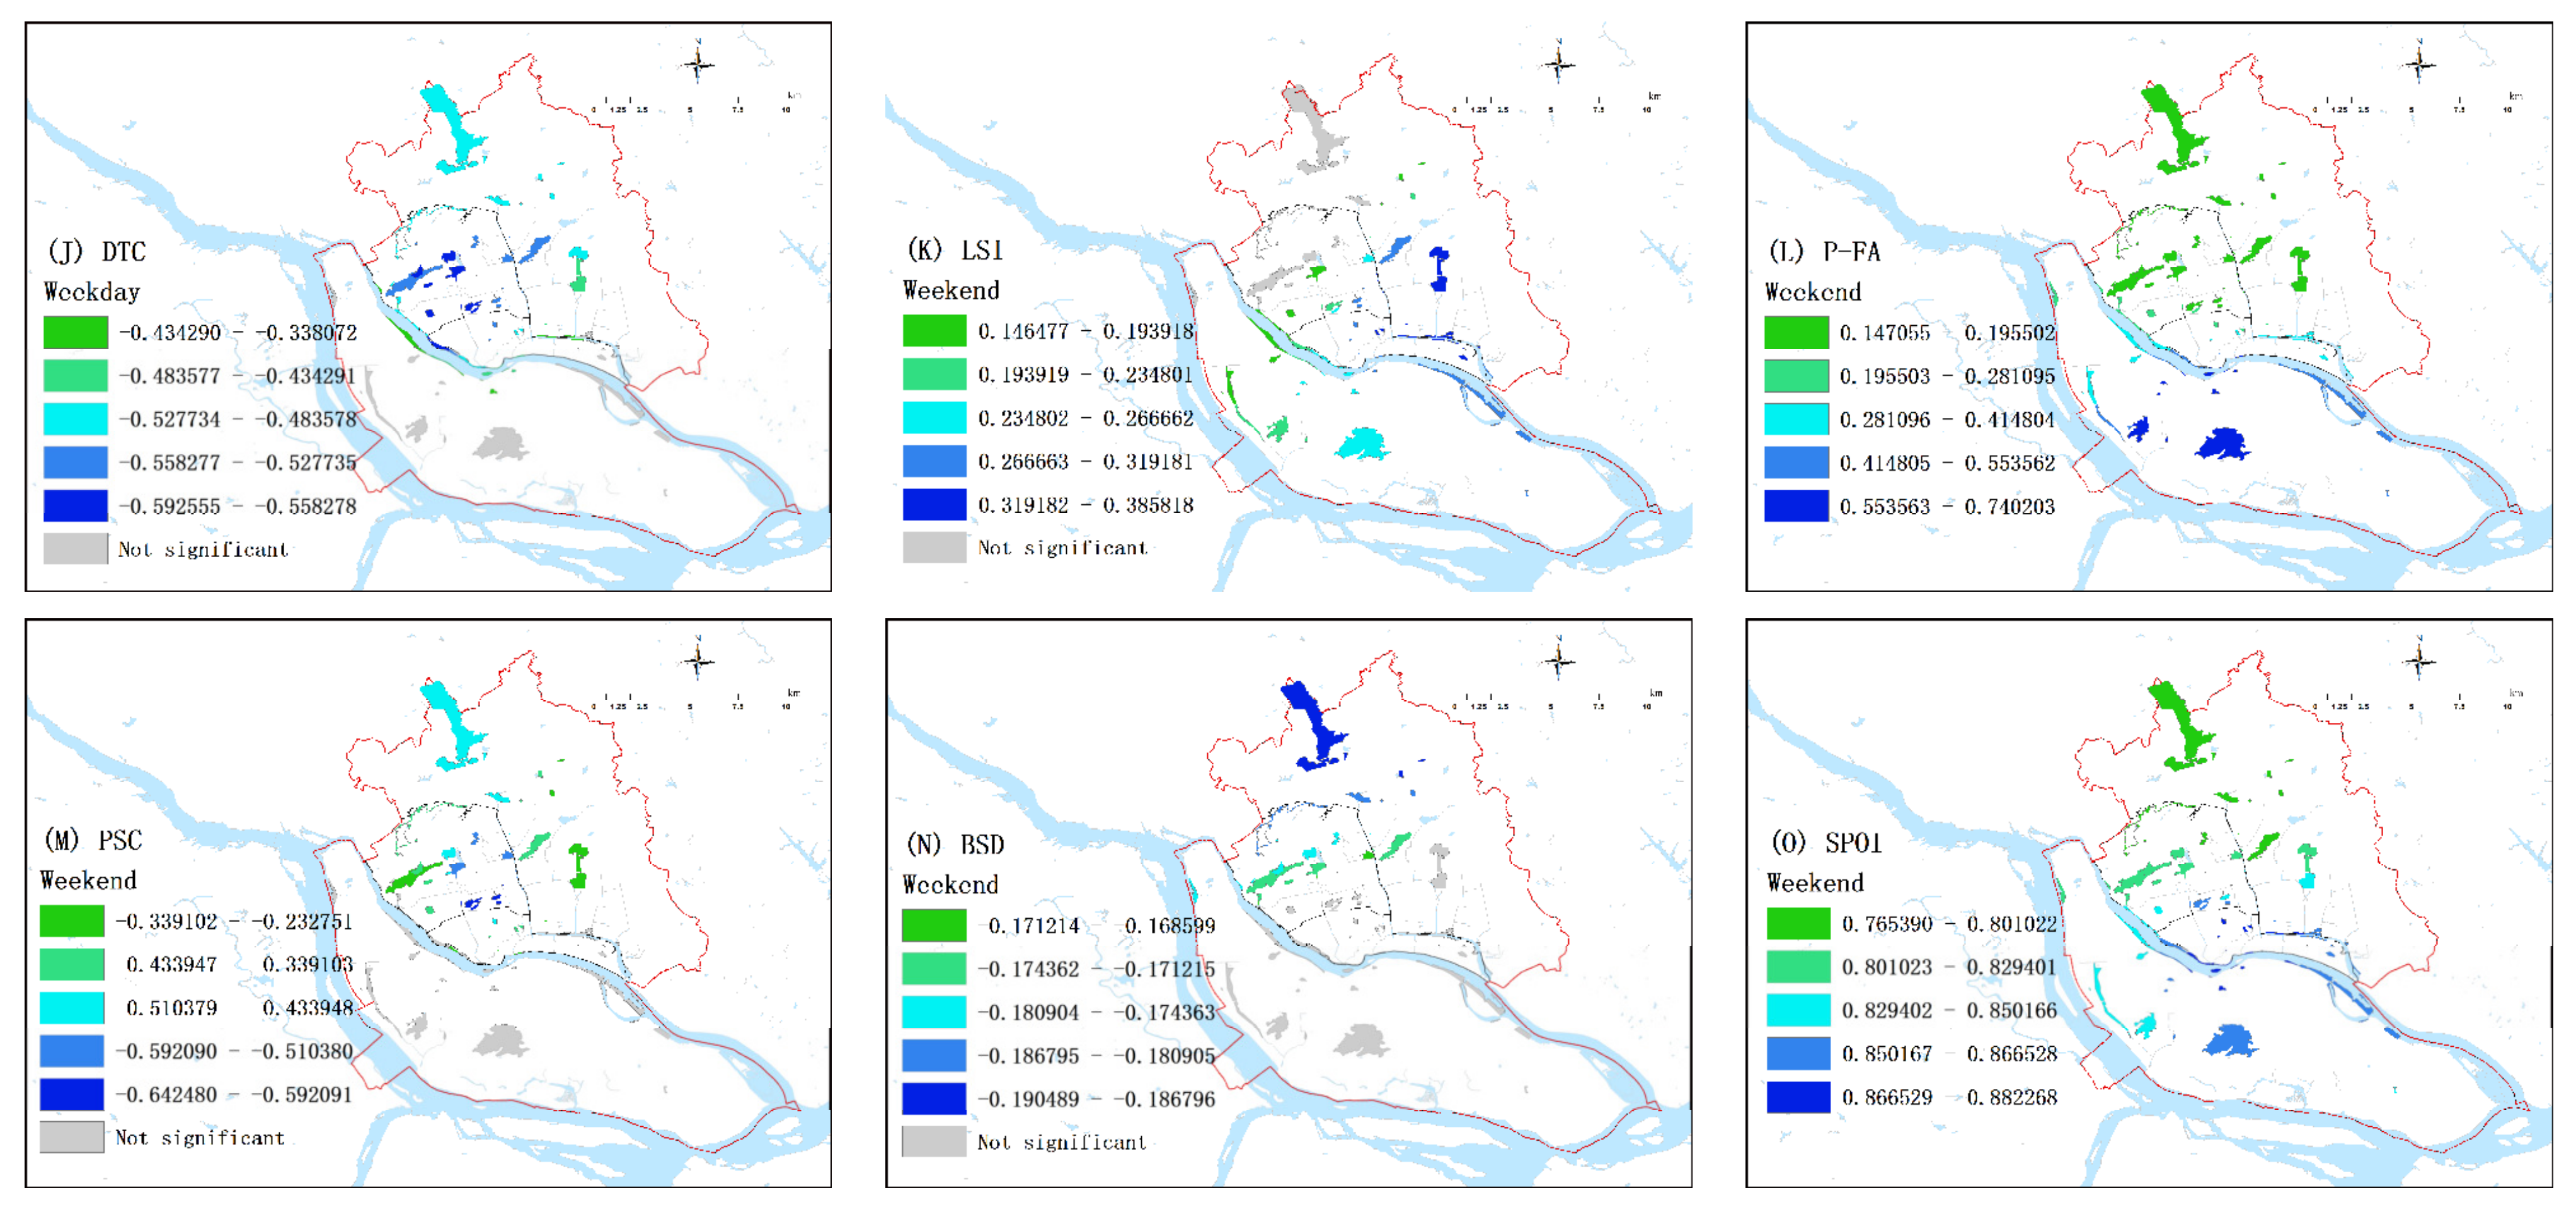
3.3.2. Spatial Patterns of Influencing Factors
4. Discussion
4.1. The Influencing Mechanisms of Urban Park Use
4.2. Methodological and Theoretical Contributions
4.3. Implications for Urban Park Planning and Management in Similar Cities
4.4. Limitations
5. Conclusions
Supplementary Materials
Author Contributions
Funding
Institutional Review Board Statement
Informed Consent Statement
Data Availability Statement
Conflicts of Interest
Abbreviations
References
- Buccolieri, R.; Jeanjean, A.P.R.; Gatto, E.; Leigh, R.J. The impact of trees on street ventilation, NOx and PM2.5 concentrations across heights in Marylebone Rd street canyon, central London. Sustain. Cities Soc. 2018, 41, 227–241. [Google Scholar] [CrossRef]
- Wang, M.; Liu, M.; Zhang, D.; Zhang, Y.; Su, J.; Zhou, S.; Bakhshipour, A.E.; Tan, S.K. Assessing hydrological performance for optimized integrated grey-green infrastructure in response to climate change based on shared socio-economic pathways. Sustain. Cities Soc. 2023, 91, 104436. [Google Scholar] [CrossRef]
- Hong, X.; Wang, G.; Liu, J.; Lan, S. Cognitive persistence of soundscape in urban parks. Sustain. Cities Soc. 2019, 51, 101706. [Google Scholar] [CrossRef]
- Feyisa, G.L.; Dons, K.; Meilby, H. Efficiency of parks in mitigating urban heat island effect: An example from Addis Ababa. Landsc. Urban Plan. 2014, 123, 87–95. [Google Scholar] [CrossRef]
- Aronson, M.F.J.; Lepczyk, C.A.; Evans, K.L.; Goddard, M.A.; Lerman, S.B.; MacIvor, J.S.; Nilon, C.H.; Vargo, T. Biodiversity in the city: Key challenges for urban green space management. Front. Ecol. Environ. 2017, 15, 189–196. [Google Scholar] [CrossRef]
- Zhang, Y.; Wang, M.; Zhang, D.; Lu, Z.; Bakhshipour, A.E.; Liu, M.; Jiang, Z.; Li, J.; Tan, S.K. Multi-stage planning of LID-GREI urban drainage systems in response to land-use changes. Sci. Total Environ. 2023, 859, 160214. [Google Scholar] [CrossRef]
- Dade, M.C.; Mitchell, M.G.E.; Brown, G.; Rhodes, J.R. The effects of urban greenspace characteristics and socio-demographics vary among cultural ecosystem services. Urban For. Urban Green. 2020, 49, 126641. [Google Scholar] [CrossRef]
- Cheng, X.; Van Damme, S.; Uyttenhove, P. Assessing the Impact of Park Renovations on Cultural Ecosystem Services. Land 2022, 11, 610. [Google Scholar] [CrossRef]
- Bustamante, G.; Guzman, V.; Kobayashi, L.C.; Finlay, J. Mental health and well-being in times of COVID-19: A mixed-methods study of the role of neighborhood parks, outdoor spaces, and nature among US older adults. Health Place 2022, 76, 102813. [Google Scholar] [CrossRef]
- Powers, S.L.; Pitas, N.A.D.; Mowen, A.J. Public Perceptions of Local Parks and Recreation as an Essential Community Service During the COVID-19 Pandemic. J. Park Recreat. Adm. 2022, 40, 159–178. [Google Scholar] [CrossRef]
- Xie, J.; Luo, S.; Furuya, K.; Sun, D. Urban Parks as Green Buffers During the COVID-19 Pandemic. Sustainability 2020, 12, 6751. [Google Scholar] [CrossRef]
- Lyu, F.; Zhang, L. Using multi-source big data to understand the factors affecting urban park use in Wuhan. Urban For. Urban Green. 2019, 43, 126367. [Google Scholar] [CrossRef]
- Li, F.; Yao, N.; Liu, D.; Liu, W.; Sun, Y.; Cheng, W.; Li, X.; Wang, X.; Zhao, Y. Explore the recreational service of large urban parks and its influential factors in city clusters—Experiments from 11 cities in the Beijing-Tianjin-Hebei region. J. Clean. Prod. 2021, 314, 128261. [Google Scholar] [CrossRef]
- Ye, Y.; Qiu, H. Exploring Affecting Factors of Park Use Based on Multisource Big Data: Case Study in Wuhan, China. J. Urban Plan. Dev. 2021, 147, 05020037. [Google Scholar] [CrossRef]
- Donahue, M.L.; Keeler, B.L.; Wood, S.A.; Fisher, D.M.; Hamstead, Z.A.; McPhearson, T. Using social media to understand drivers of urban park visitation in the Twin Cities, MN. Landsc. Urban Plan. 2018, 175, 1–10. [Google Scholar] [CrossRef]
- Song, Y.; Newman, G.; Huang, X.; Ye, X. Factors influencing long-term city park visitations for mid-sized US cities: A big data study using smartphone user mobility. Sustain. Cities Soc. 2022, 80, 103815. [Google Scholar] [CrossRef]
- Zhang, S.; Zhou, W. Recreational visits to urban parks and factors affecting park visits: Evidence from geotagged social media data. Landsc. Urban Plan. 2018, 180, 27–35. [Google Scholar] [CrossRef]
- Azagew, S.; Worku, H. Socio-demographic and physical factors influencing access to urban parks in rapidly urbanizing cities of Ethiopia: The case of Addis Ababa. J. Outdoor Recreat. Tour. 2020, 31, 100322. [Google Scholar] [CrossRef]
- Dony, C.C.; Delmelle, E.M.; Delmelle, E.C. Re-conceptualizing accessibility to parks in multi-modal cities: A Variable-width Floating Catchment Area (VFCA) method. Landsc. Urban Plan. 2015, 143, 90–99. [Google Scholar] [CrossRef]
- Chen, Y.; Liu, X.; Gao, W.; Wang, R.Y.; Li, Y.; Tu, W. Emerging social media data on measuring urban park use. Urban For. Urban Green. 2018, 31, 130–141. [Google Scholar] [CrossRef]
- He, Z.; Li, Y. Spatial and temporal characteristics of urban park usage activity in Shanghai based on open data. Chin. Landsc. Archit. 2020, 36, 45–50. [Google Scholar] [CrossRef]
- Guo, S.; Yang, G.; Pei, T.; Ma, T.; Song, C.; Shu, H.; Du, Y.; Zhou, C. Analysis of factors affecting urban park service area in Beijing: Perspectives from multi-source geographic data. Landsc. Urban Plan. 2019, 181, 103–117. [Google Scholar] [CrossRef]
- Li, F.; Li, F.; Li, S.; Long, Y. Deciphering the recreational use of urban parks: Experiments using multi-source big data for all Chinese cities. Sci. Total Environ. 2020, 701, 134896. [Google Scholar] [CrossRef] [PubMed]
- Gibson, S.C. “Let’s go to the park.” An investigation of older adults in Australia and their motivations for park visitation. Landsc. Urban Plan. 2018, 180, 234–246. [Google Scholar] [CrossRef]
- Evenson, K.R.; Jones, S.A.; Holliday, K.M.; Cohen, D.A.; McKenzie, T.L. Park characteristics, use, and physical activity: A review of studies using SOPARC (System for Observing Play and Recreation in Communities). Prev. Med. 2016, 86, 153–166. [Google Scholar] [CrossRef]
- Marti, P.; Serrano-Estrada, L.; Nolasco-Cirugeda, A. Using locative social media and urban cartographies to identify and locate successful urban plazas. Cities 2017, 64, 66–78. [Google Scholar] [CrossRef]
- Deville, P.; Linard, C.; Martin, S.; Gilbert, M.; Stevens, F.R.; Gaughan, A.E.; Blondel, V.D.; Tatem, A.J. Dynamic population mapping using mobile phone data. Proc. Natl. Acad. Sci. USA 2014, 111, 15888–15893. [Google Scholar] [CrossRef]
- Hamstead, Z.A.; Fisher, D.; Ilieva, R.T.; Wood, S.A.; McPhearson, T.; Kremer, P. Geolocated social media as a rapid indicator of park visitation and equitable park access. Comput. Environ. Urban 2018, 72, 38–50. [Google Scholar] [CrossRef]
- Plunz, R.A.; Zhou, Y.; Vintimilla, M.I.C.; Mckeown, K.; Yu, T.; Uguccioni, L.; Sutto, M.P. Twitter sentiment in New York City parks as measure of well-being. Landsc. Urban Plan. 2019, 189, 235–246. [Google Scholar] [CrossRef]
- Yao, Y.; Liu, X.; Li, X.; Zhang, J.; Liang, Z.; Mai, K.; Zhang, Y. Mapping fine-scale population distributions at the building level by integrating multisource geospatial big data. Int. J. Geogr. Inf. Sci. 2017, 31, 1220–1244. [Google Scholar] [CrossRef]
- Qin, S.; Yang, J.; Feng, Y.; Yan, S. Spatiotemporal vitality and influencing factors of urban parks based on multi-source data: A case study of Nanjing. Chin. Landsc. Archit. 2021, 37, 68–73. [Google Scholar] [CrossRef]
- He, J.; Li, X.; Liu, P.; Wu, X.; Zhang, J.; Zhang, D.; Liu, X.; Yao, Y. Accurate estimation of the proportion of mixed land use at the street-block level by integrating high spatial resolution images and geospatial big data. IEEE Trans. Geosci. Remote Sens. 2020, 59, 6357–6370. [Google Scholar] [CrossRef]
- He, X.; Deng, M.; Luo, G. Recognizing Building Group Patterns in Topographic Maps by Integrating Building Functional and Geometric Information. ISPRS Int. J. Geo-Inf. 2022, 11, 332. [Google Scholar] [CrossRef]
- Zhou, C.; Fu, L.; Xue, Y.; Wang, Z.; Zhang, Y. Using multi-source data to understand the factors affecting mini-park visitation in Yancheng. Environ. Plan B-Urban 2021, 49, 754–770. [Google Scholar] [CrossRef]
- Zhang, R.; Tao, C.; Zhang, Y.; Hou, Y.; Chang, Q. Health risk assessment of heavy metals in agricultural soils and identification of main influencing factors in a typical industrial park in northwest China. Chemosphere 2020, 252, 126591. [Google Scholar] [CrossRef]
- Yang, L.; Jiao, H. Spatiotemporal Changes in Ecosystem Services Value and Its Driving Factors in the Karst Region of China. Sustainability 2022, 14, 6695. [Google Scholar] [CrossRef]
- Lan, F.; Wu, Q.; Zhou, T.; Da, H. Spatial Effects of Public Service Facilities Accessibility on Housing Prices: A Case Study of Xi’an, China. Sustainability 2018, 10, 4503. [Google Scholar] [CrossRef]
- Wei, P.; Xie, S.; Huang, L.; Liu, L. Ingestion of GNSS-Derived ZTD and PWV for Spatial Interpolation of PM2.5 Concentration in Central and Southern China. Int. J. Environ. Res. Public Health 2021, 18, 7931. [Google Scholar] [CrossRef]
- National Bureau of Statistics; Fuzhou Bureau of Statistics, Fuzhou Investigation Team, S.B.O.S. Fuzhou Statistical Yearbook 2021, 1st ed.; China Statistical Publishing House: Beijing, China, 2021. [Google Scholar]
- CJJ/T85-2017; Ministry of Housing and Urban Rural Development (MOHURD) of China (2017) Standard for Classification of Urban Green Space. China Architecture & Building Press: Beijing, China, 2017.
- Limited, T.H. Tencent 2021 Third Quarter Earnings. Available online: https://static.www.tencent.com/uploads/2021/11/10/57d32da50c1d7abe221d7f9ca9ec3dcb.pdf (accessed on 26 April 2022).
- van der Veen, A.M.; Linsinger, T.P.; Pauwels, J. Uncertainty Calculations in the Certification of Reference Materials. 2. Homogeneity Study. In Measurement Uncertainty in Chemical Analysis; Springer: Berlin/Heidelberg, Germany, 2001; pp. 94–98. [Google Scholar]
- Liu, J.; Peng, J. Two-factor Analysis of Variance on Biological Experimental Data. Chin. J. Zool. 2003, 38, 51–55. [Google Scholar]
- Fan, Z.; Duan, J.; Lu, Y.; Zou, W.; Lan, W. A geographical detector study on factors influencing urban park use in Nanjing, China. Urban For. Urban Green. 2021, 59, 126996. [Google Scholar] [CrossRef]
- Bertram, C.; Meyerhoff, J.; Rehdanz, K.; Wuestemann, H. Differences in the recreational value of urban parks between weekdays and weekends: A discrete choice analysis. Landsc. Urban Plan. 2017, 159, 5–14. [Google Scholar] [CrossRef]
- Wang, S.; Wang, M.; Liu, Y. Access to urban parks: Comparing spatial accessibility measures using three GIS-based approaches. Comput. Environ. Urban 2021, 90, 101713. [Google Scholar] [CrossRef]
- GB/T 51346; Ministry of Housing and Urban Rural Development (MOHURD) of China (2019) Standard for Planning of Urban Green Space. China Architecture & Building Press: Beijing, China, 2019.
- Wang, J.; Xu, C. Geodetector: Principle and prospective. Acta Geogr. Sin. 2017, 72, 116–134. [Google Scholar]
- Cao, F.; Ge, Y.; Wang, J. Optimal discretization for geographical detectors-based risk assessment. Gisci. Remote Sens. 2013, 50, 78–92. [Google Scholar] [CrossRef]
- Yu, H.; Fotheringham, A.S.; Li, Z.; Oshan, T.; Kang, W.; Wolf, L.J. Inference in multiscale geographically weighted regression. Geogr. Anal. 2020, 52, 87–106. [Google Scholar] [CrossRef]
- Fotheringham, A.S.; Yang, W.; Kang, W. Multiscale Geographically Weighted Regression (MGWR). Ann. Am. Assoc. Geogr. 2017, 107, 1247–1265. [Google Scholar] [CrossRef]
- Li, Z.; Fotheringham, A.S. Computational improvements to multi-scale geographically weighted regression. Int. J. Geogr. Inf. Sci. 2020, 34, 1378–1397. [Google Scholar] [CrossRef]
- Fry, D.; Hipp, J.A.; Alberico, C.; Huang, J.; Lovasi, G.S.; Floyd, M.F. Land use diversity and park use in New York City. Prev. Med. Rep. 2021, 22, 101321. [Google Scholar] [CrossRef]
- Li, F.; Zhang, F.; Li, X.; Wang, P.; Liang, J.; Mei, Y.; Cheng, W.; Qian, Y. Spatiotemporal Patterns of the Use of Urban Green Spaces and External Factors Contributing to Their Use in Central Beijing. Int. J. Environ. Res. Public Health 2017, 14, 237. [Google Scholar] [CrossRef]
- Schipperijn, J.; Ekholm, O.; Stigsdotter, U.K.; Toftager, M.; Bentsen, P.; Kamper-Jorgensen, F.; Randrup, T.B. Factors influencing the use of green space: Results from a Danish national representative survey. Landsc. Urban Plan 2010, 95, 130–137. [Google Scholar] [CrossRef]
- Zou, Y. Air Pollution and Housing Prices across Chinese Cities. J. Urban Plan. Dev. 2019, 145, 04019012. [Google Scholar] [CrossRef]
- Kerishnan, P.B.; Maruthaveeran, S.; Maulan, S. Investigating the usability pattern and constraints of pocket parks in Kuala Lumpur, Malaysia. Urban For. Urban Green. 2020, 50, 126647. [Google Scholar] [CrossRef]
- Luo, L.; Mei, K.; Qua, L.; Zhang, C.; Chen, H.; Wang, S.; Di, D.; Huang, H.; Wang, Z.; Xia, F.; et al. Assessment of the Geographical Detector Method for investigating heavy metal source apportionment in an urban watershed of Eastern China. Sci. Total Environ. 2019, 653, 714–722. [Google Scholar] [CrossRef] [PubMed]
- Levin, N.; Lechner, A.M.; Brown, G. An evaluation of crowdsourced information for assessing the visitation and perceived importance of protected areas. Appl. Geogr. 2017, 79, 115–126. [Google Scholar] [CrossRef]
- Li, H.; Liu, Y. Neighborhood socioeconomic disadvantage and urban public green spaces availability: A localized modeling approach to inform land use policy. Land Use Policy 2016, 57, 470–478. [Google Scholar] [CrossRef]
- Wang, M.; Jiang, Z.; Zhang, D.; Zhang, Y.; Liu, M.; Rao, Q.; Li, J.; Tan, S.K. Optimization of integrating life cycle cost and systematic resilience for grey-green stormwater infrastructure. Sustain. Cities Soc. 2023, 90, 104379. [Google Scholar] [CrossRef]
- Park, K.; Christensen, K.; Lee, D. Unmanned aerial vehicles (UAVs) in behavior mapping: A case study of neighborhood parks. Urban For. Urban Green. 2020, 52, 126693. [Google Scholar] [CrossRef]
- Hu, X.; Shen, P.; Shi, Y.; Zhang, Z. Using Wi-Fi probe and location data to analyze the human distribution characteristics of green spaces: A case study of the Yanfu Greenland Park, China. Urban For. Urban Green. 2020, 54, 126733. [Google Scholar] [CrossRef]


| Variable Type | Index | Description | Unit | Data Source | |
|---|---|---|---|---|---|
| Dependent variable | Park user density (PUD) | Average active Tencent users per hour per unit area during peak visits on weekdays and weekends | Population/ha·h | Collected from RUTD | |
| Independent variable | Park characteristics | Park size (P-SI) | Park area | m2 | Extracted from AMAP |
| Park type (P-TY) | Comprehensive parks, special parks, community parks, mini-parks | - | Comprehensive parks (=7), special parks (=5), community parks (=3), mini-parks (=1) | ||
| Landscape shape index (LSI) | The landscape shape index | - | |||
| Water size (W-SI) | Water area | m2 | Extracted from AMAP | ||
| Park facilities (P-FA) | The density of the number of park facilities, such as playgrounds, themed plazas, lounge corridors, restaurants, shops, toilets, and parking lots | n/ha | Field research | ||
| Park service capability (PSC) | The overall park rating from the perspectives of scenery, hygiene, safety, and other services | Grade | The average scores from comments on Dianping were calculated (www.dianping.com, accessed on 7 December 2021) | ||
| Accessibility | Distance to the city center (DTC) | The distance from the park to the city center | m | The network distance from the park centroid to Fuzhou Wuyi Square was calculated in ArcGIS 10.6 | |
| Bus station density (BSD) | The density of the number of bus stations within buffer areas of each park | n/ha | Calculated in ArcGIS 10.6, buffer analysis was conducted based on data from the Fuzhou public transportation website (http://fuzhou.gongjiao.com/, accessed on 12 November 2021) | ||
| Walking in an isochronous circle (15 min) (W-15) | Area accessibility from walking for 15 min in non-peak hours on weekdays from the park | m2 | Used the AMAP real-time path planning tool to obtain a grid file describing the time distance to the park in ArcGIS 10.6 | ||
| Driving in an isochronous circle (30 min) (D-30) | Area accessibility from driving for 30 min in non-peak hours on weekdays from the park | m2 | Used the AMAP real-time path planning tool to obtain a grid file describing the time distance to the park in ArcGIS 10.6 | ||
| Surrounding environment features | Residential population density (RPD) | The density of the residential population within the buffer areas of each park | Population/ha | Calculated in ArcGIS 10.6, buffer analysis was conducted based on mobile phone signaling data | |
| Working population density (WPD) | The density of the working population within the buffer areas of each park | Population/ha | Calculated in ArcGIS 10.6, buffer analysis was conducted based on mobile phone signaling data | ||
| Park-surrounding facilities and services (SPOI) | The density of the number of SPOI within the buffer areas of each park | n/ha | Calculated in ArcGIS 10.6, buffer analysis was conducted based on data from AMAP Map in 2021 | ||
| (A) Weekday | |||||||||||||
|---|---|---|---|---|---|---|---|---|---|---|---|---|---|
| Factor | P-SI | P-TY | LSI | W-SI | P-FA | PSC | DTC | BSD | W-15 | D-30 | RPD | WPD | SPOI |
| q-statistic | 0.3813 | 0.3928 | 0.0537 | 0.1177 | 0.3993 | 0.1240 | 0.3984 | 0.1347 | 0.1711 | 0.1933 | 0.3506 | 0.3619 | 0.6006 |
| p-value | 0 | 0 | 0.61 | 0.09 | 0 | 0.15 | 0 | 0.09 | 0.01 | 0.02 | 0 | 0 | 0 |
| (B) Weekend | |||||||||||||
| Factor | P-SI | P-TY | LSI | W-SI | P-FA | PSC | DTC | BSD | W-15 | D-30 | RPD | WPD | SPOI |
| q-statistic | 0.4500 | 0.4048 | 0.0482 | 0.1396 | 0.3655 | 0.1666 | 0.3131 | 0.1405 | 0.1266 | 0.2475 | 0.3191 | 0.2346 | 0.6237 |
| p-value | 0 | 0 | 0.66 | 0.03 | 0 | 0.05 | 0 | 0.07 | 0.09 | 0 | 0 | 0 | 0 |
| (A) Weekday | |||||||||||||
|---|---|---|---|---|---|---|---|---|---|---|---|---|---|
| P-SI | P-TY | LSI | W-SI | P-FA | PSC | DTC | BSD | W-15 | D-30 | RPD | WPD | SPOI | |
| P-SI | 0.3813 | ||||||||||||
| P-TY | 0.5029 (EB) | 0.3928 | |||||||||||
| LSI | 0.4299 (EB) | 0.4660 (EN) | 0.0537 | ||||||||||
| W-SI | 0.4003 (EB) | 0.4373 (EB) | 0.2000 (EN) | 0.1177 | |||||||||
| P-FA | 0.6126 (EB) | 0.6252 (EB) | 0.5830 (EN) | 0.4807 (EB) | 0.3993 | ||||||||
| PSC | 0.5469 (EN) | 0.5831 (EN) | 0.3293 (EN) | 0.1992 (EB) | 0.5710 (EN) | 0.1240 | |||||||
| DTC | 0.6668 (EB) | 0.6863 (EB) | 0.4879 (EN) | 0.5143 (EB) | 0.6474 (EB) | 0.7198 (EN) | 0.3984 | ||||||
| BSD | 0.5232 (EB) | 0.5785 (EN) | 0.3725 (EN) | 0.2998 (EN) | 0.6617 (EN) | 0.5675 (EN) | 0.6109 (EN) | 0.1347 | |||||
| W-15 | 0.6291 (EN) | 0.7041 (EN) | 0.4241 (EN) | 0.3103 (EN) | 0.6816 (EN) | 0.4635 (EN) | 0.6357 (EN) | 0.5330 (EN) | 0.1711 | ||||
| D-30 | 0.6120 (EN) | 0.6328 (EN) | 0.4105 (EN) | 0.3380 (EN) | 0.5577 (EB) | 0.4452 (EN) | 0.7011 (EN) | 0.5354 (EN) | 0.6188 (EN) | 0.1933 | |||
| RPD | 0.7217 (EB) | 0.6477 (EB) | 0.5035 (EN) | 0.4752 (EB) | 0.7150 (EB) | 0.7177 (EN) | 0.6075 (EB) | 0.6360 (EN) | 0.6509 (EN) | 0.5808 (EN) | 0.3506 | ||
| WPD | 0.7438 (EB) | 0.7239 (EB) | 0.5550 (EN) | 0.4466 (EB) | 0.7120 (EB) | 0.6401 (EN) | 0.5402 (EB) | 0.6833 (EN) | 0.5948 (EN) | 0.6145 (EN) | 0.5819 (EB) | 0.3619 | |
| SPOI | 0.8355 (EB) | 0.8455 (EB) | 0.7965 (EN) | 0.7143 (EB) | 0.7885 (EB) | 0.8775 (EN) | 0.7031 (EB) | 0.7551 (EN) | 0.7118 (EB) | 0.7481 (EB) | 0.7006 (EB) | 0.6978 (EB) | 0.6006 |
| (B) Weekend | |||||||||||||
| P-SI | P-TY | LSI | W-SI | P-FA | PSC | DTC | BSD | W-15 | D-30 | RPD | WPD | SPOI | |
| P-SI | 0.4500 | ||||||||||||
| P-TY | 0.5584 (EB) | 0.4048 | |||||||||||
| LSI | 0.4928 (EB) | 0.4904 (EN) | 0.0482 | ||||||||||
| W-SI | 0.4746 (EB) | 0.4534 (EB) | 0.2106 (EN) | 0.1396 | |||||||||
| P-FA | 0.6163 (EB) | 0.6667 (EB) | 0.5739 (EN) | 0.4594 (EB) | 0.3655 | ||||||||
| PSC | 0.6077 (EB) | 0.6510 (EN) | 0.3376 (EN) | 0.2345 (EB) | 0.5385 (EB) | 0.1666 | |||||||
| DTC | 0.6211 (EB) | 0.6019 (EB) | 0.3935 (EN) | 0.4376 (EB) | 0.6075 (EB) | 0.7031 (EN) | 0.3131 | ||||||
| BSD | 0.5710 (EB) | 0.5941 (EN) | 0.3581 (EN) | 0.3026 (EN) | 0.6742 (EN) | 0.4866 (EN) | 0.5373 (EN) | 0.1405 | |||||
| W-15 | 0.5884 (EB) | 0.6601 (EN) | 0.3653 (EN) | 0.2724 (EB) | 0.6546 (EN) | 0.4662 (EN) | 0.5677 (EN) | 0.4426 (EN) | 0.1266 | ||||
| D-30 | 0.7872 (EN) | 0.7724 (EN) | 0.4477 (EN) | 0.4397 (EN) | 0.5805 (EB) | 0.5148 (EN) | 0.7355 (EN) | 0.5346 (EN) | 0.6249 (EN) | 0.2475 | |||
| RPD | 0.7472 (EB) | 0.6118 (EB) | 0.4926 (EN) | 0.4521 (EB) | 0.6516 (EB) | 0.7518 (EN) | 0.5481 (EB) | 0.5802 (EN) | 0.6584 (EN) | 0.6304 (EN) | 0.3191 | ||
| WPD | 0.6854 (EB) | 0.6370 (EB) | 0.4091 (EN) | 0.3523 (EB) | 0.6199 (EN) | 0.5856 (EN) | 0.4156 (EB) | 0.6054 (EN) | 0.4960 (EN) | 0.5998 (EN) | 0.5372 (EB) | 0.2346 | |
| SPOI | 0.8752 (EB) | 0.8509 (EB) | 0.8206 (EN) | 0.7185 (EB) | 0.8165 (EB) | 0.9264 (EN) | 0.7736 (EB) | 0.7703 (EB) | 0.7428 (EB) | 0.7611 (EB) | 0.7337 (EB) | 0.7134 (EB) | 0.6237 |
| Variable | Weekday | Weekend | ||||||
|---|---|---|---|---|---|---|---|---|
| Coefficient | t-Test | Coefficient | t-Test | |||||
| Mean | p < 0.05 (%) | Positive Value (%) | Negative Value (%) | Mean | p < 0.05(%) | Positive Value (%) | Negative Value (%) | |
| Intercept | −0.145 | 12.25 | 0 | 100 | 0.013 | 0 | 82.65 | 17.35 |
| P-SI | 0.035 | 0 | 100 | 0 | −0.005 | 0 | 29.60 | 70.40 |
| P-TY | −0.120 | 0 | 0 | 100 | −0.052 | 0 | 0 | 100 |
| LSI | 0.240 | 68.37 | 100 | 0 | 0.234 | 78.57 | 100 | 0 |
| W-SI | 0.015 | 0 | 100 | 0 | 0.016 | 0 | 82.65 | 17.35 |
| P-FA | 0.223 | 100 | 100 | 0 | 0.312 | 100 | 100 | 0 |
| PSC | −0.230 | 46.94 | 10.2 | 89.80 | −0.316 | 54.08 | 0 | 100 |
| DTC | −0.414 | 74.49 | 2.04 | 97.96 | −0.035 | 0 | 12.24 | 87.76 |
| BSD | −0.225 | 83.67 | 0 | 100 | −0.154 | 36.73 | 0 | 100 |
| W-15 | −0.119 | 8.16 | 6.12 | 93.88 | −0.097 | 0 | 0 | 100 |
| D-30 | 0.115 | 2.04 | 100 | 0 | 0.094 | 0 | 100 | 0 |
| RPD | −0.223 | 16.33 | 0 | 100 | −0.044 | 0 | 0 | 100 |
| WPD | 0.082 | 0 | 100 | 0 | −0.039 | 0 | 0 | 100 |
| SPOI | 0.761 | 100 | 100 | 0 | 0.838 | 100 | 100 | 0 |
Disclaimer/Publisher’s Note: The statements, opinions and data contained in all publications are solely those of the individual author(s) and contributor(s) and not of MDPI and/or the editor(s). MDPI and/or the editor(s) disclaim responsibility for any injury to people or property resulting from any ideas, methods, instructions or products referred to in the content. |
© 2023 by the authors. Licensee MDPI, Basel, Switzerland. This article is an open access article distributed under the terms and conditions of the Creative Commons Attribution (CC BY) license (https://creativecommons.org/licenses/by/4.0/).
Share and Cite
Zeng, L.; Liu, C. Exploring Factors Affecting Urban Park Use from a Geospatial Perspective: A Big Data Study in Fuzhou, China. Int. J. Environ. Res. Public Health 2023, 20, 4237. https://doi.org/10.3390/ijerph20054237
Zeng L, Liu C. Exploring Factors Affecting Urban Park Use from a Geospatial Perspective: A Big Data Study in Fuzhou, China. International Journal of Environmental Research and Public Health. 2023; 20(5):4237. https://doi.org/10.3390/ijerph20054237
Chicago/Turabian StyleZeng, Liguo, and Chunqing Liu. 2023. "Exploring Factors Affecting Urban Park Use from a Geospatial Perspective: A Big Data Study in Fuzhou, China" International Journal of Environmental Research and Public Health 20, no. 5: 4237. https://doi.org/10.3390/ijerph20054237
APA StyleZeng, L., & Liu, C. (2023). Exploring Factors Affecting Urban Park Use from a Geospatial Perspective: A Big Data Study in Fuzhou, China. International Journal of Environmental Research and Public Health, 20(5), 4237. https://doi.org/10.3390/ijerph20054237