
Analysis of Factors Influencing Air Quality in Different Periods during COVID-19: A Case Study of Tangshan, China

Abstract
1. Introduction
2. Data and Methods
2.1. Study Area
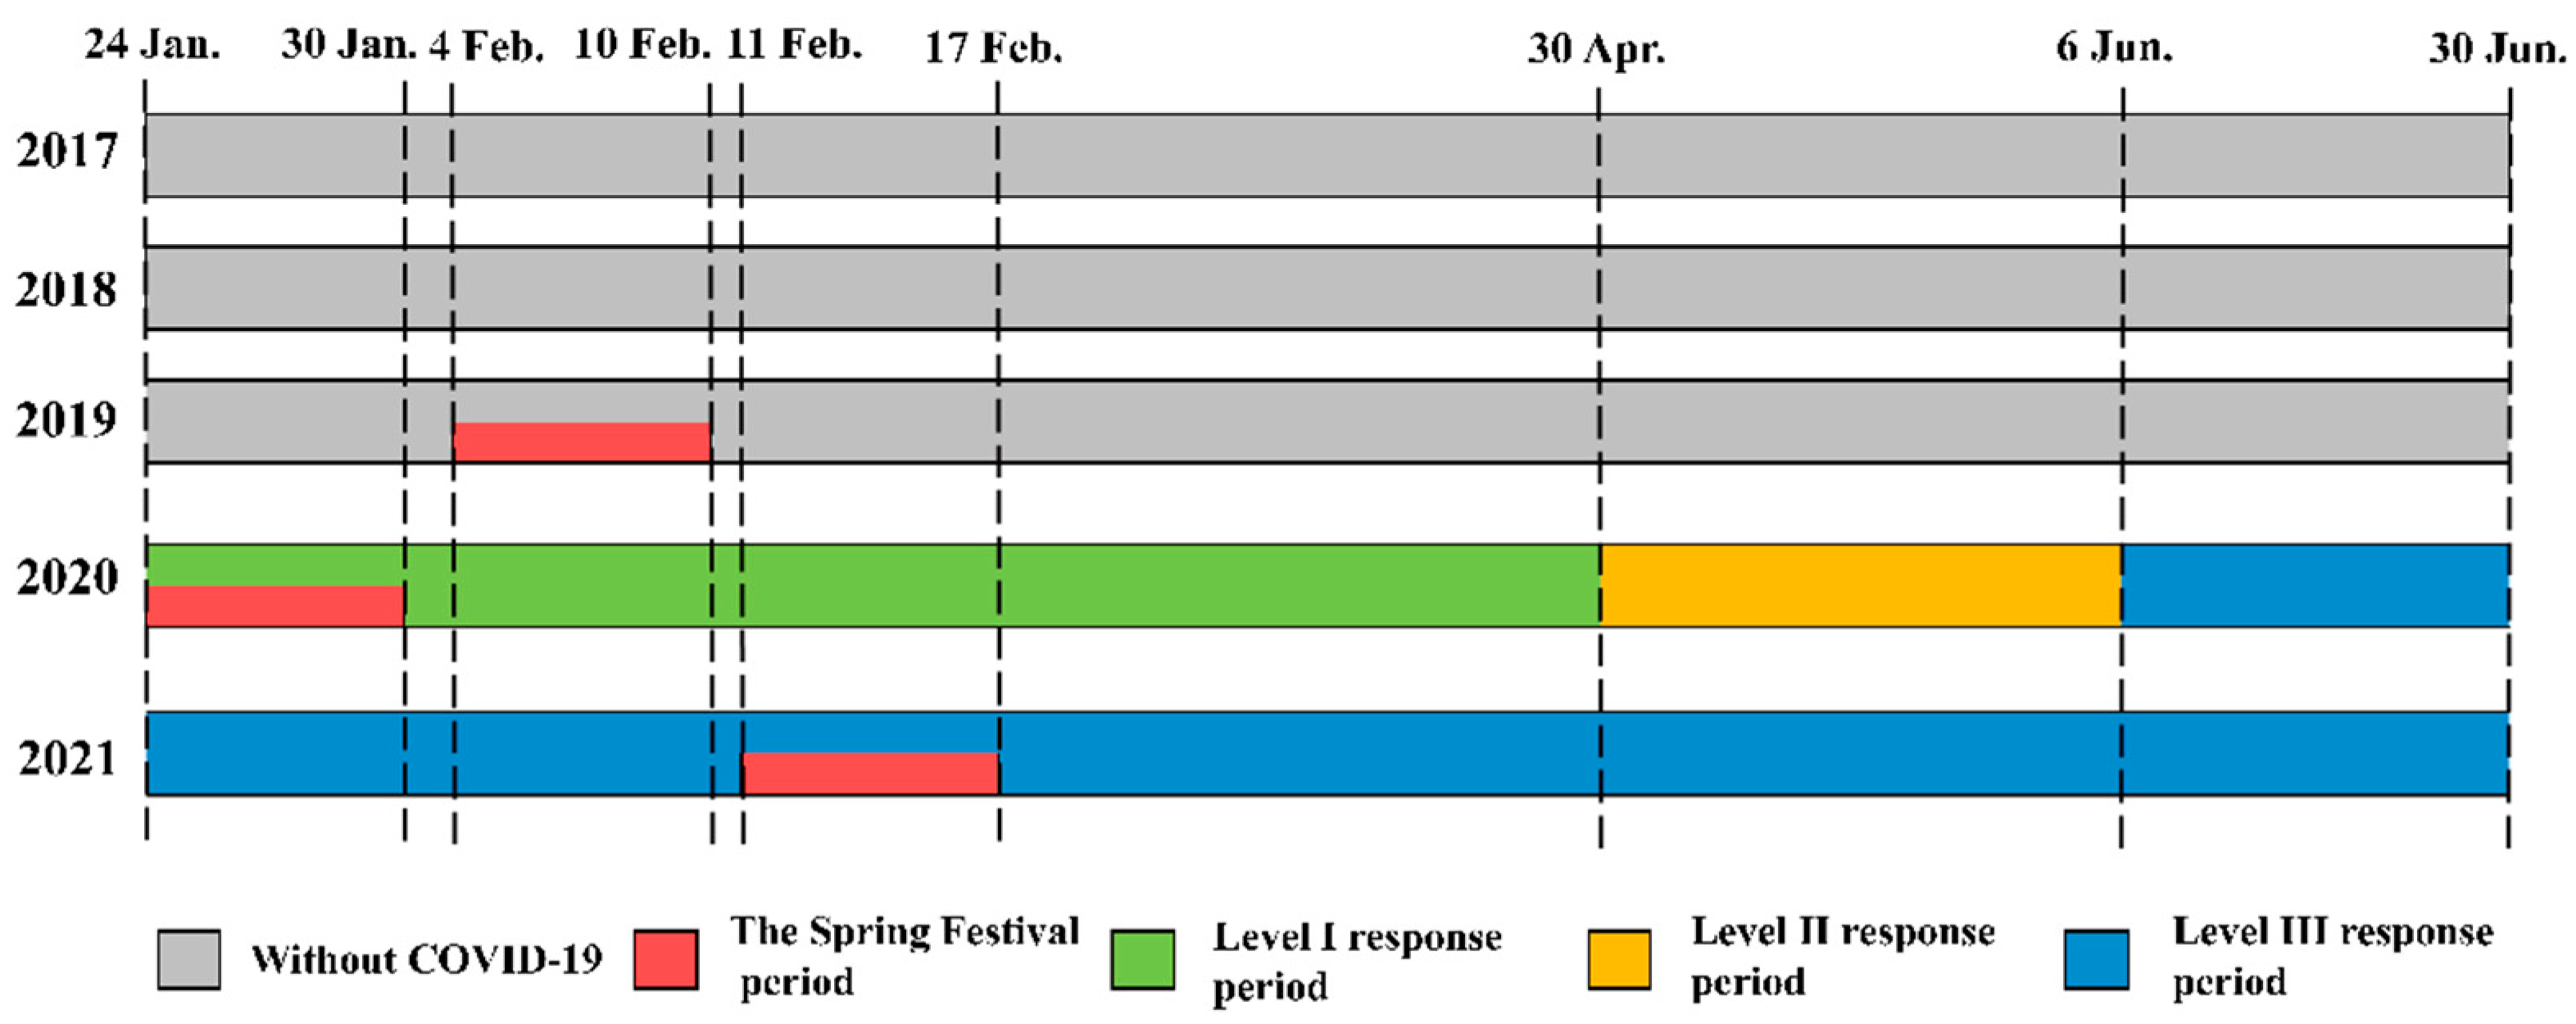
2.2. Time Periods
2.3. Data Sources
2.4. Difference-In-Differences (DID) Model
2.5. Multiple Linear Regression (MLR) Model
2.6. Backward Trajectory Cluster Analysis and PSCF Analysis
3. Results and Discussion
3.1. Analysis of Factors Influencing Air Quality during COVID-19
3.1.1. Interannual Differences in Air Quality
3.1.2. Analysis of Significant Difference Based on DID Model
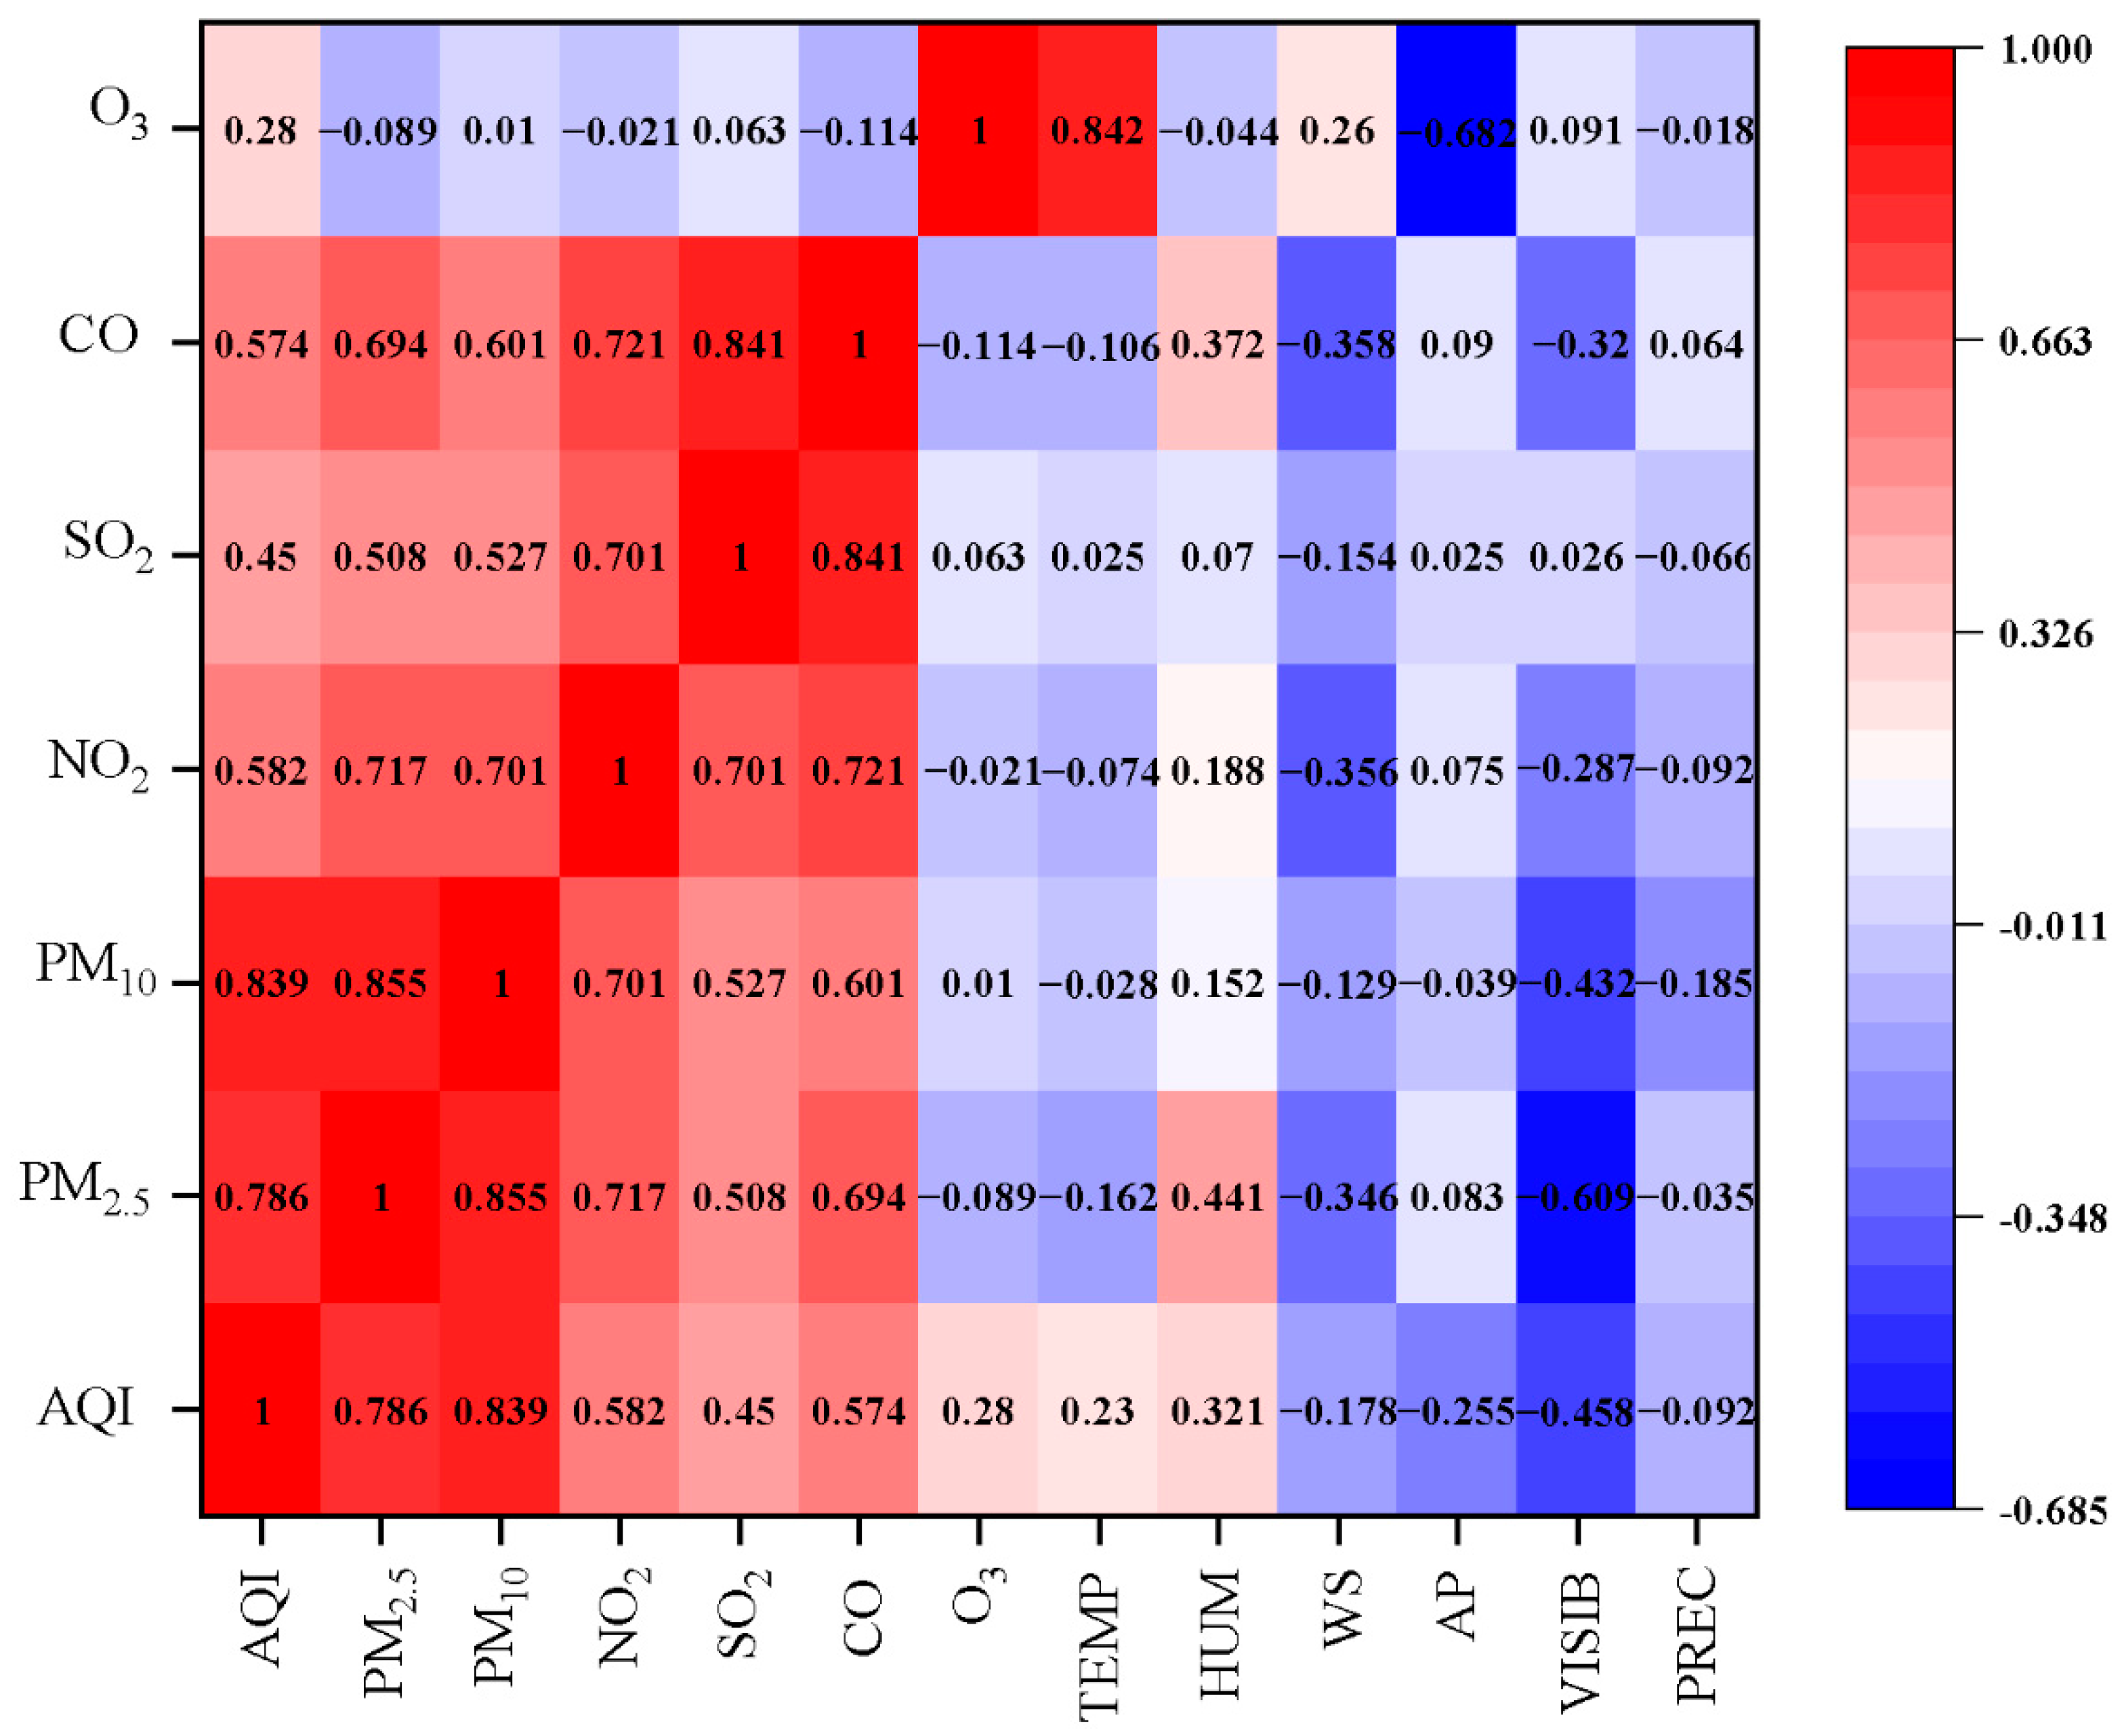
3.1.3. Impact of Meteorological Factors
3.1.4. Impact of COVID-19 Control Measures
3.2. Analysis of Factors Influencing Air Quality during the Level I Response
3.2.1. Interannual Differences in Air Quality
3.2.2. Analysis of Significant Difference Based on DID Model
3.2.3. Impact of COVID-19 Control Measures Based on MLR Model
3.3. Analysis of Factors Influencing Air Quality during the Spring Festival
3.3.1. Interannual Differences in Air Quality
3.3.2. Impact of Meteorological Conditions
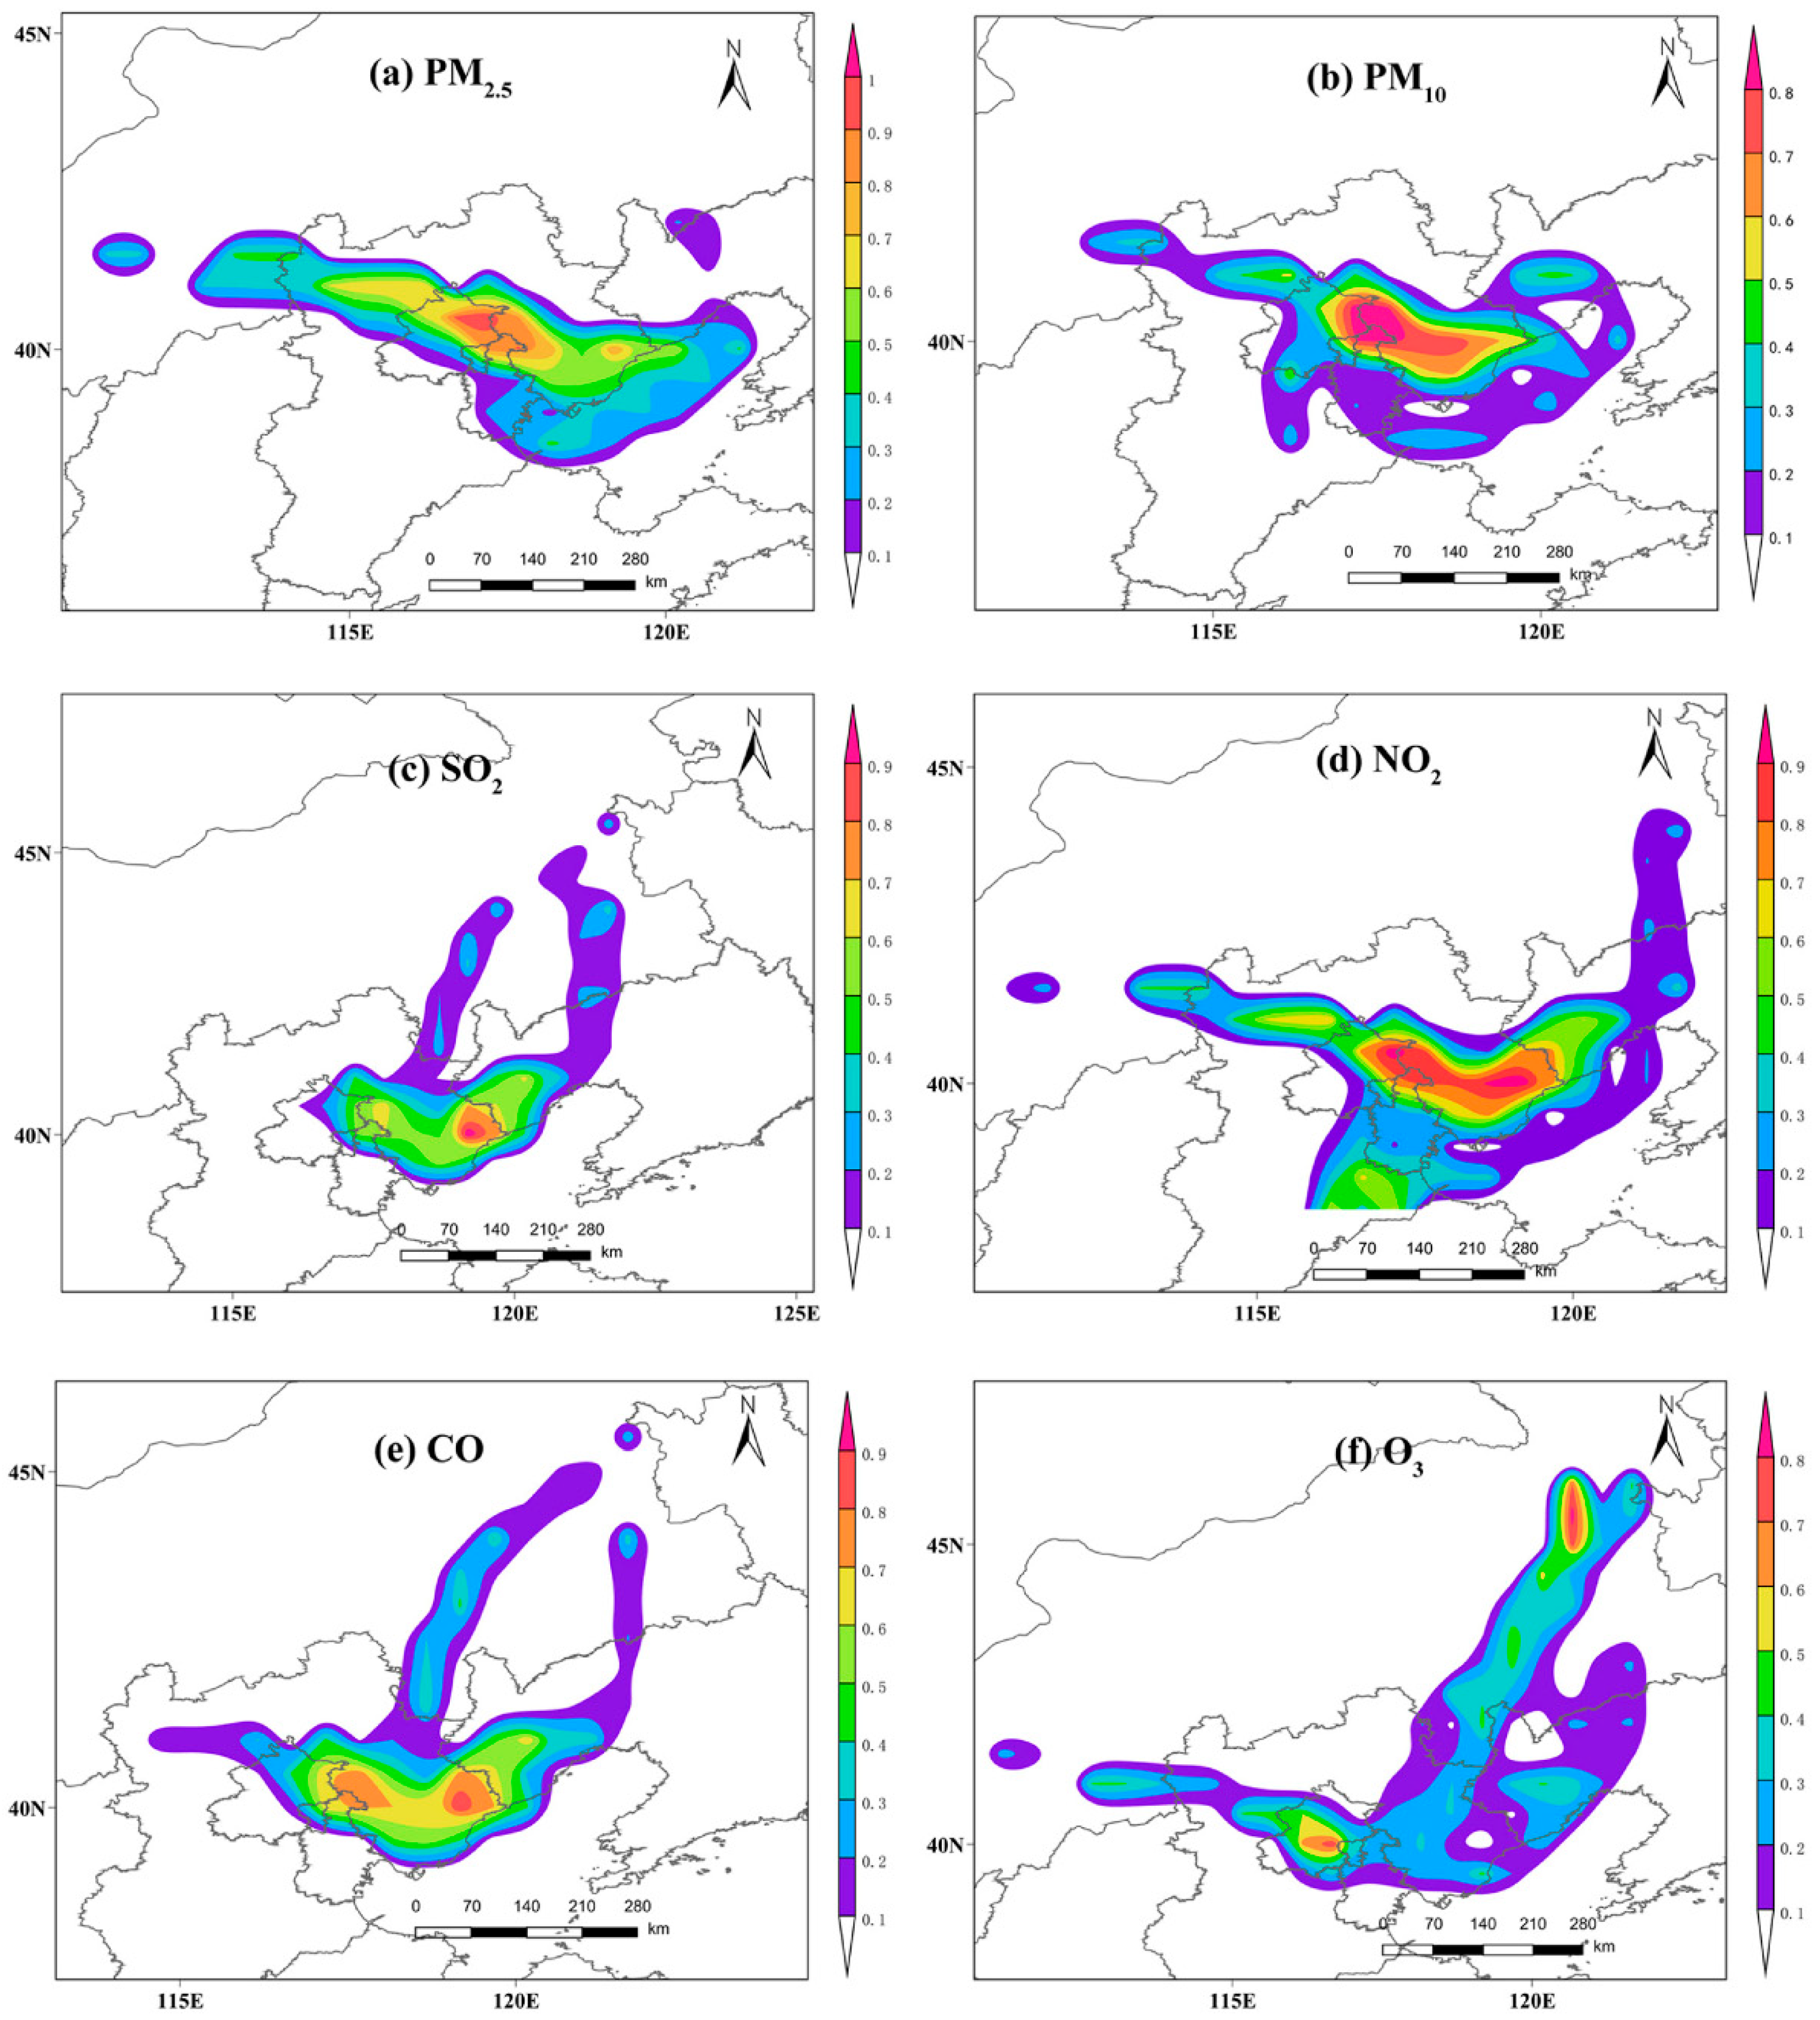
3.3.3. Impact of the Regional Transport
4. Conclusions
Supplementary Materials
Author Contributions
Funding
Institutional Review Board Statement
Informed Consent Statement
Data Availability Statement
Conflicts of Interest
References
- Wilder-Smith, A.; Freedman, D.O. Isolation, quarantine, social distancing and community containment: Pivotal role for old-style public health measures in the novel coronavirus (2019-nCoV) outbreak. J. Travel Med. 2020, 27. [Google Scholar] [CrossRef] [PubMed]
- Tian, H.Y.; Liu, Y.H.; Li, Y.D.; Wu, C.H.; Chen, B.; Kraemer, M.U.G.; Li, B.Y.; Cai, J.; Xu, B.; Yang, Q.Q.; et al. An investigation of transmission control measures during the first 50 days of the COVID-19 epidemic in China. Science 2020, 368, 638–642. [Google Scholar] [CrossRef] [PubMed]
- Chen, Q.X.; Huang, C.L.; Yuan, Y.; Tan, H.P. Influence of COVID-19 Event on Air Quality and their Association in Mainland China. Aerosol Air Qual. Res. 2020, 20, 1541–1551. [Google Scholar] [CrossRef]
- Li, M.M.; Wang, T.J.; Xie, M.; Li, S.; Zhuang, B.L.; Fu, Q.Y.; Zhao, M.; Wu, H.; Liu, J.; Saikawa, E.; et al. Drivers for the poor air quality conditions in North China Plain during the COVID-19 outbreak. Atmos. Environ. 2021, 246, 118103. [Google Scholar] [CrossRef] [PubMed]
- Huang, C.W.; Wang, T.J.; Niu, T.; Li, M.M.; Liu, H.L.; Ma, C.Q. Study on the variation of air pollutant concentration and its formation mechanism during the COVID-19 period in Wuhan. Atmos. Environ. 2021, 251, 118276. [Google Scholar] [CrossRef]
- Wang, S.Y.; Zhang, Y.L.; Ma, J.L.; Zhu, S.Q.; Shen, J.Y.; Wang, P.; Zhang, H.L. Responses of decline in air pollution and recovery associated with COVID-19 lockdown in the Pearl River Delta. Sci. Total Environ. 2021, 756, 143868. [Google Scholar] [CrossRef]
- Ai, W.W.; Yang, X.X.; Liu, D.Y.; Zhang, M.; Sun, Y.; Wang, B.N.; Luo, X.C. Impact of the Levels of COVID-19 Pandemic Prevention and Control Measures on Air Quality: A Case Study of Jiangsu Province, China. Atmosphere 2022, 13, 640. [Google Scholar] [CrossRef]
- Xing, J.; Li, S.W.; Jiang, Y.Q.; Wang, S.X.; Ding, D.; Dong, Z.X.; Zhu, Y.; Hao, J.M. Quantifying the emission changes and associated air quality impacts during the COVID-19 pandemic on the North China Plain: A response modeling study. Atmos. Chem. Phys. 2020, 20, 14347–14359. [Google Scholar] [CrossRef]
- Niu, Z.; Hu, T.T.; Kong, L.; Zhang, W.Q.; Rao, P.H.; Ge, D.F.; Zhou, M.G.; Duan, Y.S. Air-pollutant mass concentration changes during COVID-19 pandemic in Shanghai, China. Air Qual. Atmos. Health 2021, 14, 523–532. [Google Scholar] [CrossRef]
- He, G.J.; Pan, Y.H.; Tanaka, T. The short-term impacts of COVID-19 lockdown on urban air pollution in China. Nat. Sustain. 2020, 3, 1005–1011. [Google Scholar] [CrossRef]
- Li, J.; Yang, H.T.; Zha, S.P.; Yu, N.; Liu, X.G.; Sun, R.F. Effects of COVID-19 Emergency Response Levels on Air Quality in the Guangdong-Hong Kong-Macao Greater Bay Area, China. Aerosol Air Qual. Res. 2021, 21, 200416. [Google Scholar] [CrossRef]
- Turek, T.; Diakowska, E.; Kaminska, J.A. Has COVID-19 Lockdown Affected on Air Quality?-Different Time Scale Case Study in Wroclaw, Poland. Atmosphere 2021, 12, 1549. [Google Scholar] [CrossRef]
- Tan, E. The Long-Term Impact of COVID-19 Lockdowns in Istanbul. Int. J. Environ. Res. Public Health 2022, 19, 14235. [Google Scholar] [CrossRef] [PubMed]
- Adam, M.G.; Tran, P.T.M.; Balasubramanian, R. Air quality changes in cities during the COVID-19 lockdown: A critical review. Atmos. Res. 2021, 264, 105823. [Google Scholar] [CrossRef]
- Rana, R.H.; Keramat, S.A.; Gow, J. A Systematic Literature Review of the Impact of COVID-19 Lockdowns on Air Quality in China. Aerosol Air Qual. Res. 2021, 21, 200614. [Google Scholar] [CrossRef]
- An, Z.S.; Huang, R.J.; Zhang, R.Y.; Tie, X.X.; Li, G.H.; Cao, J.J.; Zhou, W.J.; Shi, Z.G.; Han, Y.M.; Gu, Z.L.; et al. Severe haze in northern China: A synergy of anthropogenic emissions and atmospheric processes. Proc. Natl. Acad. Sci. USA 2019, 116, 8657–8666. [Google Scholar] [CrossRef]
- Sun, J.J.; Huang, L.; Liao, H.; Li, J.Y.; Hu, J.L. Impacts of Regional Transport on Particulate Matter Pollution in China: A Review of Methods and Results. Curr. Pollut. Rep. 2017, 3, 182–191. [Google Scholar] [CrossRef]
- Liang, Y.X.; Gui, K.; Che, H.Z.; Li, L.; Zheng, Y.; Zhang, X.T.; Zhang, X.D.; Zhang, P.; Zhang, X.Y. Changes in aerosol loading before, during and after the COVID-19 pandemic outbreak in China: Effects of anthropogenic and natural aerosol. Sci. Total Environ. 2023, 857, 159435. [Google Scholar] [CrossRef]
- Sulaymon, I.D.; Zhang, Y.X.; Hopke, P.K.; Hu, J.L.; Zhang, Y.; Li, L.; Mei, X.D.; Gong, K.J.; Shi, Z.H.; Zhao, B.; et al. Persistent high PM2.5 pollution driven by unfavorable meteorological conditions during the COVID-19 lockdown period in the Beijing-Tianjin-Hebei region, China. Environ. Res. 2021, 198, 111186. [Google Scholar] [CrossRef]
- Zhao, L.J.; Wang, Y.; Zhang, H.H.; Qian, Y.; Yang, P.L.; Zhou, L.X. Diverse spillover effects of COVID-19 control measures on air quality improvement: Evidence from typical Chinese cities. Environ. Dev. Sustain. 2022. [Google Scholar] [CrossRef]
- Lv, L.L.; Wei, P.; Li, J.; Hu, J.N. Application of machine learning algorithms to improve numerical simulation prediction of PM2.5 and chemical components. Atmos. Pollut. Res. 2021, 12, 101211. [Google Scholar] [CrossRef]
- Liu, H.X.; Li, Q.; Yu, D.B.; Gu, Y. Air Quality Index and Air Pollutant Concentration Prediction Based on Machine Learning Algorithms. Appl. Sci. 2019, 9, 4069. [Google Scholar] [CrossRef]
- Gonzalez-Pardo, J.; Ceballos-Santos, S.; Manzanas, R.; Santibanez, M.; Fernandez-Olmo, I. Estimating changes in air pollutant levels due to COVID-19 lockdown measures based on a business-as-usual prediction scenario using data mining models: A case-study for urban traffic sites in Spain. Sci. Total Environ. 2022, 823, 153786. [Google Scholar] [CrossRef] [PubMed]
- Cabello-Torres, R.J.; Estela, M.A.P.; Sanchez-Ccoyllo, O.; Romero-Cabello, E.A.; Avila, F.F.G.; Castaneda-Olivera, C.A.; Valdiviezo-Gonzales, L.; Eulogio, C.E.Q.; De la Cruz, A.R.H.; Lopez-Gonzales, J.L. Statistical modeling approach for PM10 prediction before and during confinement by COVID-19 in South Lima, Peru. Sci. Rep. 2022, 12, 16737. [Google Scholar] [CrossRef] [PubMed]
- Guo, X.P.; Ren, D.F.; Li, C.B. Study on clean heating based on air pollution and energy consumption. Environ. Sci. Pollut. Res. 2020, 27, 6549–6559. [Google Scholar] [CrossRef] [PubMed]
- Aragao, D.P.; Oliveira, E.V.; Bezerra, A.A.; dos Santos, D.H.; da Silva, A.G.; Pereira, I.G.; Piscitelli, P.; Miani, A.; Distante, C.; Cuno, J.S.; et al. Multivariate data driven prediction of COVID-19 dynamics: Towards new results with temperature, humidity and air quality data. Environ. Res. 2022, 204, 112348. [Google Scholar] [CrossRef]
- Liu, X.; Li, Y.C.; Chen, X.H.; Liu, J. Evaluation of low carbon city pilot policy effect on carbon abatement in China: An empirical evidence based on time-varying DID model. Cities 2022, 123, 103582. [Google Scholar] [CrossRef]
- Li, R.; Cui, L.L.; Li, J.L.; Zhao, A.; Fu, H.B.; Wu, Y.; Zhang, L.W.; Kong, L.D.; Chen, J.M. Spatial and temporal variation of particulate matter and gaseous pollutants in China during 2014–2016. Atmos. Environ. 2017, 161, 235–246. [Google Scholar] [CrossRef]
- Wu, H.S.; Hu, M.G.; Zhang, Y.P.; Han, Y. An Empirical Mode Decomposition for Establishing Spatiotemporal Air Quality Trends in Shandong Province, China. Sustainability 2021, 13, 12901. [Google Scholar] [CrossRef]
- Song, Y.; Li, Z.R.; Liu, J.; Yang, T.T.; Zhang, M.; Pang, J.R. The effect of environmental regulation on air quality in China: A natural experiment during the COVID-19 pandemic. Atmos. Pollut. Res. 2021, 12, 21–30. [Google Scholar] [CrossRef]
- Schneider, A.; Hommel, G.; Blettner, M. Linear Regression Analysis Part 14 of a Series on Evaluation of Scientific Publications. Dtsch. Arztebl. Int. 2010, 107, 776–782. [Google Scholar] [CrossRef] [PubMed]
- Krzywinski, M.; Altman, N. Multiple linear regression. Nat. Methods 2015, 12, 1103–1104. [Google Scholar] [CrossRef] [PubMed]
- Wang, Y.Q. MeteoInfo: GIS software for meteorological data visualization and analysis. Meteorol. Appl. 2014, 21, 360–368. [Google Scholar] [CrossRef]
- Wang, Y.Q.; Zhang, X.Y.; Draxler, R.R. TrajStat: GIS-based software that uses various trajectory statistical analysis methods to identify potential sources from long-term air pollution measurement data. Environ. Modell. Softw. 2009, 24, 938–939. [Google Scholar] [CrossRef]
- Polissar, A.V.; Hopke, P.K.; Harris, J.M. Source regions for atmospheric aerosol measured at Barrow, Alaska. Environ. Sci. Technol. 2001, 35, 4214–4226. [Google Scholar] [CrossRef]
- Polissar, A.V.; Hopke, P.K.; Paatero, P. Atmospheric aerosol over Alaska-2. Elemental composition and sources. J. Geophys. Res.-Atmos. 1998, 103, 19045–19057. [Google Scholar] [CrossRef]
- Zhu, S.Q.; Poetzscher, J.; Shen, J.Y.; Wang, S.Y.; Wang, P.; Zhang, H.L. Comprehensive Insights Into O3 Changes During he COVID-19 From O3 Formation Regime and Atmospheric Oxidation Capacity. Geophys. Res. Lett. 2021, 48, e2021GL093668. [Google Scholar] [CrossRef]
- Liu, Z.; Chen, X.L.; Cai, J.Y.; Balezentis, T.; Li, Y. The Impact of “Coal to Gas” Policy on Air Quality: Evidence from Beijing, China. Energies 2020, 13, 3876. [Google Scholar] [CrossRef]
- Li, K.; Jacob, D.J.; Liao, H.; Zhu, J.; Shah, V.; Shen, L.; Bates, K.H.; Zhang, Q.; Zhai, S.X. A two-pollutant strategy for improving ozone and particulate air quality in China. Nat. Geosci. 2019, 12, 906–910. [Google Scholar] [CrossRef]
- Roy, S.; Saha, M.; Dhar, B.; Santa, P.; Nasrin, R. Geospatial analysis of COVID-19 lockdown effects on air quality in the South and Southeast Asian region. Sci. Total Environ. 2021, 756, 144009. [Google Scholar] [CrossRef]
- Shen, F.Z.; Ge, X.L.; Hu, J.L.; Nie, D.Y.; Tian, L.; Chen, M.D. Air pollution characteristics and health risks in Henan Province, China. Environ. Res. 2017, 156, 625–634. [Google Scholar] [CrossRef] [PubMed]
- Dantas, G.; Siciliano, B.; Franca, B.B.; da Silva, C.M.; Arbilla, G. The impact of COVID-19 partial lockdown on the air quality of the city of Rio de Janeiro, Brazil. Sci. Total Environ. 2020, 729, 139085. [Google Scholar] [CrossRef] [PubMed]
- Chen, Z.Y.; Xie, X.M.; Cai, J.; Chen, D.L.; Gao, B.B.; He, B.; Cheng, N.L.; Xu, B. Understanding meteorological influences on PM2.5 concentrations across China: A temporal and spatial perspective. Atmos. Chem. Phys. 2018, 18, 5343–5358. [Google Scholar] [CrossRef]
- Hu, X.; Liu, Q.Z.; Fu, Q.Y.; Xu, H.; Shen, Y.; Liu, D.G.; Wang, Y.; Jia, H.H.; Cheng, J.P. A high-resolution typical pollution source emission inventory and pollution source changes during the COVID-19 lockdown in a megacity, China. Environ. Sci. Pollut. Res. 2021, 28, 45344–45352. [Google Scholar] [CrossRef] [PubMed]
- Rocha, C.A.; Marques, E.V.; dos Santos, R.P.; de Santiago, I.S.; Cavalcante, C.L.A.; Cassiano, D.R.; Ribeiro, J.P.; Bertoncini, B.V.; Nobre, J.S.; Freitas, J.V.B.; et al. A better understanding of air quality resulting from the effects of the 2020 pandemic in a city in the equatorial region (Fortaleza, Brazil). Environ. Sci. Pollut. Res. 2022, 29, 20921–20938. [Google Scholar] [CrossRef] [PubMed]
- Wang, Q.; Su, M. A preliminary assessment of the impact of COVID-19 on environment? A case study of China. Sci. Total Environ. 2020, 728, 138915. [Google Scholar] [CrossRef]
- Huang, X.; Ding, A.J.; Gao, J.; Zheng, B.; Zhou, D.R.; Qi, X.M.; Tang, R.; Wang, J.P.; Ren, C.H.; Nie, W.; et al. Enhanced secondary pollution offset reduction of primary emissions during COVID-19 lockdown in China. Natl. Sci. Rev. 2021, 8, nwaa137. [Google Scholar] [CrossRef]
- Othman, M.; Latif, M.T. Air pollution impacts from COVID-19 pandemic control strategies in Malaysia. J. Clean. Prod. 2021, 291, 125992. [Google Scholar] [CrossRef]
- Hu, J.L.; Wu, L.; Zheng, B.; Zhang, Q.; He, K.B.; Chang, Q.; Li, X.H.; Yang, F.M.; Ying, Q.; Zhang, H.L. Source contributions and regional transport of primary particulate matter in China. Environ. Pollut. 2015, 207, 31–42. [Google Scholar] [CrossRef]
- Zhao, N.; Wang, G.; Li, G.H.; Lang, J.L.; Zhang, H.Y. Air pollution episodes during the COVID-19 outbreak in the Beijing-Tianjin-Hebei region of China: An insight into the transport pathways and source distribution. Environ. Pollut. 2020, 267, 115617. [Google Scholar] [CrossRef]
- Zhang, X.; Zhang, Z.Z.; Xiao, Z.S.; Tang, G.G.; Li, H.; Gao, R.; Dao, X.; Wang, Y.Y.; Wang, W.X. Heavy haze pollution during the COVID-19 lockdown in the Beijing-Tianjin-Hebei region, China. J. Environ. Sci. 2022, 114, 170–178. [Google Scholar] [CrossRef] [PubMed]
- Nichol, J.E.; Bilal, M.; Ali, M.A.; Qiu, Z.F. Air Pollution Scenario over China during COVID-19. Remote Sens. 2020, 12, 2100. [Google Scholar] [CrossRef]
- Li, J.; Zhang, K.; Zhang, X.; Lv, W.L.; Gou, Y.Y.; Zhi, M.K.; Li, J.J. Analysis on the Influence and Cause of a Heavy Pollution Process on Air Quality in Baoding during COVID-19. Pol. J. Environ. Stud. 2022, 31, 735–747. [Google Scholar] [CrossRef]
- Liu, S.; Yang, X.C.; Duan, F.Z.; Zhao, W.J. Changes in Air Quality and Drivers for the Heavy PM2.5 Pollution on the North China Plain Pre- to Post-COVID-19. Int. J. Environ. Res. Public Health 2022, 19, 12904. [Google Scholar] [CrossRef] [PubMed]
- Wang, Y.S.; Yao, L.; Wang, L.L.; Liu, Z.R.; Ji, D.S.; Tang, G.Q.; Zhang, J.K.; Sun, Y.; Hu, B.; Xin, J.Y. Mechanism for the formation of the January 2013 heavy haze pollution episode over central and eastern China. Sci. China-Earth Sci. 2014, 57, 14–25. [Google Scholar] [CrossRef]
- Bei, N.F.; Li, X.P.; Tie, X.X.; Zhao, L.N.; Wu, J.R.; Li, X.; Liu, L.; Shen, Z.X.; Li, G.H. Impact of synoptic patterns and meteorological elements on the wintertime haze in the Beijing-Tianjin-Hebei region, China from 2013 to 2017. Sci. Total Environ. 2020, 704, 135210. [Google Scholar] [CrossRef]
- Lou, C.R.; Liu, H.Y.; Li, Y.F.; Peng, Y.; Wang, J.; Dai, L.J. Relationships of relative humidity with PM2.5 and PM10 in the Yangtze River Delta, China. Environ. Monit. Assess. 2017, 189, 582. [Google Scholar] [CrossRef]
- Ji, F.; Evans, J.P.; Di Luca, A.; Jiang, N.B.; Olson, R.; Fita, L.; Argueso, D.; Chang, L.T.C.; Scorgie, Y.; Riley, M. Projected change in characteristics of near surface temperature inversions for southeast Australia. Clim. Dyn. 2019, 52, 1487–1503. [Google Scholar] [CrossRef]
- Lyu, R.; Gao, W.; Peng, Y.R.; Qian, Y.J.; He, Q.S.; Cheng, T.T.; Yu, X.N.; Zhao, G. Fog-Haze Transition and Drivers in the Coastal Region of the Yangtze River Delta. Int. J. Environ. Res. Public Health 2022, 19, 9608. [Google Scholar] [CrossRef]
- Meo, S.A.; Almutairi, F.J.; Abukhalaf, A.A.; Alessa, O.M.; Al-Khlaiwi, T.; Meo, A.S. Sandstorm and its effect on particulate matter PM2.5, carbon monoxide, nitrogen dioxide, ozone pollutants and SARS-CoV-2 cases and deaths. Sci. Total Environ. 2021, 795, 148764. [Google Scholar] [CrossRef]
- Aneja, V.P.; Agarwal, A.; Roelle, P.A.; Phillips, S.B.; Tong, Q.S.; Watkins, N.; Yablonsky, R. Measurements and analysis of criteria pollutants in New Delhi, India. Environ. Int. 2001, 27, 35–42. [Google Scholar] [CrossRef] [PubMed]
- Liu, S.; Zhao, W.H.; Li, L.J.; Jin, J.N.; Li, T.Z.; Xu, H.T.; Zhao, W.J. Meteorological mechanisms of regional PM2.5 and O3 transport in the North China Plain driven by the East Asian monsoon. Atmos. Pollut. Res. 2023, 14, 101638. [Google Scholar] [CrossRef]


| Economic Indicator | Unit | 2019 | 2020 | 2021 | |||
|---|---|---|---|---|---|---|---|
| 1st | 2nd | 1st | 2nd | 1st | 2nd | ||
| GDP of the Secondary Industry | Billion Yuan | 82.21 | 188.79 | 73.69 | 171.49 | 91.91 | 208.74 |
| Total Profit of Manufacturing | Billion Yuan | 3.79 | 16.46 | 1.57 | 8.35 | / | / |
| Product Output | |||||||
| Steel | Million Tons | 34.12 | 40.41 | 34.74 | 44.46 | 38.74 | 37.53 |
| Coal | Million Tons | 5.98 | 5.73 | 5.60 | 5.47 | 5.07 | 4.80 |
| Cement | Million Tons | 3.92 | 9.05 | 3.42 | 10.88 | 5.64 | 10.90 |
| Power Generation | Billion kWh | 16.6 | 15.6 | 16.8 | 16.9 | 19.7 | 16.4 |
| Electricity Consumption | |||||||
| Industry | Billion kWh | 16.72 | 18.08 | 15.18 | 18.18 | 17.26 | 18.29 |
| Construction | Billion kWh | 0.19 | 0.13 | 0.16 | 0.14 | 0.23 | 0.17 |
| Urban and Rural Life | Billion kWh | 1.36 | 1.08 | 1.52 | 1.14 | 1.75 | 1.21 |
| Operating Income of Transportation, Warehousing and Postal Industry | Billion Yuan | 8.52 | 13.22 | 7.77 | 15.18 | 8.51 | 14.15 |
| Study | Region | Phenomenon | Reason |
|---|---|---|---|
| [19] | Beijing–Tianjin–Hebei (BTH) | Persistent high PM2.5 pollution. | Unfavorable meteorological conditions. |
| [50] | BTH | Two large-scale air pollution events led to higher concentrations of PM2.5, SO2, NO2, and CO. | Regional transport and unfavorable meteorological conditions. |
| [51] | Beijing, Tianjin, and Baoding | Heavy haze pollution. | Inter-transport of PM2.5 in the BTH region and unfavorable meteorological conditions. |
| [52] | BTH | Higher aerosol and PM2.5 levels in February and March 2020. | Enhanced atmospheric oxidation capacity. |
| [47] | Eastern China | The concentration of PM2.5 increased during the COVID-19 lockdown. | Enhanced secondary pollution offset reduction in primary emissions. |
| [53] | Baoding | A heavy pollution event. | Regional transport and unfavorable meteorological conditions. |
| [54] | Beijing | Heavy PM2.5 pollution. | The initial regional transport and later secondary formation under adverse meteorology. |
| [54] | Henan | Heavy PM2.5 pollution. | The primary emissions and small-scale regional transport. |
Disclaimer/Publisher’s Note: The statements, opinions and data contained in all publications are solely those of the individual author(s) and contributor(s) and not of MDPI and/or the editor(s). MDPI and/or the editor(s) disclaim responsibility for any injury to people or property resulting from any ideas, methods, instructions or products referred to in the content. |
© 2023 by the authors. Licensee MDPI, Basel, Switzerland. This article is an open access article distributed under the terms and conditions of the Creative Commons Attribution (CC BY) license (https://creativecommons.org/licenses/by/4.0/).
Share and Cite
Wu, W.-L.; Shan, C.-Y.; Liu, J.; Zhao, J.-L.; Long, J.-Y. Analysis of Factors Influencing Air Quality in Different Periods during COVID-19: A Case Study of Tangshan, China. Int. J. Environ. Res. Public Health 2023, 20, 4199. https://doi.org/10.3390/ijerph20054199
Wu W-L, Shan C-Y, Liu J, Zhao J-L, Long J-Y. Analysis of Factors Influencing Air Quality in Different Periods during COVID-19: A Case Study of Tangshan, China. International Journal of Environmental Research and Public Health. 2023; 20(5):4199. https://doi.org/10.3390/ijerph20054199
Chicago/Turabian StyleWu, Wen-Lu, Chun-Yan Shan, Jing Liu, Jing-Lin Zhao, and Jin-Yun Long. 2023. "Analysis of Factors Influencing Air Quality in Different Periods during COVID-19: A Case Study of Tangshan, China" International Journal of Environmental Research and Public Health 20, no. 5: 4199. https://doi.org/10.3390/ijerph20054199
APA StyleWu, W.-L., Shan, C.-Y., Liu, J., Zhao, J.-L., & Long, J.-Y. (2023). Analysis of Factors Influencing Air Quality in Different Periods during COVID-19: A Case Study of Tangshan, China. International Journal of Environmental Research and Public Health, 20(5), 4199. https://doi.org/10.3390/ijerph20054199