
Relationship between Urban Environmental Components and Dengue Prevalence in Dhaka City—An Approach of Spatial Analysis of Satellite Remote Sensing, Hydro-Climatic, and Census Dengue Data

 , , , and
Abstract
1. Introduction
2. Study Area, Materials and Methods
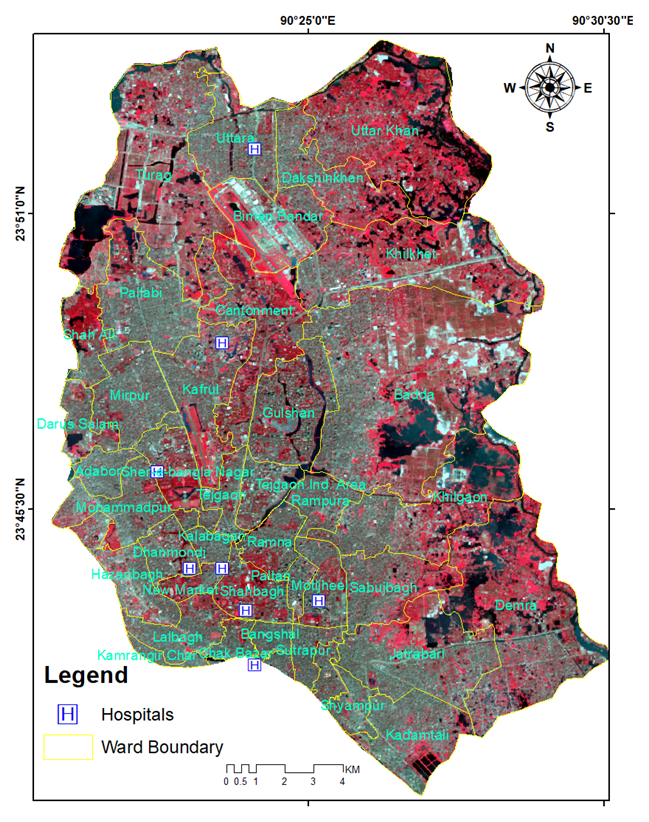
2.1. Location
2.2. Materials
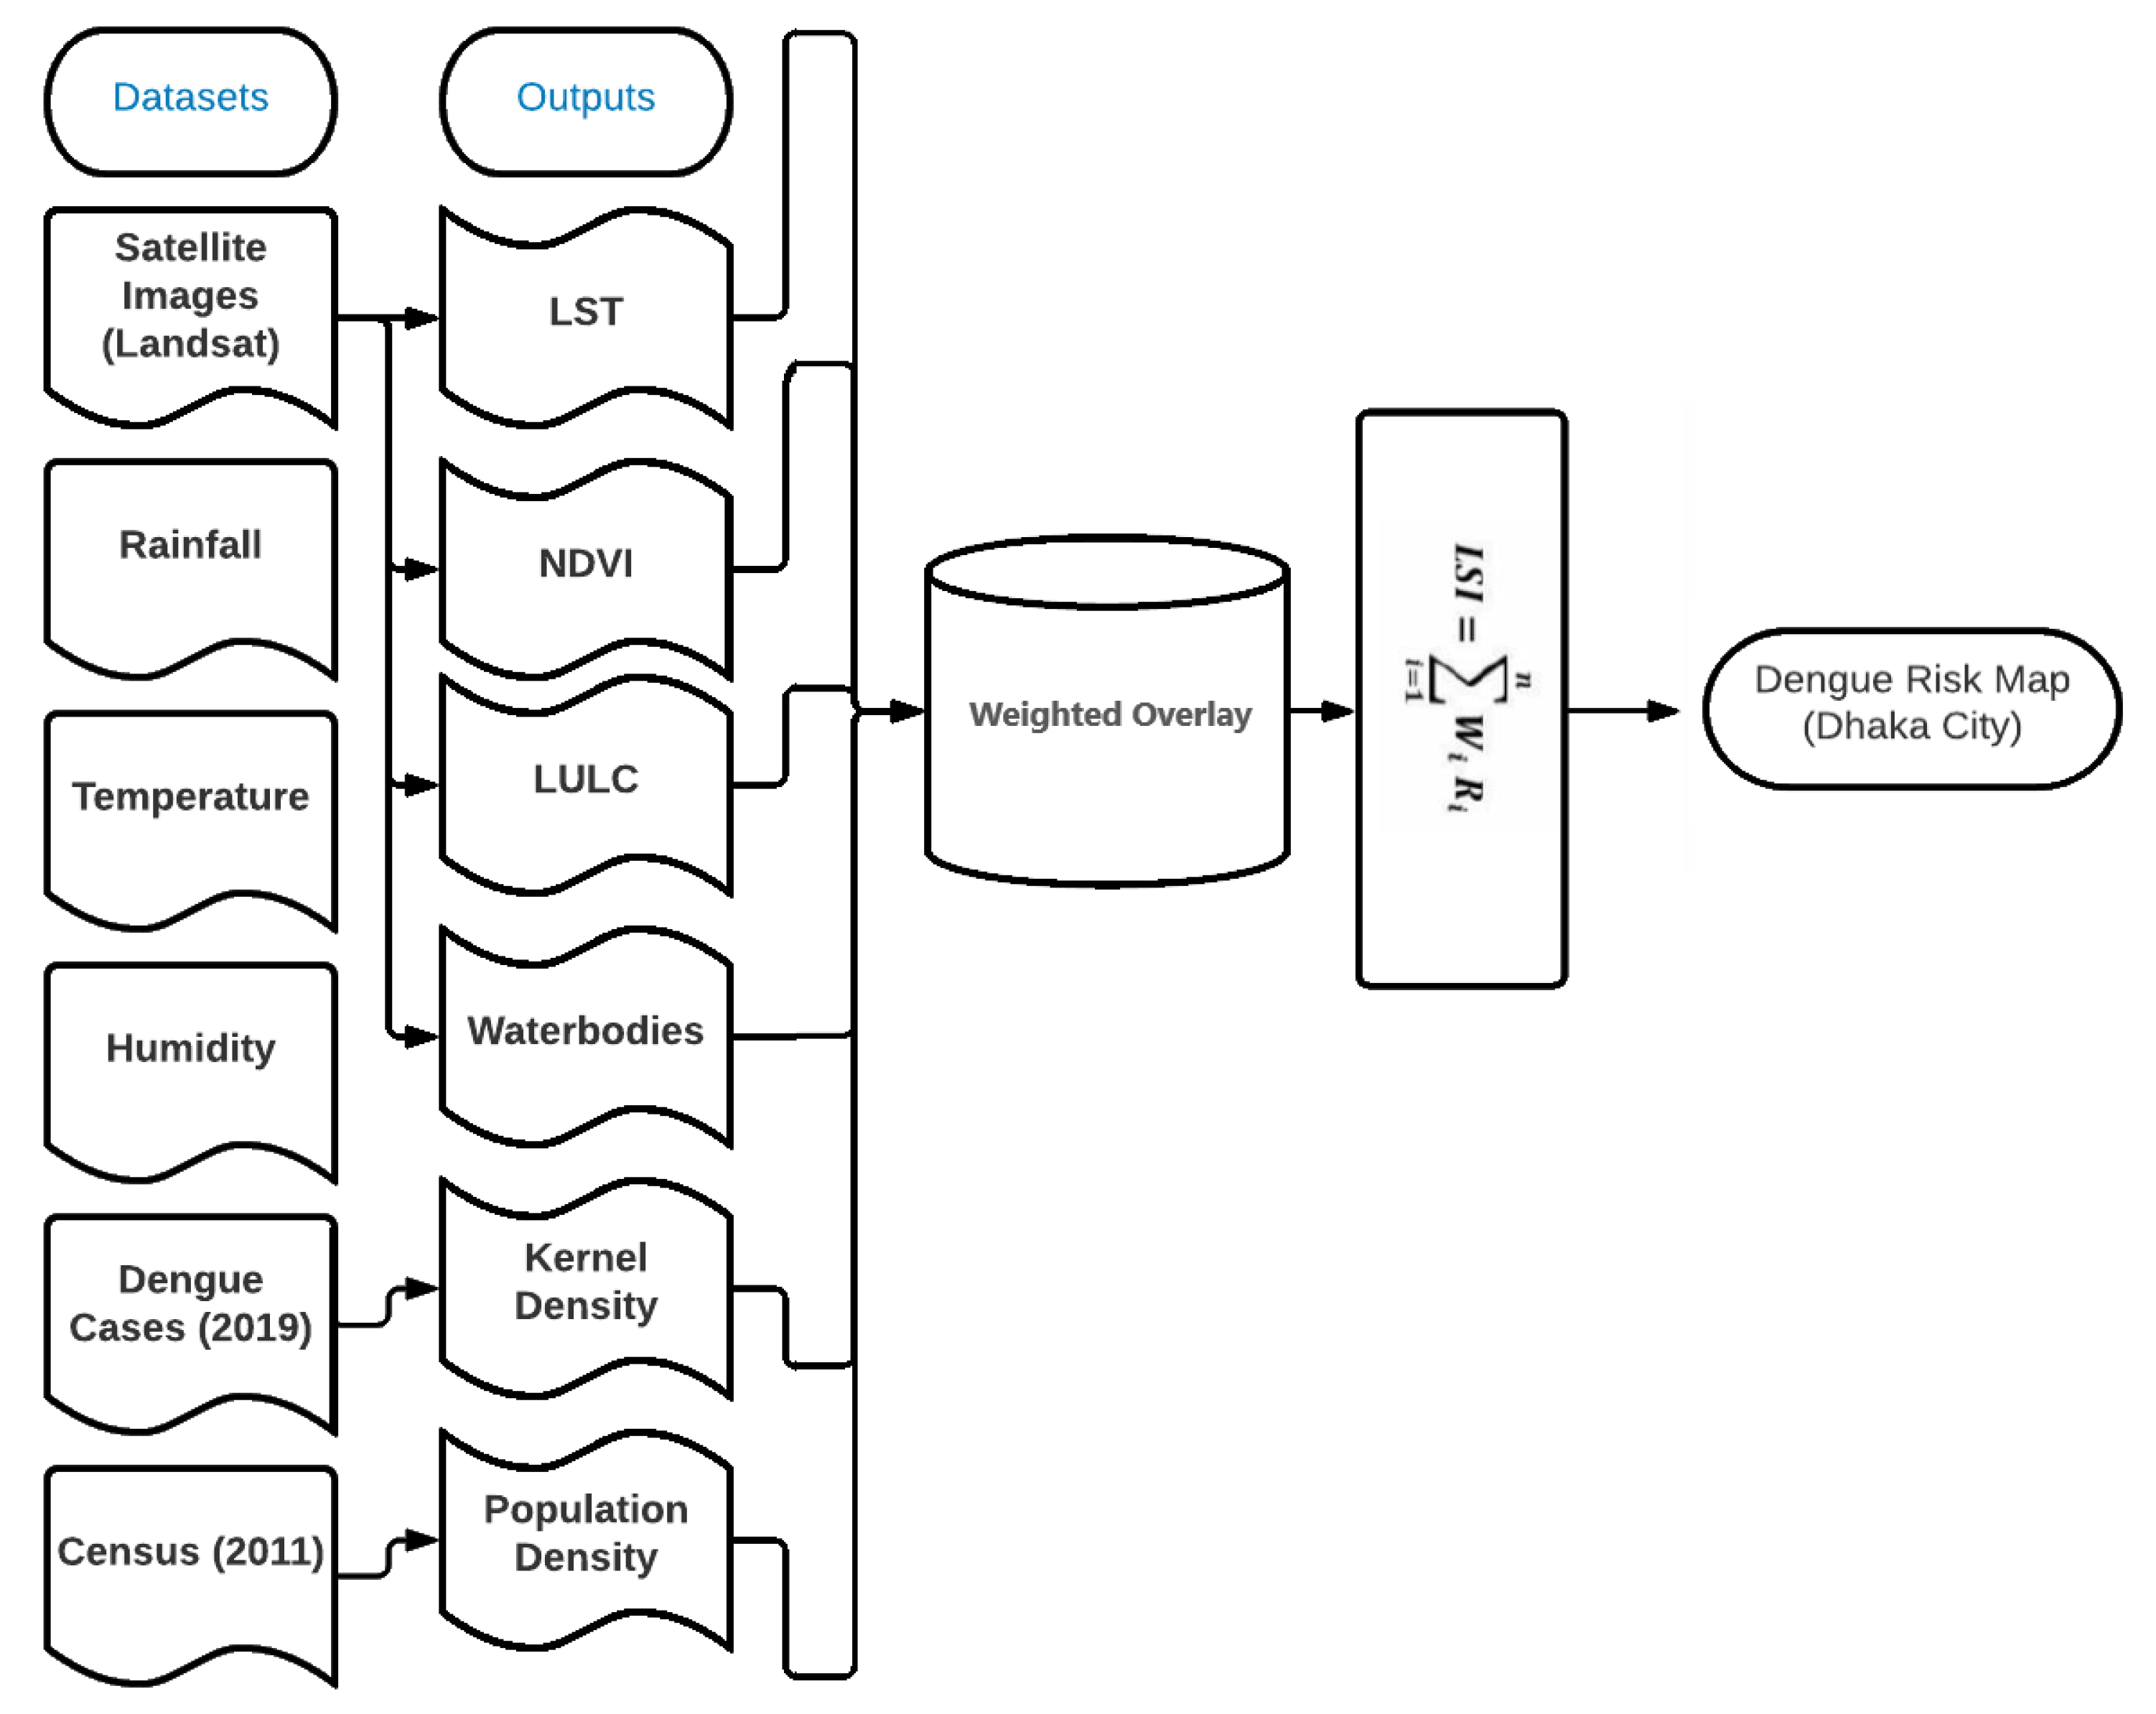
2.3. Methodology
2.3.1. Image Preprocessing
2.3.2. NDVI Calculation
2.3.3. Retrieve LST
3. Results
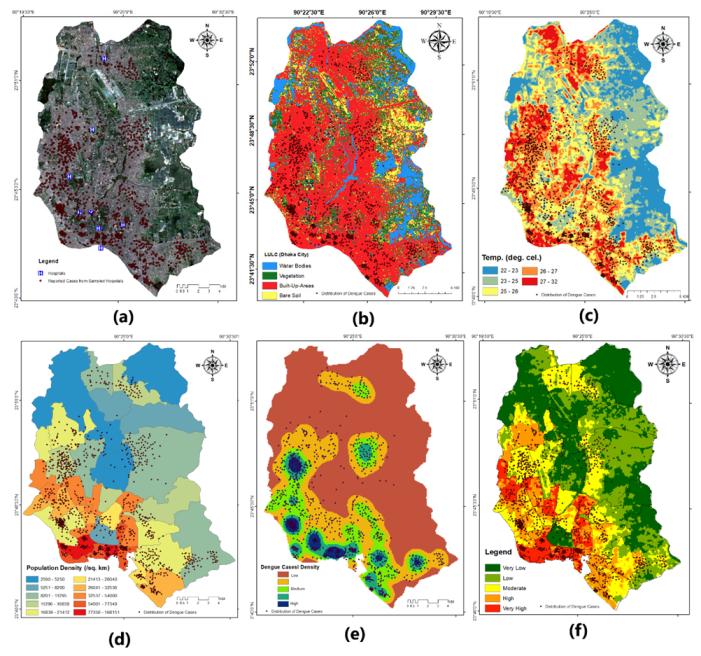
3.1. Dengue Incidence by LULC
3.2. Influence of UHI in Dengue Distribution
3.3. Dengue Incidence by Population Density
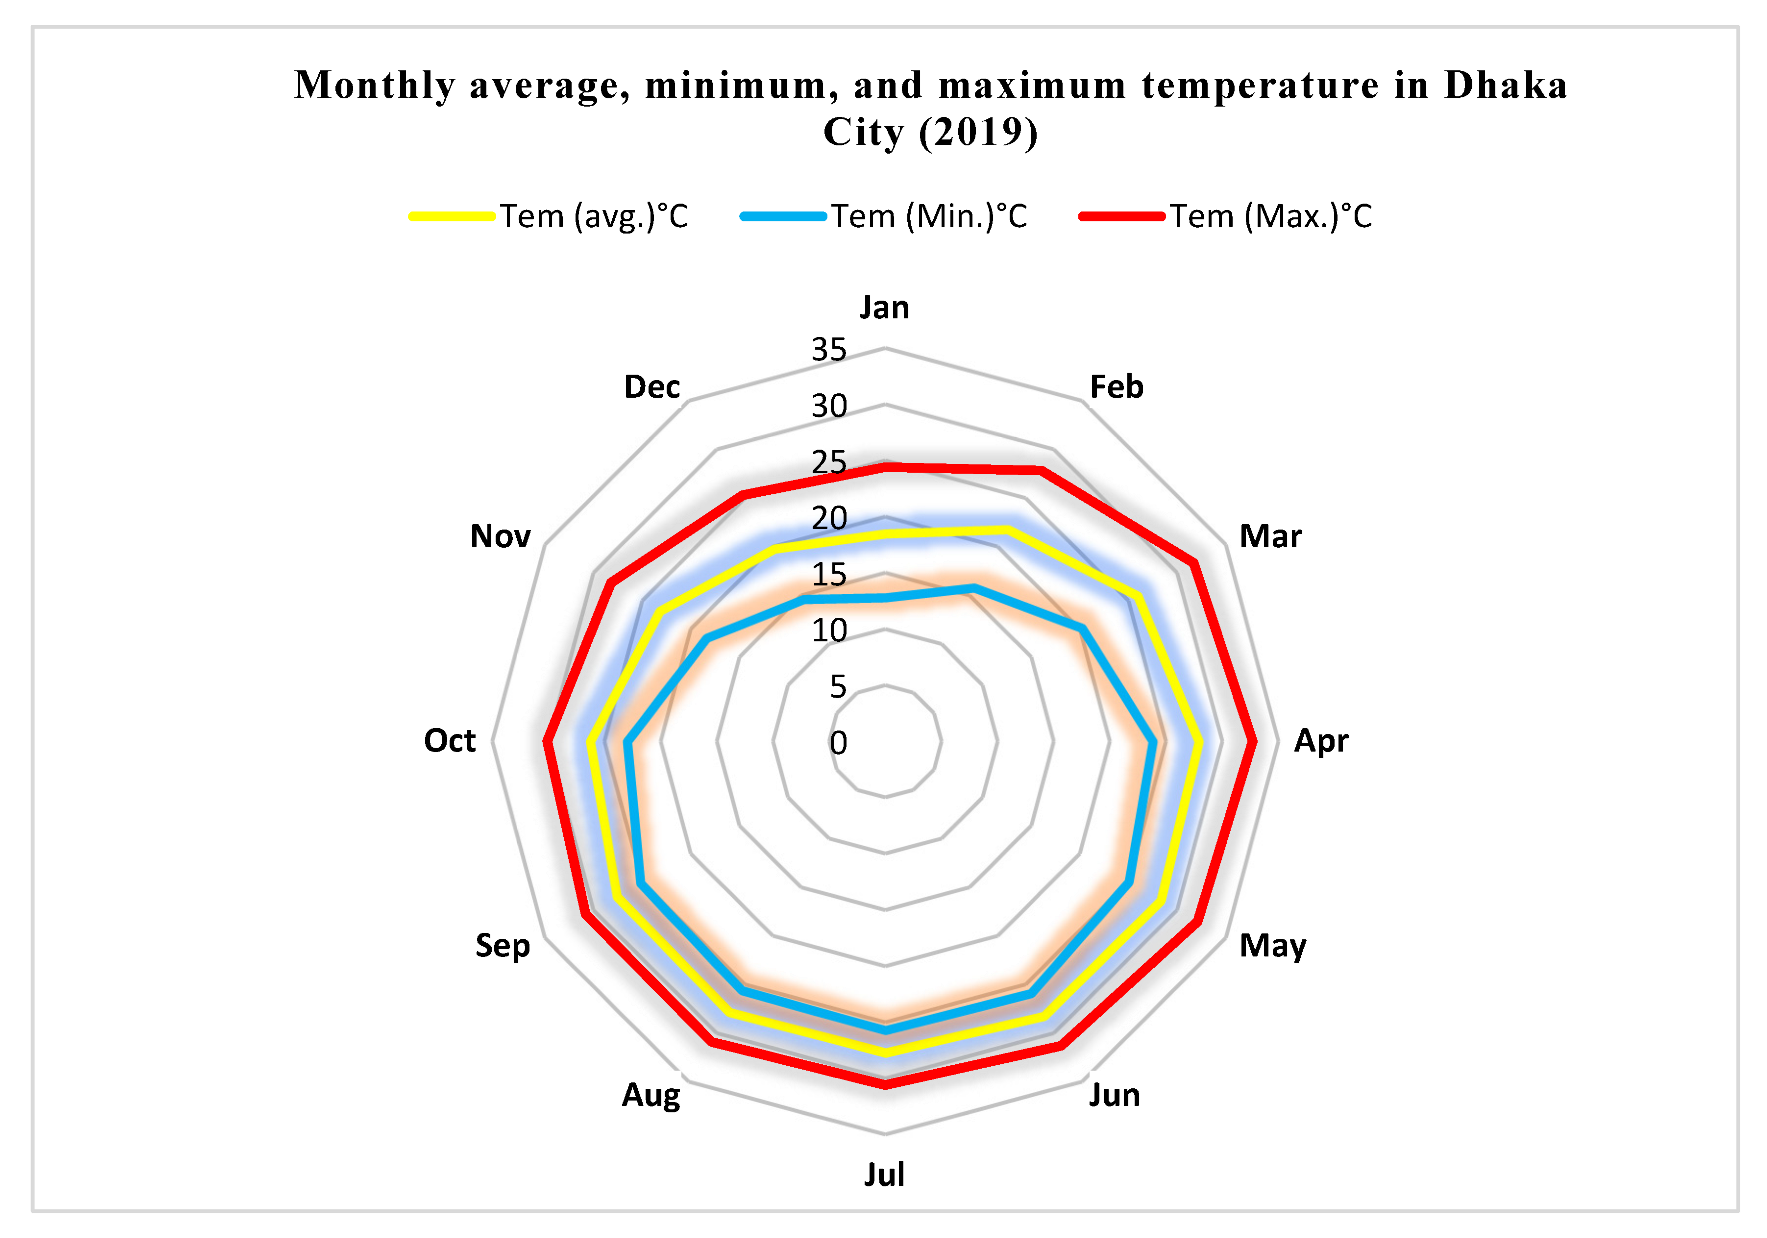
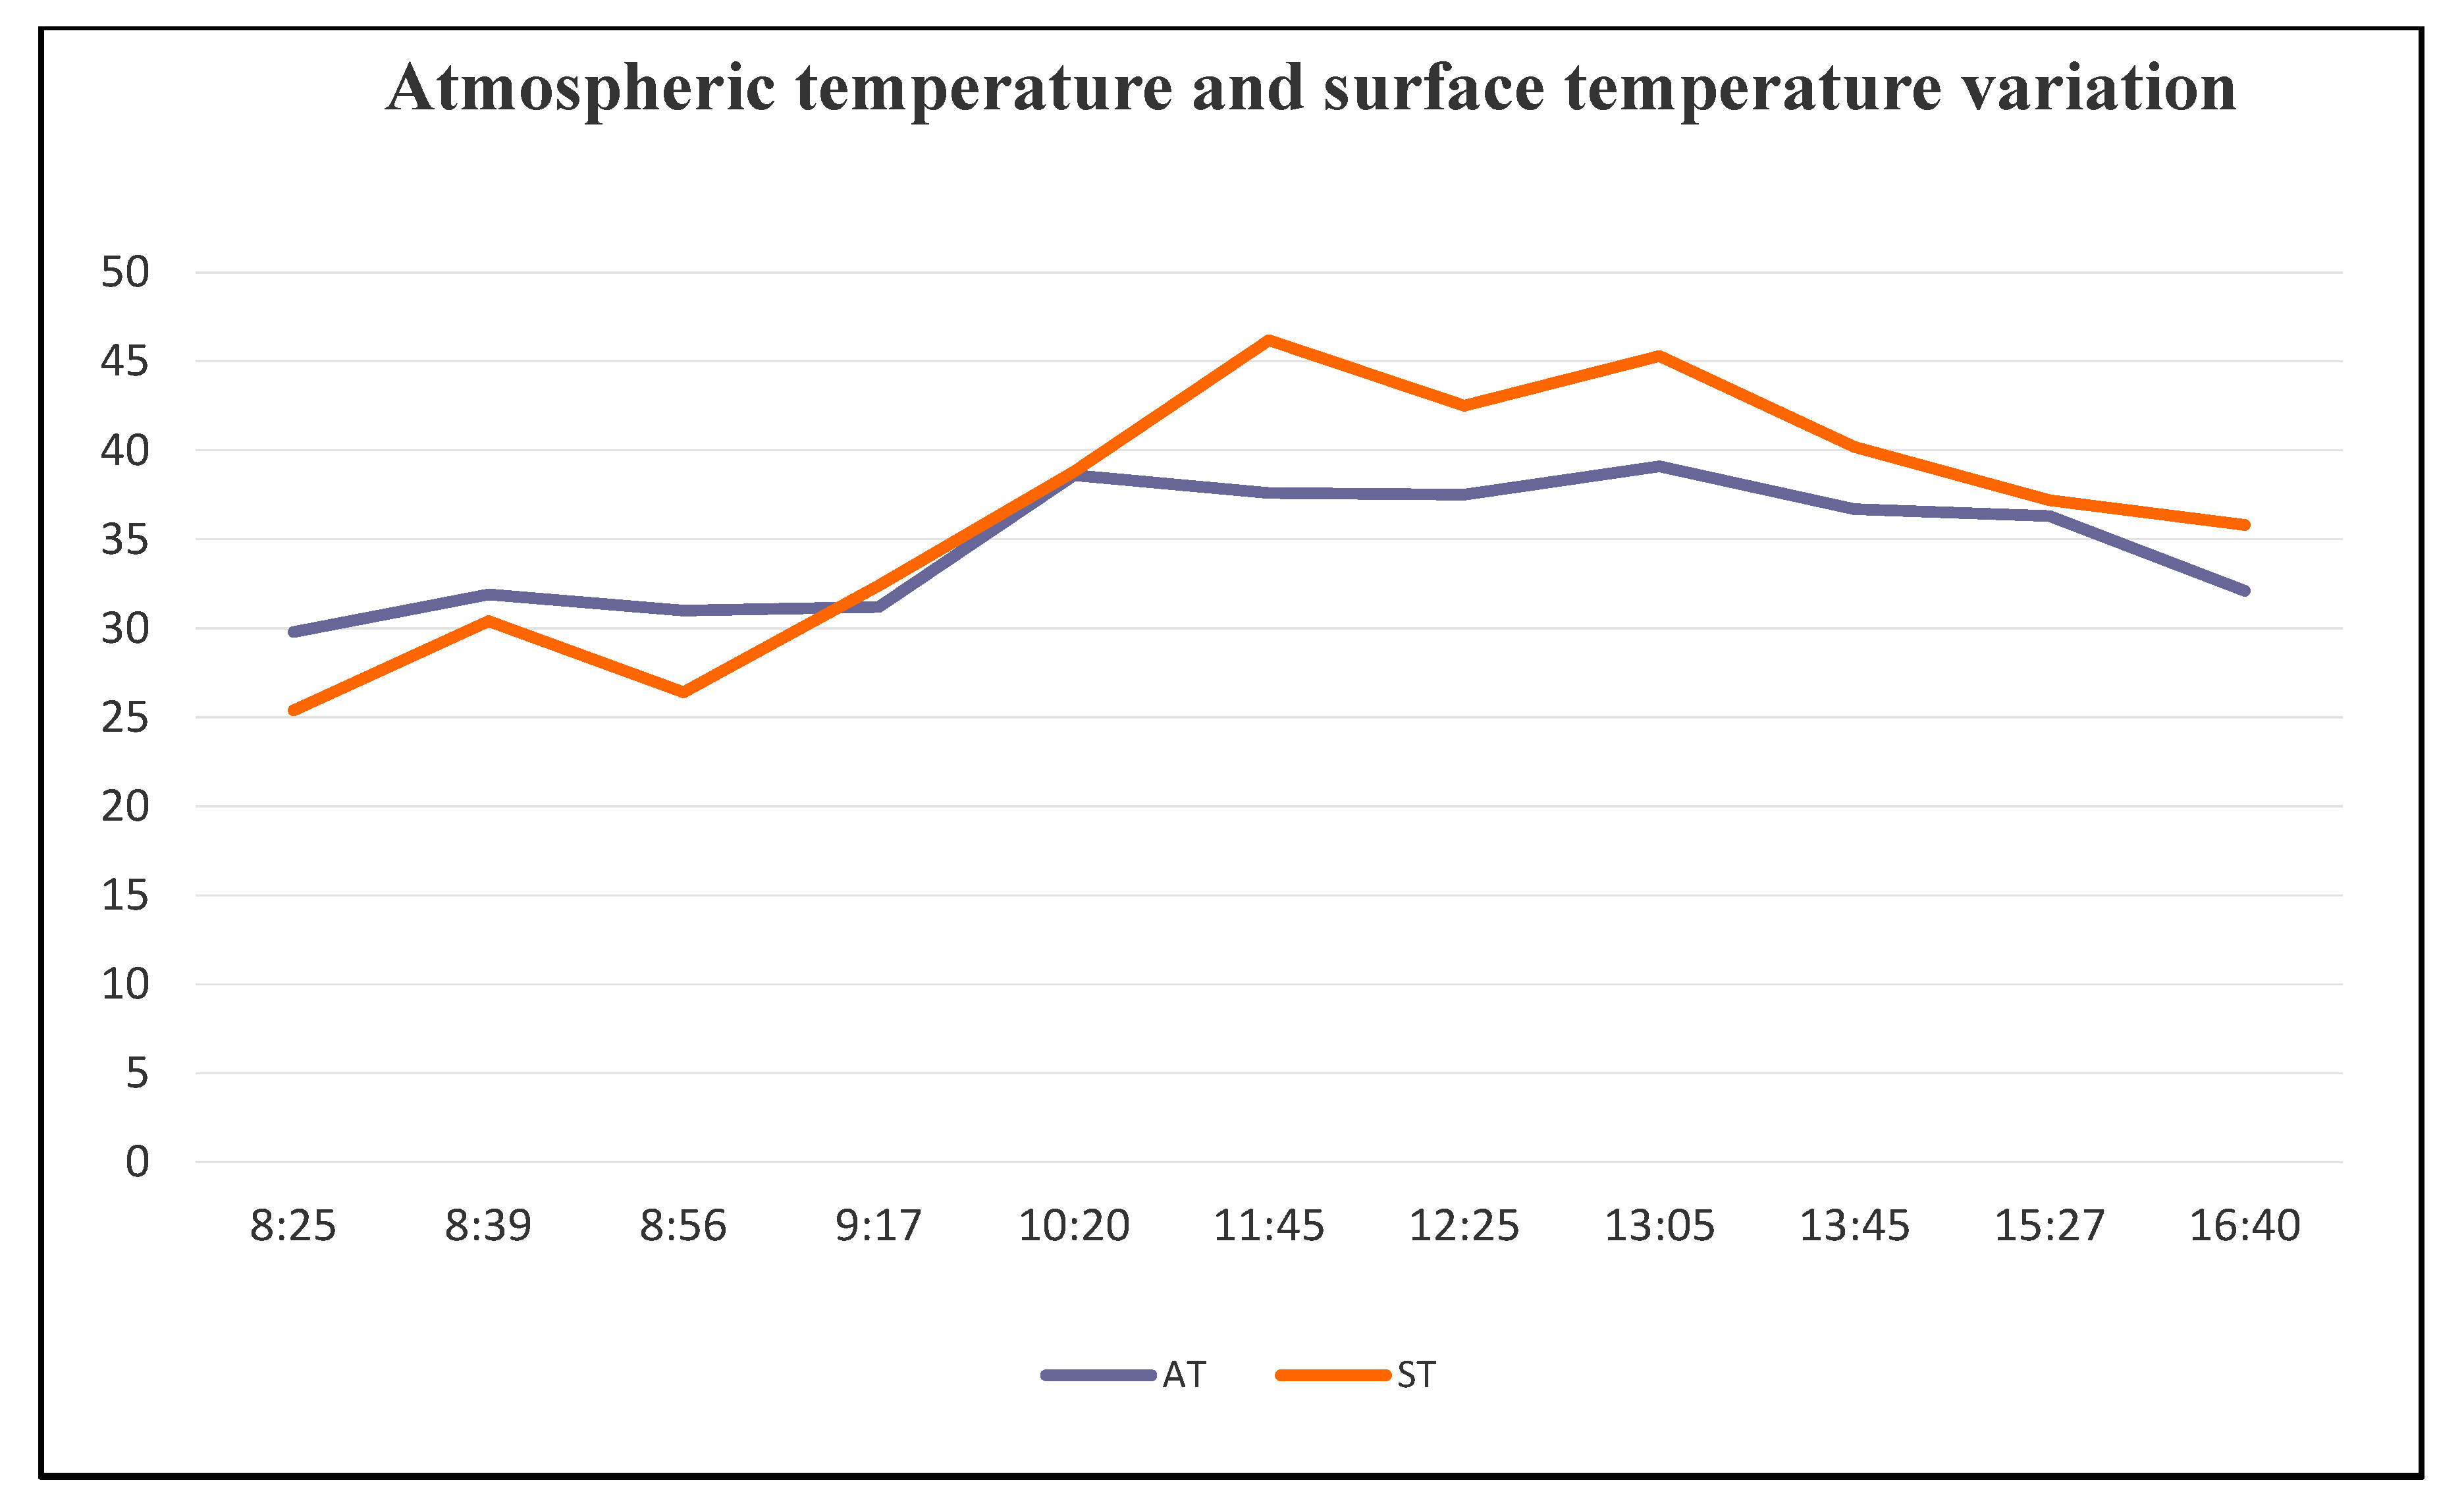
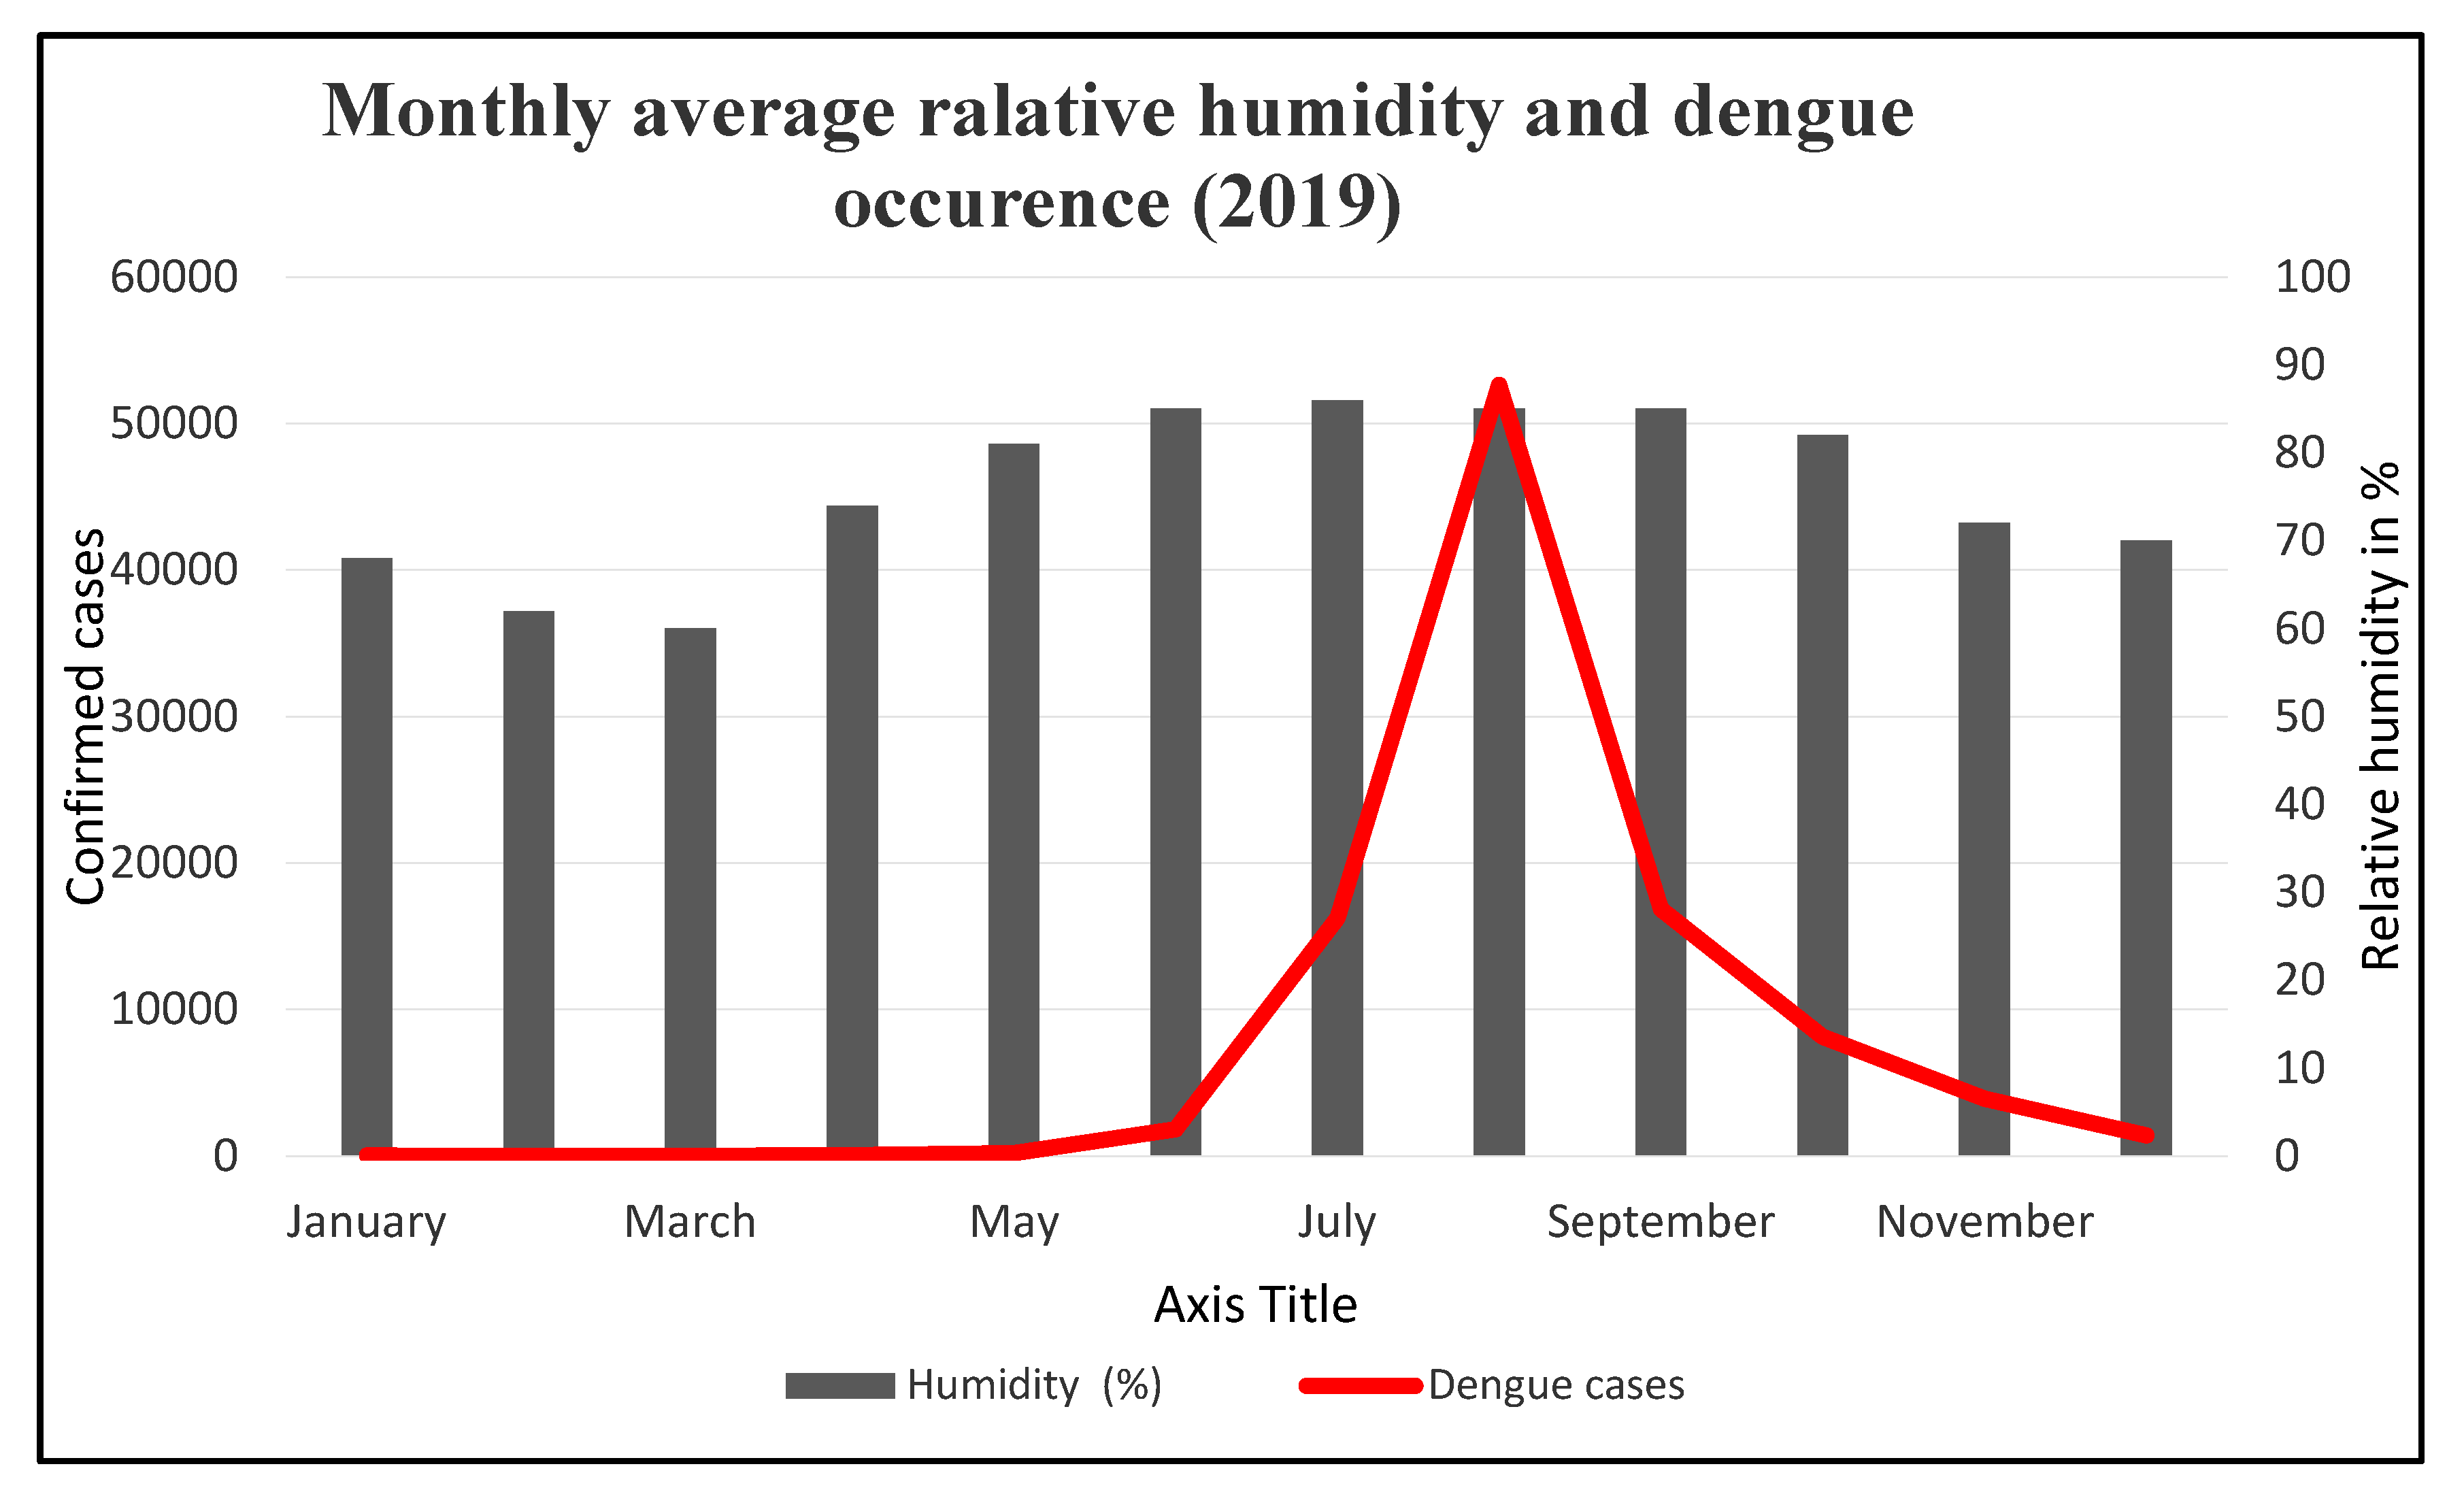
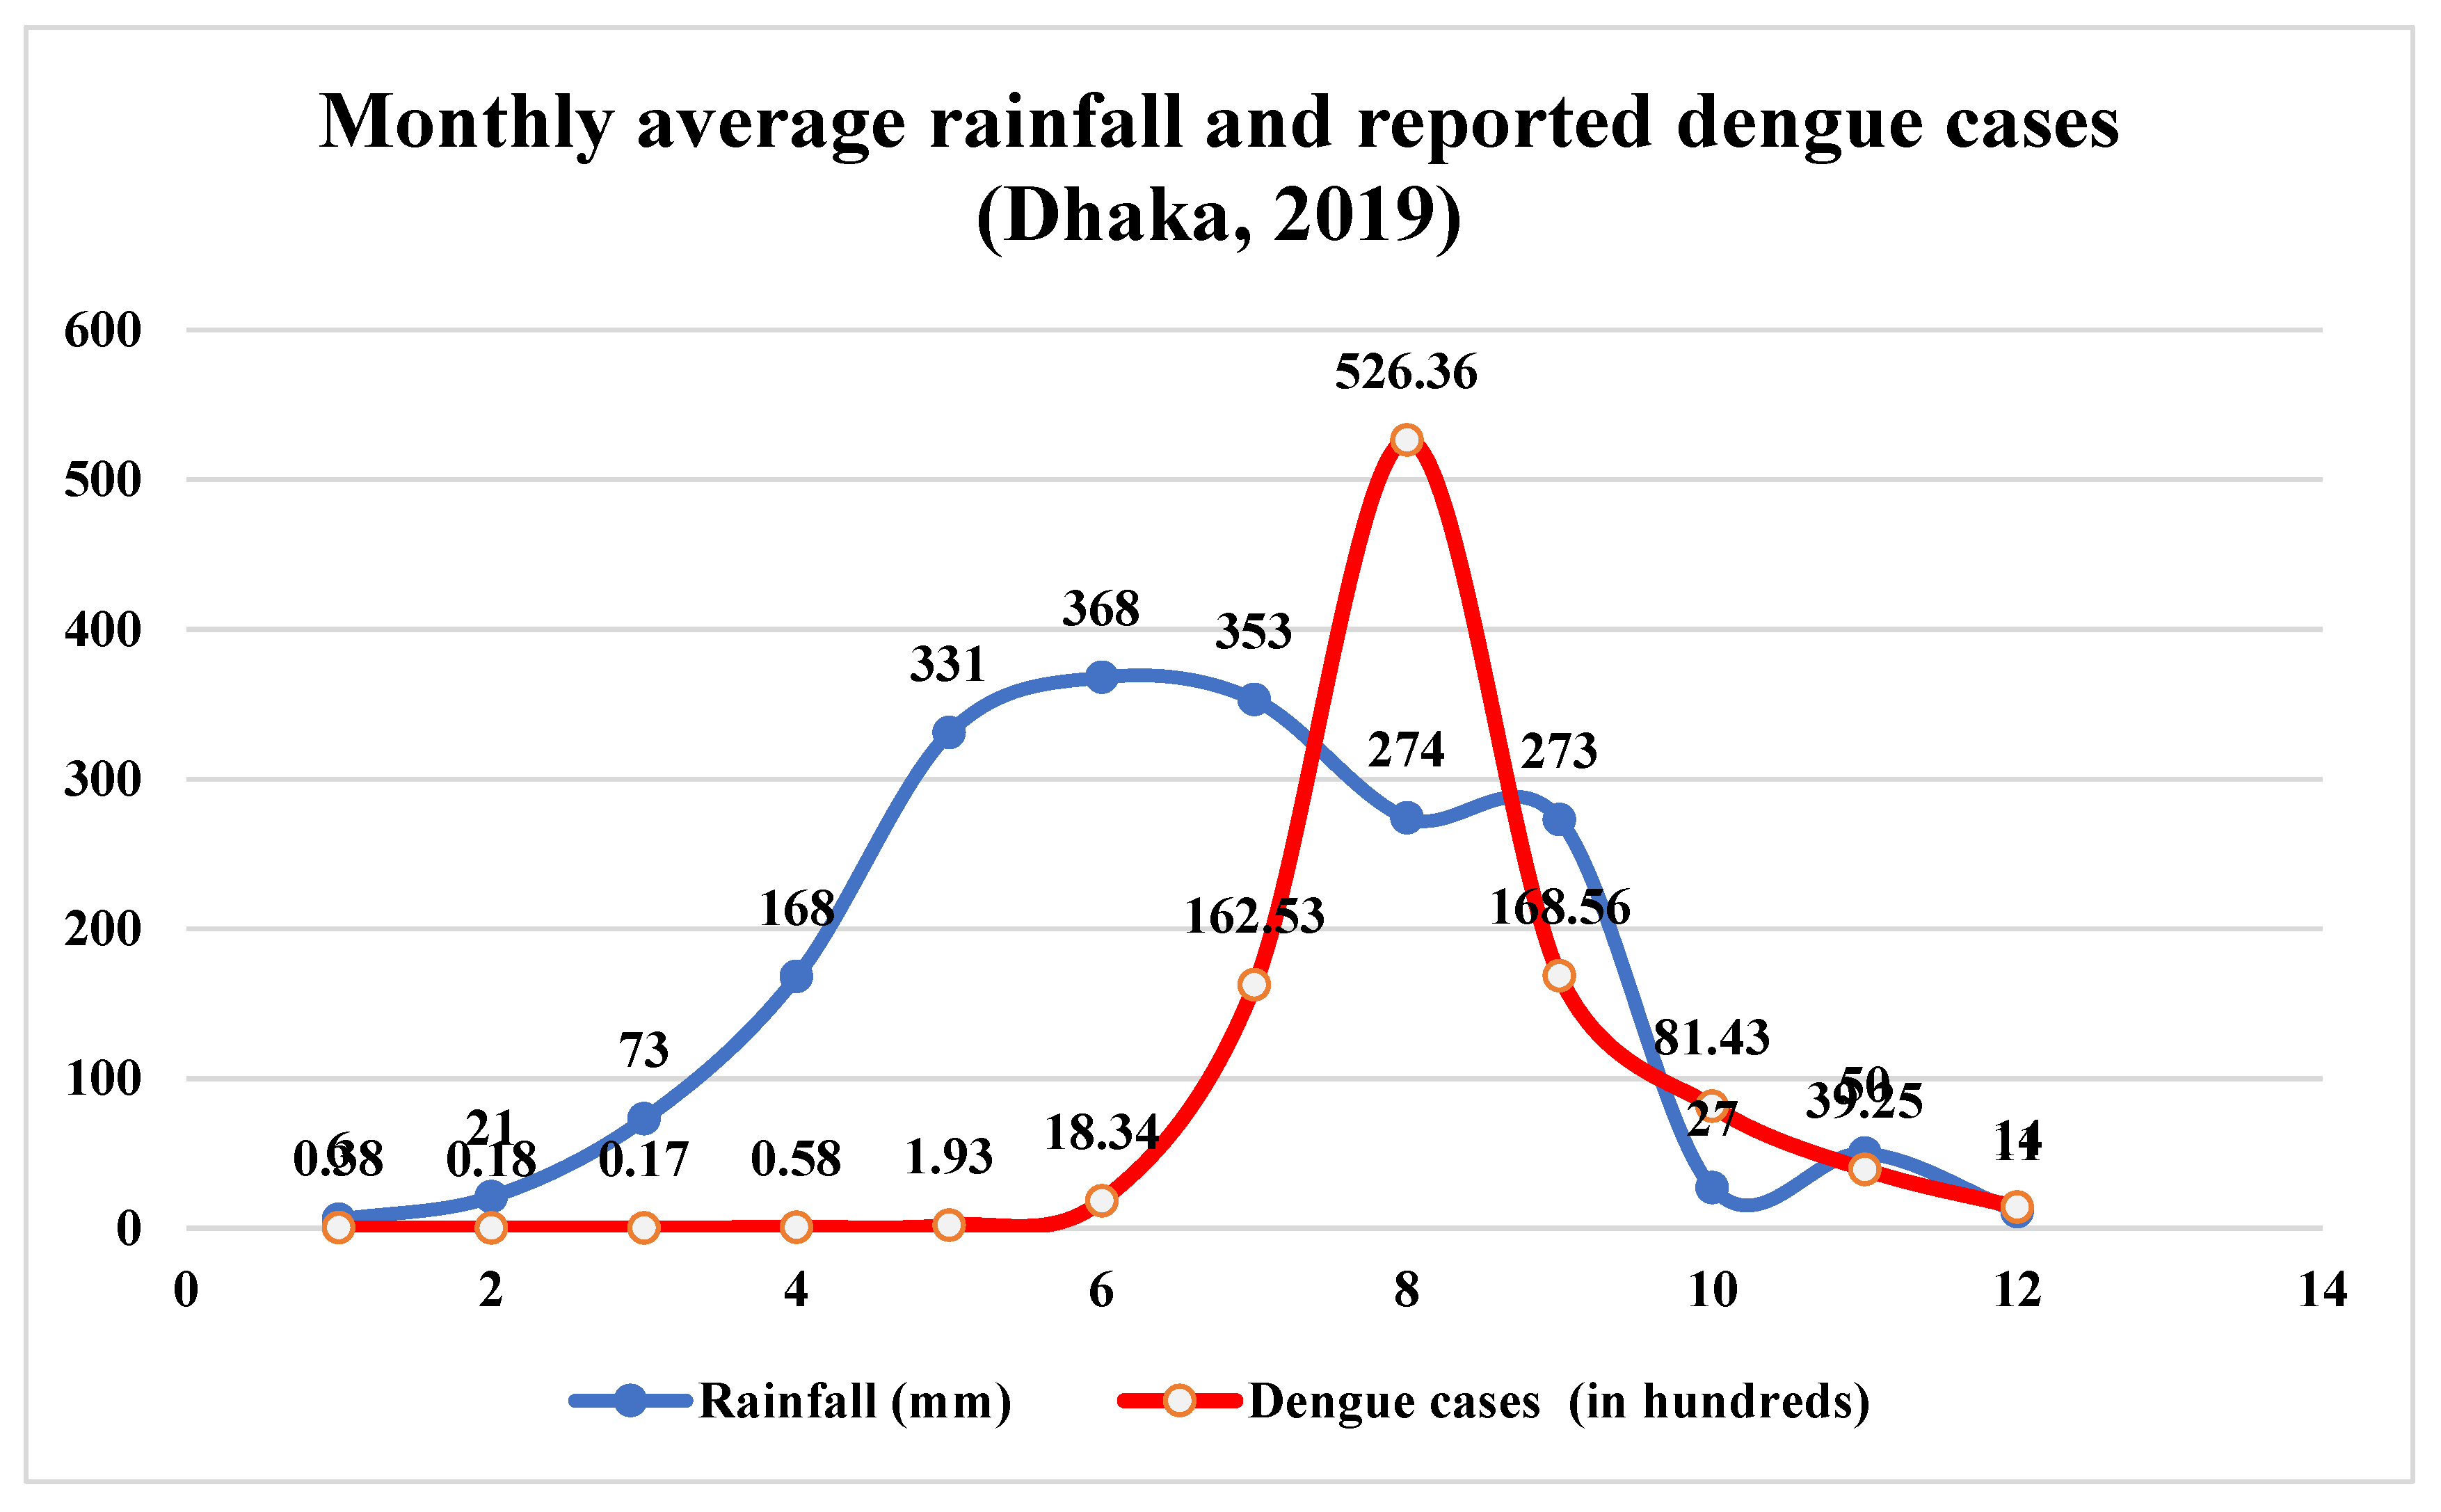
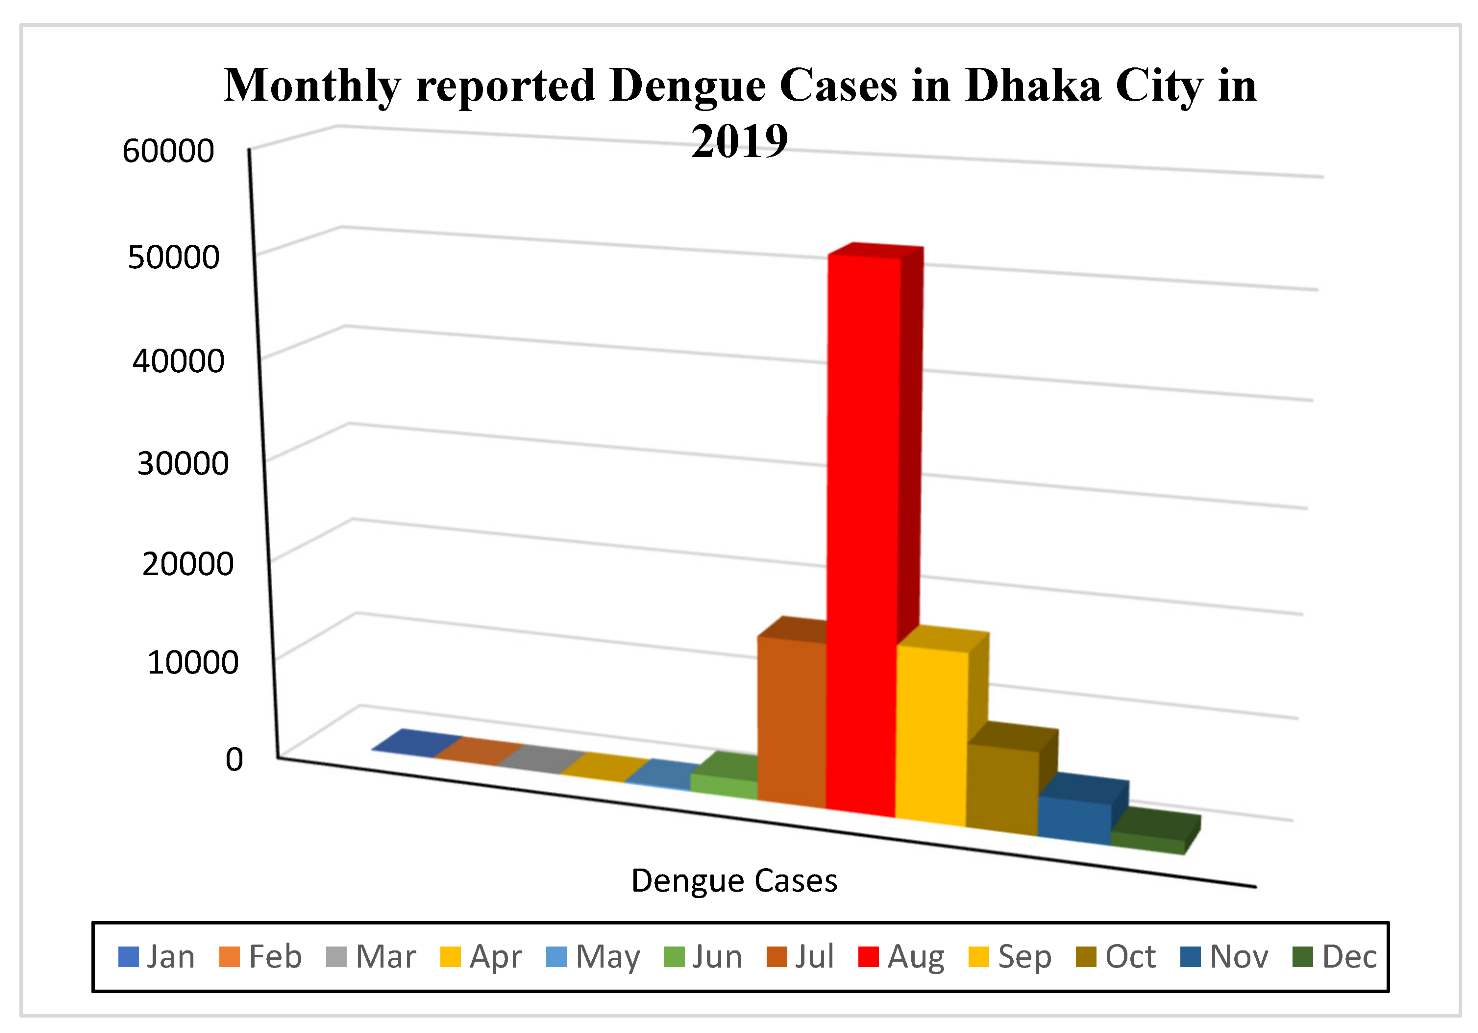
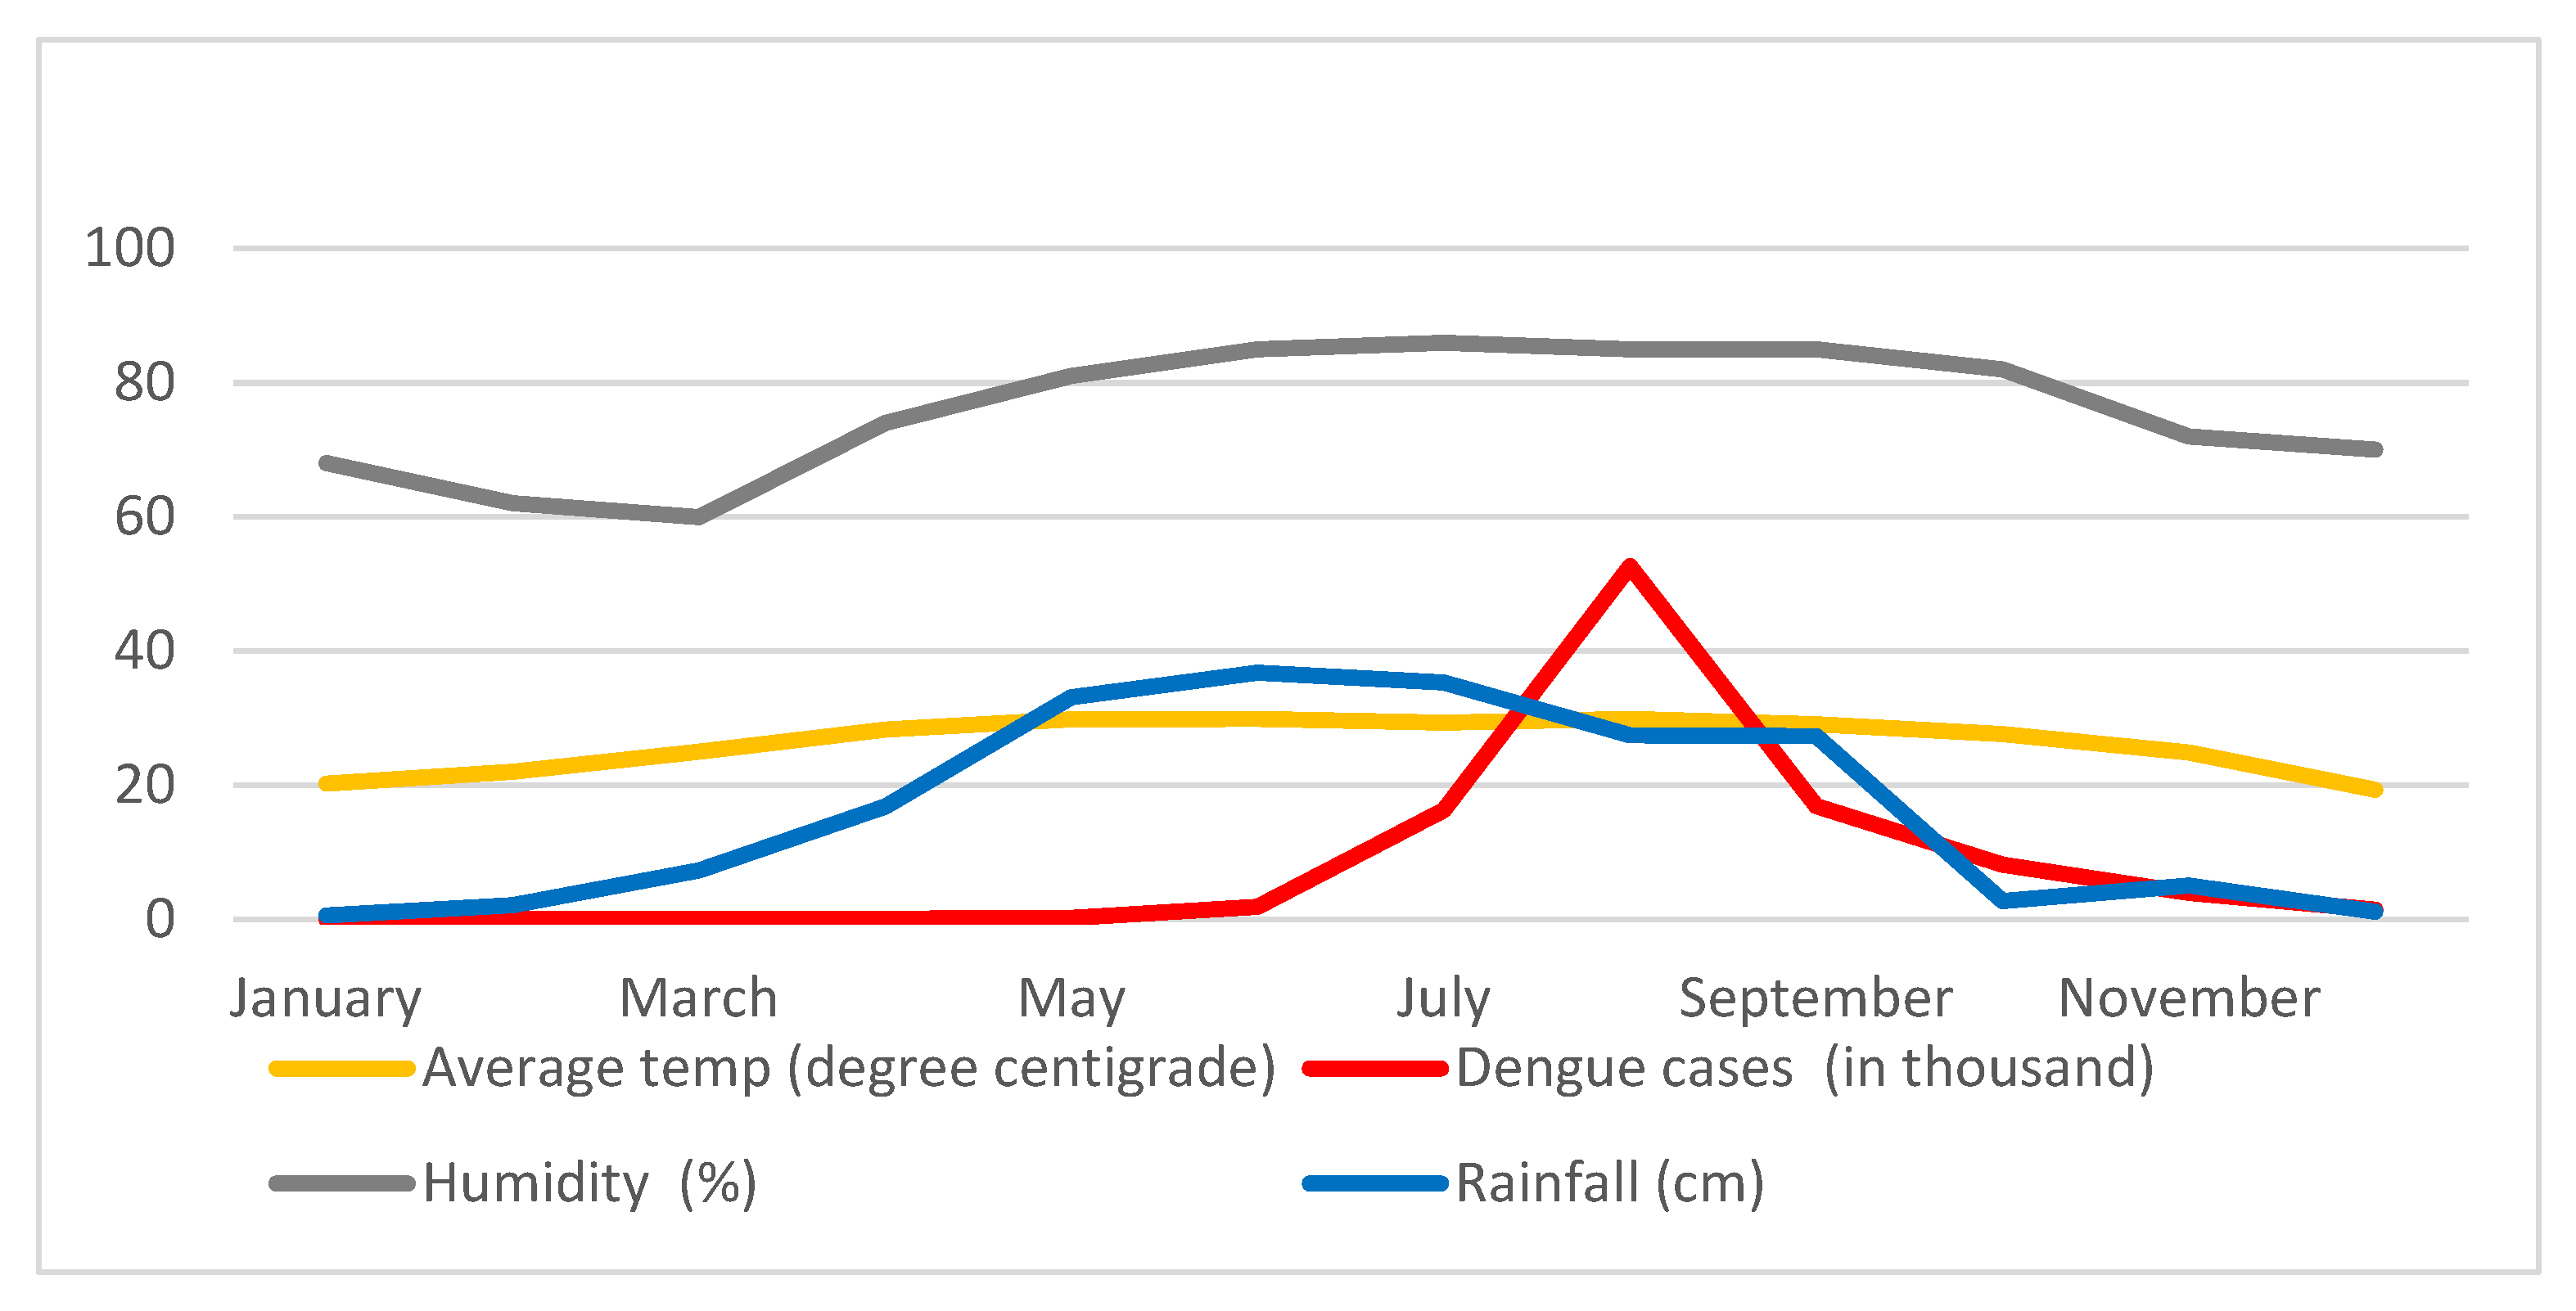
3.4. Climatic Factors Influencing Dengue Cases
4. Discussion
5. Conclusions
Supplementary Materials
Author Contributions
Funding
Institutional Review Board Statement
Informed Consent Statement
Data Availability Statement
Acknowledgments
Conflicts of Interest
References
- Sharmin, S.; Viennet, E.; Glass, K.; Harley, D. The emergence of dengue in Bangladesh: Epidemiology, challenges, and future disease risk. Trans. R. Soc. Trop. Med. Hyg. 2015, 109, 619–627. [Google Scholar] [CrossRef]
- WHO. Dengue: Guidelines for Diagnosis, Treatment, Prevention and Control; World Health Organization: Geneva, Switzerland, 2009; pp. 1–147. Available online: https://www.who.int/ (accessed on 12 January 2021).
- World Population Prospects (WPP). United Nations Population Estimates and Projections (Revision). 2019. Available online: http://worldpopulationreview.com/countries/bangladesh-population/ (accessed on 26 December 2020).
- Mutsuddy, P.; Jhora, T.S.; Shamsuzzaman, A.K.M.; Kaisar, S.M.G.; Khan, M.N.A. Dengue Situation in Bangladesh: An Epidemiological Shift in terms of Morbidity and Mortality. Can. J. Infect. Dis. Med. Microbiol. 2019, 12, 3516284. [Google Scholar] [CrossRef] [PubMed]
- Reyes-Castro, P.A.; Harris, R.B.; Brown, H.E.; Christopherson, G.L.; Ernst, K.C. Spatio-temporal and neighborhood characteristics of two dengue outbreaks in two arid cities of Mexico. Acta Trop. 2017, 167, 174–182. [Google Scholar] [CrossRef] [PubMed]
- Araujo, R.V.; Albertini, M.R.; Costa-da-Silva, A.L.; Suesdek, L.; Franceschi, N.C.S.; Bastos, N.M.A.; Katz, G.; Cardoso, V.A.; Castro, B.C.; Capurro, M.L.; et al. São Paulo urban heat islands have a higher incidence of dengue than other urban areas. Braz. J. Infect. Dis. 2015, 19, 146–155. [Google Scholar] [CrossRef] [PubMed]
- Azevedo, T.S.D.; Bourke, B.P.; Piovezan, R.; Sallum, M.A.M. The influence of urban heat islands and socioeconomic factors on the spatial distribution of Aedes aegypti larval habitats. Geospat. Health 2018, 13, 623. [Google Scholar] [CrossRef] [PubMed]
- Dhar-Chowdhury, P.; Paul, K.K.; Haque, C.E.; Hossain, S.; Lindsay, L.R.; Dibernardo, A.; Brooks, W.A.; Drebot, M.A. Dengue seroprevalence, seroconversion and risk factors in Dhaka, Bangladesh. PLoS Negl. Trop. Dis. 2017, 11, e0005475. [Google Scholar] [CrossRef] [PubMed]
- Belal, M.; Shakeel, M. Emergence of Dengue in Bangladesh a major international public health concern in recent years. Environ. Res. 2011, 2, 35–41. [Google Scholar]
- Ogashawara, I.; Li, L.; Moreno-Madrinan, M.J. Spatial-Temporal Assessment of Environmental Factors Related to Dengue Outbreaks in São Paulo, Brazil. GeoHealth 2019, 3, 202–217. [Google Scholar] [CrossRef]
- Mia, M.B.; Bhattacharya, R.; Woobaidullah, A.S.M. Correlation and Monitoring of Land Surface Temperature, Urban Heat Island with Land Use-Land Cover of Dhaka City Using Satellite Imageries. Int. J. Res. Geogr. 2017, 3, 10–20. [Google Scholar] [CrossRef]
- Gallo, K.P.; Tarpley, J.D. The comparison of vegetation index and surface temperature composites for urban heat-island analysis. Int. J. Remote Sens. 1996, 17, 3071–3076. [Google Scholar] [CrossRef]
- Chen, X.-L.; Zhao, H.-M.; Li, P.-X.; Yin, Z.-Y. Remote sensing image-based analysis of the relationship between urban heat island and land use/cover changes. Remote Sens. Environ. 2006, 104, 133–146. [Google Scholar] [CrossRef]
- Xiong, Y.; Huang, S.; Chen, F.; Ye, H.; Wang, C.; Zhu, C. The Impacts of Rapid Urbanization on the Thermal Environment: A Remote Sensing Study of Guangzhou, South China. Remote Sens. 2012, 4, 2033–2056. [Google Scholar] [CrossRef]
- Adams, M.P.; Smith, P.L. A systematic approach to model the influence of the type and density of vegetation cover on urban heat using remote sensing. Landsc. Urban Plan. 2014, 132, 47–54. [Google Scholar] [CrossRef]
- Zhang, H.; Qi, Z.; Ye, X.; Cai, Y.; Ma, W.; Chen, M. Analysis of land use/land cover change, population shift, and their effects on spatiotemporal patterns of urban heat islands in metropolitan Shanghai. China Appl. Geogr. 2013, 44, 121–133. [Google Scholar] [CrossRef]
- Li, X.; Zhou, W.; Ouyang, Z.; Xu, W.; Zheng, H. Spatial pattern of greenspace affects land surface temperature: Evidence from the heavily urbanized Beijing metropolitan area, China. Landsc. Ecol. 2012, 27, 887–898. [Google Scholar] [CrossRef]
- Naqvi, S.A.A.; Jan, B.; Shaikh, S.; Kazmi, S.J.H.; Waseem, L.A.; Nasar-U-Minallah, M.; Abbas, N. Changing climatic factors favor dengue transmission in Lahore, Pakistan. Environments 2019, 6, 71. [Google Scholar] [CrossRef]
- Islam, M.Z.; Rutherford, S.; Phung, D.; Uzzaman, M.N.; Baum, S.; Huda, M.M.; Asaduzzaman, M.; Talukder, M.R.; Chu, C. Correlates of Climate Variability and Dengue Fever in Two Metropolitan Cities in Bangladesh. Cureus 2018, 10, e3398. [Google Scholar] [CrossRef]
- WHO. Comprehensive Guidelines for Prevention and Control of Dengue and Dengue Hemorrhagic Fever; World Health Organization: Geneva, Switzerland, 2011; Available online: https://apps.who.int/iris/handle/10665/204894 (accessed on 21 December 2020).
- Martheswaran, T.K.; Hamdi, H.; Al-Barty, A.; Zaid, A.A.; Das, B. Prediction of dengue fever outbreaks using climate variability and Markov chain Monte Carlo techniques in a stochastic susceptible-infected-removed model. Sci. Rep. 2022, 12, 5459. [Google Scholar] [CrossRef]
- Liu, Z.; Zhang, Z.; Lai, Z.; Zhou, T.; Jia, Z.; Gu, J.; Wu, K.; Chen, X.G. Temperature increase enhances Aedes albopictus competence to transmit dengue virus. Front. Microbiol. 2017, 8, 2337. [Google Scholar] [CrossRef]
- Monath, T.P. Dengue: The risk to developed and developing countries. Proc. Natl. Acad. Sci. USA 1994, 91, 2395–2400. [Google Scholar] [CrossRef]
- Erlanger, T.E.; Keiser, J.; Utzinger, J. Effect of dengue vector control interventions on entomological parameters in developing countries: A systematic review and meta-analysis. Med. Vet. Entomol. 2008, 22, 203–221. [Google Scholar] [CrossRef]
- Duncombe, J.; Clements, A.; Hu, W.; Weinstein, P.; Ritchie, S.; Espino, F.E. Geographical information systems for dengue surveillance. Am. J. Trop. Med. Hyg. 2012, 86, 753. [Google Scholar] [CrossRef] [PubMed]
- Teixeira, M.G.; Costa, M.D.; Barreto, F.; Barreto, M.L. Dengue: Twenty-five years since reemergence in Brazil. Cad. Saúde Pública 2009, 25, S7–S18. [Google Scholar] [CrossRef] [PubMed]
- Kesetyaningsih, T.W.; Andarini, S.; Sudarto, S.; Pramoedyo, H. Determination of environmental factors affecting dengue incidence in Sleman District, Yogyakarta, Indonesia. Afr. J. Infect. Dis. 2018, 12, 13–25. [Google Scholar] [CrossRef] [PubMed]
- Ahmad, R.; Suzilah, I.; Najdah, W.M.; Topek, O.; Mustafakamal, I.; Lee, H.L. Factors determining dengue outbreak in Malaysia. PLoS ONE 2018, 13, e0193326. [Google Scholar] [CrossRef]
- Banu, S.; Hu, W.; Hurst, C.; Tong, S. Dengue transmission in the Asia-Pacific region: Impact of climate change and socio-environmental factors. Trop. Med. Int. Health 2011, 16, 598–607. [Google Scholar] [CrossRef] [PubMed]
- Dourjoy, S.M.; Rafi, A.M.; Tumpa, Z.N.; Saifuzzaman, M. A comparative study on prediction of dengue fever using machine learning algorithm. In Advances in Distributed Computing and Machine Learning, Proceedings of the ICADCML, Vellore, India, 30–31 January 2020; Springer: Berlin/Heidelberg, Germany, 2021; pp. 501–510. [Google Scholar]
- Hossain, M.P.; Zhou, W.; Ren, C.; Marshall, J.; Yuan, H.Y. Prediction of dengue annual incidence using seasonal climate variability in Bangladesh between 2000 and 2018. PLoS Glob. Public Health 2022, 2, e0000047. [Google Scholar] [CrossRef]
- Dey, S.K.; Rahman, M.M.; Howlader, A.; Siddiqi, U.R.; Uddin, K.M.; Borhan, R.; Rahman, E.U. Prediction of dengue incidents using hospitalized patients, metrological and socio-economic data in Bangladesh: A machine learning approach. PLoS ONE 2022, 17, e0270933. [Google Scholar] [CrossRef]
- Hossain, M.S.; Siddiqee, M.H.; Siddiqi, U.R.; Raheem, E.; Akter, R.; Hu, W. Dengue in a crowded megacity: Lessons learnt from 2019 outbreak in Dhaka, Bangladesh. PLoS Negl. Trop. Dis. 2020, 14, e0008349. [Google Scholar] [CrossRef]
- Telle, O.; Nikolay, B.; Kumar, V.; Benkimoun, S.; Pal, R.; Nagpal, B.N.; Paul, R.E. Social and environmental risk factors for dengue in Delhi city: A retrospective study. PLoS Negl. Trop. Dis. 2021, 15, e0009024. [Google Scholar] [CrossRef]
- Lefebvre, B.; Karki, R.; Misslin, R.; Nakhapakorn, K.; Daudé, E.; Paul, R.E. Importance of Public Transport Networks for Reconciling the Spatial Distribution of Dengue and the Association of Socio-Economic Factors with Dengue Risk in Bangkok, Thailand. Int. J. Environ. Res. Public Health 2022, 19, 10123. [Google Scholar] [CrossRef] [PubMed]
- Stoddard, S.T.; Morrison, A.C.; Vazquez-Prokopec, G.M.; Paz Soldan, V.; Kochel, T.J.; Kitron, U.; Elder, J.P.; Scott, T.W. The role of human movement in the transmission of vector-borne pathogens. PLoS Negl. Trop. Dis. 2009, 3, e481. [Google Scholar] [CrossRef] [PubMed]
- Stoddard, S.T.; Forshey, B.M.; Morrison, A.C.; Paz-Soldan, V.A.; Vazquez-Prokopec, G.M.; Astete, H.; Reiner, R.C., Jr.; Vilcarromero, S.; Elder, J.P.; Halsey, E.S.; et al. House-to-house human movement drives dengue virus transmission. Proc. Natl. Acad. Sci. USA 2013, 110, 994. [Google Scholar] [CrossRef] [PubMed]
- Teurlai, M.; Huy, R.; Cazelles, B.; Duboz, R.; Baehr, C.; Vong, S. Can human movements explain heterogeneous propagation of dengue fever in Cambodia? PLoS Negl. Trop. Dis. 2012, 6, e1957. [Google Scholar] [CrossRef]
- Nakhapakorn, K.; Sancharoen, W.; Mutchimwong, A.; Jirakajohnkool, S.; Onchang, R.; Rotejanaprasert, C.; Tantrakarnapa, K.; Paul, R. Assessment of urban land surface temperature and vertical city associated with dengue incidences. Remote Sens. 2020, 12, 3802. [Google Scholar] [CrossRef]
- Misslin, R.; Telle, O.; Daudé, E.; Vaguet, A.; Paul, R.E. Urban climate versus global climate change—What makes the difference for dengue? Ann. N. Y. Acad. Sci. 2016, 1382, 56–72. [Google Scholar] [CrossRef]
- Swapan, M.S.H.; Zaman, A.U.; Ahsan, T.; Ahmed, F. Transforming Urban Dichotomies and Challenges of South Asian Megacities: Rethinking Sustainable Growth of Dhaka, Bangladesh. Urban Sci. 2017, 1, 31. [Google Scholar] [CrossRef]
- Buyantuyev, A.; Wu, J. Urban heat islands and landscape heterogeneity: Linking spatiotemporal variations in surface temperatures to land-cover and socioeconomic patterns. Landsc. Ecol. 2009, 25, 17–33. [Google Scholar] [CrossRef]
- Shahid, S. Recent trends in the climate of Bangladesh. Clim. Res. 2010, 42, 185–193. [Google Scholar] [CrossRef]
- Ahmed, B.; Kamruzzaman, M.; Zhu, X.; Rahman, M.; Choi, K. Simulating land cover changes and their impacts on land surface temperature in Dhaka, Bangladesh. Remote Sens. 2013, 5, 5969–5998. [Google Scholar] [CrossRef]
- Sharma, M.; Bangotra, P.; Gautam, A.S.; Gautam, S. Sensitivity of normalized difference vegetation index (NDVI) to land surface temperature, soil moisture and precipitation over district Gautam Buddh Nagar, UP, India. Stoch Env. Res Risk Assess 2022, 36, 1779–1789. [Google Scholar] [CrossRef] [PubMed]
- Landsat 8 Data User Handbook. 2015. Available online: https://www.usgs.gov/landsat-missions/landsat-8-data-users-handbook (accessed on 2 December 2020).
- Voogt, J.A.; Oke, T.R. Thermal Remote Sensing of Urban Climates. Remote Sens. Environ. 2003, 86, 370–384. [Google Scholar] [CrossRef]
- Stathopoulou, M.; Cartalis, C. Daytime Urban Heat Islands from Landsat ETM+ and Corine Land Cover Data: An Application to Major Cities in Greece. Solar Energy 2007, 81, 358–368. [Google Scholar] [CrossRef]
- Dom, N.C.; Ahmad, A.H.; Latif, Z.A.; Ismail, R. Application of geographical information system-based analytical hierarchy process as a tool for dengue risk assessment. Asian Pac. J. Trop. Dis. 2016, 6, 928–935. [Google Scholar] [CrossRef]
- Quintero, J.; Brochero, H.; Manrique-Saide, P.; Barrera-Pérez, M.; Basso, C.; Romero, S.; Caprara, A.; De Lima Cunha, J.C.; Beltrán-Ayala, E.; Mitchell-Foster, K.; et al. Ecological, biological and social dimensions of dengue vector breeding in five urban settings of Latin America: A multi-country study. BMC Infect Dis 2014, 14, 38. [Google Scholar] [CrossRef] [PubMed]
- Rahman, M.S.; Ekalaksananan, T.; Zafar, S.; Poolphol, P.; Shipin, O.; Haque, U.; Paul, R.; Rocklöv, J.; Pientong, C.; Overgaard, H.J. Ecological, social, and other environmental determinants of dengue vector abundance in urban and rural areas of northeastern Thailand. Int. J. Environ. Res. Public Health 2021, 18, 5971. [Google Scholar] [CrossRef]
- Telle, O.; Vaguet, A.; Yadav, N.K.; Lefebvre, B.; Daudé, E.; Paul, R.E.; Cebeillac, A.; Nagpal, B.N. The Spread of Dengue in an Endemic Urban Milieu–The Case of Delhi, India. PLoS ONE 2016, 11, e0146539. [Google Scholar] [CrossRef]


| Sensor | Date | Resolution (m) |
|---|---|---|
| Landsat OLI/TIRS | 9 June 2019 | 30 |
| Sentinel 2B | 17 June 2019 | 10–20 |
| Sentinel 2B | 13 June 2019 | 10–20 |
| Constant | Landsat OLI/TIRS Band-10 |
|---|---|
| K1 (watts) | 774.8853 |
| K2 (kelvin) | 1321.0789 |
| Class | Description | Area (sq. Km) | Area (%) |
|---|---|---|---|
| Water Bodies | Rivers, lakes, ponds, etc. | 7.99 | 2.51 |
| Vegetation | Agricultural land, shrubs, dense forests, etc. | 40.51 | 12.81 |
| Bare Soil | Open fields, sand-filled fields, playgrounds, etc. | 8.33 | 2.66 |
| Built-up Areas | Buildings, roads, industries, and development features. | 259.17 | 82.02 |
| Total | 316.71 | 100% | |
| Temperature Class | Range (°C) | Area (%) |
|---|---|---|
| Low | 22–23 | 39.6 |
| Moderately low | 23–25 | 22.1 |
| Moderate | 25–26 | 16.6 |
| Moderately high | 26–27 | 13.9 |
| High or UHI | 27–32 | 7.8 |
Disclaimer/Publisher’s Note: The statements, opinions and data contained in all publications are solely those of the individual author(s) and contributor(s) and not of MDPI and/or the editor(s). MDPI and/or the editor(s) disclaim responsibility for any injury to people or property resulting from any ideas, methods, instructions or products referred to in the content. |
© 2023 by the authors. Licensee MDPI, Basel, Switzerland. This article is an open access article distributed under the terms and conditions of the Creative Commons Attribution (CC BY) license (https://creativecommons.org/licenses/by/4.0/).
Share and Cite
Kamal, A.S.M.M.; Al-Montakim, M.N.; Hasan, M.A.; Mitu, M.M.P.; Gazi, M.Y.; Uddin, M.M.; Mia, M.B. Relationship between Urban Environmental Components and Dengue Prevalence in Dhaka City—An Approach of Spatial Analysis of Satellite Remote Sensing, Hydro-Climatic, and Census Dengue Data. Int. J. Environ. Res. Public Health 2023, 20, 3858. https://doi.org/10.3390/ijerph20053858
Kamal ASMM, Al-Montakim MN, Hasan MA, Mitu MMP, Gazi MY, Uddin MM, Mia MB. Relationship between Urban Environmental Components and Dengue Prevalence in Dhaka City—An Approach of Spatial Analysis of Satellite Remote Sensing, Hydro-Climatic, and Census Dengue Data. International Journal of Environmental Research and Public Health. 2023; 20(5):3858. https://doi.org/10.3390/ijerph20053858
Chicago/Turabian StyleKamal, A. S. M. Maksud, Md. Nahid Al-Montakim, Md. Asif Hasan, Mst. Maxim Parvin Mitu, Md. Yousuf Gazi, Md. Mahin Uddin, and Md. Bodruddoza Mia. 2023. "Relationship between Urban Environmental Components and Dengue Prevalence in Dhaka City—An Approach of Spatial Analysis of Satellite Remote Sensing, Hydro-Climatic, and Census Dengue Data" International Journal of Environmental Research and Public Health 20, no. 5: 3858. https://doi.org/10.3390/ijerph20053858
APA StyleKamal, A. S. M. M., Al-Montakim, M. N., Hasan, M. A., Mitu, M. M. P., Gazi, M. Y., Uddin, M. M., & Mia, M. B. (2023). Relationship between Urban Environmental Components and Dengue Prevalence in Dhaka City—An Approach of Spatial Analysis of Satellite Remote Sensing, Hydro-Climatic, and Census Dengue Data. International Journal of Environmental Research and Public Health, 20(5), 3858. https://doi.org/10.3390/ijerph20053858