
Geochemical Characteristics of the Vertical Distribution of Heavy Metals in the Hummocky Peatlands of the Cryolithozone


Abstract
1. Introduction
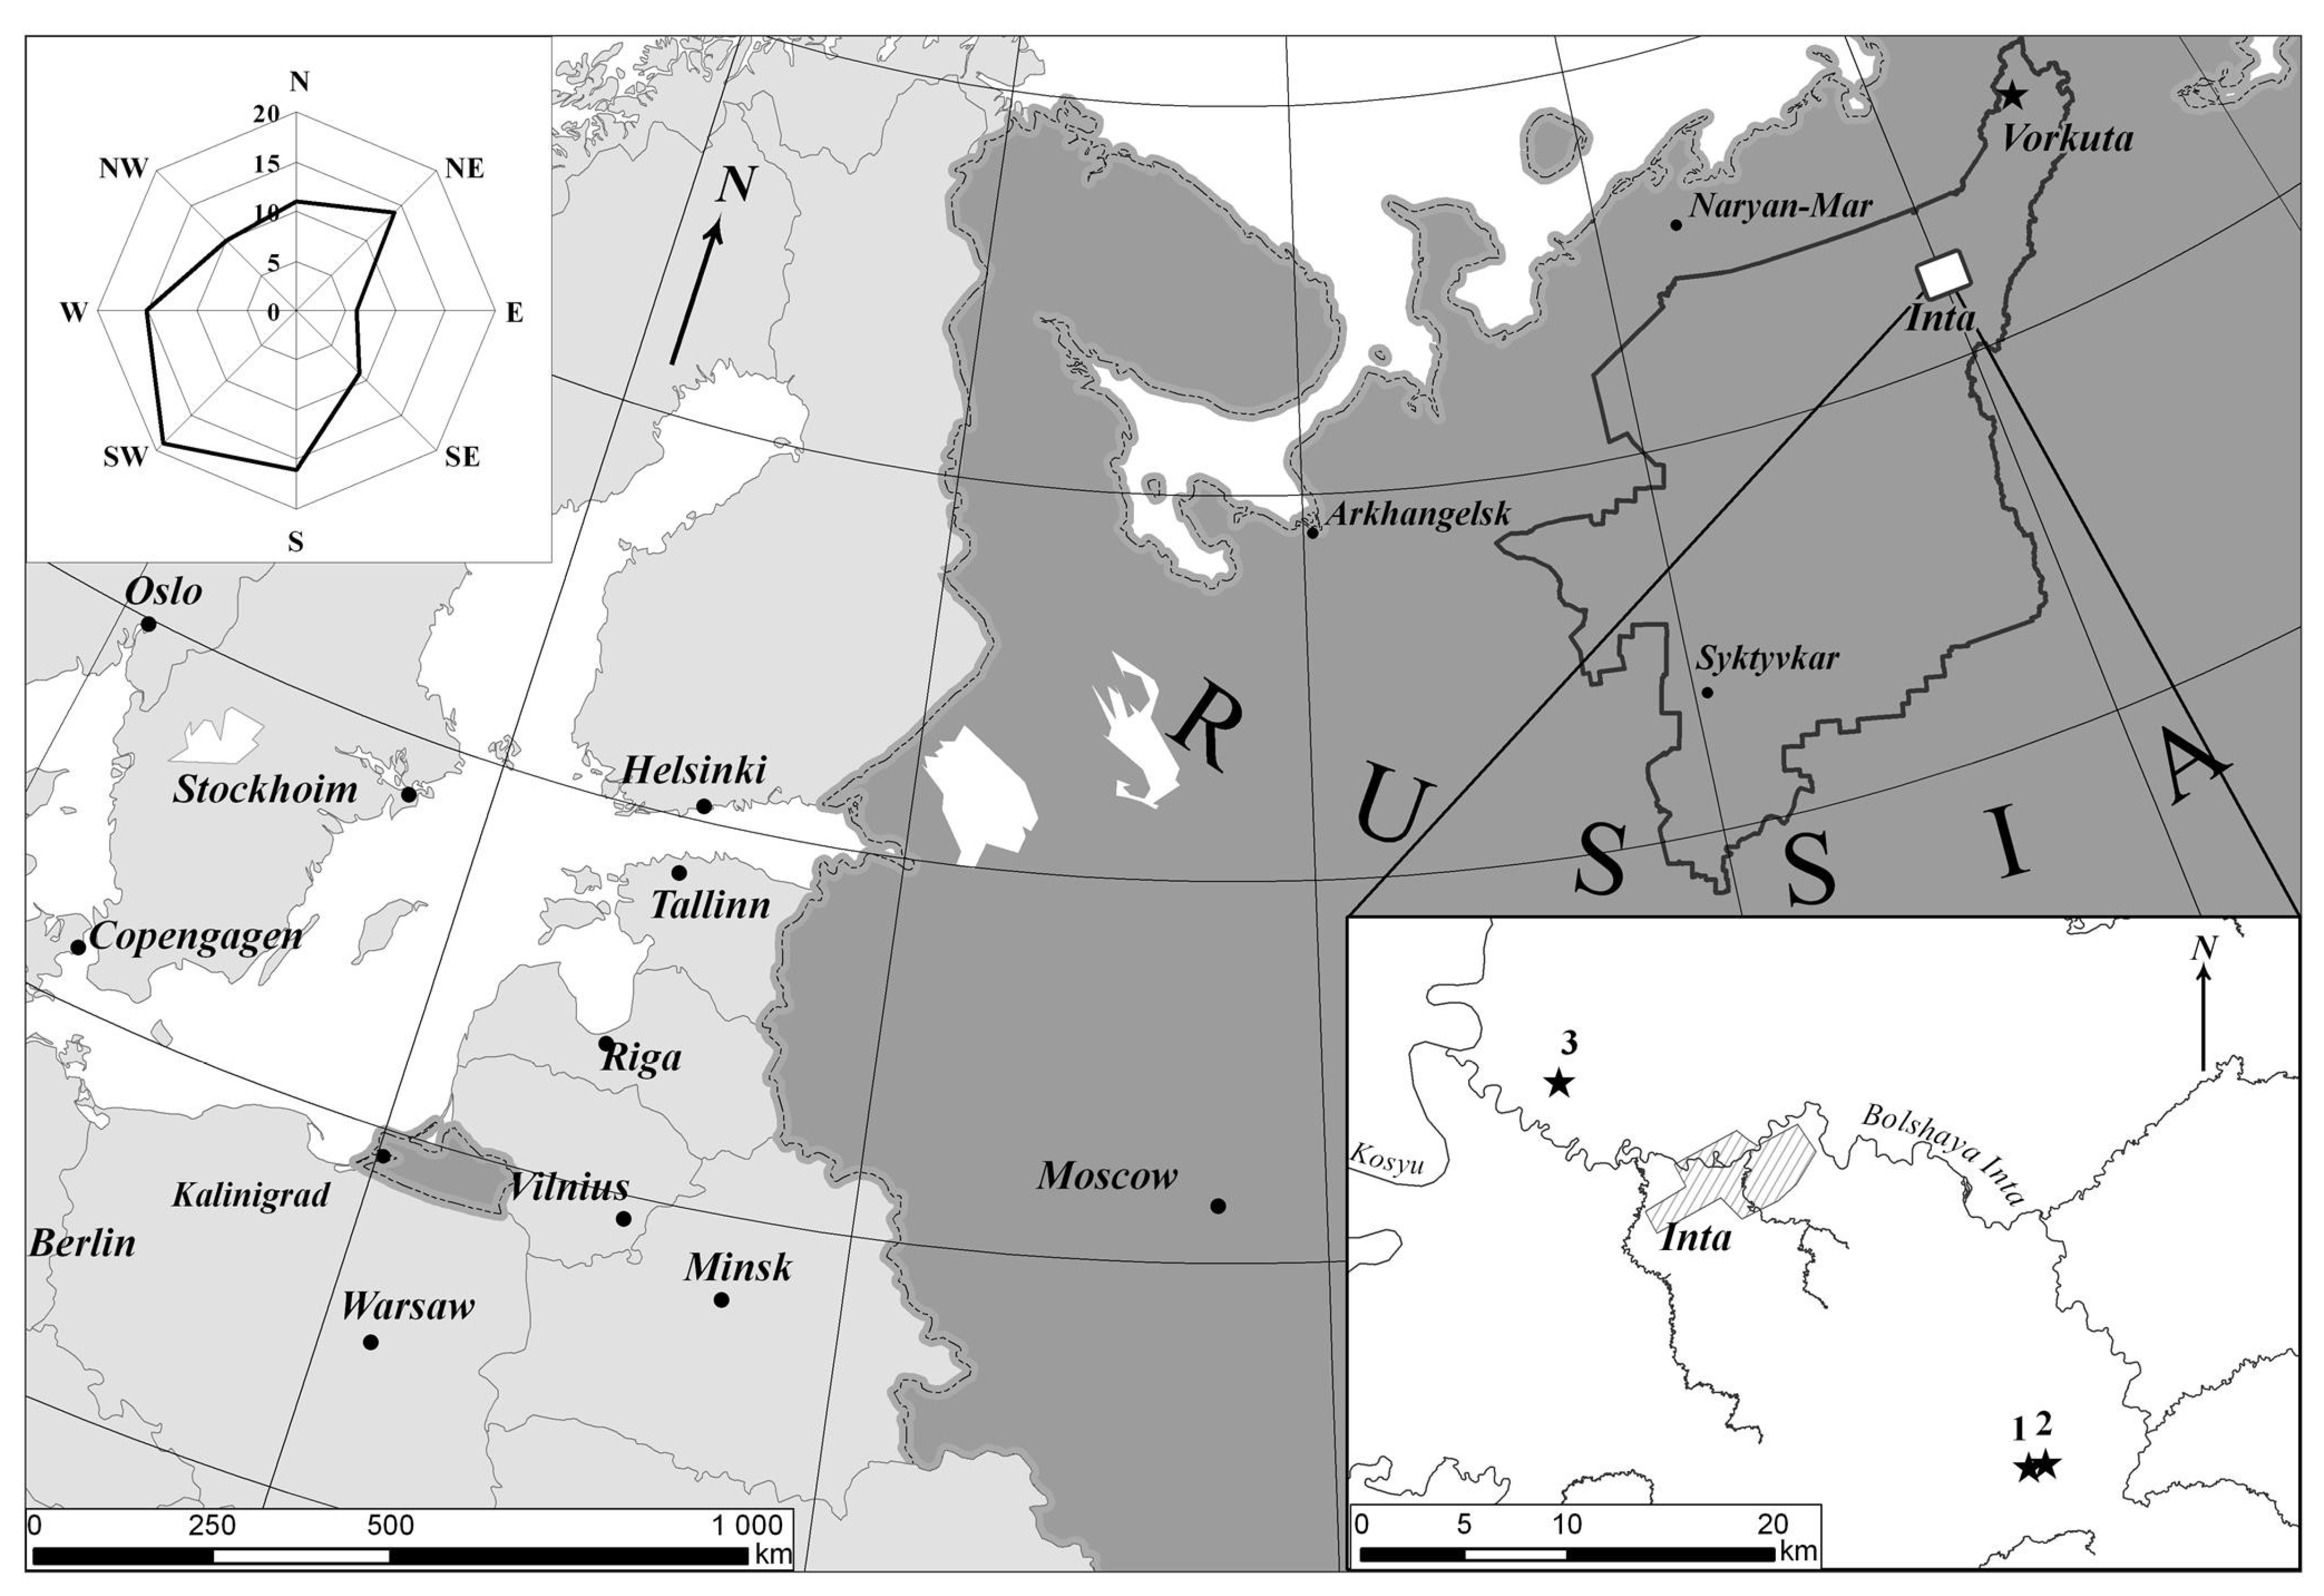
2. Materials
3. Methods
4. Results and Discussion
4.1. Botanical Composition and Peat Age
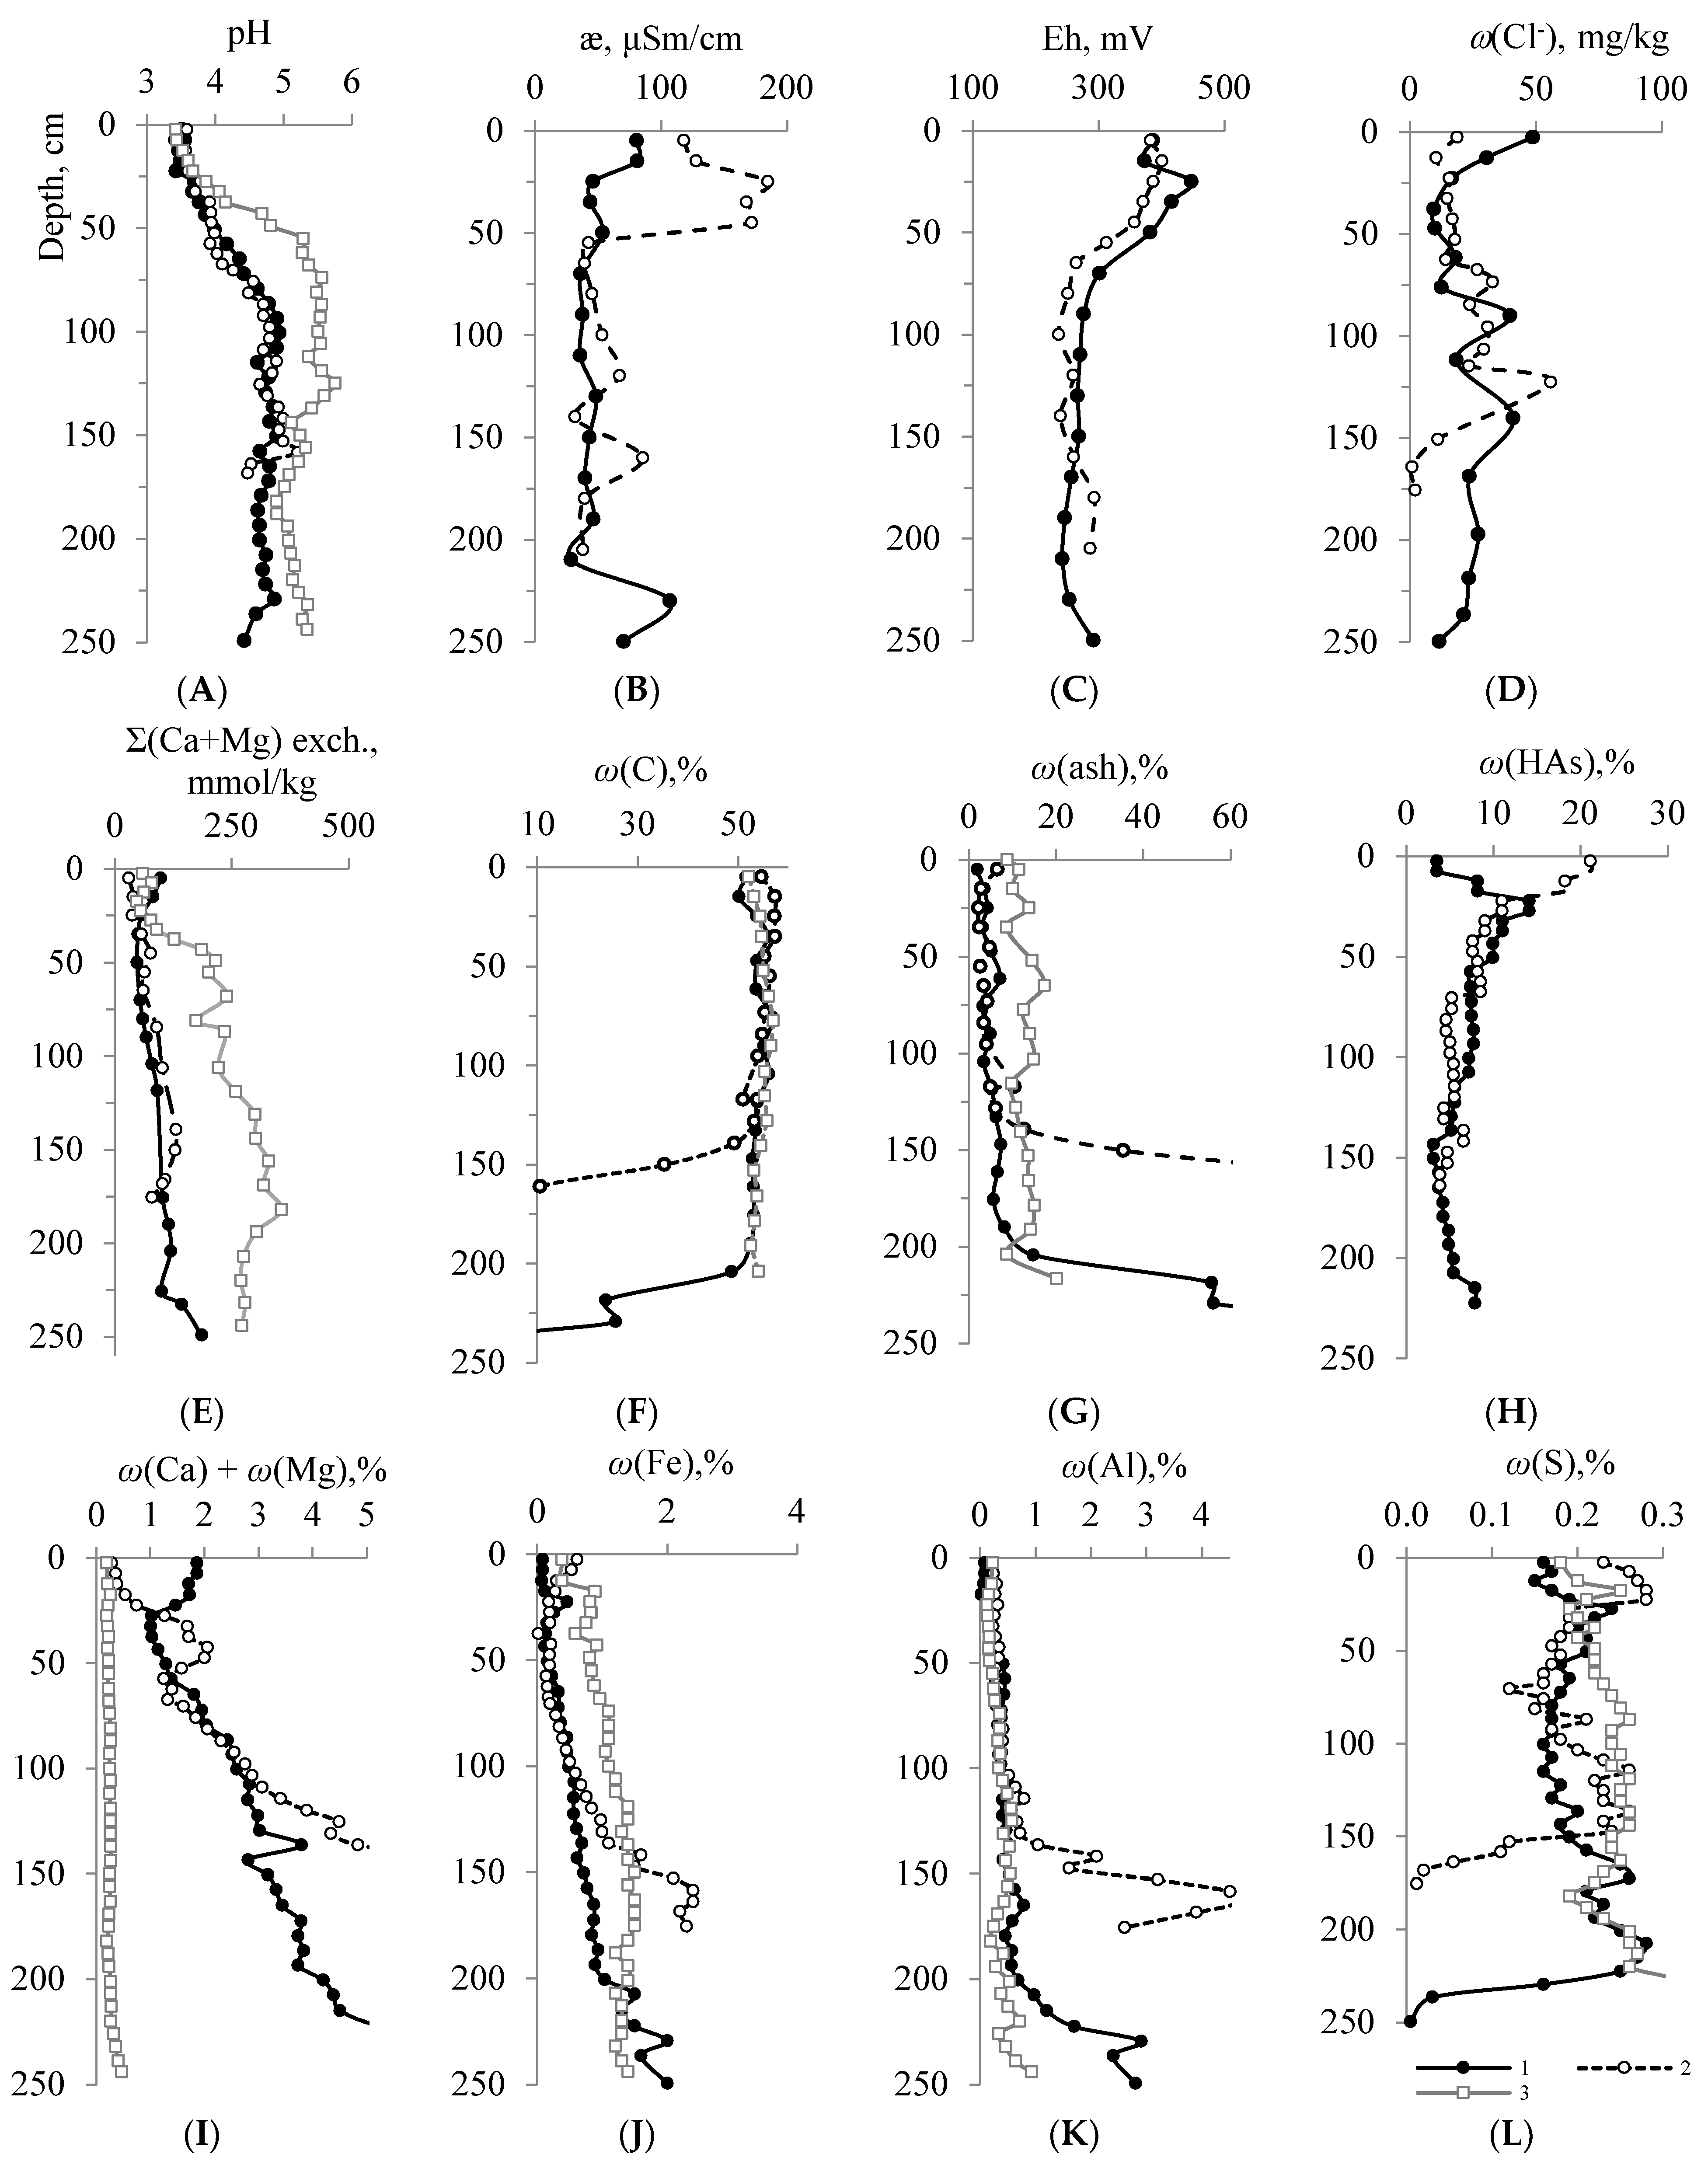
4.2. Physical and Chemical Properties, Macroelement Composition
4.3. Microelement Composition of Peat Deposits in Hummocky Peatlands
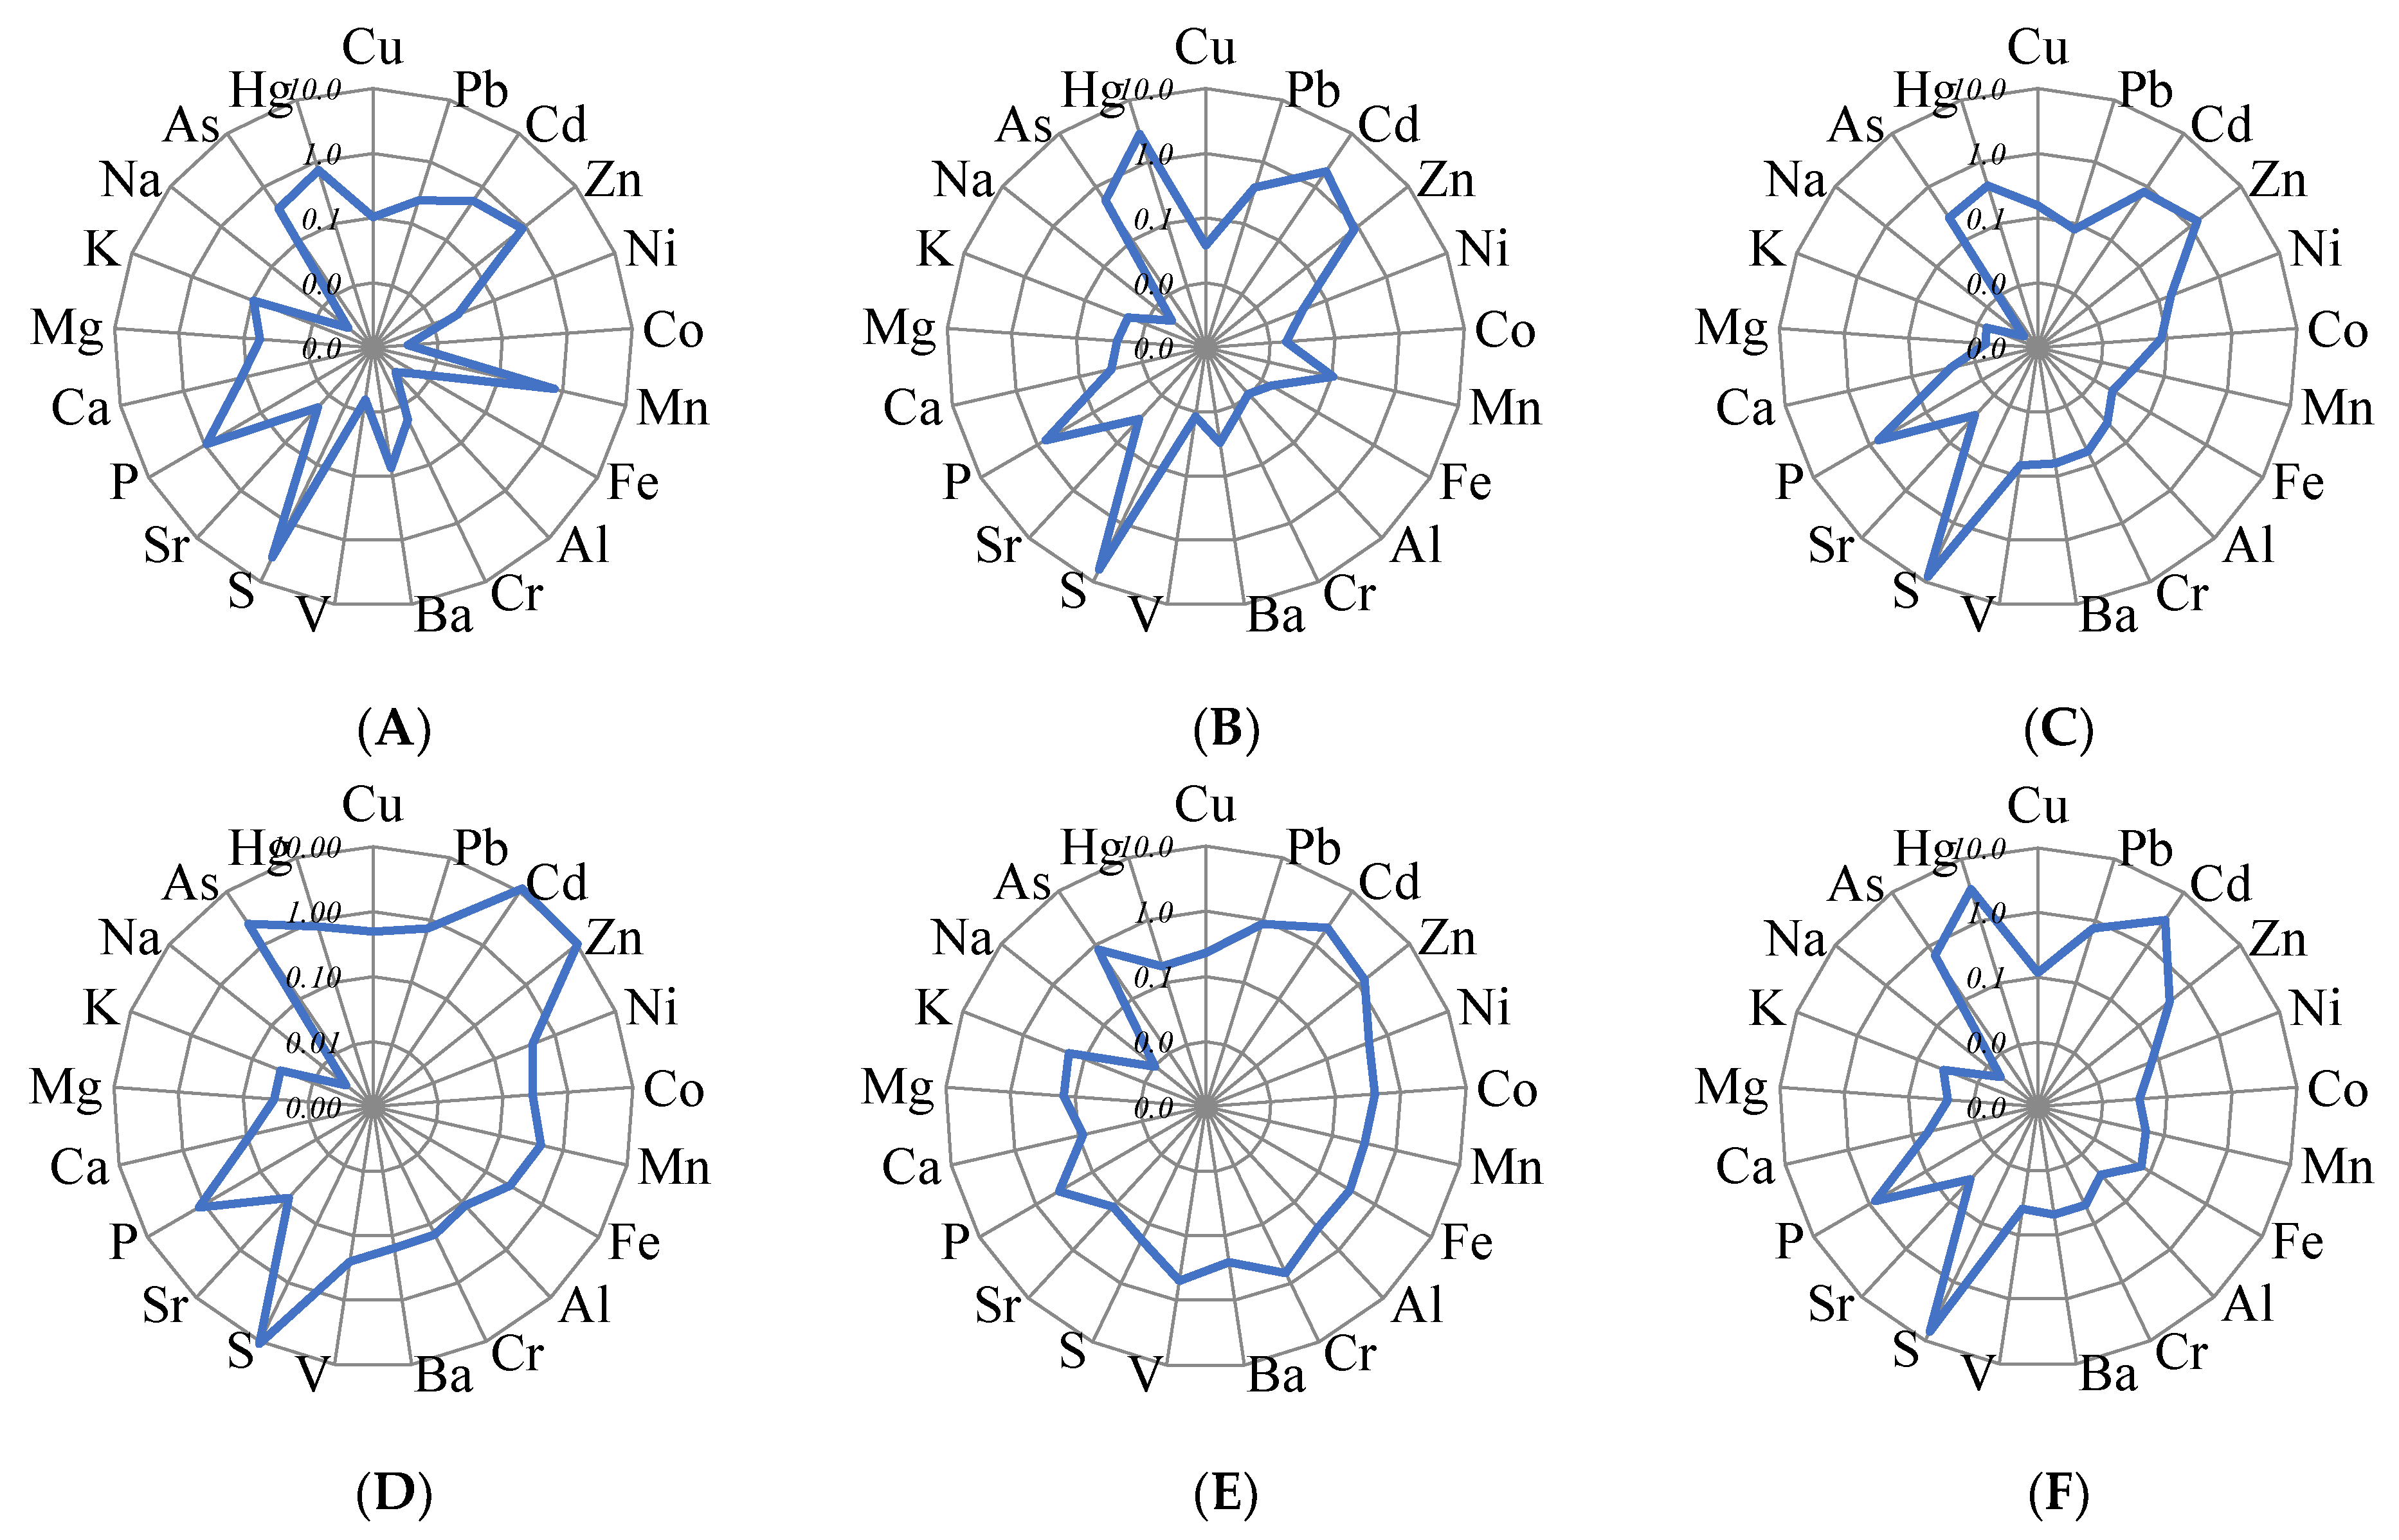
4.3.1. Element Accumulation Levels in the Peatland Profiles
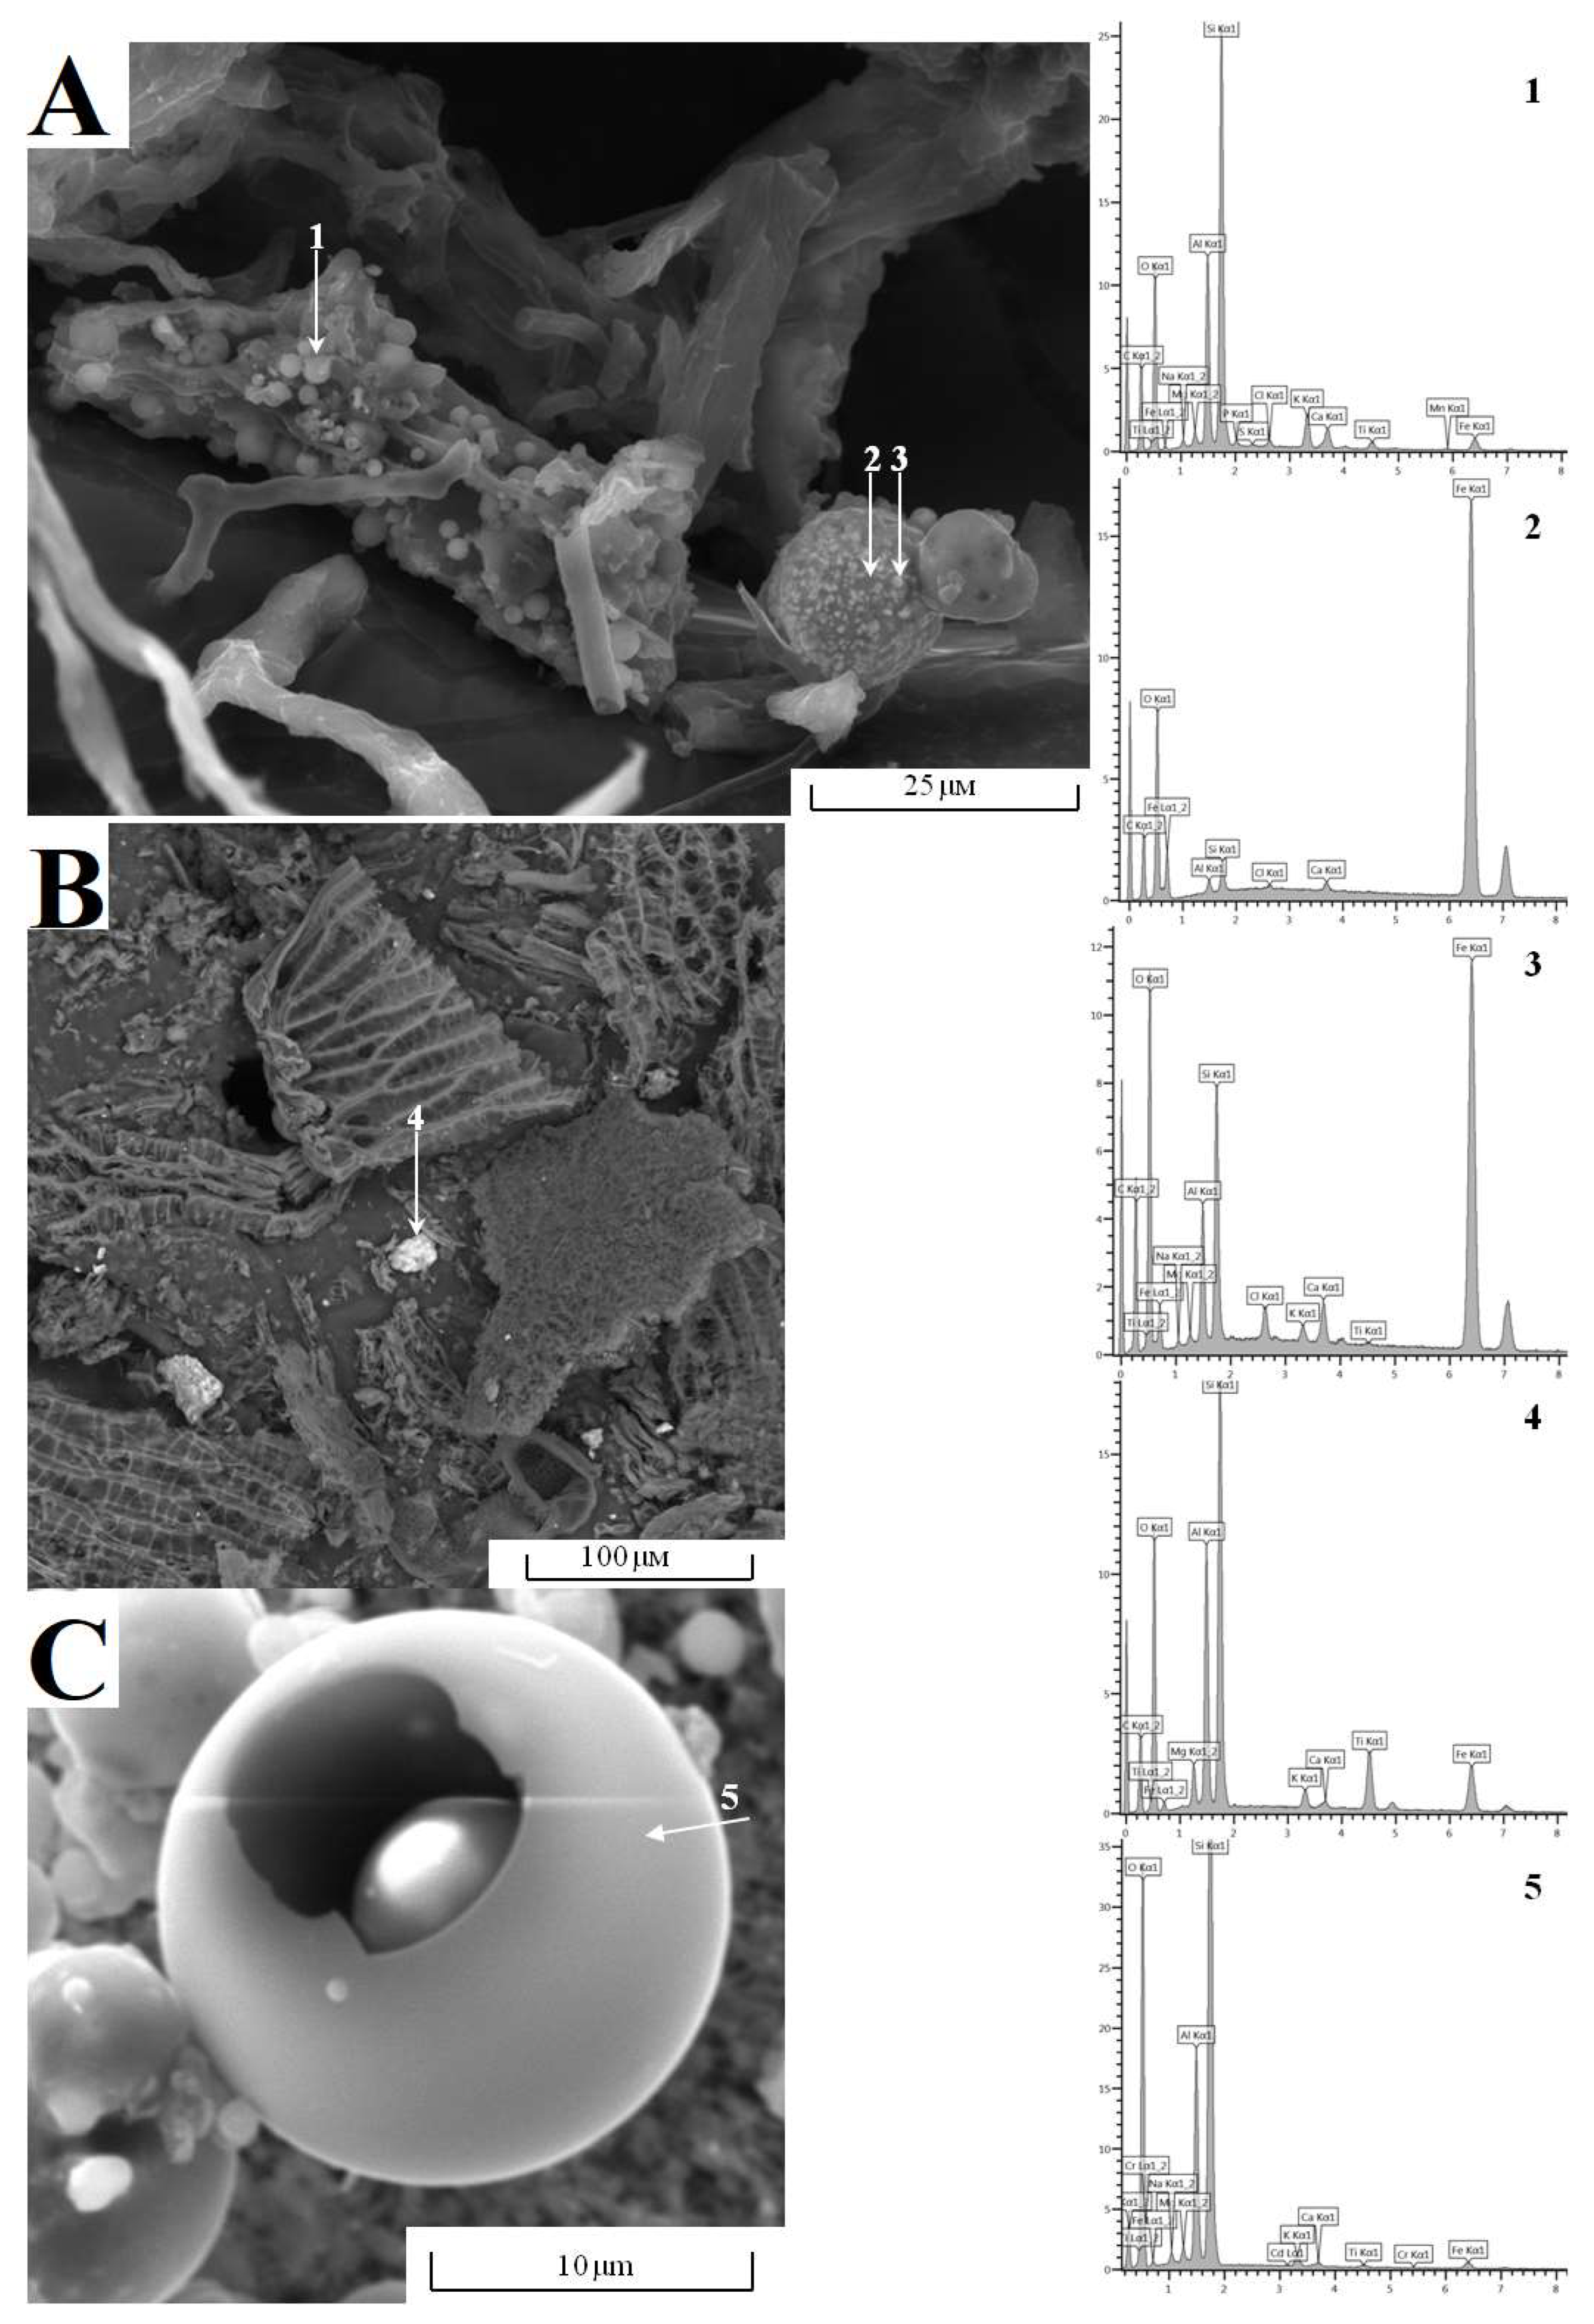
4.3.2. Assessment of the Level of Anthropogenic Pollution in the Upper Peat Layers Based on the Analysis of the Morphology, Size and Composition of Microparticles
4.3.3. Assessment of the Level of Anthropogenic Pollution Based on the Concentration of Microelements in the Upper Part of the Peat Profile
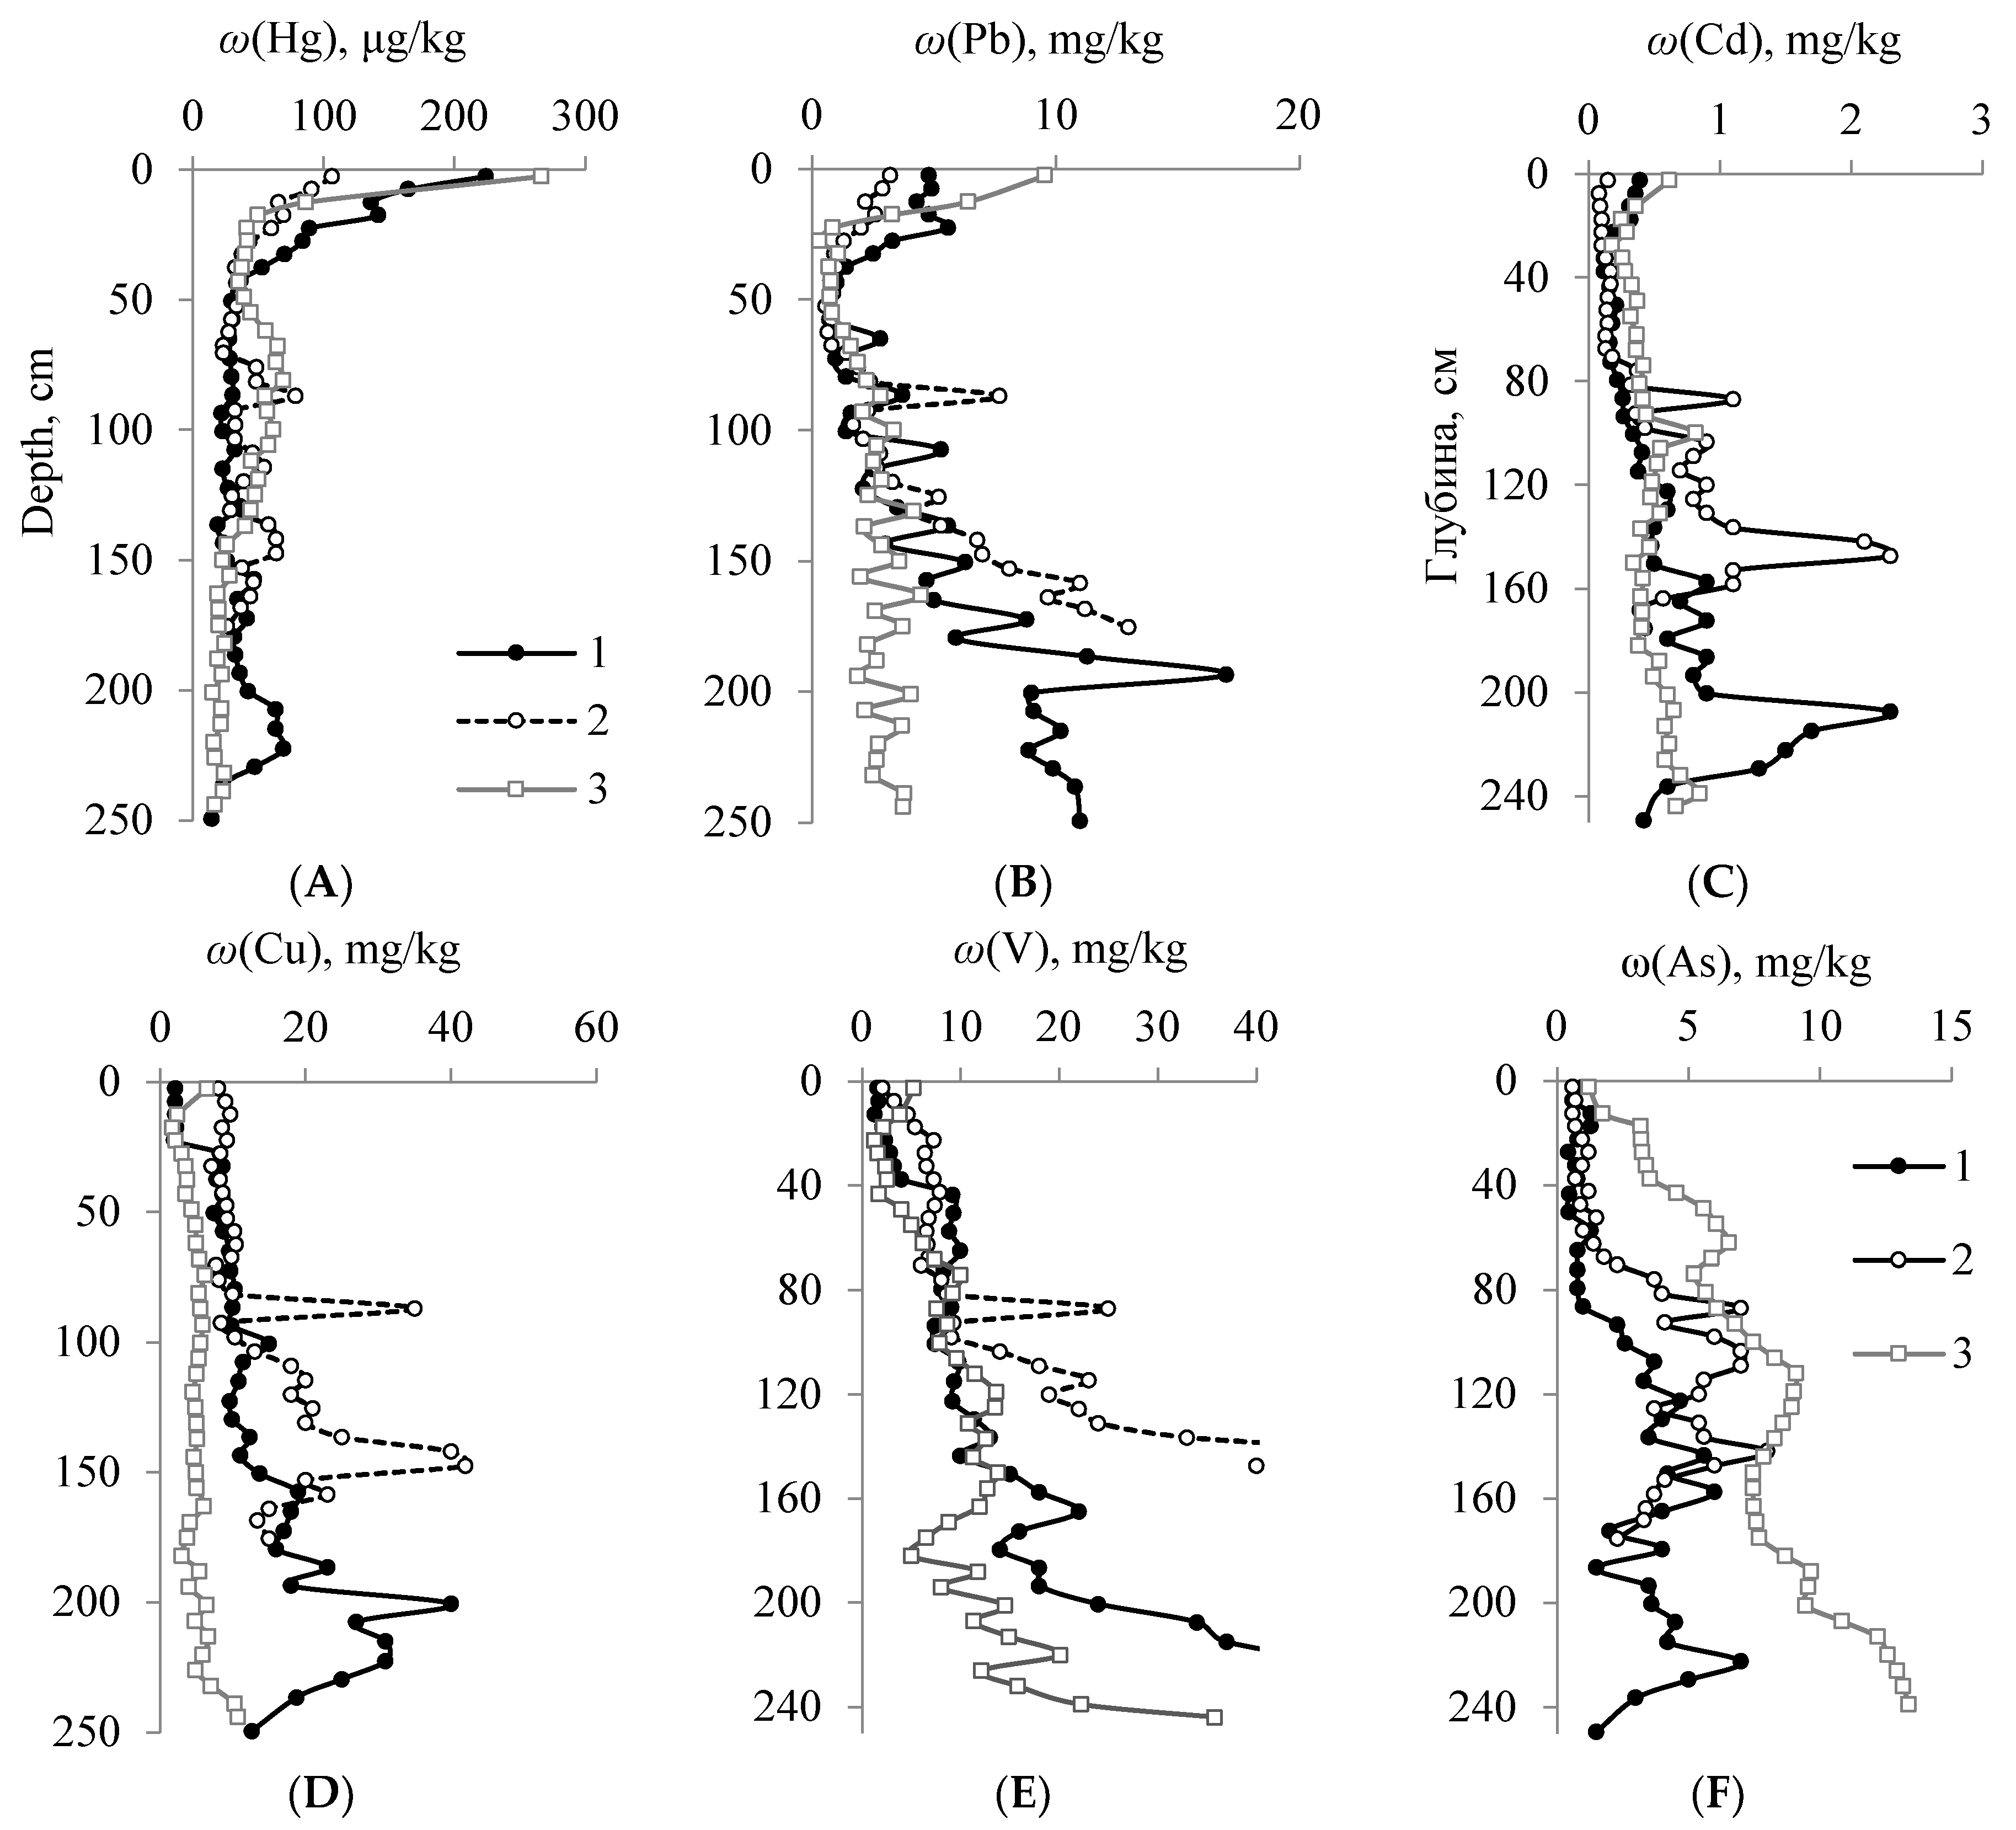
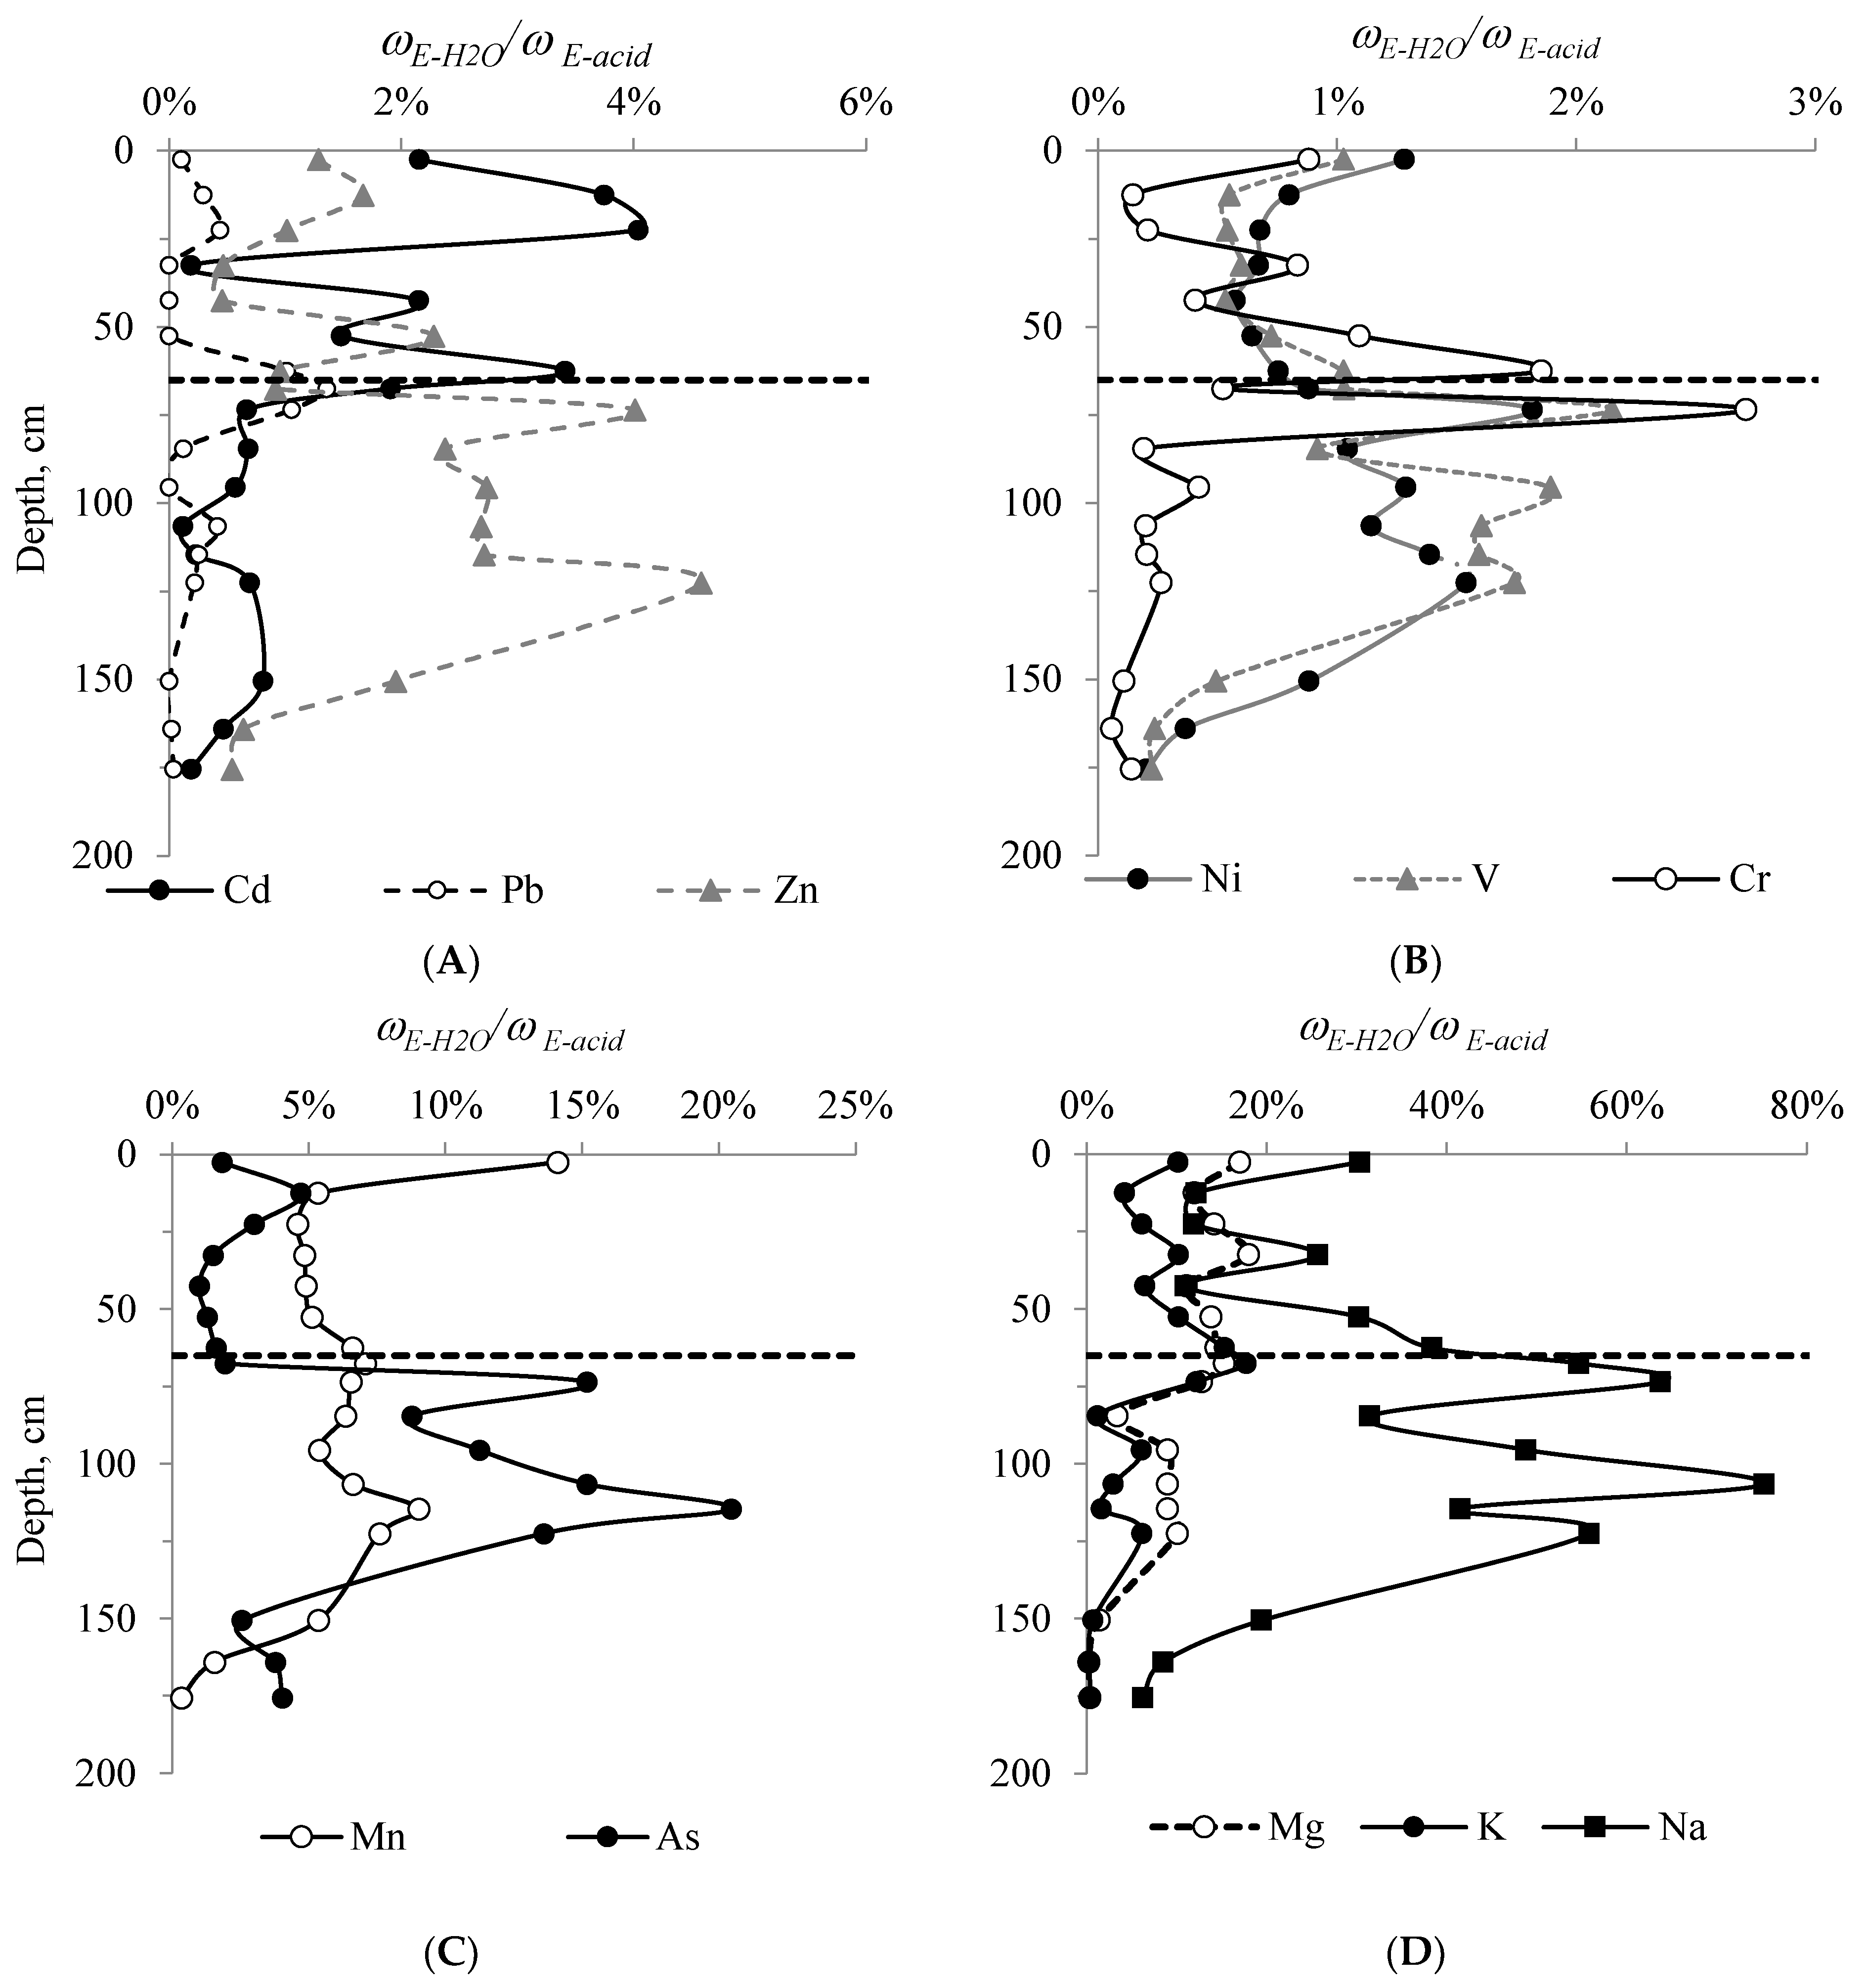
4.3.4. Analysis of the Profile Distribution of Elements
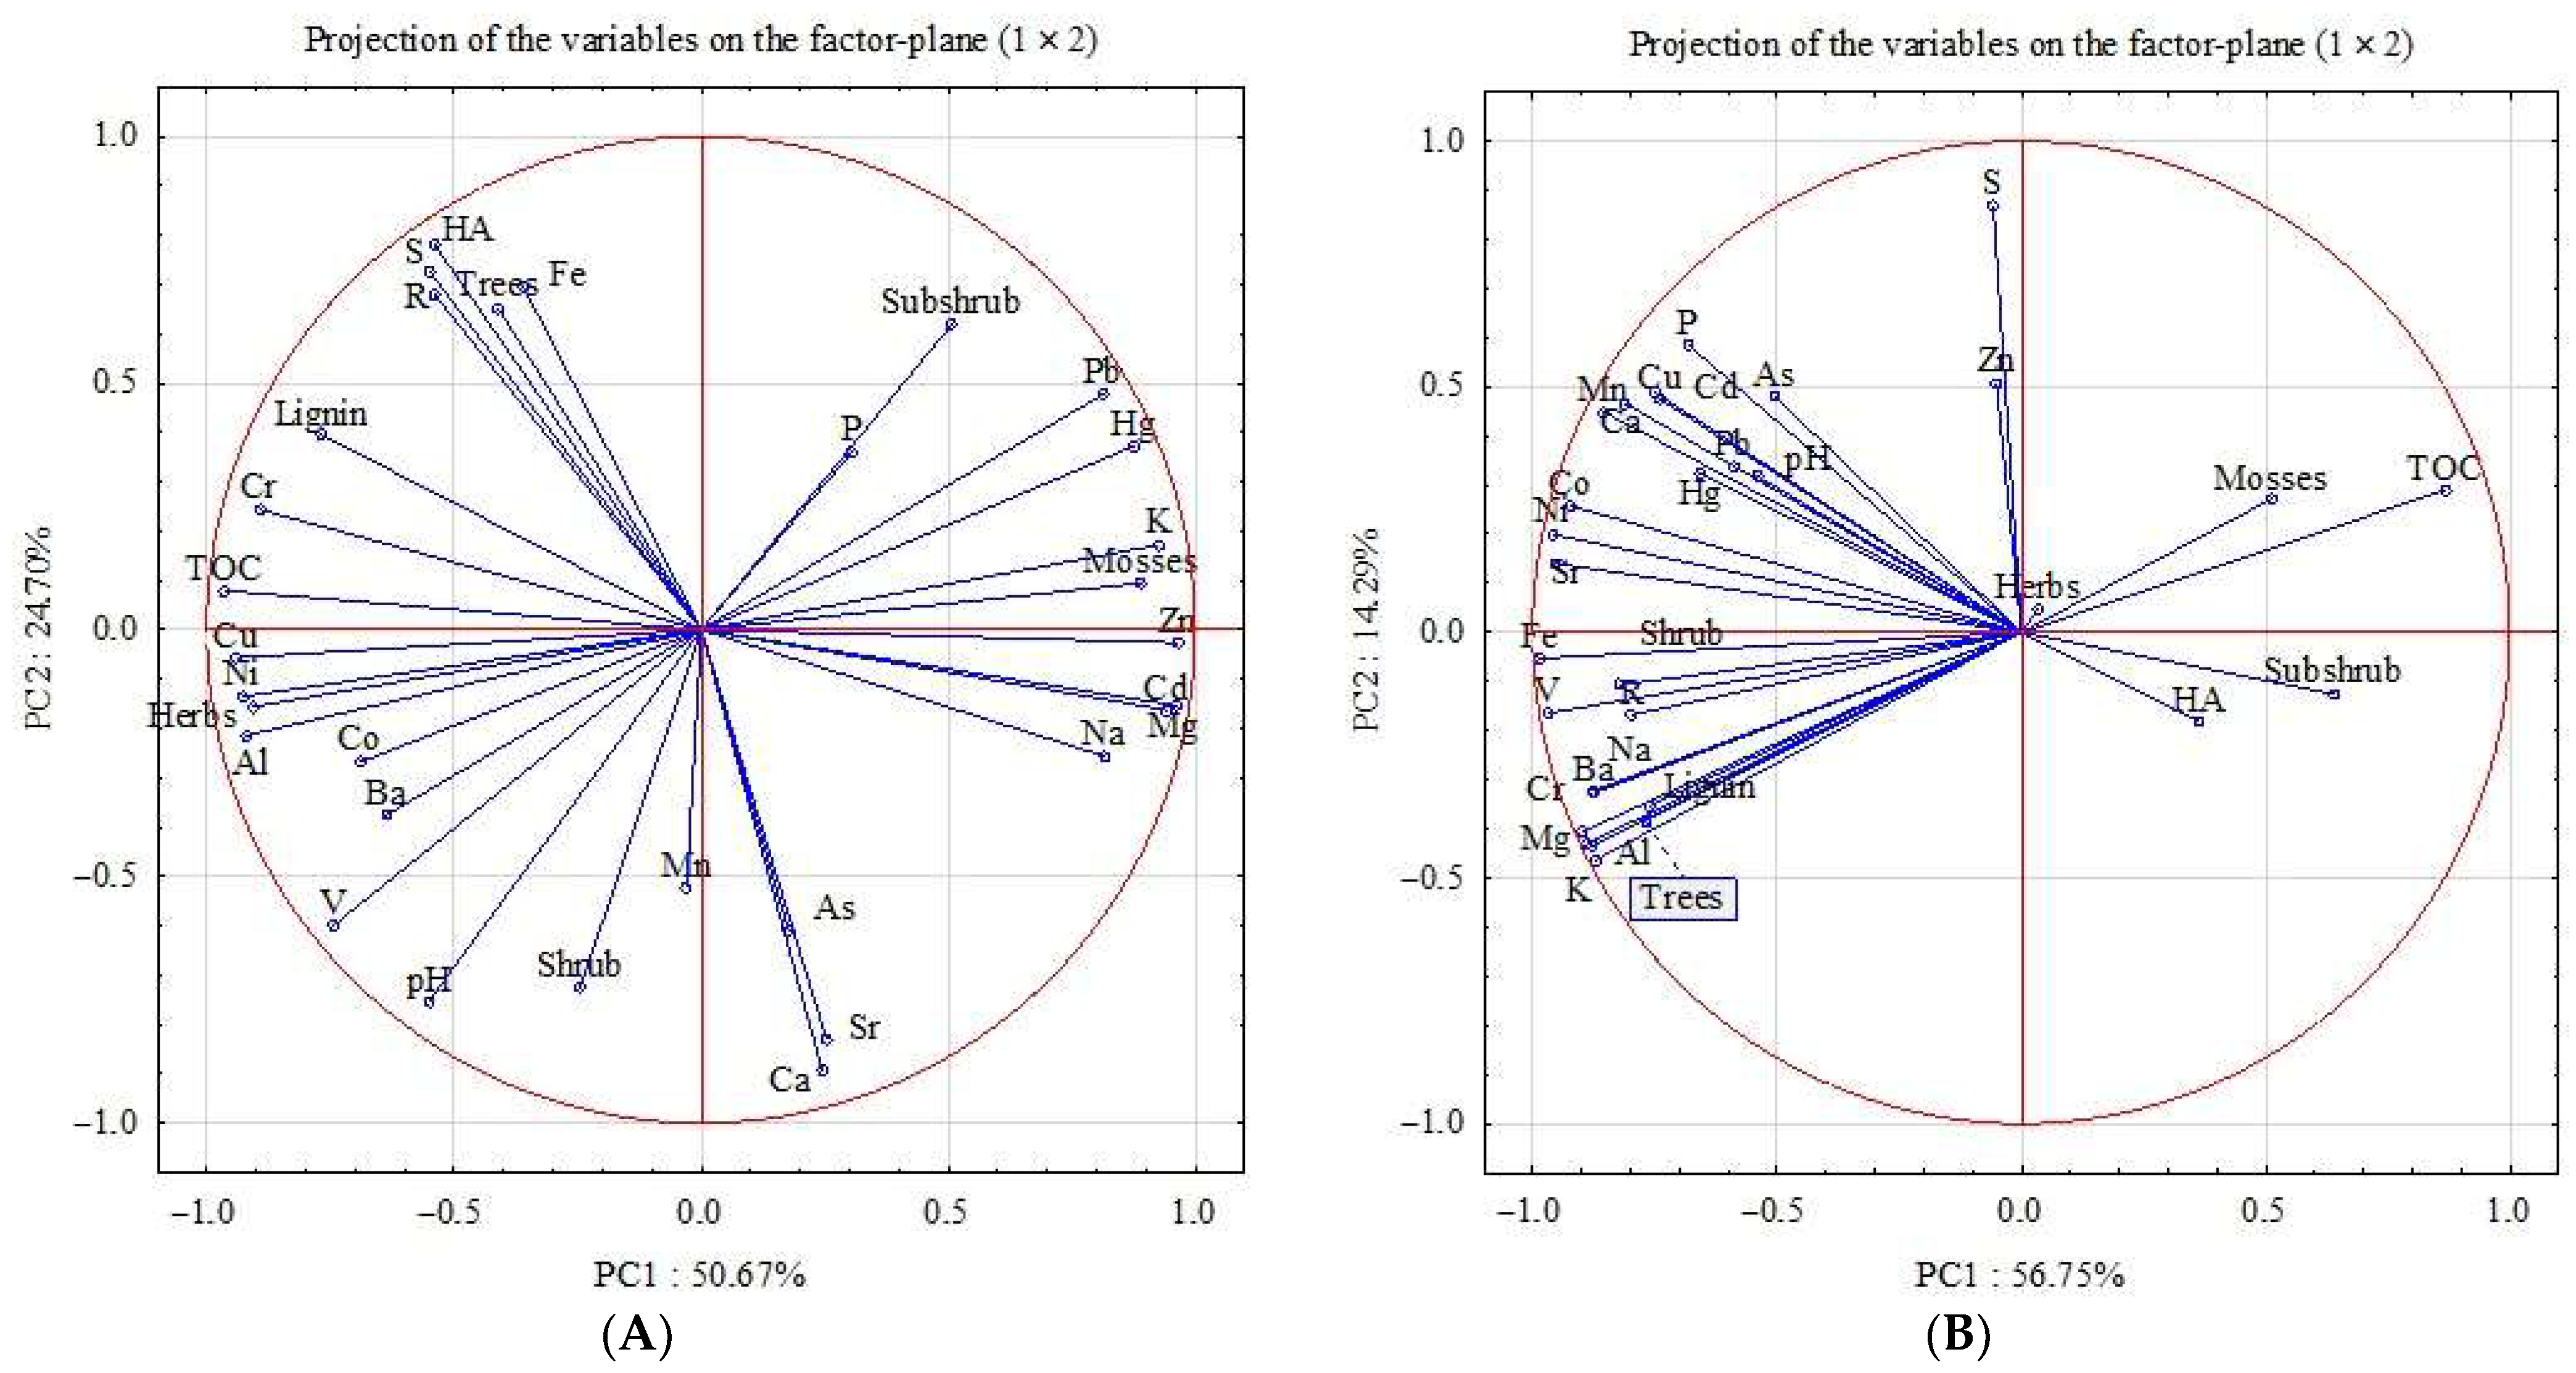
5. Principal Component Analysis
6. Conclusions
Author Contributions
Funding
Institutional Review Board Statement
Informed Consent Statement
Data Availability Statement
Conflicts of Interest
References
- Shotyk, W.; Weiss, D.; Appleby, P.G.; Cheburkin, A.K.; Frei, R.; Gloor, M.; Kramers, J.D.; Reese, S.; Van Der Knaap, W.O. History of atmospheric lead deposition since 12,370 14C yr BP from a peat bog, Jura Mountains, Switzerland. Environ. Sci. 1998, 281, 1635–1640. [Google Scholar] [CrossRef]
- Cortizas, A.M.; Gayoso, E.G.-R.; Weiss, D. Peat bog archives of atmospheric metal deposition. Sci. Total Environ. 2002, 292, 1–5. [Google Scholar] [CrossRef] [PubMed]
- Larina, N.; Moiseenko, T.; Larin, S. Geochemical differentiation in the stratigraphy of a peat bed as an indicator of its evolution in the Holocene. Geochem. Int. 2013, 51, 129–139. [Google Scholar] [CrossRef]
- Stepanova, V.A.; Pokrovsky, O.S.; Viers, J.; Mironycheva-Tokareva, N.P.; Kosykh, N.P.; Vishnyakova, E.K. Elemental composition of peat profiles in western Siberia: Effect of the micro-landscape, latitude position and permafrost coverage. Appl. Geochem. 2015, 53, 53–70. [Google Scholar] [CrossRef]
- Benoit, J.M.; Fitzgerald, W.F.; Damman, A.W.H. The biogeochemistry of an ombrotrophic bog: Evaluation of use as an archive of atmospheric mercury deposition. Environ. Res. 1998, 78, 118–133. [Google Scholar] [CrossRef]
- Bindler, R. Mired in the past—Looking to the future: Geochemistry of peat and the analysis of past environmental changes. Glob. Planet. Chang. 2006, 53, 209–221. [Google Scholar] [CrossRef]
- Cloy, J.M.; Farmer, J.G.; Graham, M.C.; MacKenzie, A.B. Retention of As and Sb and ombrotrophic peat bogs: Records of As, Sb and Pb deposition at four Scottish sites. Environ. Sci. Technol. 2009, 43, 1756–1762. [Google Scholar] [CrossRef]
- Mazhitova, G.; Malkova, G.; Chestnyk, O.; Zamolodchikov, D. Active-layer spatial and temporal variability at European Russian circumpolar-active-layer-monitoring (CALM) sites. Permafrost Periglac. Process. 2004, 15, 123–139. [Google Scholar] [CrossRef]
- Kaverin, D.A.; Pastukhov, A.V. Temperature state of soils of peat plateaus in the sporadic permafrost area (European northeast of Russia). Earth’s Cryosphere 2018, 22, 47–56. [Google Scholar] [CrossRef]
- Pastukhov, A.; Knoblauch, C.; Beer, C.; Ryzhova, I.; Kaverin, D. Development of permafrost-affected peatlands in the southern limit of the European Russian cryolithozone and their vulnerability to future warming. Sci. Total Environ. 2022, 828, 154350. [Google Scholar] [CrossRef]
- Zimov, S.A.; Schuur, E.A.G.; Chapin, F.S. Permafrost and the global carbon budget. Science 2006, 312, 1612–1613. [Google Scholar] [CrossRef] [PubMed]
- Schuur, E.A.G.; Bockheim, J.; Canadell, J.G.; Euskirchen, E.; Field, C.B.; Goryachkin, S.V.; Hagemann, S.; Kuhry, P.; Lafleur, P.M.; Lee, H.; et al. Vulnerability of permafrost carbon to climate change: Implications for the global carbon cycle. BioScience 2008, 58, 701–714. [Google Scholar] [CrossRef]
- Xiaowen, J.; Abakumov, E.; Polyakov, V. Assessments of pollution status and human health risk of heavy metals in permafrost-affected soils and lichens: A case-study in Yamal Peninsula, Russia Arctic. Hum. Ecol. Risk Assess. 2019, 25, 2142–2159. [Google Scholar] [CrossRef]
- Lupachev, A.; Danilov, P.; Lodygin, E.; Tikhonravova, Y.; Butakov, V.; Usacheva, A.; Ksenofontova, M. Approaches for the complex assessment of polychemical pollution of permafrost-affected soils and the upper layer of permafrost. Environ. Monit. Assess. 2022, 194, 594. [Google Scholar] [CrossRef]
- Wang, W.; Abakumov, E.; Wu, X.; Ji, X.; Mu, C.; Zhu, X.; Li, G. Accumulation pattern and risk assessment of metal elements in permafrost-affected soils on the Qinghai-Tibet Plateau. Catena 2023, 220, 106665. [Google Scholar] [CrossRef]
- Frey, K.E.; Siegel, D.I.; Smith, L.C. Geochemistry of west Siberian streams and their potential response to permafrost degradation. Water Resour. Res. 2007, 43, W03406. [Google Scholar] [CrossRef]
- Lawrence, D.M.; Slater, A.G. A projection of severe near-surface permafrost degradation during the 21st century. Geophys. Res. Lett. 2005, 32, L24401. [Google Scholar] [CrossRef]
- Outridge, P.M.; Sanei, H. Does organic matter degradation affect the reconstruction of pre-industrial atmospheric mercury deposition rates from peat cores?—A test of the hypothesis using a permafrost peat deposit in northern Canada. Int. J. Coal Geol. 2010, 83, 73–81. [Google Scholar] [CrossRef]
- Smieja-Król, B.; Fiałkiewicz-Kozieł, B.; Sikorski, J.; Palowski, B. Heavy metal behaviour in peat—A mineralogical perspective. Sci. Total Environ. 2010, 408, 5924–5931. [Google Scholar] [CrossRef]
- Dymov, A.A.; Kaverin, D.A.; Gabov, D.N. Properties of soils and soil like bodies in the Vorkuta area. Eurasian Soil Sci. 2013, 46, 217–224. [Google Scholar] [CrossRef]
- Vasilevich, M.I.; Vasilevich, R.S.; Shamrikova, E.V. Input of pollutants with winter precipitation onto Vorkuta agglomeration territory. Water Res. 2018, 45, 338–347. [Google Scholar] [CrossRef]
- Walker, T.R.; Young, S.D.; Crittenden, P.D.; Zhang, P. Anthropogenic metal enrichment of snow and soil in north-eastern European Russia. Environ. Pollut. 2003, 121, 11–21. [Google Scholar] [CrossRef] [PubMed]
- Bobrov, V.A.; Bogush, A.A.; Leonov, G.A.; Krasnobaev, V.A.; Anoshin, G.N. Anomalous concentrations of zinc and copper in highmoor peat bog, southeast coast of Lake Baikal. Dokl. Earth Sci. 2011, 439, 1152–1156. [Google Scholar] [CrossRef]
- Suska-Malawska, M.; Ekonomiuk, S.; Wiłkomirski, B. Chemical characteristics of some peatlands in southern Poland. Mires Peat 2006, 1, 2. [Google Scholar]
- Dobrovolsky, G.V.; Taskaev, A.I.; Zaboeva, I.V. (Eds.) Soil Atlas of the Komi Republic, 1st ed.; LC “Komi Republician Publishing House”: Syktyvkar, Russia, 2010; 356p. (In Russian) [Google Scholar]
- FAO. World reference base for soil resources 2014. In International Soil Classification System for Naming Soils and Creating Legends for Soil Maps; FAO: Rome, Italy, 2015; 203p. [Google Scholar]
- Swift, R.S. Organic matter characterization. In Methods of Soil Analysis: Part 3 Chemical Methods, 5.3; Soil Science Society of America: Madison, WI, USA, 1996; pp. 1018–1020. [Google Scholar] [CrossRef]
- Brekken, A.; Steinnes, E. Seasonal concentrations of cadmium and zinc in native pasture plants: Consequences for grazing animals. Sci. Total Environ. 2004, 326, 181–195. [Google Scholar] [CrossRef]
- Szajdak, L.W.; Jezierski, A.; Wegner, K.; Meysner, T.; Szczepański, M. Influence of drainage on peat organic matter: Implications for development, stability and transformation. Molecules 2020, 25, 2587. [Google Scholar] [CrossRef]
- Gabov, D.N.; Yakovleva, Y.V.; Vasilevich, R.S.; Kuznetsov, O.L.; Beznosikov, V.A. Polycyclic aromatic hydrocarbons in peat mounds of the permafrost zone. Eurasian Soil Sci. 2019, 52, 1038–1050. [Google Scholar] [CrossRef]
- Routh, J.; Hugelius, G.; Kuhry, P.; Filley, T.; Tillman, P.K.; Becher, M.; Crill, P. Multi-proxy study of soil organic matter dynamics in permafrost peat deposits reveal vulnerability to climate change in the European Russian Arctic. Chem. Geol. 2014, 368, 104–117. [Google Scholar] [CrossRef]
- Taylor, S.R.; McLennan, S.M. The Continental Crust: Its Composition and Evolution; Blackwell Scientific Publications: Oxford, UK, 1985; 330p. [Google Scholar]
- Steinberg, S.M.; Hodge, V.F. Measurement of lead complexation by humic acids and humic acid analogues using competitive ligand exchange. Heliyon 2022, 8, e12437. [Google Scholar] [CrossRef]
- Vasilevich, R.S.; Beznosikov, V.A.; Lodygin, E.D.; Kondratenok, B.M. Complexation of mercury (II) ions with humic acids in tundra soils. Eurasian Soil Sci. 2014, 47, 162–172. [Google Scholar] [CrossRef]
- Lodygin, E.D.; Alekseev, I.I.; Vasilevich, R.S.; Abakumov, E.V. Complexation of lead and cadmium ions with humic acids from arctic peat soils. Environ. Res. 2020, 191, 110058. [Google Scholar] [CrossRef] [PubMed]
- Kutsenogii, K.P.; Kutsenogii, P.K. Aerosols of Siberia. Results of seven-year studies. Sibirsk. Ekol. Zh. 2000, 1, 11–20. [Google Scholar]
- Vu, D.-H.; Bui, H.-B.; Kalantar, B.; Bui, X.-N.; Nguyen, D.-A.; Le, Q.-T.; Do, N.-H.; Nguyen, H. Composition and morphology characteristics of magnetic fractions of coal fly ash wastes processed in high-temperature exposure in thermal power plants. Appl. Sci. 2019, 9, 1964. [Google Scholar] [CrossRef]
- Kotova, O.B.; Shushkov, D.A. A process of zeolites production from fly ash. Obogashchenie Rud 2015, 2015, 60–63. [Google Scholar] [CrossRef]
- Chen, R.; Hu, B.; Liu, Y.; Hu, J. Beyond PM2.5: The role of ultrafine particles on adverse health effects of air pollution. BBA Subj. 2016, 1860, 2844–2855. [Google Scholar] [CrossRef] [PubMed]
- Ohlwein, S.; Kappeler, R.; Joss, M.K.; Ku, N.; Hoffmann, B. Health effects of ultrafine particles: A systematic literature review update of epidemiological evidence. Int. J. Public Health 2019, 64, 547–559. [Google Scholar] [CrossRef]
- Ketris, M.P.; Yudovich, Y.E. Estimations of clarkes for carbonaceous biolithes: World averages for trace element contents in black shales and coals. Int. J. Coal Geol. 2009, 78, 135–148. [Google Scholar] [CrossRef]
- Ismagilov, Z.R.; Shikina, N.V.; Zhuravleva, N.V.; Potokina, R.R.; Rudina, N.A.; Ushakov, V.A.; Teryaeva, T.N. Aluminosilicate microspheres from the fly ash of Kuzbass coal–burning power stations. Solid Fuel Chem. 2015, 49, 245–253. [Google Scholar] [CrossRef]
- Vasilevich, M.I.; Vasilevich, R.S.; Mikhailov, V.I.; Krivoshapkin, P.V. Assessment of properties of atmospheric suspensions in snow of background territories of the taiga zone of the European northeast of Russia. Optika Atmosfery Okeana 2017, 2, 184–190. [Google Scholar] [CrossRef]
- Arctic Group of the Arctic Council. AMAP Assessment: Heavy Metals in the Arctic; Arctic Monitoring and Assessment Programme (AMAP), Arctic Group of the Arctic Council: Oslo, Norway, 2002; 265p. [Google Scholar]
- Arctic Group of the Arctic Council. AMAP Assessment: Mercury in the Arctic; Arctic Monitoring and Assessment Programme (AMAP), Arctic Group of the Arctic Council: Oslo, Norway, 2011; 193p. [Google Scholar]
- Dietz, R.; Sonne, C.; Basu, N.; Braune, B.; O’Hara, T.; Letcher, R.J.; Scheuhammer, T.; Andersen, M.; Andreasen, C.; Andriashek, D.; et al. What are the toxicological effects of mercury in Arctic biota? Sci. Total Environ. 2013, 443, 775–790. [Google Scholar] [CrossRef]
- Kerndorff, H.; Schnitzer, M. Sorption of metals on humic acid. Geochim. Cosmochim. Acta 1980, 44, 1701–1708. [Google Scholar] [CrossRef]
- Poissant, L.; Zhang, H.H.; Canário, J.; Constant, P. Critical review of mercury fates and contamination in the arctic tundra ecosystem. Sci. Total Environ. 2008, 400, 173–211. [Google Scholar] [CrossRef] [PubMed]
- Vasilevich, R.S.; Beznosikov, V.A.; Lodygin, E.D. Molecular structure of humus substances in permafrost peat mounds in forest-tundra. Eurasian Soil Sci. 2019, 52, 283–295. [Google Scholar] [CrossRef]
- Shamrikova, E.V.; Kaverin, D.A.; Pastukhov, A.V.; Lapteva, E.M.; Kubik, O.S.; Punegov, V.V. Water-soluble organic acids in cryomorphic peat soils of the southeastern Bol’shezemel’skaya tundra. Eurasian Soil Sci. 2015, 48, 250–256. [Google Scholar] [CrossRef]
- Tipping, E.; Lofts, S.; Hooper, H.; Frey, B.; Spurgeon, D.; Svendsen, C. Critical Limits for Hg(II) in soils, derived from chronic toxicity data. Environ. Pollut. 2010, 158, 2465–2471. [Google Scholar] [CrossRef]
- Krzebietke, S.; Daszykowski, M.; Czarnik-Matusewicz, H.; Stanimirova, I.; Pieszczek, L.; Sienkiewicz, S.; Wierzbowska, J. Monitoring the concentrations of Cd, Cu, Pb, Ni, Cr, Zn, Mn and Fe in cultivated Haplic Luvisol soils using near-infrared reflectance spectroscopy and chemometrics. Talanta 2022, 251, 123749. [Google Scholar] [CrossRef]
- Veretennikova, E.E.; Kuryinaa, I.V.; Dyukareva, E.A.; Golovatskaya, E.A.; Smirnov, S.V. Geochemical features of peat deposits at oligotrophic bogs in the southern taiga subzone of West Siberia. Geochem. Int. 2021, 59, 618–631. [Google Scholar] [CrossRef]
- Ladonin, D.V.; Mikhaylova, A.P. Heavy metals and arsenic in soils and street dust of the southeastern administrative district of Moscow: Long-term data. Eurasian Soil Sci. 2020, 53, 1635–1644. [Google Scholar] [CrossRef]
- Alekseenko, V.A.; Maximovich, N.G.; Alekseenko, A.V. Geochemical barriers for soil protection in mining areas. In Assessment, Restoration and Reclamation of Mining Influenced Soils; Academic Press: Cambridge, MA, USA, 2017; pp. 255–274. [Google Scholar] [CrossRef]
- Savichev, O.G. Geochemical indicators of swamp waters in the taiga zone of West Siberia. Izv. Ross. Akad. Nauk. Ser. Geograf. 2015, 4, 47–57. [Google Scholar] [CrossRef]
- Lima, J.Z.; Silva, E.F.; Patinha, C.; Rodrigues, V.G.S. Sorption and post-sorption performances of Cd, Pb and Zn onto peat, compost and biochar. J. Environ. Manag. 2022, 321, 115968. [Google Scholar] [CrossRef]
- Taeprayoon, P.; Printarakul, N.; Somtrakoon, K.; Chunwichit, S.; Yooma, K.; Wiangdao, S.; Avakul, P.; Meeinkuirt, W. Potentially toxic element accumulation of bryophyte taxa in contaminated soils at Tak Province, Thailand. Ecol. Indic. 2023, 147, 109971. [Google Scholar] [CrossRef]
- Xiao, J.; Han, X.; Sun, S.; Wang, L.; Rinklebe, J. Heavy metals in different moss species in alpine ecosystems of Mountain Gongga, China: Geochemical characteristics and controlling factors. Environ. Pollut. 2021, 272, 115991. [Google Scholar] [CrossRef] [PubMed]
- Agostini, A.D.; Cogoni, A.; Cortis, P.; Vacca, A.; Becerril, J.M.; Hernández, A.; Esteban, R. Heavy metal tolerance strategies in metallicolous and non-metallicolous populations of mosses: Insights of γ+β-tocopherol regulatory role. Environ. Exp. Bot. 2022, 194, 104738. [Google Scholar] [CrossRef]
- Chakrabortty, S.; Paratkar, G.T. Biomonitoring of trace element air pollution using mosses. Aerosol Air Qual. Res. 2006, 6, 247–258. [Google Scholar] [CrossRef]
- Macedo-Miranda, G.; Avila-Pérez, P.; Gil-Vargas, P.; Zarazúa, G.; Sánchez-Meza, J.C.; Zepeda-Gómez, C.; Tejeda, S. Accumulation of heavy metals in mosses: A biomonitoring study. SpringerPlus 2016, 5, 715. [Google Scholar] [CrossRef] [PubMed]
- Schnyder, E.; Štrok, M.; Kosonen, Z.; Skudnik, M.; Mazej, D.; Jeran, Z.; Thöni, L. Lead concentrations and stable lead isotope ratios in moss in Slovenia and Switzerland. Ecol. Indic. 2018, 95, 250–259. [Google Scholar] [CrossRef]
- Reddy, K.R.; Delaune, R.D. Biogeochemistry of Wetlands: Science and Applications, 1st ed.; CRC Press: Boca Raton, FL, USA, 2008; 800p. [Google Scholar] [CrossRef]


| Depth, cm | Peat Layer | Peat Type | R,% | Chronology | Dominant Botanical Species | |
|---|---|---|---|---|---|---|
| 14C-Age (Year BP) | Calibrated Age (Cal Year BP) | |||||
| Plot 1. Fibric Folic Cryic Histosol | ||||||
| 0–10 | H1 | Raised | 20 | n.d. | 27 | Sphagnum, Ericales, Pleurozium |
| 10–20 | H2 | Raised | 15 | n.d. | n.d. | Sphagnum, Polytrichum, Ericales |
| 20–30 | H3 | Raised | 20–25 | 2080 ± 60 | 2054 | Sphagnum |
| 30–40 | H4 | Transitional | 25 | n.d. | n.d. | Scheuchzeria, Sphagnum |
| 40–54 | H5 | Transitional, frozen | 25–30 | n.d. | n.d. | Scheuchzeria, Carex, Eriophorum |
| 54–69 | H6 | Transitional, frozen | 30 | n.d. | n.d. | Scheuchzeria, Carex, Eriophorum |
| 69–83 | H7 | Transitional, frozen | 25–30 | n.d. | n.d. | Sphagnum, Scheuchzeria, Carex, Eriophorum, Equisetum |
| 83–97 | H8 | Transitional, frozen | 25–30 | n.d. | n.d. | Sphagnum, Scheuchzeria, Carex, Eriophorum, Menyanthes |
| 97–111 | H9 | Transitional, frozen | 25–30 | n.d. | n.d. | Sphagnum, Scheuchzeria, Carex, Eriophorum, Menyanthes |
| 111–126 | H10 | Fen, frozen | 25–30 | n.d. | n.d. | Sphagnum, Warnstorfia, Scheuchzeria, Carex, Eriophorum, Equisetum |
| 126–140 | H11 | Fen, frozen | 35 | n.d. | n.d. | Sphagnum, Warnstorfia, Scheuchzeria, Carex, Eriophorum, Equisetum |
| 140–154 | H12 | Fen, frozen | 30–35 | n.d. | n.d. | Sphagnum, Carex, Eriophorum, Equisetum, Menyanthes |
| 154–169 | H13 | Fen, frozen | 30–35 | n.d. | n.d. | Sphagnum, Carex, Equisetum, Menyanthes |
| 169–183 | H14 | Fen, frozen | 30–35 | n.d. | n.d. | Sphagnum, Carex, Equisetum, Menyanthes |
| 183–197 | H15 | Fen, frozen | 30–35 | n.d. | n.d. | Sphagnum, Carex, Equisetum, Menyanthes |
| 197–211 | H16 | Fen, frozen | 30–35 | n.d. | n.d. | Carex, Eriophorum, Equisetum, Menyanthes |
| 211–226 | H17 | Fen, frozen | 30–35 | n.d. | n.d. | Carex, Equisetum, Menyanthes |
| Plot 2. Hemic Folic Cryic Histosol (Turbic) | ||||||
| 0–10 | H1 | Raised | >50 | 2680 ± 70 | 2804 | Eriophorum, Scheuchzeria, Betula pubescens, Ericales |
| 10–20 | H2 | Raised | 30–35 | 2570 ± 60 | 2635 | Scheuchzeria, Eriophorum, Betula pub., Ericales |
| 20–30 | H3 | Transitional | 30 | n.d. | n.d. | Scheuchzeria, Carex |
| 30–40 | H4 | Transitional | 30 | 4640 ± 70 | 5388 | Scheuchzeria, Carex, Eriophorum |
| 40–50 | H5 | Transitional | 25 | n.d. | n.d. | Scheuchzeria, Eriophorum |
| 50–60 | H6 | Transitional | 25 | n.d. | n.d. | Scheuchzeria, Eriophorum, Carex |
| 60–70 | H7 | Transitional | 25 | 4920 ± 70 | 5661 | Scheuchzeria, Carex, Eriophorum |
| 70–79 | H8 | Transitional, frozen | 25 | n.d. | n.d. | Scheuchzeria, Carex, Eriophorum |
| 79–90 | H9 | Transitional, frozen | 25 | 5980 ± 80 | 6823 | Scheuchzeria, Carex |
| 90–101 | H10 | Transitional, frozen | 25–30 | n.d. | n.d. | Scheuchzeria, Carex |
| 101–112 | H11 | Fen, frozen | 30–35 | 6510 ± 90 | 7421 | Menyanthes, Equisetum, Carex |
| 112–123 | H12 | Fen, frozen | 30 | n.d. | n.d. | Menyanthes, Equisetum, Carex |
| 123–134 | H13 | Fen, frozen | 25–30 | n.d. | n.d. | Sphagnum, Equisetum, Carex |
| 134–145 | H14 | Fen, frozen | 30–35 | 7010 ± 90 | 7839 | Carex cespitosa, Equisetum |
| 145–156 | H15 | Fen, frozen | 35–40 | n.d. | n.d. | Carex cespitosa, Betula pub., Equisetum |
| 156–167 | H16 | Fen, frozen | 45–50 | 8060 ± 180 | 8953 | Carex ces., Equisetum, Betula pub. |
| Plot 3. Fibric Folic Cryic Histosol | ||||||
| 0–10 | H1 | Raised | 20–25 | n.d. | n.d. | Dicranum, Ledum, Betula nana, Ericales |
| 10–20 | H2 | Transitional | 30 | n.d. | n.d. | Betula sp., Ericales, Ledum |
| 20–30 | H3 | Fen | 30 | n.d. | n.d. | Carex, Betula sp., Menyanthes |
| 30–40 | H4 | Fen | 25–30 | n.d. | n.d. | Carex, Betula sp., Menyanthes |
| 40–52 | H5 | Fen, frozen | 30 | n.d. | n.d. | Carex, Betula sp., Menyanthes |
| 52–65 | H6 | Fen, frozen | 25 | n.d. | n.d. | Carex, Menyanthes, Betula sp. |
| 65–77 | H7 | Fen, frozen | 35 | n.d. | n.d. | Carex, Betula sp., Salix |
| 77–90 | H8 | Fen, frozen | 35 | n.d. | n.d. | Carex, Betula sp., Salix |
| 90–103 | H9 | Fen, frozen | 35–40 | n.d. | n.d. | Carex, Betula sp., Salix |
| 103–115 | H10 | Fen, frozen | 35–40 | n.d. | n.d. | Carex, Equisetum, Menyanthes |
| 115–128 | H11 | Fen, frozen | 35–40 | n.d. | n.d. | Carex, Equisetum, Menyanthes |
| 128–141 | H12 | Fen, frozen | 35–40 | n.d. | n.d. | Carex, Equisetum |
| 141–153 | H13 | Fen, frozen | 35–40 | n.d. | n.d. | Carex, Equisetum |
| 153–166 | H14 | Fen, frozen | 35–40 | n.d. | n.d. | Carex, Betula sp., Salix, Equisetum |
| 166–179 | H15 | Fen, frozen | 35–40 | n.d. | n.d. | Carex, Equisetum, Calliergon |
| 179–191 | H16 | Fen, frozen | 30–35 | n.d. | n.d. | Carex, Equisetum, Calliergon |
| 191–204 | H17 | Fen, frozen | 30–35 | n.d. | n.d. | Carex, Calliergon, Equisetum |
| 204–217 | H18 | Fen, frozen | 25–30 | n.d. | n.d. | Carex, Menyanthes, Equisetum |
Disclaimer/Publisher’s Note: The statements, opinions and data contained in all publications are solely those of the individual author(s) and contributor(s) and not of MDPI and/or the editor(s). MDPI and/or the editor(s) disclaim responsibility for any injury to people or property resulting from any ideas, methods, instructions or products referred to in the content. |
© 2023 by the authors. Licensee MDPI, Basel, Switzerland. This article is an open access article distributed under the terms and conditions of the Creative Commons Attribution (CC BY) license (https://creativecommons.org/licenses/by/4.0/).
Share and Cite
Vasilevich, R.; Vasilevich, M.; Lodygin, E.; Abakumov, E. Geochemical Characteristics of the Vertical Distribution of Heavy Metals in the Hummocky Peatlands of the Cryolithozone. Int. J. Environ. Res. Public Health 2023, 20, 3847. https://doi.org/10.3390/ijerph20053847
Vasilevich R, Vasilevich M, Lodygin E, Abakumov E. Geochemical Characteristics of the Vertical Distribution of Heavy Metals in the Hummocky Peatlands of the Cryolithozone. International Journal of Environmental Research and Public Health. 2023; 20(5):3847. https://doi.org/10.3390/ijerph20053847
Chicago/Turabian StyleVasilevich, Roman, Mariya Vasilevich, Evgeny Lodygin, and Evgeny Abakumov. 2023. "Geochemical Characteristics of the Vertical Distribution of Heavy Metals in the Hummocky Peatlands of the Cryolithozone" International Journal of Environmental Research and Public Health 20, no. 5: 3847. https://doi.org/10.3390/ijerph20053847
APA StyleVasilevich, R., Vasilevich, M., Lodygin, E., & Abakumov, E. (2023). Geochemical Characteristics of the Vertical Distribution of Heavy Metals in the Hummocky Peatlands of the Cryolithozone. International Journal of Environmental Research and Public Health, 20(5), 3847. https://doi.org/10.3390/ijerph20053847