
The Use of Wearable Technologies in the Assessment of Physical Activity in Preschool- and School-Age Youth: Systematic Review


Abstract
1. Introduction
2. Materials and Methods
2.1. Search Strategy
2.2. Eligibility Criteria
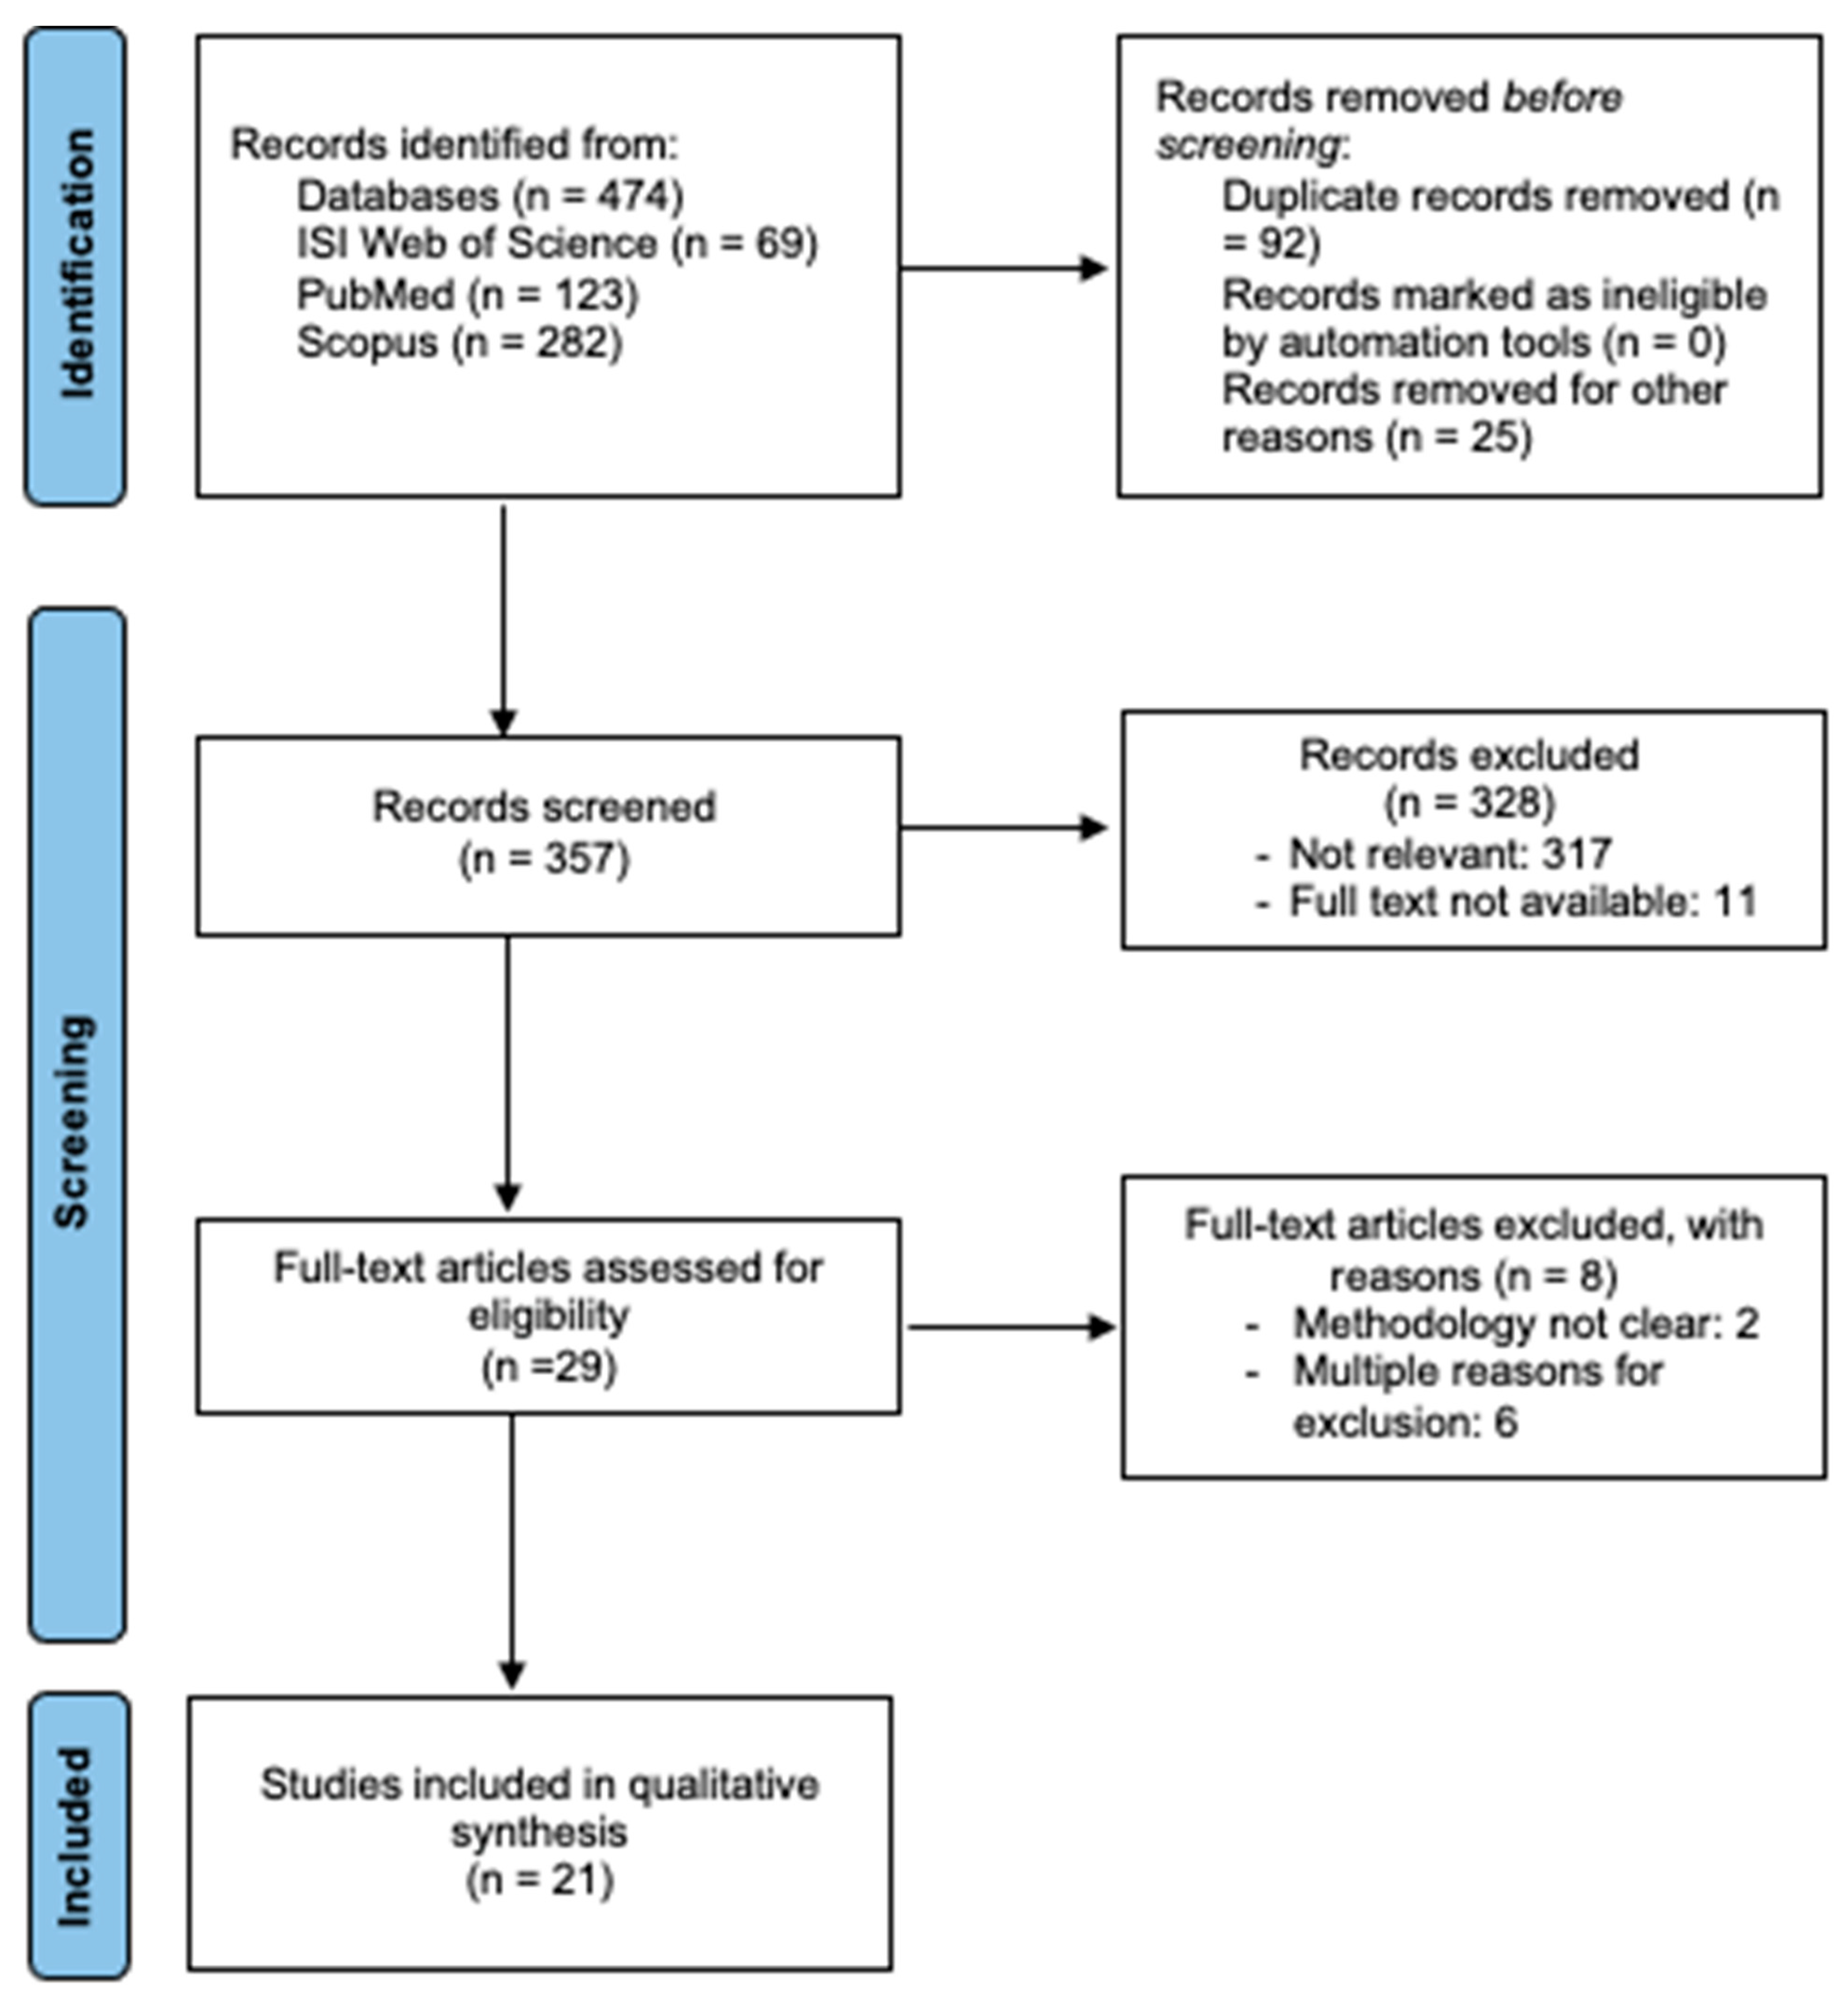
2.3. Study Selection
2.4. Data Extraction and Synthesis
2.5. Data Analysis
Assessment Risk of Bias
3. Results
3.1. Description of the Studies Reviewed
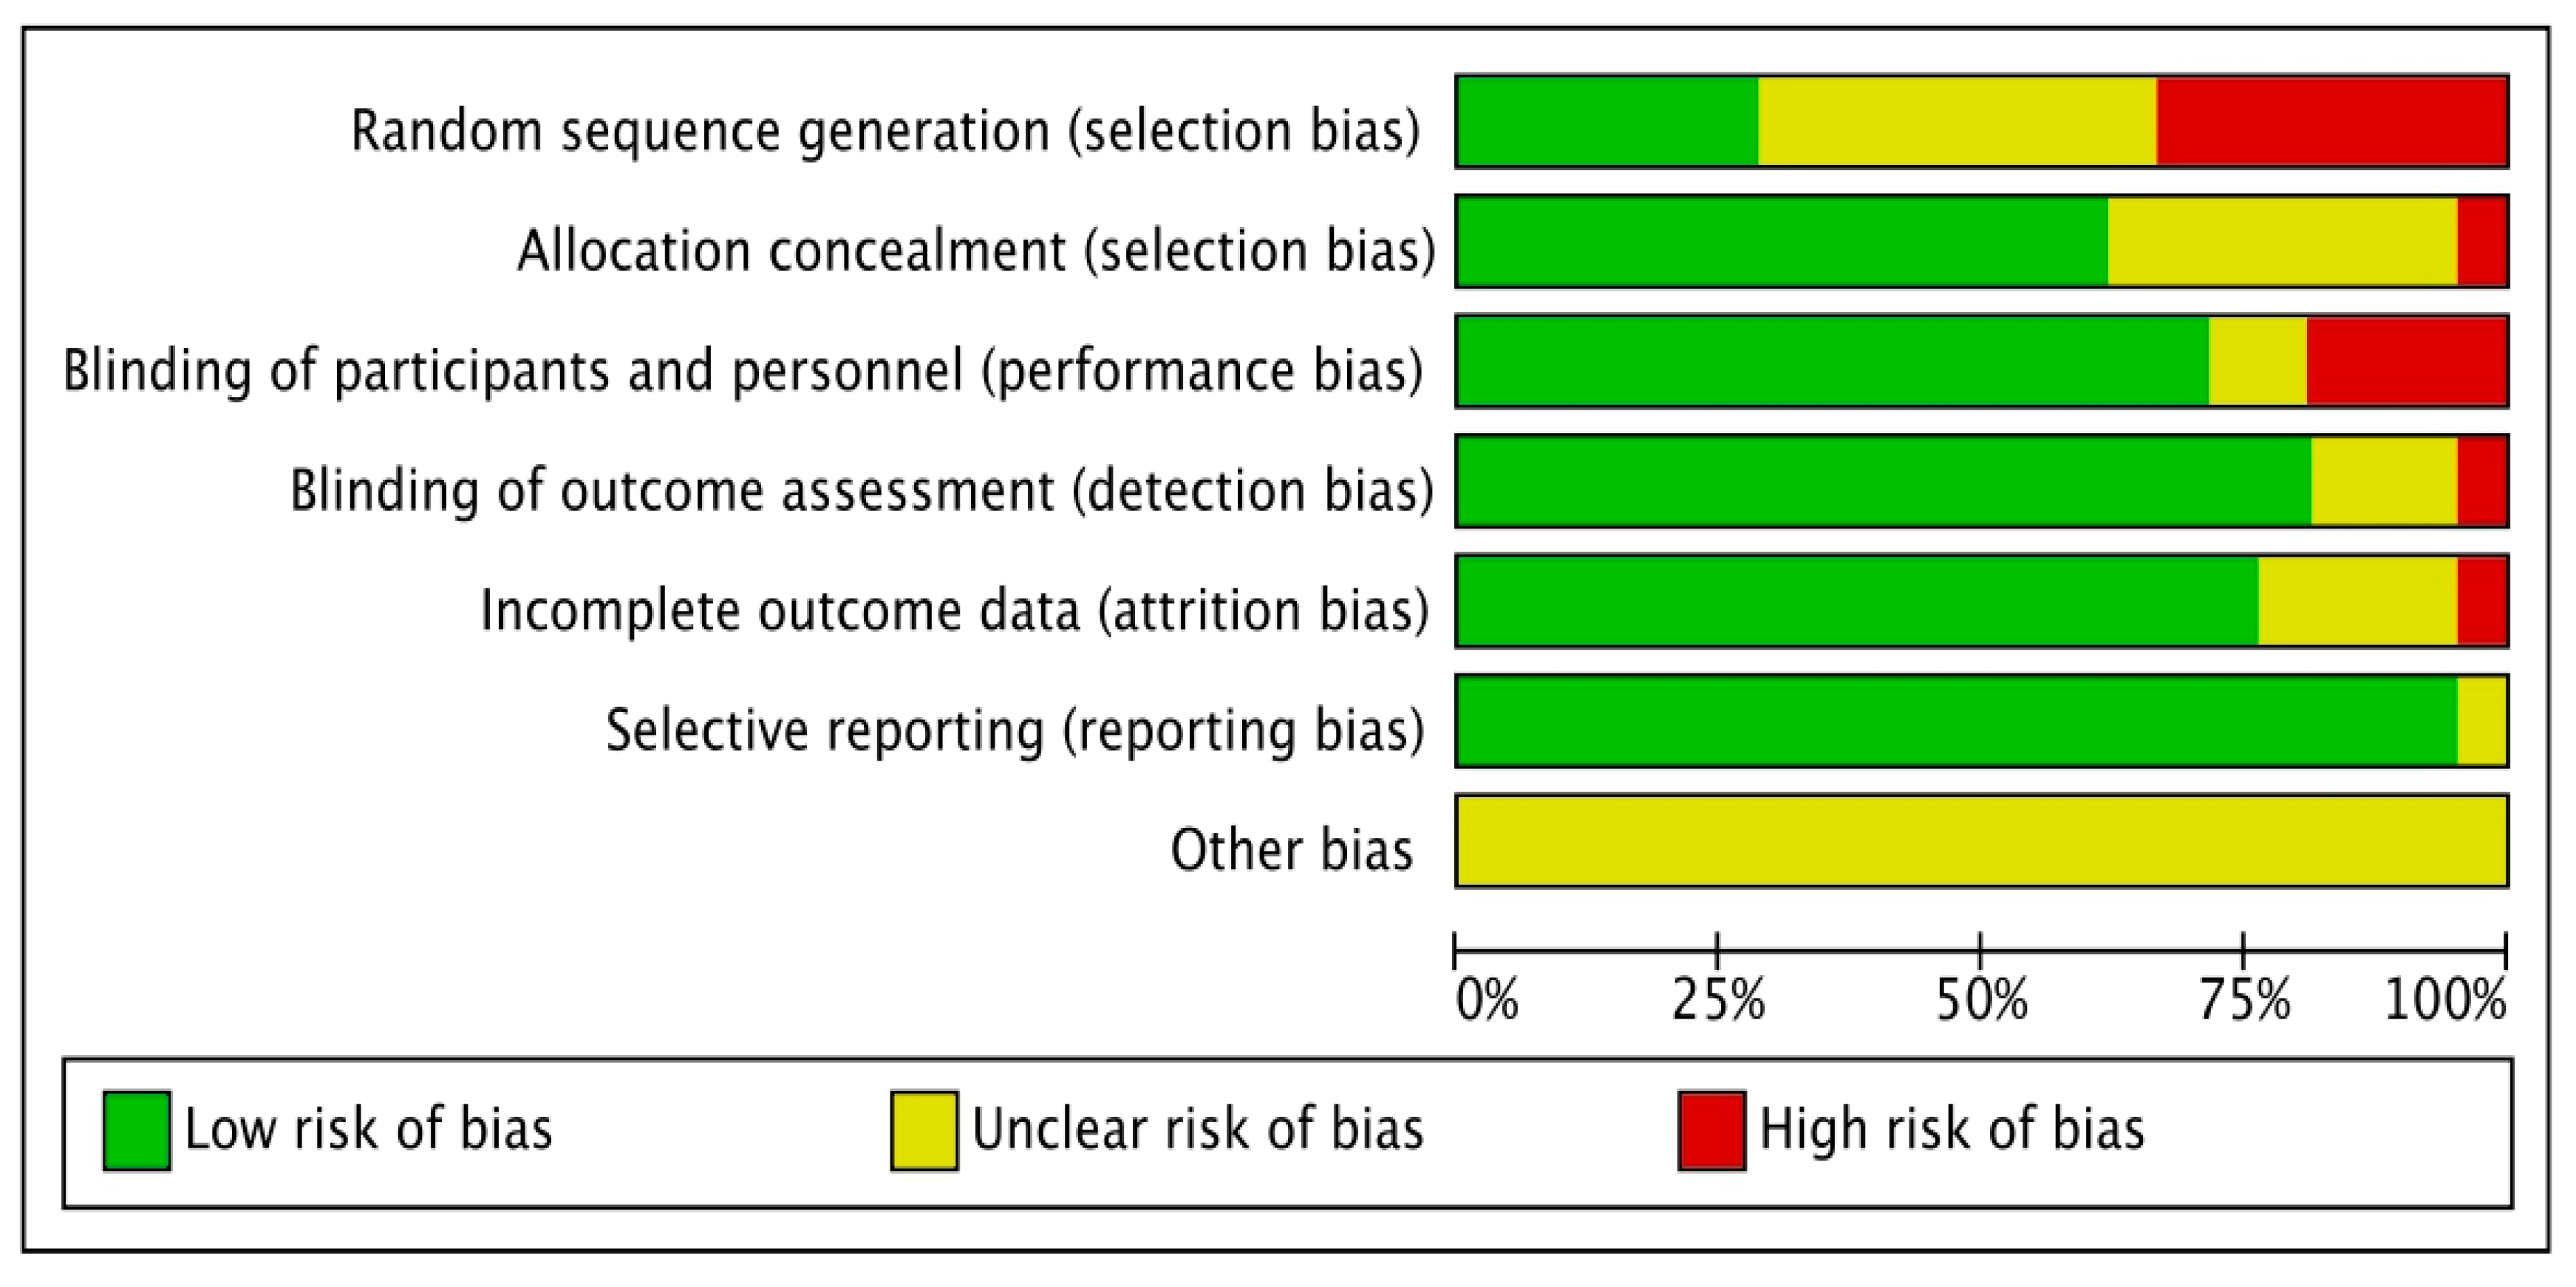
3.2. Risk of Bias in the Included Articles
3.3. Physical Activity in Children’s Using Pedometers
3.4. Physical Activity in Children’s Using Accelerometers
3.5. Physical Activity in Children’s Pedometers vs. Accelerometers
4. Discussion
5. Conclusions
Supplementary Materials
Author Contributions
Funding
Institutional Review Board Statement
Informed Consent Statement
Data Availability Statement
Conflicts of Interest
References
- Goldfield, G.S.; Harvey, A.; Grattan, K.; Adamo, K.B. Physical Activity Promotion in the Preschool Years: A Critical Period to Intervene. Int. J. Environ. Res. Public Health 2012, 9, 1326–1342. [Google Scholar] [CrossRef] [PubMed]
- Reichert, F.F.; Baptista Menezes, A.M.; Wells, J.C.K.; Carvalho Dumith, S.; Hallal, P.C. Physical Activity as a Predictor of Adolescent Body Fatness. Sport. Med. 2009, 39, 279–294. [Google Scholar] [CrossRef] [PubMed]
- Gonzalez-Suarez, C.; Worley, A.; Grimmer-Somers, K.; Dones, V. School-Based Interventions on Childhood Obesity. Am. J. Prev. Med. 2009, 37, 418–427. [Google Scholar] [CrossRef] [PubMed]
- Olsen, N.; Rohde, J.; Heitmann, B. The Healthy Start Project: A Randomized, Controlled Intervention to Prevent Overweight among Normal Weight, Preschool Children at High Risk of Future Overweight. Eur. J. Public Health 2015, 25. [Google Scholar] [CrossRef]
- Sallis, J.; Owen, N. Physical Activity and Behavioral Medicine, 1st ed.; Sage Publications: London, UK, 1999; ISBN 9781452233765. [Google Scholar]
- Armstrong, N.; Welsman, J. Young People and Physical Activity; Oxford University Press: New York, NY, USA, 1997. [Google Scholar]
- Marques, A. Actividade Física e Saúde. A Perspectiva Pedagógica. In O Papel da Educação Física na Promoção de Estilos de Vida Saudáveis; Rocha, L., Ed.; Faculty of Sport of the University of Porto: Porto, Portugal, 1998; pp. 81–107. [Google Scholar]
- Barbosa; Urrea, A. Influencia Del Deporte y La Actividad Física En El Estado de Salud Físico y Mental: Una Revisión Bibliográfica. Rev. Katharsis 2018, 25, 141–159. [Google Scholar]
- Prince, S.A.; Adamo, K.B.; Hamel, M.; Hardt, J.; Connor Gorber, S.; Tremblay, M. A Comparison of Direct versus Self-Report Measures for Assessing Physical Activity in Adults: A Systematic Review. Int. J. Behav. Nutr. Phys. Act. 2008, 5, 56. [Google Scholar] [CrossRef]
- Chen, K.Y.; Bassett, D.R. The Technology of Accelerometry-Based Activity Monitors: Current and Future. Med. Sci. Sport. Exerc. 2005, 37, S490–S500. [Google Scholar] [CrossRef]
- Yang, C.-C.; Hsu, Y.-L. A Review of Accelerometry-Based Wearable Motion Detectors for Physical Activity Monitoring. Sensors 2010, 10, 7772–7788. [Google Scholar] [CrossRef]
- Slade Shantz, J.A.; Veillette, C.J.H. The Application of Wearable Technology in Surgery: Ensuring the Positive Impact of the Wearable Revolution on Surgical Patients. Front. Surg. 2014, 1, 39. [Google Scholar] [CrossRef]
- McCallum, C.; Rooksby, J.; Gray, C.M. Evaluating the Impact of Physical Activity Apps and Wearables: Interdisciplinary Review. JMIR mHealth uHealth 2018, 6, e58. [Google Scholar] [CrossRef]
- Brickwood, K.-J.; Watson, G.; O’Brien, J.; Williams, A.D. Consumer-Based Wearable Activity Trackers Increase Physical Activity Participation: Systematic Review and Meta-Analysis. JMIR mHealth uHealth 2019, 7, e11819. [Google Scholar] [CrossRef]
- Seshadri, D.R.; Rowbottom, J.R.; Drummond, C.; Voos, J.E.; Craker, J. A Review of Wearable Technology: Moving beyond the Hype: From Need through Sensor Implementation. In Proceedings of the 2016 8th Cairo International Biomedical Engineering Conference (CIBEC), Cairo, Egypt, 15–17 December 2016; pp. 52–55. [Google Scholar]
- Gaskin, J.; Jenkins, J.; Meservy, T.; Steffen, J.; Payne, K. Using Wearable Devices for Non-Invasive, Inexpensive Physiological Data Collection. 2017. Available online: https://scholarspace.manoa.hawaii.edu/server/api/core/bitstreams/6c041d0a-0cb8-41cf-a60a-0bdffd526ba9/content (accessed on 10 September 2022).
- Leu, F.; Ko, C.; You, I.; Choo, K.-K.R.; Ho, C.-L. A Smartphone-Based Wearable Sensors for Monitoring Real-Time Physiological Data. Comput. Electr. Eng. 2018, 65, 376–392. [Google Scholar] [CrossRef]
- Ferreira, P.C.; Ataíde, V.N.; Silva Chagas, C.L.; Angnes, L.; Tomazelli Coltro, W.K.; Longo Cesar Paixão, T.R.; Reis de Araujo, W. Wearable Electrochemical Sensors for Forensic and Clinical Applications. TrAC Trends Anal. Chem. 2019, 119, 115622. [Google Scholar] [CrossRef]
- Teymourian, H.; Parrilla, M.; Sempionatto, J.R.; Montiel, N.F.; Barfidokht, A.; Van Echelpoel, R.; De Wael, K.; Wang, J. Wearable Electrochemical Sensors for the Monitoring and Screening of Drugs. ACS Sens. 2020, 5, 2679–2700. [Google Scholar] [CrossRef] [PubMed]
- Mahato, K.; Wang, J. Electrochemical Sensors: From the Bench to the Skin. Sens. Actuators B Chem. 2021, 344, 130178. [Google Scholar] [CrossRef]
- D’Aurizio, N.; Baldi, T.L.; Paolocci, G.; Prattichizzo, D. Preventing Undesired Face-Touches With Wearable Devices and Haptic Feedback. IEEE Access 2020, 8, 139033–139043. [Google Scholar] [CrossRef] [PubMed]
- Marullo, S.; Baldi, T.L.; Paolocci, G.; D’Aurizio, N.; Prattichizzo, D. No Face-Touch: Exploiting Wearable Devices and Machine Learning for Gesture Detection. In Proceedings of the 2021 IEEE International Conference on Robotics and Automation (ICRA), Xi’an, China, 30 May–5 June 2021; pp. 4187–4193. [Google Scholar]
- Pal, S.; Mukhopadhyay, S.; Suryadevara, N. Development and Progress in Sensors and Technologies for Human Emotion Recognition. Sensors 2021, 21, 5554. [Google Scholar] [CrossRef]
- Mosenia, A.; Sur-Kolay, S.; Raghunathan, A.; Jha, N.K. Wearable Medical Sensor-Based System Design: A Survey. IEEE Trans. Multi-Scale Comput. Syst. 2017, 3, 124–138. [Google Scholar] [CrossRef]
- Rupp, M.A.; Michaelis, J.R.; McConnell, D.S.; Smither, J.A. The Role of Individual Differences on Perceptions of Wearable Fitness Device Trust, Usability, and Motivational Impact. Appl. Ergon. 2018, 70, 77–87. [Google Scholar] [CrossRef]
- Jacobs, J.V.; Hettinger, L.J.; Huang, Y.-H.; Jeffries, S.; Lesch, M.F.; Simmons, L.A.; Verma, S.K.; Willetts, J.L. Employee Acceptance of Wearable Technology in the Workplace. Appl. Ergon. 2019, 78, 148–156. [Google Scholar] [CrossRef]
- Teló, F.G.; de Oliveira, B.B.; Vita, J.B.; Ferreira, R.M.Z. Análise de Custo-Benefício, Tecnologias Vestíveis e Monitoramento Biométrico nos Esportes Norte-Americanos: Aspectos Jurídicos e Econômicos. Econ. Anal. Law Rev. 2021, 12, 191. [Google Scholar] [CrossRef]
- Çiçek, M. Wearable Technologies and Its Future Applications. Int. J. Electr. Electron. Data Commun. 2015, 3, 45–50. [Google Scholar]
- Vega, K.; Fuks, H. Beauty Technology; Human–Computer Interaction Series; Springer International Publishing: Cham, Switzerland, 2016; ISBN 978-3-319-15761-0. [Google Scholar]
- Adesida, Y.; Papi, E.; McGregor, A.H. Exploring the Role of Wearable Technology in Sport Kinematics and Kinetics: A Systematic Review. Sensors 2019, 19, 1597. [Google Scholar] [CrossRef] [PubMed]
- Bächlin, M.; Tröster, G. Swimming Performance and Technique Evaluation with Wearable Acceleration Sensors. Pervasive Mob. Comput. 2012, 8, 68–81. [Google Scholar] [CrossRef]
- Krüger, A.; Edelmann-Nusser, J. Biomechanical Analysis in Freestyle Snowboarding: Application of a Full-Body Inertial Measurement System and a Bilateral Insole Measurement System. Sport. Technol. 2009, 2, 17–23. [Google Scholar] [CrossRef]
- Peake, J.M.; Kerr, G.; Sullivan, J.P. A Critical Review of Consumer Wearables, Mobile Applications, and Equipment for Providing Biofeedback, Monitoring Stress, and Sleep in Physically Active Populations. Front. Physiol. 2018, 9, 743. [Google Scholar] [CrossRef]
- Kerner, C.; Goodyear, V.A. The Motivational Impact of Wearable Healthy Lifestyle Technologies: A Self-Determination Perspective on Fitbits With Adolescents. Am. J. Health Educ. 2017, 48, 287–297. [Google Scholar] [CrossRef]
- Klenk, S.; Reifegerste, D.; Renatus, R. Gender Differences in Gratifications from Fitness App Use and Implications for Health Interventions. Mob. Media Commun. 2017, 5, 178–193. [Google Scholar] [CrossRef]
- Phillips, A.; Rodenbeck, M.; Clegg, B. Apps for Physical Education: Teacher Tested, Kid Approved! Strategies 2014, 27, 28–31. [Google Scholar] [CrossRef]
- Vega-Ramírez, L.; Notario, R.O.; Ávalos-Ramos, M.A. The Relevance of Mobile Applications in the Learning of Physical Education. Educ. Sci. 2020, 10, 329. [Google Scholar] [CrossRef]
- Portela-Pino, I.; López-Castedo, A.; Martínez-Patiño, M.J.; Valverde-Esteve, T.; Domínguez-Alonso, J. Gender Differences in Motivation and Barriers for The Practice of Physical Exercise in Adolescence. Int. J. Environ. Res. Public Health 2019, 17, 168. [Google Scholar] [CrossRef] [PubMed]
- Schwartz, B.; Baca, A. Wearables and Apps—Modern Diagnostic Frameworks for Health Promotion through Sport. Dtsch. Z. Sportmed. 2016, 2016, 131–136. [Google Scholar] [CrossRef]
- Lee, J.E.; Gao, Z. Effects of the IPad and Mobile Application-Integrated Physical Education on Children’s Physical Activity and Psychosocial Beliefs. Phys. Educ. Sport Pedagog. 2020, 25, 567–584. [Google Scholar] [CrossRef]
- Shamseer, L.; Moher, D.; Clarke, M.; Ghersi, D.; Liberati, A.; Petticrew, M.; Shekelle, P.; Stewart, L.A. Preferred Reporting Items for Systematic Review and Meta-Analysis Protocols (PRISMA-P) 2015: Elaboration and Explanation. BMJ 2015, 349, g7647. [Google Scholar] [CrossRef]
- Blaes, A.; Baquet, G.; Van Praagh, E.; Berthoin, S. Physical Activity Patterns in French Youth-From Childhood to Adolescence-Monitored with High-Frequency Accelerometry. Am. J. Hum. Biol. 2011, 23, 353–358. [Google Scholar] [CrossRef] [PubMed]
- Valach, P.; Vašíčková, J.; Frömel, K.; Jakubec, L.; Chmelík, F.; Svozil, Z. Is Academic Achievement Reflected in the Level of Physical Activity among Adolescents? J. Phys. Educ. Sport 2020, 20, 186–195. [Google Scholar] [CrossRef]
- Higgins, J.P.T.; Green, S. Cochrane Handbook for Systematic Reviews of Interventions, Version 5.1.0; The Cochrane Collaboration: London, UK, 2011. [Google Scholar]
- Byun, W.; Lau, E.; Brusseau, T. Feasibility and Effectiveness of a Wearable Technology-Based Physical Activity Intervention in Preschoolers: A Pilot Study. Int. J. Environ. Res. Public Health 2018, 15, 1821. [Google Scholar] [CrossRef] [PubMed]
- Saint-Maurice, P.; Bai, Y.; Vazou, S.; Welk, G. Youth Physical Activity Patterns During School and Out-of-School Time. Children 2018, 5, 118. [Google Scholar] [CrossRef]
- Scruggs, P.W.; Beveridge, S.K.; Eisenman, P.A.; Watson, D.L.; Shultz, B.B.; Ransdell, L.B. Quantifying Physical Activity via Pedometry in Elementary Physical Education. Med. Sci. Sport. Exerc. 2003, 35, 1065–1071. [Google Scholar] [CrossRef]
- Saint-Maurice, P.F.; Welk, G.J.; Silva, P.; Siahpush, M.; Huberty, J. Assessing Children’s Physical Activity Behaviors at Recess: A Multi-Method Approach. Pediatr. Exerc. Sci. 2011, 23, 585–599. [Google Scholar] [CrossRef]
- Gao, Z.; Oh, H.; Sheng, H. Middle School Students’ Body Mass Index and Physical Activity Levels in Physical Education. Res. Q. Exerc. Sport 2011, 82, 145–150. [Google Scholar] [CrossRef] [PubMed]
- Frömel, K.; Kudlacek, M.; Groffik, D.; Chmelik, F.; Jakubec, L. Differences in the Intensity of Physical Activity during School Days and Weekends in Polish and Czech Boys and Girls. Ann. Agric. Environ. Med. 2016, 23, 357–360. [Google Scholar] [CrossRef] [PubMed]
- Mitáš, J.; Frömel, K.; Valach, P.; Suchomel, A.; Vorlíček, M.; Groffik, D. Secular Trends in the Achievement of Physical Activity Guidelines: Indicator of Sustainability of Healthy Lifestyle in Czech Adolescents. Sustainability 2020, 12, 5183. [Google Scholar] [CrossRef]
- Sigmund, E.; Sigmundová, D.; Ansari, W. El Changes in Physical Activity in Pre-Schoolers and First-Grade Children: Longitudinal Study in the Czech Republic. Child. Care. Health Dev. 2009, 35, 376–382. [Google Scholar] [CrossRef] [PubMed]
- Sanders, T.; Cliff, D.P.; Lonsdale, C. Measuring Adolescent Boys’ Physical Activity: Bout Length and the Influence of Accelerometer Epoch Length. PLoS ONE 2014, 9, e92040. [Google Scholar] [CrossRef]
- Hartwig, T.B.; del Pozo-Cruz, B.; White, R.L.; Sanders, T.; Kirwan, M.; Parker, P.D.; Vasconcellos, D.; Lee, J.; Owen, K.B.; Antczak, D.; et al. A Monitoring System to Provide Feedback on Student Physical Activity during Physical Education Lessons. Scand. J. Med. Sci. Sports 2019, 29, 1305–1312. [Google Scholar] [CrossRef]
- Hubáčková, R.; Groffik, D.; Skrzypnik, L.; Frömel, K. Physical Activity and Inactivity in Primary and Secondary School Boys’ and Girls’ Daily Program. Acta Gymnica 2016, 46, 193–200. [Google Scholar] [CrossRef]
- Fairclough, S.J.; Butcher, Z.H.; Stratton, G. Whole-Day and Segmented-Day Physical Activity Variability of Northwest England School Children. Prev. Med. 2007, 44, 421–425. [Google Scholar] [CrossRef]
- Kerr, C.; Smith, L.; Charman, S.; Harvey, S.; Savory, L.; Fairclough, S.; Govus, A. Physical Education Contributes to Total Physical Activity Levels and Predominantly in Higher Intensity Physical Activity Categories. Eur. Phys. Educ. Rev. 2018, 24, 152–164. [Google Scholar] [CrossRef]
- Mooses, K.; Oja, M.; Reisberg, S.; Vilo, J.; Kull, M. Validating Fitbit Zip for Monitoring Physical Activity of Children in School: A Cross-Sectional Study. BMC Public Health 2018, 18, 858. [Google Scholar] [CrossRef]
- Mota, J.; Silva, P.; Santos, M.P.; Ribeiro, J.C.; Oliveira, J.; Duarte, J.A. Physical Activity and School Recess Time: Differences between the Sexes and the Relationship between Children’s Playground Physical Activity and Habitual Physical Activity. J. Sports Sci. 2005, 23, 269–275. [Google Scholar] [CrossRef] [PubMed]
- Nilsen, A.K.O.; Anderssen, S.A.; Resaland, G.K.; Johannessen, K.; Ylvisaaker, E.; Aadland, E. Boys, Older Children, and Highly Active Children Benefit Most from the Preschool Arena Regarding Moderate-to-Vigorous Physical Activity: A Cross-Sectional Study of Norwegian Preschoolers. Prev. Med. Rep. 2019, 14, 100837. [Google Scholar] [CrossRef] [PubMed]
- Rush, E.; Coppinger, T.; Obolonkin, V.; Hinckson, E.; McGrath, L.; McLennan, S.; Graham, D. Use of Pedometers to Identify Less Active Children and Time Spent in Moderate to Vigorous Physical Activity in the School Setting. J. Sci. Med. Sport 2012, 15, 226–230. [Google Scholar] [CrossRef] [PubMed]
- Raustorp, A.; Boldemann, C.; Johansson, M.; Mårtensson, F. Objectively Measured Physical Activty Level a during a Physical Education Class: A Pilot Study with Swedish Youth. Int. J. Adolesc. Med. Health 2010, 22, 469–476. [Google Scholar] [CrossRef] [PubMed]
- Janssen, M.; Twisk, J.W.R.; Toussaint, H.M.; van Mechelen, W.; Verhagen, E.A.L.M. Effectiveness of the PLAYgrounds Programme on PA Levels during Recess in 6-Year-Old to 12-Year-Old Children. Br. J. Sports Med. 2015, 49, 259–264. [Google Scholar] [CrossRef]
- de Bruin, E.D.; Hartmann, A.; Uebelhart, D.; Murer, K.; Zijlstra, W. Wearable Systems for Monitoring Mobility-Related Activities in Older People: A Systematic Review. Clin. Rehabil. 2008, 22, 878–895. [Google Scholar] [CrossRef]
- Aires, L.; Silva, P.; Silva, G.; Santos, M.P.; Ribeiro, J.C.; Mota, J. Intensity of Physical Activity, Cardiorespiratory Fitness, and Body Mass Index in Youth. J. Phys. Act. Health 2010, 7, 54–59. [Google Scholar] [CrossRef]
- Dencker, M.; Thorsson, O.; Karlsson, M.K.; Lindén, C.; Wollmer, P.; Andersen, L.B. Daily Physical Activity Related to Aerobic Fitness and Body Fat in an Urban Sample of Children. Scand. J. Med. Sci. Sports 2008, 18, 728–735. [Google Scholar] [CrossRef]
- Denton, S.J.; Trenell, M.I.; Plötz, T.; Savory, L.A.; Bailey, D.P.; Kerr, C.J. Cardiorespiratory Fitness Is Associated with Hard and Light Intensity Physical Activity but Not Time Spent Sedentary in 10–14 Year Old Schoolchildren: The HAPPY Study. PLoS ONE 2013, 8, e61073. [Google Scholar] [CrossRef]
- Gutin, B.; Yin, Z.; Humphries, M.C.; Barbeau, P. Relations of Moderate and Vigorous Physical Activity to Fitness and Fatness in Adolescents. Am. J. Clin. Nutr. 2005, 81, 746–750. [Google Scholar] [CrossRef]
- Abbott, R.A.; Davies, P.S.W. Habitual Physical Activity and Physical Activity Intensity: Their Relation to Body Composition in 5.0–10.5-y-Old Children. Eur. J. Clin. Nutr. 2004, 58, 285–291. [Google Scholar] [CrossRef] [PubMed]
- Parikh, T.; Stratton, G. Influence of Intensity of Physical Activity on Adiposity and Cardiorespiratory Fitness in 5–18 Year Olds. Sport. Med. 2011, 41, 477–488. [Google Scholar] [CrossRef] [PubMed]
- Ruiz, J.R.; Rizzo, N.S.; Hurtig-Wennlöf, A.; Ortega, F.B.; Wàrnberg, J.; Sjöström, M. Relations of Total Physical Activity and Intensity to Fitness and Fatness in Children: The European Youth Heart Study1–3. Am. J. Clin. Nutr. 2006, 84, 299–303. [Google Scholar] [CrossRef]
- Hopkins, N.D.; Stratton, G.; Tinken, T.M.; McWhannell, N.; Ridgers, N.D.; Graves, L.E.F.; George, K.; Cable, N.T.; Green, D.J. Relationships between Measures of Fitness, Physical Activity, Body Composition and Vascular Function in Children. Atherosclerosis 2009, 204, 244–249. [Google Scholar] [CrossRef]
- França, C.; Santos, F.; Martins, F.; Lopes, H.; Gouveia, B.; Gonçalves, F.; Campos, P.; Marques, A.; Ihle, A.; Gonçalves, T.; et al. Digital Health in Schools: A Systematic Review. Sustainability 2022, 14, 13848. [Google Scholar] [CrossRef]
- Kasparian, A.M.; Badawy, S.M. Utility of Fitbit Devices among Children and Adolescents with Chronic Health Conditions: A Scoping Review. mHealth 2022, 8, 26. [Google Scholar] [CrossRef] [PubMed]
- Villasana, M.V.; Pires, I.M.; Sá, J.; Garcia, N.M.; Zdravevski, E.; Chorbev, I.; Lameski, P.; Flórez-Revuelta, F. Mobile Applications for the Promotion and Support of Healthy Nutrition and Physical Activity Habits: A Systematic Review, Extraction of Features and Taxonomy Proposal. Open Bioinform. J. 2019, 12, 50–71. [Google Scholar] [CrossRef]
- Saint-Maurice, P.F.; Welk, G.J. Validity and Calibration of the Youth Activity Profile. PLoS ONE 2015, 10, e0143949. [Google Scholar] [CrossRef]
- Trost, S.G.; Mciver, K.L.; Pate, R.R. Conducting Accelerometer-Based Activity Assessments in Field-Based Research. Med. Sci. Sport. Exerc. 2005, 37, S531–S543. [Google Scholar] [CrossRef]


| Authors/Year/ Country | Sample/Age (Years) | Device | Data Collection Procedures | Outocomes |
|---|---|---|---|---|
| Valach et al. [43] Czech Republic | n = 212 (136 girls and 76 boys) Age = 16–19 years | ActiTrainerTM accelerometer | Participants wore the device on their right hip. | ActiTrainerTM evaluated distance performed |
| Frömel et al. [50] Czech Republic and Poland | n = 333 (223 girls and 110 boys) Age = 15–18 years | ActiTrainerTM accelerometer | Participants wore the device on their right hip. | ActiTrainerTM evaluated distance performed |
| Hubáčková et al. [55] Poland | n = 395 (238 girls and 157 boys) Age = 9–17 years | ActiTrainerTM accelerometer | Participants wore the device on their right hip. | ActiTrainerTM evaluated distance performed |
| Mitáš et al. [51] Czech Republic | n = 1908 (1129 girls and 779 boys) Age = 15–19 years | Yamax Digiwalker SW-700 pedometer | The pedometer was placed on the hip in the region of the body’s center of gravity. | Yamax Digiwalker SW-700 evaluated the number of steps (total) |
| Byun et al. [45] USA | n = 93 girls Age = 4–5 years | Firbit Flex and ActiGraph GT3X+ accelerometers | The accelerometer was attached to the child’s hip using an elastic belt. Fitbit Flex were fitted to age-appropriate wristbands on the non-dominant wrist. | Firbit Flex and ActiGraph GT3X+ evaluated distance performed |
| Saint-Maurice et al. [46] USA | n = 291 (163 girls and 128 boys) Age = 8–17 years | SenseWear Armband | SenseWear Armband is worn on the back of the upper arm. | SenseWear Armband evaluated distance performed |
| Sanders et al. [53] Australia | n = 133 boys Age = 14 years | ActiGraph GT3X accelerometer | The accelerometer was placed on the upper part of the right hip. | ActiGraph GT3X evaluated distance performed |
| Scruggs et al. [47] USA | n = 369 (178 girls and 191 boys) Age = 7–8 years | Yamax DigiWalker SW-701 pedometer | Pedometer placement was standardized by placing them on the belt or waistband, approximately 5–7 cm from the umbilicus. | Yamax Digiwalker SW-701 evaluated the number of steps (total) |
| Mooses et al. [58] Estonia | n = 144 (72 girls and 72 boys) Age = 9–10 years | Fitbit Zip and an ActiGraph GT3x-accelerometer | The accelerometer and Fitbit Zip were attached on the hip with the same elastic belt and worn on the same side. | Both accelerometers were used to assess distance performed. |
| Kerr et al. [57] England | n = 36 girls Age = 11–12 years | RT3@ triaxial accelerometer | All of the children were asked to strap an accelerometer to their waist. | RT3@ trixial evaluated distance performed |
| Janssen et al. [63] Netherlands | n = 1486 (658 girls and 828 boys) Age = 7–10 years | ActiTrainerTM and ActiGraph accelerometers | The accelerometer was securely attached to the children’s hip by an elastic waist belt. | ActiGraph and ActiTrainerTM evaluated distance performed |
| Saint-Maurice et al. [48] USA | n = 100 (48 girls and 52 boys) Age = 8–12 years | ActiGraph GT1M accelerometer | Participants were asked to wear the monitor on the right side of their hip (at waist level) during the entire school day. | ActiGraph GT1M evaluated distance performed |
| Hartwig et al. [54] Australia | n = 592 girls Age =13–14 years | ActiGraph GT3X+ accelerometer and Yamax Digiwalker SW-200 pedometer | The participants used ActiGraph GT3X+ accelerometer and Yamax Digi-Walker SW pedometer on an elastic belt secured across their hips during PE lessons. | ActiGraph GT3X+ evaluated distance performed, while Yamax Digiwalker SW-200 evaluated the number of steps (total) |
| Sigmund et al. [52] Czech Republic | n = 176 (84 girls and 92 boys) Age = 5–7 years | Caltrac one-axial accelerometer and Yamax Digiwalker SW-200 pedometer | The Caltrac accelerometer and the Yamax pedometer were attached to elastic belts on the children’s right hips. | Caltrac evaluated energy expenditure (distance performed), while Yamax Digiwalker SW-200 evaluated the number of steps (total) |
| Gao et al. [40] USA and Mexico | n = 149 (74 girls and 75 boys) Age = 10–14 years | Actical Mini-Mitter accelerometer | The accelerometer was placed with a belt support on the left hip. | Actical Mini-Mitter evaluated distance performed |
| Mota et al. [59] Portugal | n = 22 (12 girls and 10 boys) Age = 8–10 years | CSA 7164 accelerometer | The accelerometer was placed in a small nylon pouch and firmly adjusted at the child’s waist by an elastic belt over the non-preferred hip. | CSA 7164 evaluated distance performed |
| Fairclough et al. [56] England | n = 58 (27 girls and 31 boys) Age = 7–11 years BMI = 19.5 girls and boys | ActiGraph GT1M accelerometer | Children were asked to wear the accelerometer ActiGraphs attached to their right hip. | ActiGraph GT1M evaluated distance performed |
| Nilsen et al. [60] Norway | n = 1109 (537 girls and 572 boys) Age = 4–5 years | ActiGraph GT3X+ accelerometer | The accelerometers were mounted on the right hip. | ActiGraph GT3X+ evaluated distance performed. |
| Rush et al. [61] New Zealand | n = 47 (28 girls and 19 boys) Age = 8–11 years | Yamax SW-200 pedometer and Actical Mini-Mitter accelerometer | The pedometer and accelerometer were attached to the belt. It was then sealed with a cable tie and positioned on the child who wore the same pedometer/accelerometer combination each day. | Actical Mini-Mitter evaluated distance performed, while Yamax Digiwalker SW-200 evaluated the number of steps (total) |
| Blaes et al. [42] France | n = 361 (193 girls and 168 boys) Age = 3–16 years | ActiGraph GT1M accelerometer | The accelerometer was placed on the right hip, secured with an elastic belt. | ActiGraph GT3X+ evaluated distance performed. |
| Raustorp et al. [62] Sweden | n = 19 (9 girls and 10 boys) Age = 10 years BMI = 16.9 girls and 18.3 boys) | Yamax SW-200 pedometer and ActiGraph GT1M accelerometer | The pedometer and accelerometer were attached to an elastic belt to the waistband and placed in line with the midpoint of the right knee. | ActiGraph GT1M evaluated distance performed, while Yamax Digiwalker SW-200 evaluated the number of steps (total) |
| Device Technology | Characteristics |
|---|---|
| ActiTrainerTM accelerometer | The ActiTrainer accelerometer is surrounded by a metal shield and packaged into a plastic enclosure measuring 50 × 40 × 15 mm, weighing 45 g and including a 3-V (2430) coin cell lithium battery, and it has a dynamic range of 0.25 to 2.5 g, a sampling frequency of 30 Hz and contains a cantilevered rectangular piezoelectric bimorph plate and seismic mass, a charge amplifier, analog band-pass filters and a voltage regulator to measure acceleration in a single axis. The filtered acceleration signals (in the longitudinal axis) generate counts the magnitude of which is summed over a user-specific time (an epoch interval). |
| Yamax Digiwalker SW-700/701 pedometer | Digiwalker SW-700/701 pedometer is a simple motion sensor (5.0 × 3.8 × 1.4 cm and 21 g) that has a relatively low cost and is worn on the waist, which provides the number of steps performed in a given period, in addition to distance traveled and energy expenditure. Its mechanism consists of a suspended spring system that oscillates according to the vertical movement of the hip. Each spring deflection is recorded as a step and using this measurement and the anthropometric data, the energy expenditure is estimated. |
| SenseWear Armband | SenseWear Pro2 Armband is a multiple-sensor device collecting data using a skin temperature sensor, near body temperature sensor, heat flux sensor, galvanic skin response sensor and a biaxial accelerometer. The skin temperature sensor and near-body temperature sensor (a vent on the side of the armband) consists of sensitive thermistors that are in contact with the skin, relying on changes in resistance with changing temperature. The heat flux sensor uses the difference between skin temperature and near-body temperature to assess the heat loss. The galvanic skin response sensor measures the conductivity of the skin between two electrodes that are in contact with the skin. The conductivity of the skin varies according to physical and emotional stimuli. The biaxial accelerometer registers the movement of the upper arm and provides information about body position. The information from the sensors, together with gender, age, height and weight, are incorporated into proprietary algorithms to estimate energy expenditure. These algorithms are activity specific and are automatically applied on the basis of an analysis of the pattern of signals from the sensors. |
| Actigraph GT3X+ accelerometer | The Actigraph GT3X+ accelerometer is a light (19 g) and small (4.6 × 3.3 × 1.5 cm) device that detects bodily movements using a triaxial accelerometer at a dynamic range of ±6 g. Users can initialize the Actigraph GT3X+ accelerometer with sampling frequencies from 30 to 100 Hz, and export data in 1 to 60 s epochs. |
| Actigraph GT3X accelerometer | The Actigraph GT3X monitor device is lightweight (27 g), compact (3.8 × 3.7 × 1.8 cm) and has a rechargeable lithium polymer battery. It uses a solid-state tri-axial accelerometer to collect motion data on 3 axes: vertical (Y), horizontal right–left (X) and horizontal front–back axes (Z). The Actigraph output also includes the VM. The GT3X measures and records time-varying accelerations ranging in magnitude from ~0.05 to 2.5 Gs. The accelerometer output is digitized by a 12-bit analog to digital converter (ADC) at a rate of 30 Hz. Once digitized, the signal passes through a digital filter that band-limits the accelerometer to the frequency range of 0.25–2.5 Hz. |
| Fitbit Zip | The Fitbit Zip is a triaxial accelerometer that can measure the number of steps taken, distance traveled, and calories burned. This monitor is small (35.6 × 28.9 × 9.6 mm) but has an expanded battery life—approximately 4–6 months—and is less expensive than most other accelerometers. |
| Firbit flex | The Fitbit Flex (FF) features a triaxial accelerometer, and it is light (14 g including wristband) and small (3.2 × 1.2 × 1.0 cm). Using Bluetooth technology, the recorded data are wirelessly transferred to a cloud-based Fitbit application program interface called Fitbit dashboard (Fitbit.com), in which users find their data such as steps, total energy expenditure, ambulatory distance and active minutes (corresponding to MVPA). The data collected by the FF can be downloaded to Microsoft Excel or comma-separated values files via the Fitbit dashboard; however, the resolution of data exported from the Fitbit dashboard is lower than those of the other accelerometers. |
| RT3@ triaxial accelerometer | The RT3 accelerometer is a small (71 × 56 × 28 mm), lightweight (65.2 g), battery-powered instrument used as an experimental tool for measuring the physical activity of people. It is worn clipped to the waistband as an “accessory” during waking hours. Depending on its mode of operation, it can record data for up to 21 d, which are then downloaded to a PC for display and statistical processing. The sensor in the RT3 is an accelerometer sensitive along three orthogonal axes (X, Y and Z), which represent vertical, anteroposterior and mediolateral motions, respectively. The acceleration is measured periodically, converted to a digital representation and processed to obtain an “activity count,” which is stored in memory. The exact relationship of the activity count to the acceleration (measured in meters per second squared or g, where 1 g = 9.81 m·s−2) is not clear. The RT3 has four modes of operation: mode 1 samples and stores the activity counts on individual axes at 1 s epochs; mode 2 samples and stores vector magnitude (a measure combining all three axes of motion) activity counts at 1 s epochs; mode 3 samples and stores accumulated activity counts on individual axes over 1 min epochs; mode 4 samples and stores accumulated vector magnitude activity counts over 1 min epochs. |
| Yamax Digiwalker SW-200 pedometer | The Yamax Digiwalker SW-200 is a non-expensive, small (5.0 × 3.8 × 1.4 cm) and light electronic pedometer (21 g). Using a pendulum arm moving with the vertical oscillations of walking, its circuit switches on and off. Each vertical oscillation that exceeds the device threshold (#0.35 g) counts as a step. The total step count, which is the most accurate pedometer-derived variable representing PA, is shown on the display of the device. |
| Actigraph GT1M accelerometer | The Actigraph GT1M (mass, 27 g; 3.8 × 3.7 × 1.8 cm) uses an omnidirectional accelerometer to sense vertical accelerations, which range between 0.05 and 2.0 Gs; however, in its latest version (V3), it is possible to obtain counts from two axes. The accelerometer output is digitized by a twelve-bit Analog to Digital Convertor (ADC) at a rate of 30 Hz. |
| Caltrac one-axial accelerometer | The Caltrac one-axial accelerometer (Muscle Dynamics Fitness Network, Torrance, CA, USA) is small and light (<80 g) and measures vertical movement. Total and activity energy expenditure is estimated by entering the participant’s age, height, weight and sex; cumulative energy expenditure values are displayed on a screen. The Caltrac functions are such that when the trunk accelerates, the accelerometer produces a charge that is proportional to the force exerted by the subject, generating an acceleration–deceleration wave. The area under this wave is summed to yield the final number value of AEE. |
| Actical Mini-Mitter accelerometer | The Actical accelerometer (Mini Mitter) has an omnidirectional sensor and is capable of measuring movement in one plane. The sensor functions via a cantilevered rectangular piezoelectric bimorph plate and seismic mass, and it is capable of detecting movements in the 0.5 to 3 Hz range. Voltage generated by the sensor is amplified and filtered via analog circuitry. The amplified and filtered voltage is passed into an analog to digital converter, and the process is repeated 32 times per second (32 Hz). The resulting 1 s value is divided by four, then added to an accumulated activity value for the epoch. The Actical is the smallest accelerometer available (28 × 27 × 10 mm, 17 g) and is water resistant. |
| CSA 7164 accelerometer | The uni-axial CSA accelerometer is a small (5.1 × 4.1 × 1.5 cm), lightweight (42.5 g), single-channel accelerometer designed to measure and record acceleration ranging in magnitude from 0.05 to 2.00 g with a frequency response from 0.25 to 2.50 Hz. The filtered acceleration signal is digitized, and the magnitude is summed over a user-specified period of time (an epoch interval). At the end of each epoch, the summed value is stored in memory, and the numerical integrator is reset. This process can repeat itself for 22 consecutive days if a 1 min epoch is used before the memory is filled. Using a reader interface unit connected to a computer it is possible to download the recorded data and, using the software supplied with the unit, analyse the data. |
| References | Main Aim | Main Findings |
|---|---|---|
| Valach et al. [43] | To investigate the differences in the volume and intensity of PA between girls and boys with different levels of academic achievement throughout of a school day | PA during school |
| LPA (<3 METs (min·h−1)): H = 13.74, p < 0.01, η2 = 0.032 between boys and girls with better AA. | ||
| VPA (>6 METs (min·h−1)): H = 26.27, p < 0.01; η2 = 0.061 between boys and girls with worse AA, with both of them in favor of boys. | ||
| PA recess | ||
| VPA (>6 METs (min·h−1): H = 21.58; p < 0.001; η2 = 0.050), where boys with better AA were physically more active than girls were with better AA. | ||
| Frömel et al. [50] | To examine the differences in the intensity of PA during school days and weekends in Polish and Czech boys and girls | Intensity PA during school days (average) |
| <3 METs (hour·min−1) (LPA): Boys (Czech—9.77; Polish—9.48); Girls (Czech—8.68; Polish—8.56). | ||
| 3—5.9 METs (hour·min−1) (MPA): Boys (Czech—1.69; Polish—1.33); Girls (Czech—1.53; Polish—1.41). | ||
| ≥6 METs (hour·min−1) (VPA): Boys (Czech—0.57; Polish—0.35); Girls (Czech—0.31; Polish—0.22). | ||
| Hubáčková et al. [55] | To assess differences in PA among primary (PS) and secondary school (SS) boys and girls in specific segments of a school day | Energy expenditure in physical activity (kcal/kg/hour) |
| PS group: 0.50 (mdn) energy expended by boys and 0.41 by girls. | ||
| SS group: 0.26 (mdn) energy expended by boys and 0.38 by girls. | ||
| Step counts (steps/hour) | ||
| PS group: 763 (average) steps taken by boys and 614 of girls. | ||
| SS group: 484 (average) steps taken by boys and 554 by girls. | ||
| Mitáš et al. [51] | To identify the trends in the achievement of physical activity guidelines by Czech adolescents through objective and subjective PA monitoring | Physical activity (MET-min/week) in girls and boys in 2010–2017 |
| School: Boys (H = 7.18, p = 0.066, η2 = 0.005) and girls (H = 5.49, p = 0.139, η2 = 0.002). | ||
| VPA: Boys (H = 9.99, p = 0.019, η2 = 0.009) and girls (H = 9.38, p = 0.025, η2 = 0.006). | ||
| MPA: Boys (H = 10.71, p = 0.013, η2 = 0.010) and girls (H = 6.080, p = 0.109, η2 = 0.003). | ||
| Byun et al. [45] | To evaluate the feasibility and the effectiveness intervention of an PA monitoring system to promote PA in preschoolers | SED (average) |
| GI: 31.6 min/h. | ||
| GC: 33.6 min/h. | ||
| TPA (average) | ||
| GI: 28.4 min/h. | ||
| GC: 26.4 min/h. | ||
| Saint-Maurice et al. [46] | To describe age, sex and season patterns in children’s physical activity behaviors during discrete time periods, both in school and at home | Recess time: 65.0% (16.5 ± 9.2 min) in MVPA. PE: 31.4% (13.9 ± 11.1 min) in MVPA. |
| Sanders et al. [53] | To compare PA in the physical education lessons and leisure time and compare the effect of varying accelerometer epoch length on estimates of MVPA, vigorous PA (VPA), moderate PA (MPA) and light PA (LPA) | Time spent performing physical activity on average during Physical Education lesson: |
| MVPA—36.0612.3%; VPA—15.265.8%; MPA—20.768.2%; LPA—33.168.8% LPA—30.9614.3%; sedentary time—30.9614.3%. | ||
| Time spend performing physical activity on average during Leisure time: | ||
| MVPA—6.362.0%; VPA—1.461.0%; MPA—4.961.4%; LPA—11.462.8%, sedentary behavior—82.364.1%. | ||
| Scruggs et al. [47] | To determine a pedometer steps per minute pattern and to quantify the time students spent performing MVPA during physical education class | Validation Sample |
| Steps*min−1: Boys and girls (62.04 and 64.42, respectively) and 1st grade (from 6 to 10 years) and 2nd grade students (from 10 to 14 years) (63.13 and 63.14, respectively). | ||
| %MVPA: Boys and girls (34.56 and 35.21, respectively) and 1st grade and 2nd grade students (34.70 and 35.04, respectively). | ||
| %VPA: Boys and girls (16.14 and 16.63, respectively) and 1st grade and 2nd grade students (17.28 and 15.39, respectively). | ||
| Cross-Validation | ||
| Steps*min−1: Boys and girls (63.30 and 64.15, respectively) and 1st grade and 2nd grade students (63.47 and 64.18, respectively). | ||
| %MVPA: Boys and girls (35.22 and 34.70, respectively) and 1st grade and 2nd grade students (34.71 and 35.31, respectively). | ||
| %VPA: Boys and girls (17.67 and 16.42, respectively) and 1st grade and 2nd grade students (17.46 and 16.25, respectively). | ||
| Mooses et al. [58] | To assess the validity of Fitbit Zip step count, MVPA and sedentary minutes | PA monitored by Fitbip Zip and ActiGraph GT3x (average) |
| Steps (Fitbit Zip/ActiGraph GT3x): PE—2354.0 monitored by Fitbit Zip and 2008.7 ActiGraph GT3x; Recess—472.2 monitored by Fitbit Zip; 388.5 ActiGraph GT3x, r = 0.96, p < 0.001. | ||
| MVPA (min) (Fitbit Zip/ActiGraph GT3x): PE—17.8 monitored by Fitbit Zip and 15.4 ActiGraph GT3x; Recess—2.1 monitored by Fitbit Zip; 2.4 ActiGraph GT3x, r = 0.56–0.72, p < 0.001. | ||
| Sedentary time (min) (Fitbit Zip/ActiGraph GT3x): PE—11.1 monitored by Fitbit Zip and 13.7 ActiGraph GT3x; Recess—5.5 monitored by Fitbit Zip; 5.4 ActiGraph GT3x, r = 0.85–0.87, p < 0.001. | ||
| Kerr et al. [57] | To assess how PE contributes to sedentary behavior and the intensity profile of physical activity accumulated on PE days compared to those on non-PE days | Physical activity during the PE lesson |
| On average, girls spent a larger amount of time than boys did engaged in light physical activity (7.64, p < 0.01, d = 1.21). In contrast, boys spent more time performing hard (6.02, p < 0.01, d = −1.04) and very hard (5.12, p < 0.01, d = −0.82) physical activity, respectively, compared with that of girls. | ||
| Janssen et al. [63] | To evaluate the effectiveness of the playground program PLAYgrounds on increasing PA | Counts/min (average) |
| GI: 3924 (> 6 METs in VPA). | ||
| GC: 2178 (3–6 METs in MPA). | ||
| Energy expenditure (kcal/kg/min) (average) | ||
| GI: 0.105 (6 METs in MPA). | ||
| GC: 0.074 (4 METs in LPA). | ||
| MVPA (%) | ||
| GI: 77.3. | ||
| GC: 38.7. | ||
| Saint-Maurice et al. [48] | To evaluate the utility of a multi-method approach (accelerometers plus direct observation) to better understand youth PA during recess | MVPA |
| Boys (40.9) vs. girls (31.1): (F (1.184) = 32.22, p < 0.001). | ||
| School 2 (43.5) vs. School 1 (29.2): (F (1.184) = 63.59, p < 0.001. | ||
| School 2: Boys vs. girls (Meandiff = 17.9, p < 0.001). | ||
| School 1: Girls vs. boys (Meandiff = 4.1, p < 0.001). | ||
| Hartwig et al. [54] | To develop and validate a system capable of providing feedback on PE lesson MVPA | Physical activity PE lessons |
| Training Sample (average): Steps (2950), Steps*min−1 (43.5) and %MVPA (23.8). | ||
| Validation Sample (average): Steps (3025), Steps*min−1 (44.9) and %MVPA (24.2). | ||
| Convergent Sample (average): Steps (2136), Steps*min−1 (45.4) and %MVPA (24.2). | ||
| Sigmund et al. [52] | To identify the changes in children’s PA upon entry to first year at school and to identify the days of the school week when the students exhibit low PA values | PA in general |
| AEE: 268.08, p < 0.0001, d = 1.5646. | ||
| STEPS: 241.12, p < 0.0001, d = 1.3231. | ||
| PA of boys and girls | ||
| AEE (kcal/kg/day): boys (3.15, p < 0.0001, d = 1.7803); girls | ||
| (2.75, p < 0.0001, d = 1.3501). | ||
| STEPS (average/day): boys (2824.5, p < 0.0001, d = 1.5149); girls (2318, p < 0.0001, d = 1.2217). | ||
| Gao et al. [49] | To evaluate of the percentages of students who are overweight and obese based on the BMI and students’ physical activity level in physical education as measured by accelerometers | Percentage of time spent performing physical activity (average) |
| Percent time spent sedentary (accelerometer; %): OW/obese (13.54) vs. Normal weight (7.64), (F (1, 146) = 10.04, p = 0.002, η2 = 0.06). | ||
| Percent time performing MVPA (accelerometer; %): Normal weight (68.17) vs. OW/obese (61.14), (F (1146) = 4.89, p = 0.029, η2 = 0.03). | ||
| Mota et al. [59] | To observe participation in MVPA during school recess periods and to determine the relative importance of physical activity during recesses to overall daily physical activity | Daily accelerometer (counts × min−1): average 542 for boys and 479 for girls. |
| Recess time accelerometer (counts × min−1): average 914 for boys and 1154 for girls. | ||
| MVPA (min × min−1): averages of 142 for boys and 137 for girls. | ||
| Recess time MVPA (min): averages of 9.2 for boys and 11.4 for girls. | ||
| Fairclough et al. [56] | Assess the day-to-day variability of children’s weekday physical activity for the whole day and when it has been segmented into discrete periods of the day | PA to boys and girls |
| MVPA (min): Boys (32.8) and Girls (25.4). | ||
| Intra-class correlation coefficient (95% confidence intervals) of 1 day: Boys (0.367) and Girls (0.438). | ||
| Intra-class correlation coefficient (95% confidence intervals) of 4 days: Boys (0.698) and Girls (0.757). | ||
| Nilsen et al. [60] | Distribution of PA and SED, in particular MVPA, during preschool hours vs. time out of school | PA of boys and girls (Average) |
| TPA (cpm): Boys (867) and girls (776). | ||
| SED (min/day): Boys (172) and girls (186). | ||
| LPA (min/day): Boys (186) and girls (181). | ||
| MVPA (min/day): Boys (47) and girls (39). | ||
| Rush et al. [61] | Identify, in the context of the school day, whether a pedometer is a more effective tool, compared to an accelerometer in identifing children with low physical activity levels | Total Steps (300 min of an average school day) |
| Total accelerometer counts (cpm): Boys—8103; Girls—6963. | ||
| Sedentary, min/day <100 cpm: Boys—143.38; Girls—138.9. | ||
| Light, min/day ≥100 < 1500 cpm: Boys—89.16; Girls—94.75. | ||
| Moderate, min/day ≥1500 < 6500 cpm: Boys—64.78; Girls—63.39. | ||
| Vigorous, min/day ≥6500 cpm: Boys—3.68; Girls—3.95. | ||
| Blaes et al. [42] | Investigate changes in time spent performing light (LPA), moderate (MPA), vigorous (VPA) and very high physical activity (VHPA) from childhood to adolescence | School level |
| LPA (PS vs. JHS): +p < 0.05 (124 min per day). | ||
| MPA (Ps vs. PS): +p < 0.05 (115 min per day) and MPA (PS vs. JHS): −p < 0.05 (233 min per day). | ||
| VPA and VHPA (PS vs. Ps): +p < 0.05 (26 min per day and 25 min per day, respectively) and VPA and VHPA (PS vs. JHS): +p < 0.05 (26 min per day and 24 min per day, respectively). | ||
| MVHPA (PS vs. JHS): −p < 0.05 (223 min per day). | ||
| Raustorp et al. [62] | To advance our knowledge of the contribution of a typical physical education (PE) class to children’s daily physical activity | PE class |
| MVPA: 50.4% (52.5% boys and 48.3% girls). | ||
| Total average step: 74 steps/min. |
Disclaimer/Publisher’s Note: The statements, opinions and data contained in all publications are solely those of the individual author(s) and contributor(s) and not of MDPI and/or the editor(s). MDPI and/or the editor(s) disclaim responsibility for any injury to people or property resulting from any ideas, methods, instructions or products referred to in the content. |
© 2023 by the authors. Licensee MDPI, Basel, Switzerland. This article is an open access article distributed under the terms and conditions of the Creative Commons Attribution (CC BY) license (https://creativecommons.org/licenses/by/4.0/).
Share and Cite
Sousa, A.C.; Ferrinho, S.N.; Travassos, B. The Use of Wearable Technologies in the Assessment of Physical Activity in Preschool- and School-Age Youth: Systematic Review. Int. J. Environ. Res. Public Health 2023, 20, 3402. https://doi.org/10.3390/ijerph20043402
Sousa AC, Ferrinho SN, Travassos B. The Use of Wearable Technologies in the Assessment of Physical Activity in Preschool- and School-Age Youth: Systematic Review. International Journal of Environmental Research and Public Health. 2023; 20(4):3402. https://doi.org/10.3390/ijerph20043402
Chicago/Turabian StyleSousa, António C., Susana N. Ferrinho, and Bruno Travassos. 2023. "The Use of Wearable Technologies in the Assessment of Physical Activity in Preschool- and School-Age Youth: Systematic Review" International Journal of Environmental Research and Public Health 20, no. 4: 3402. https://doi.org/10.3390/ijerph20043402
APA StyleSousa, A. C., Ferrinho, S. N., & Travassos, B. (2023). The Use of Wearable Technologies in the Assessment of Physical Activity in Preschool- and School-Age Youth: Systematic Review. International Journal of Environmental Research and Public Health, 20(4), 3402. https://doi.org/10.3390/ijerph20043402