
Comparing Hospital Efficiency: An Illustrative Study of Knee and Hip Replacement Surgeries in Spain

 ,
,
Abstract
1. Introduction
2. Materials and Methods
2.1. Design and Population
2.2. Sources of Information
2.3. Variables
2.4. Main Endpoint: The Metafrontier Malmquist Productivity Index (MMPI)
2.5. Analysis
3. Results
4. Discussion
4.1. Comparisons with Other Studies
4.2. Implications
4.3. Limitations
5. Conclusions
Author Contributions
Funding
Institutional Review Board Statement
Informed Consent Statement
Data Availability Statement
Conflicts of Interest
References
- Walker, K. Improving Hospital Performance and Productivity with the Balanced Scorecard. Available online: https://www.academia.edu/55149350/Improving_Hospital_Performance_and_Productivity_with_the_Balanced_Scorecard (accessed on 27 October 2022).
- Oliveira, H.C.; Rodrigues, L.; Craig, R. Bureaucracy and the balanced scorecard in health care settings. Int. J. Health Care Qual. Assur. 2020, 33, 247–259. [Google Scholar] [CrossRef]
- Shimshak, D.G.; Lenard, M.L.; Klimberg, R.K. Incorporating quality into data envelopment analysis of nursing home performance: A case study. Omega 2009, 37, 672–685. [Google Scholar] [CrossRef] [PubMed]
- Rosenstein, A.H. Health Economics and Resource Management: A Model for Hospital Efficiency-ProQuest. Available online: https://www.proquest.com/openview/58211b6df6fbed974d6776b94cf5a0ca/1?pq-origsite=gscholar&cbl=7080 (accessed on 27 October 2022).
- Maniadakis, N.; Hollingsworth, B.; Thanassoulis, E. The impact of the internal market on hospital efficiency, productivity and service quality. Health Care Manag. Sci. 1999, 2, 75–85. [Google Scholar] [CrossRef] [PubMed]
- Collins, K.F.; Muthusamy, S.K. Applying the Toyota Production System to a Healthcare Organization: A Case Study on a Rural Community Healthcare Provider. Qual. Manag. J. 2007, 14, 41–52. [Google Scholar] [CrossRef]
- Beach Thielst, C.; Gardner, J.H. Clinical Documentation Systems: Another Link Between Technology and Quality-ProQuest. Available online: https://www.proquest.com/openview/0ffa3e61c0118a6a7106fa03faa3cb24/1?pq-origsite=gscholar&cbl=7080 (accessed on 27 October 2022).
- Syam, S.S.; Côté, M.J. A location–allocation model for service providers with application to not-for-profit health care organizations. Omega 2010, 38, 157–166. [Google Scholar] [CrossRef]
- Gorgemans, S.; Comendeiro-Maaløe, M.; Ridao-López, M.; Bernal-Delgado, E. Quality and technical efficiency do not evolve hand in hand in Spanish hospitals: Observational study with administrative data. PLoS ONE 2018, 13, e0201466. [Google Scholar] [CrossRef]
- Arah, O.A.; Westert, G.P.; Hurst, J.P.; Klazinga, N.S. A conceptual framework for the OECD Health Care Quality Indicators Project. Int. J. Qual. Health Care 2006, 18 (Suppl. S1), 5–13. [Google Scholar] [CrossRef]
- Sommersguter-Reichmann, M. Health care quality in nonparametric efficiency studies: A review. Central Eur. J. Oper. Res. 2021, 30, 67–131. [Google Scholar] [CrossRef]
- Sheiner, L.; Malinovskaya, A. Measuring Productivity in Healthcare: An Analysis of the Literature. Hutchins Center on Fiscal & Monetary Policy at Brookings. 2016. Available online: https://www.brookings.edu/wp-content/uploads/2016/08/hp-lit-review_final.pdf (accessed on 30 September 2022).
- Jamison, D.T.; Breman, J.G.; Measham, A.R.; Alleyne, G.; Claeson, M.; Evans, D.B.; Jha, P.; Mills, A.; Musgrove, P. (Eds.) Disease Control Priorities in Developing Countries, 2nd ed.; World Bank: Washington, DC, USA, 2006; Available online: http://www.ncbi.nlm.nih.gov/books/NBK11728/ (accessed on 4 November 2022).
- Ministerio de Sanidad—Annual Hospital Survey (SIAE)-Portal Estadístico del SNS-Registro de Altas de los Hospitales Generales del Sistema Nacional de Salud. CMBD. Norma Estatal. Available online: https://www.sanidad.gob.es/estadEstudios/estadisticas/cmbd.htm (accessed on 9 November 2022).
- Variaciones en Cirugía ortopédica y Traumatológica-Atlas VPM. AtlasVPM. Available online: https://cienciadedatosysalud.org/atlas/ortopedia-2017/ (accessed on 21 November 2022).
- Klopp, G.A. The Analysis of the Efficiency of Productive Systems with Multiple Inputs ans outputs. University of Illinois at Chicago. 1985. Available online: https://www.proquest.com/openview/9ca8cb33d17f4203576cac7589bfdf40/1?pq-origsite=gscholar&cbl=18750&diss=y (accessed on 23 January 2023).
- Färe, R.; Grosskopf, S. Theory and Calculation of Productivity Indexes. In Models and Measurement of Welfare and Inequality; Eichhorn, W., Ed.; Springer: Berlin/Heidelberg, Germany, 1994; pp. 921–940. [Google Scholar]
- Ghith, N.M.; Wagner, P.; Froelich, A.; Merlo, J. Short Term Survival after Admission for Heart Failure in Sweden: Applying Multilevel Analyses of Discriminatory Accuracy to Evaluate Institutional Performance. PLoS ONE 2016, 11, e0148187. [Google Scholar] [CrossRef]
- Elixhauser, A.; Steiner, C.; Harris, D.R.; Coffey, R.M. Comorbidity Measures for Use with Administrative Data. Med. Care 1998, 36, 8–27. [Google Scholar] [CrossRef]
- Iezzoni, L.I. Risk Adjustment for Measuring Health Care Outcomes, 3rd ed.; Health Administration Press: Chicago, IL, USA, 2003. [Google Scholar]
- Caves, D.W.; Christensen, L.R.; Diewert, W.E. The Economic Theory of Index Numbers and the Measurement of Input, Output, and Productivity. Econometrica 1982, 50, 1393–1414. [Google Scholar] [CrossRef]
- Färe, R.; Grosskopf, S.; Roos, P. Productivity and quality changes in Swedish pharmacies. Int. J. Prod. Econ. 1995, 39, 137–144. [Google Scholar] [CrossRef]
- Chen, K.-C.; Chien, L.-N.; Hsu, Y.-H.; Yu, M.-M. Metafrontier frameworks for studying hospital productivity growth and quality changes. Int. J. Qual. Health Care 2016, 28, 650–656. [Google Scholar] [CrossRef] [PubMed]
- Hernández-Aceituno, A.; Ruiz-Álvarez, M.; Llorente-Calderón, R.; Portilla-Fernández, P.; Figuerola-Tejerina, A. Factores de riesgo en artroplastia total y parcial de cadera: Infección y mortalidad. Rev. Esp. Cir. Ortopédica Traumatol. 2021, 65, 239–247. [Google Scholar] [CrossRef]
- Pérez-Romero, C.; Ortega-Díaz, M.I.; Ocaña-Riola, R.; Martín-Martín, J.J. Análisis de la eficiencia técnica en los hospitales del Sistema Nacional de Salud español. Gac. Sanit. 2017, 31, 108–115. [Google Scholar] [CrossRef]
- López, F.R.; Sánchez-Macías, J.I. Especialización y Eficiencia en el Sistema Sanitario Español. Cuad Económicos ICE. Available online: http://www.revistasice.com/index.php/CICE/article/view/5827 (accessed on 23 November 2022).
- Cabello Granado, P.A.; Hidalgo Vega, Á.H. Análisis de la eficiencia hospitalaria por Comunidad Autónoma en el ámbito del Sistema Nacional de Salud. Investig. Reg. 2014, 28, 147–158. [Google Scholar]
- Garcia-Lacalle, J.; Martin, E. Rural vs urban hospital performance in a ‘competitive’ public health service. Soc. Sci. Med. 2010, 71, 1131–1140. [Google Scholar] [CrossRef]
- What We Know About the Efficiency of Spanish Health Care Organisations? A Review of the Economic Literature. Available online: http://jaumepuigjunoy.cat/wp-content/uploads/2017/11/AesXX.pdf (accessed on 23 November 2022).
- Pross, C.; Strumann, C.; Geissler, A.; Herwartz, H.; Klein, N. Quality and resource efficiency in hospital service provision: A geoadditive stochastic frontier analysis of stroke quality of care in Germany. PLoS ONE 2018, 13, e0203017. [Google Scholar] [CrossRef]
- Simar, L.; Wilson, P.W. Estimation and inference in two-stage, semi-parametric models of production processes. J. Econom. 2007, 136, 31–64. [Google Scholar] [CrossRef]
- Pastor, J.T.; Lovell, C.A.K. A global Malmquist productivity index. Econ. Lett. 2005, 88, 266–271. [Google Scholar] [CrossRef]
- Khushalani, J.; Ozcan, Y.A. Are hospitals producing quality care efficiently? An analysis using Dynamic Network Data Envelopment Analysis (DEA). Socio-Econ. Plan. Sci. 2017, 60, 15–23. [Google Scholar] [CrossRef]


| Median | Mean | CI95% | Std. Dev | Min | Max. | |
|---|---|---|---|---|---|---|
| Functioning beds (x1) | 26 | 32.57 | 31.7–33.6 | 23.55 | 4 | 133 |
| FTE traumatologists (x2) | 13.5 | 16.49 | 16.0–17.0 | 11.08 | 1 | 67 |
| TKR or THR (y1) | 225.0 | 283.38 | 274.6–292.1 | 198.25 | 30 | 1165 |
| Traumatology Outpatient visits (y2) | 6687.5 | 8932.16 | 8552.4–9311.9 | 8615.45 | 68 | 123,570 |
| In-hospital risk-adjusted mortality ratio (a1) | 0.001 | 0.9659 | 0.894–1.038 | 1.6379 | 0.001 | 13.14 |
| Hospitals | Group 1 (n = 37) | Group 2 (n = 92) | Group 3 (n = 91) | ||||||
|---|---|---|---|---|---|---|---|---|---|
| Median | Mean | Std. Dev | Median | Mean | Std. Dev | Median | Mean | Std. Dev | |
| Functioning beds (x1) | 12 | 11.7 | 5.73 | 22 | 23.11 | 9.38 | 44 | 50.61 | 25.4 |
| FTE traumatologists (x2) | 7 | 6.57 | 2.39 | 11 | 11.64 | 4.19 | 22 | 25.43 | 11.52 |
| TKR or THR (y1) | 109 | 128.43 | 100.32 | 192.5 | 208.24 | 97.7 | 369 | 422.35 | 215.71 |
| Traumatology Outpatient visits (y2) | 2420 | 2625.5 | 1530.9 | 5244 | 5726.5 | 2,561.4 | 12,139 | 14,737.3 | 10,566.9 |
| In-hospital risk-adjusted mortality (a1) | 0.001 | 0.754 | 2.09 | 0.001 | 0.924 | 1.684 | 0.791 | 1.094 | 1.346 |
| CI (mean)95% | 0.5–1.0 | 0.8–1.0 | 1.0–1.2 | ||||||
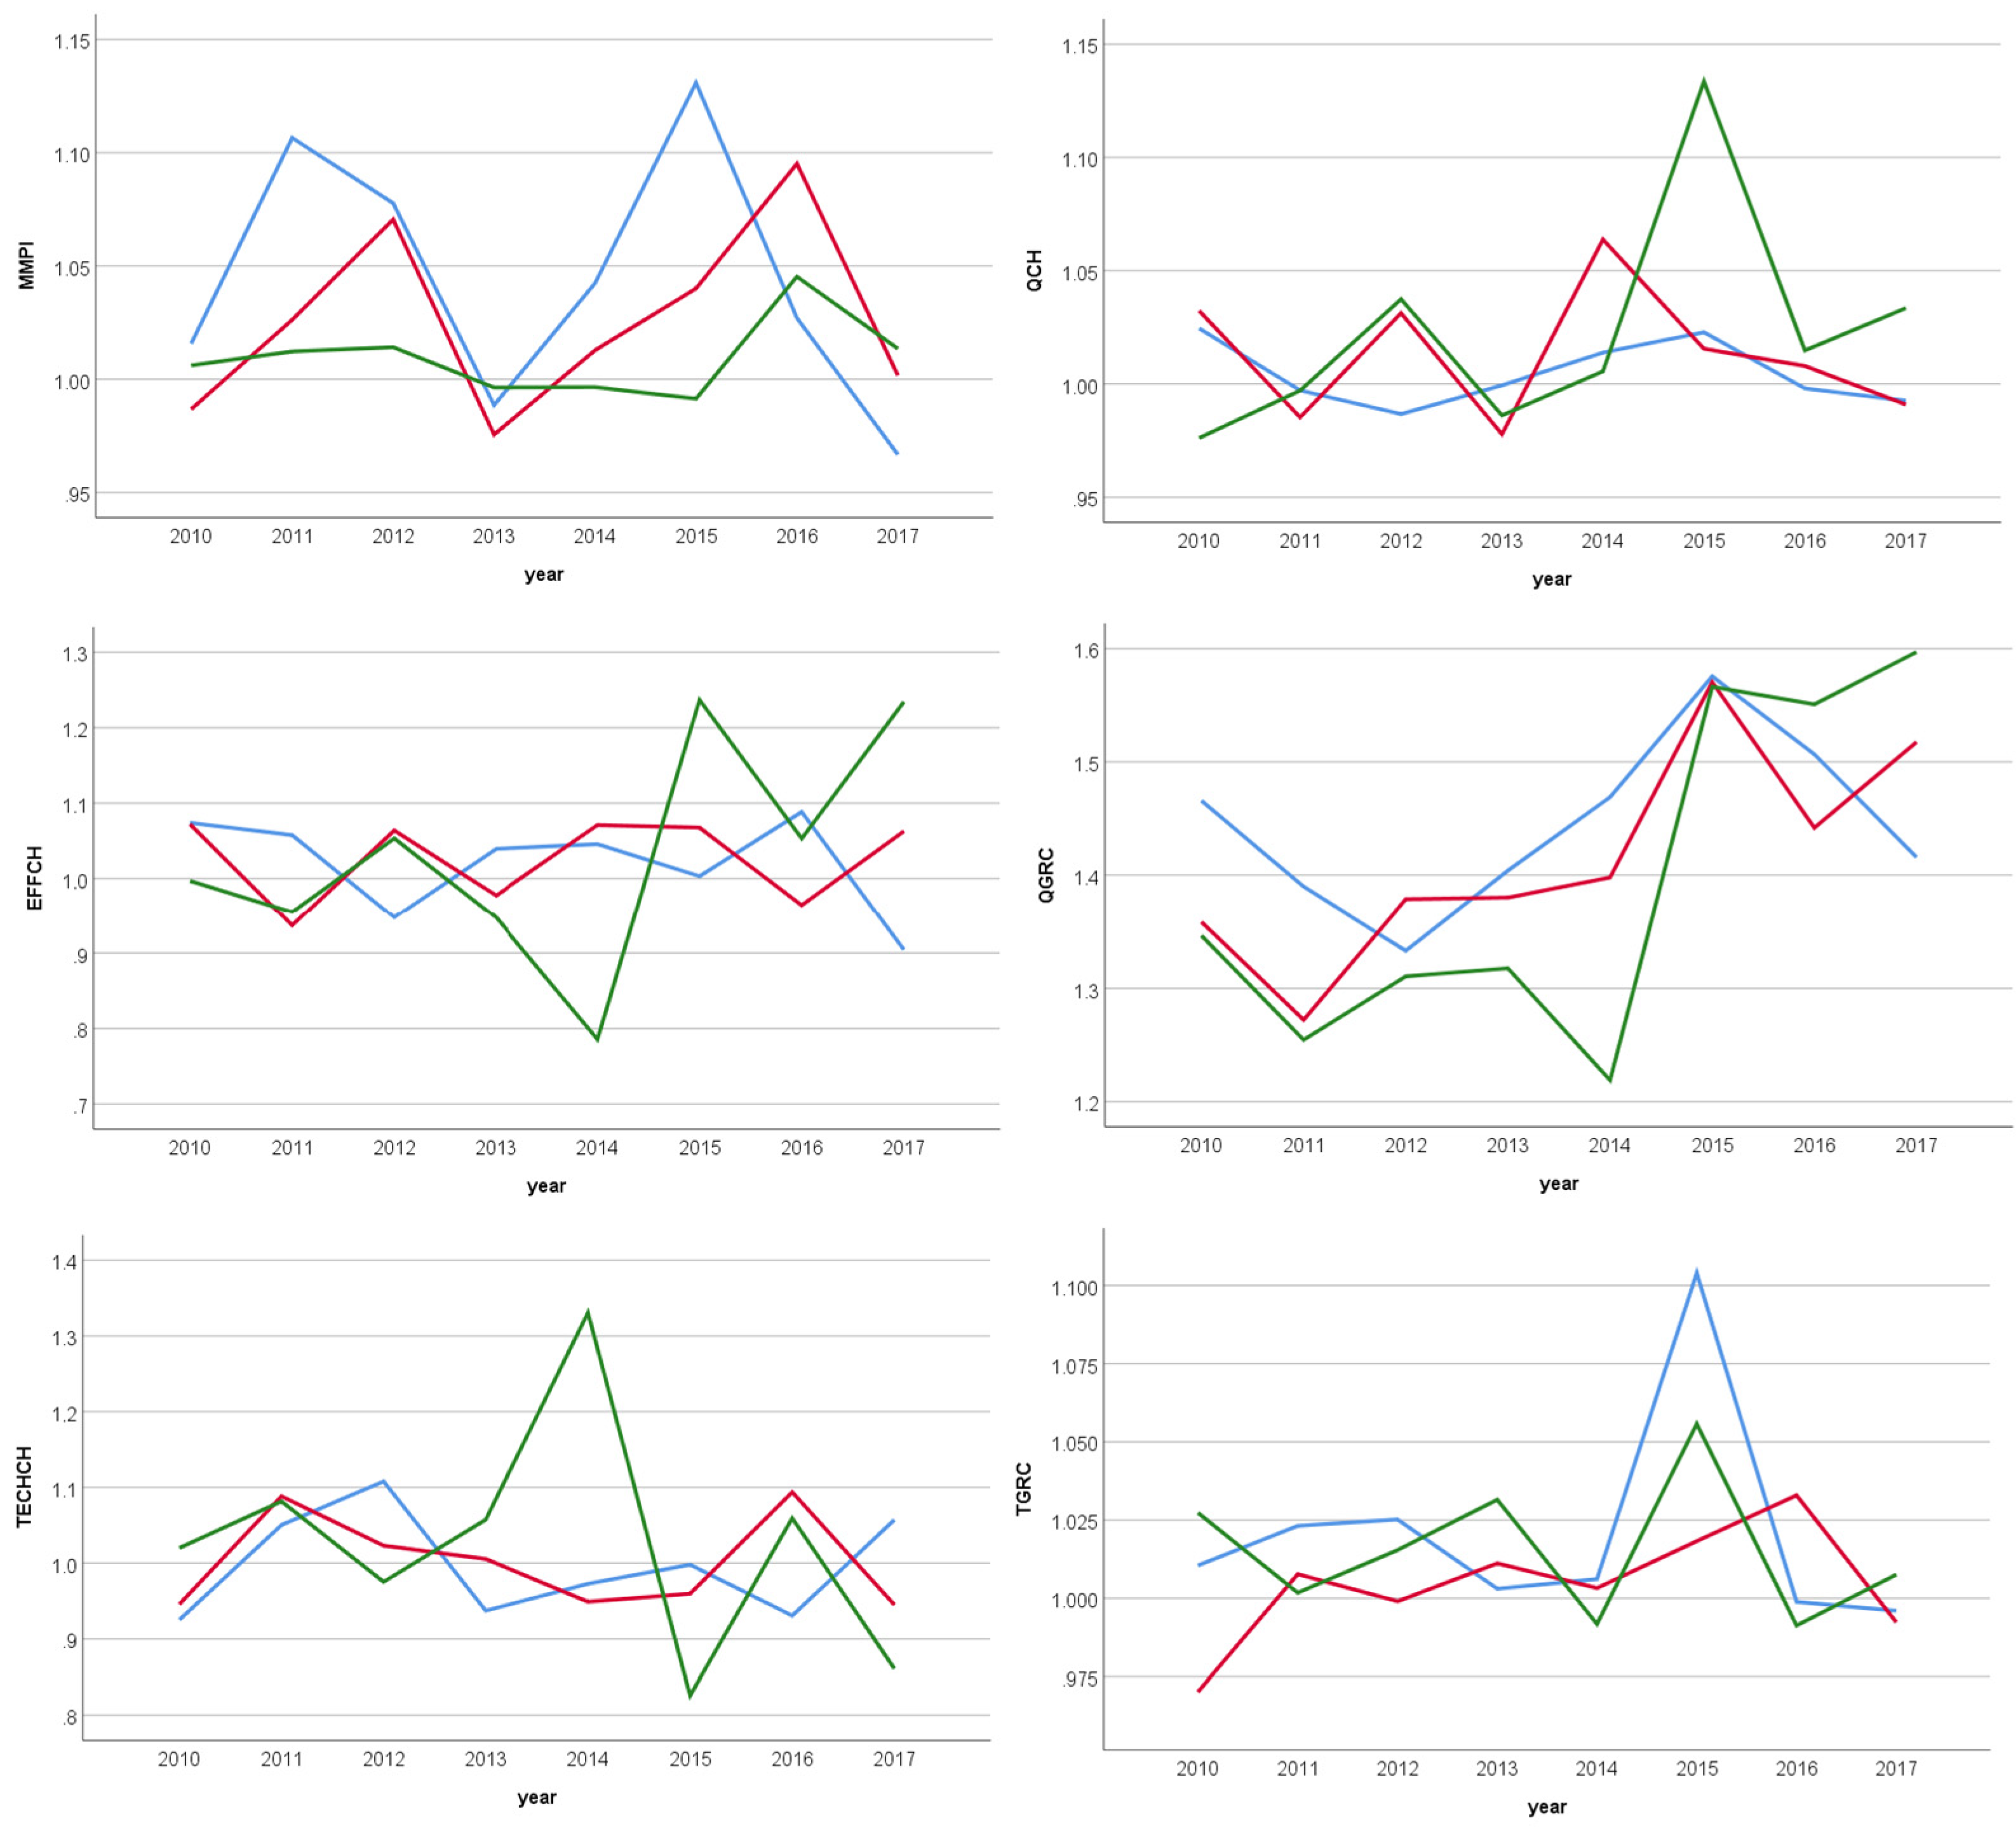
| PANEL A Hospitals Group 1 | 2010–11 | 2011–12 | 2012–13 | 2013–14 | 2014–15 | 2015–16 | 2016–17 | 2017–18 | 2010–18 * |
|---|---|---|---|---|---|---|---|---|---|
| MMPI | 1.016 | 1.106 | 1.078 | 0.988 | 1.042 | 1.131 | 1.027 | 0.967 | 0.986 |
| EFFCH | 1.074 | 1.058 | 0.948 | 1.04 | 1.046 | 1.003 | 1.088 | 0.904 | 0.997 |
| TECHCH | 0.925 | 1.05 | 1.108 | 0.937 | 0.973 | 0.998 | 0.931 | 1.057 | 0.992 |
| TGRC | 1.01 | 1.023 | 1.025 | 1.003 | 1.006 | 1.104 | 0.999 | 0.996 | 0.997 |
| QCH | 1.024 | 0.997 | 0.987 | 0.999 | 1.014 | 1.023 | 0.998 | 0.993 | 0.999 |
| QGRC | 1.466 | 1.39 | 1.333 | 1.404 | 1.469 | 1.575 | 1.507 | 1.416 | 1.398 |
| PANEL B Hospitals Group 2 | 2010–11 | 2011–12 | 2012–13 | 2013–14 | 2014–15 | 2015–16 | 2016–17 | 2017–18 | 2010–18 * |
| MMPI | 0.987 | 1.026 | 1.07 | 0.976 | 1.013 | 1.04 | 1.095 | 1.002 | 0.995 |
| EFFCH | 1.072 | 0.937 | 1.064 | 0.977 | 1.071 | 1.068 | 0.964 | 1.063 | 0.999 |
| TECHCH | 0.946 | 1.088 | 1.023 | 1.005 | 0.949 | 0.96 | 1.094 | 0.945 | 0.997 |
| TGRC | 0.97 | 1.008 | 0.999 | 1.011 | 1.003 | 1.018 | 1.033 | 0.992 | 0.998 |
| QCH | 1.032 | 0.985 | 1.031 | 0.978 | 1.064 | 1.016 | 1.008 | 0.991 | 0.999 |
| QGRC | 1.359 | 1.272 | 1.379 | 1.38 | 1.398 | 1.57 | 1.442 | 1.517 | 1.389 |
| PANEL C Hospitals Group 3 | 2010–11 | 2011–12 | 2012–13 | 2013–14 | 2014–15 | 2015–16 | 2016–17 | 2017–18 | 2010–18 * |
| MMPI | 1.027 | 1.012 | 1.014 | 0.996 | 0.996 | 0.991 | 1.045 | 1.013 | 0.999 |
| EFFCH | 0.997 | 0.955 | 1.053 | 0.947 | 0.786 | 1.237 | 1.053 | 1.243 | 0.986 |
| TECHCH | 1.02 | 1.082 | 0.975 | 1.057 | 1.331 | 0.826 | 1.059 | 0.861 | 1.013 |
| TGRC | 1.006 | 1.002 | 1.015 | 1.031 | 0.992 | 1.056 | 0.991 | 1.008 | 1.001 |
| QCH | 0.976 | 0.997 | 1.037 | 0.986 | 1.006 | 1.134 | 1.015 | 1.033 | 0.995 |
| QGRC | 1.347 | 1.255 | 1.311 | 1.318 | 1.219 | 1.566 | 1.551 | 1.597 | 1.369 |
| Group 1 * | Group 2 * | Group 3 * | p-Value ** | H K-S | |
|---|---|---|---|---|---|
| 2010 | 0.72 | 0.83 | 0.891 | 0.000 | 38.661 |
| 2011 | 0.726 | 0.812 | 0.943 | 0.000 | 87.194 |
| 2012 | 0.682 | 0.799 | 0.945 | 0.000 | 105.91 |
| 2013 | 0.728 | 0.804 | 0.928 | 0.000 | 85.682 |
| 2014 | 0.663 | 0.792 | 0.937 | 0.000 | 105.86 |
| 2015 | 0.58 | 0.642 | 0.961 | 0.000 | 140.03 |
| 2016 | 0.663 | 0.671 | 0.911 | 0.000 | 86.466 |
| 2017 | 0.573 | 0.741 | 0.912 | 0.000 | 104.67 |
| 2018 | 0.709 | 0.817 | 0.906 | 0.000 | 54.891 |
| 2010–18 | 0.672 | 0.768 | 0.926 | 0.000 | 168.67 |
Disclaimer/Publisher’s Note: The statements, opinions and data contained in all publications are solely those of the individual author(s) and contributor(s) and not of MDPI and/or the editor(s). MDPI and/or the editor(s) disclaim responsibility for any injury to people or property resulting from any ideas, methods, instructions or products referred to in the content. |
© 2023 by the authors. Licensee MDPI, Basel, Switzerland. This article is an open access article distributed under the terms and conditions of the Creative Commons Attribution (CC BY) license (https://creativecommons.org/licenses/by/4.0/).
Share and Cite
Gorgemans, S.; Comendeiro-Maaløe, M.; Ridao-López, M.; Bernal-Delgado, E. Comparing Hospital Efficiency: An Illustrative Study of Knee and Hip Replacement Surgeries in Spain. Int. J. Environ. Res. Public Health 2023, 20, 3389. https://doi.org/10.3390/ijerph20043389
Gorgemans S, Comendeiro-Maaløe M, Ridao-López M, Bernal-Delgado E. Comparing Hospital Efficiency: An Illustrative Study of Knee and Hip Replacement Surgeries in Spain. International Journal of Environmental Research and Public Health. 2023; 20(4):3389. https://doi.org/10.3390/ijerph20043389
Chicago/Turabian StyleGorgemans, Sophie, Micaela Comendeiro-Maaløe, Manuel Ridao-López, and Enrique Bernal-Delgado. 2023. "Comparing Hospital Efficiency: An Illustrative Study of Knee and Hip Replacement Surgeries in Spain" International Journal of Environmental Research and Public Health 20, no. 4: 3389. https://doi.org/10.3390/ijerph20043389
APA StyleGorgemans, S., Comendeiro-Maaløe, M., Ridao-López, M., & Bernal-Delgado, E. (2023). Comparing Hospital Efficiency: An Illustrative Study of Knee and Hip Replacement Surgeries in Spain. International Journal of Environmental Research and Public Health, 20(4), 3389. https://doi.org/10.3390/ijerph20043389