Article

Equity of Elderly Care Facility Allocation in a Multi-Ethnic City under the Aging Background

1
Faculty of Business Administration, Osaka University of Economics, Osaka 533-8533, Japan
2
School of Architecture, Tianjin University, Tianjin 300072, China
3
Faculty of Food Science and Engineering, Kunming University of Science and Technology, Kunming 650500, China
*
Authors to whom correspondence should be addressed.
Int. J. Environ. Res. Public Health 2023, 20(4), 3291; https://doi.org/10.3390/ijerph20043291
Submission received: 16 November 2022 / Revised: 19 January 2023 / Accepted: 10 February 2023 / Published: 13 February 2023
(This article belongs to the Special Issue Age-Friendly Health System: Determinants, Needs and Services)

Abstract

:
Societal concerns in ethnic minority areas are global issues. Paying close attention to the equitable allocation of social resources in an aging population is crucial to preserving the cultural diversity and social stability of multi-ethnic countries. This study took a multi-ethnic city—Kunming (KM), China—as an example. The population aging and the comprehensive service level of elderly care institutions at the township (subdistrict) scale were evaluated to discuss the equity of elderly care facility allocation. This study revealed that the overall convenience of elderly care institutions was low. The coupling coordination between the degree of aging and the service level of elderly care institutions in the majority of areas in KM showed poor adaptation. There is spatial differentiation in population aging and an imbalanced distribution of elderly care facilities and relevant service facilities among ethnic minority communities and other areas in KM. We also attempted to provide optimization recommendations for existing problems. This study, on the degree of population aging, the service level of elderly care institutions, and the degree of coupling coordination between them at the township (subdistrict) scale, offers a theoretical foundation for planning elderly care facilities in multi-ethnic cities.

1. Introduction

Aging is a trend of population development and a long-term challenge worldwide, especially for populous countries, such as China. The seventh National Census of China in 2021 indicated that the number of individuals aged 60 and above reached 260 million, representing 18.70% of the total population [1]. With the continuously increasing aging population, the demand for elderly services has increased, bringing new challenges to China’s elderly care system. The degree of coupling coordination between the supply of elderly care resources and the degree of population aging is connected to the allocation efficiency of social-related resources and whether or not the elderly have equitable access to elderly care services.
Relevant research has demonstrated a correlation between the economic development of nations or regions and the equity of the distribution of elderly care facilities [2]. China is a country with a sizable population and 56 different ethnic groups. As most of the population belongs to the Han ethnic group, China’s other 55 ethnic groups are considered ethnic minorities. Unlike in the developed areas in China, most multi-ethnic areas show significant supply-and-demand mismatches in elderly care resources and difficulty in providing elderly care services because of their underdeveloped economic conditions, unique geographic position, cultural background, and autonomous system. For example, according to the Ethnic and Religious Affairs Commission of Yunnan Province [3], in 2021, the per capita disposable income of permanent rural residents in ethnic autonomous areas of Yunnan Province was CNY 14,166, much less than the per capita disposable income of Yunnan residents (CNY 25,666) in 2021. Studying population aging, assessing the spatial distribution of elderly care institutions and infrastructure, and analyzing the service quality of elderly care institutions could help in developing a valid strategy for allocating elderly care resources rationally and dealing with population aging effectively.
Researchers from many countries have studied the spatial planning of elderly care institutions and have proposed optimization strategies. Japanese researchers analyzed the spatial distribution of the local elderly population in detail and investigated care facilities for the elderly [4] and the living environment of elderly individuals that live alone [5] and then proposed aging-friendly optimization strategies in terms of daily living facilities for the elderly, street-related facilities, public transportation facilities, hospital beds, and disaster response [6,7,8,9]. Western researchers also proposed the healthcare desert theory [10], which illustrates the correlation between the level of medical services and the distribution of the aging population and explores the impact of accessibility to public facilities [11] and medical facilities [12] based on the regional population. Chinese researchers explored the application and effect of GIS in solving the aging problem [13]. The spatial distribution of elderly care resources in different provinces and cities [14,15,16,17,18,19] was analyzed to explore reasonable planning solutions for elderly facilities. Moreover, some researchers evaluated the accessibility of living service facilities [20,21,22], parks and green spaces [23], and medical facilities [24] in different provinces and cities and explored the coordination between supply and demand and the rationality of the allocation of living service facilities for the elderly population. Studies on the elderly populations of ethnic minorities in China have also been carried out. Chinese scholars explored the relationship between social support and life satisfaction among the elderly of ethnic minorities [25] and evaluated their health-related quality of life (Yi) in Yunnan [26]. However, the discussion on the equality of the allocation of elderly facilities in multi-ethnic cities is limited.
This study evaluated the degree of population aging, the level of basic services, and the convenience of living in elder care institutions in KM at the township (subdistrict) scale. The equity of the distribution of elderly care facilities in ethnic minority communities and other areas in KM was discussed, and optimization suggestions were also proposed.

2. Materials and Methods

2.1. Study Area

The study area in this study covered seven districts (Wuhua (WH) District, Panlong (PL) District, Guandu (GD) District, Xishan (XS) District, Dongchuan (DC) District, Chenggong (CG) District, and Jinning (JN) District), three counties (Fumin (FM) County, Yiliang (YL) County, and Songming (SM) County), three autonomous counties (Shilin (SL) Autonomous County, Luquan (LQ) Autonomous County, and Xundian (XD) Autonomous County), and one county-level city (Anning (AN)) in KM. The abbreviations of all administrative districts and townships mentioned in our article are listed in Table A1. As the provincial capital of Yunnan Province, KM is an important central city in western China, with an area of approximately 21,000 square kilometers, including 3 autonomous ethnic minority counties, 4 ethnic minority townships, and 2196 villages with populations of a mixed ethnic origin. The population of ethnic minorities is 1.3 million, accounting for 18.9% of the city’s population, and ethnic minority communities comprise 57% of the city’s land area. Three autonomous counties and four ethnic townships constitute the main ethnic minority communities. Twenty-four ethnic minority groups live in LQ Autonomous County, accounting for 29.95% of the total population. Twenty-six ethnic minority groups live in SL Autonomous County, and the ethnic minority population accounts for 33.52% of the total population. Twenty-seven ethnic minority groups are concentrated in XD Autonomous County, accounting for 22.46% of the total population. As the city with the largest number of ethnic autonomous areas and the largest number of hereditary ethnic components among the provincial capitals in China (Figure 1), population aging in ethnic minority communities is a focus issue for KM, alongside aging in the general population.

2.2. Data

2.2.1. Data Sources

This study was based on data from the seventh population census conducted by the KM Bureau of Statistics. The evaluation indices associated with population aging, including the proportion of different age groups and the elderly dependency ratio, were calculated. Web crawler technology was used to crawl the data of elderly care institutions and point of interest (POI) facilities and information on the walking paths of elderly care facilities to surrounding POI services from the websites of “linkolder”, “Elderly Care Information Network”, and “AMAP”. Compared with the previous spatial accessibility evaluation standard, which is based on spatial distance, this study used the AMAP open platform and time accessibility as the evaluation standard, which is closer to the reality of residents’ daily routines. AMAP is currently the largest digital map platform in China and has the most advanced transportation algorithm. It has world-leading accuracy in calculations. The specific method utilized is as follows: use the path planning tool of AMAP, select the “walking” mode of travel, take each elderly care institution as the starting point, take each POI service facility as the end point, and input the corresponding coordinates into the program to obtain the time needed to reach each POI from each elderly care facility, and then carry out statistical analysis. After data cleaning and calculation, ArcGIS (10.8) was used to evaluate the comprehensive service level of elderly care institutions in KM by analyzing the fundamental service level and living convenience.

2.2.2. Web Crawler Technology

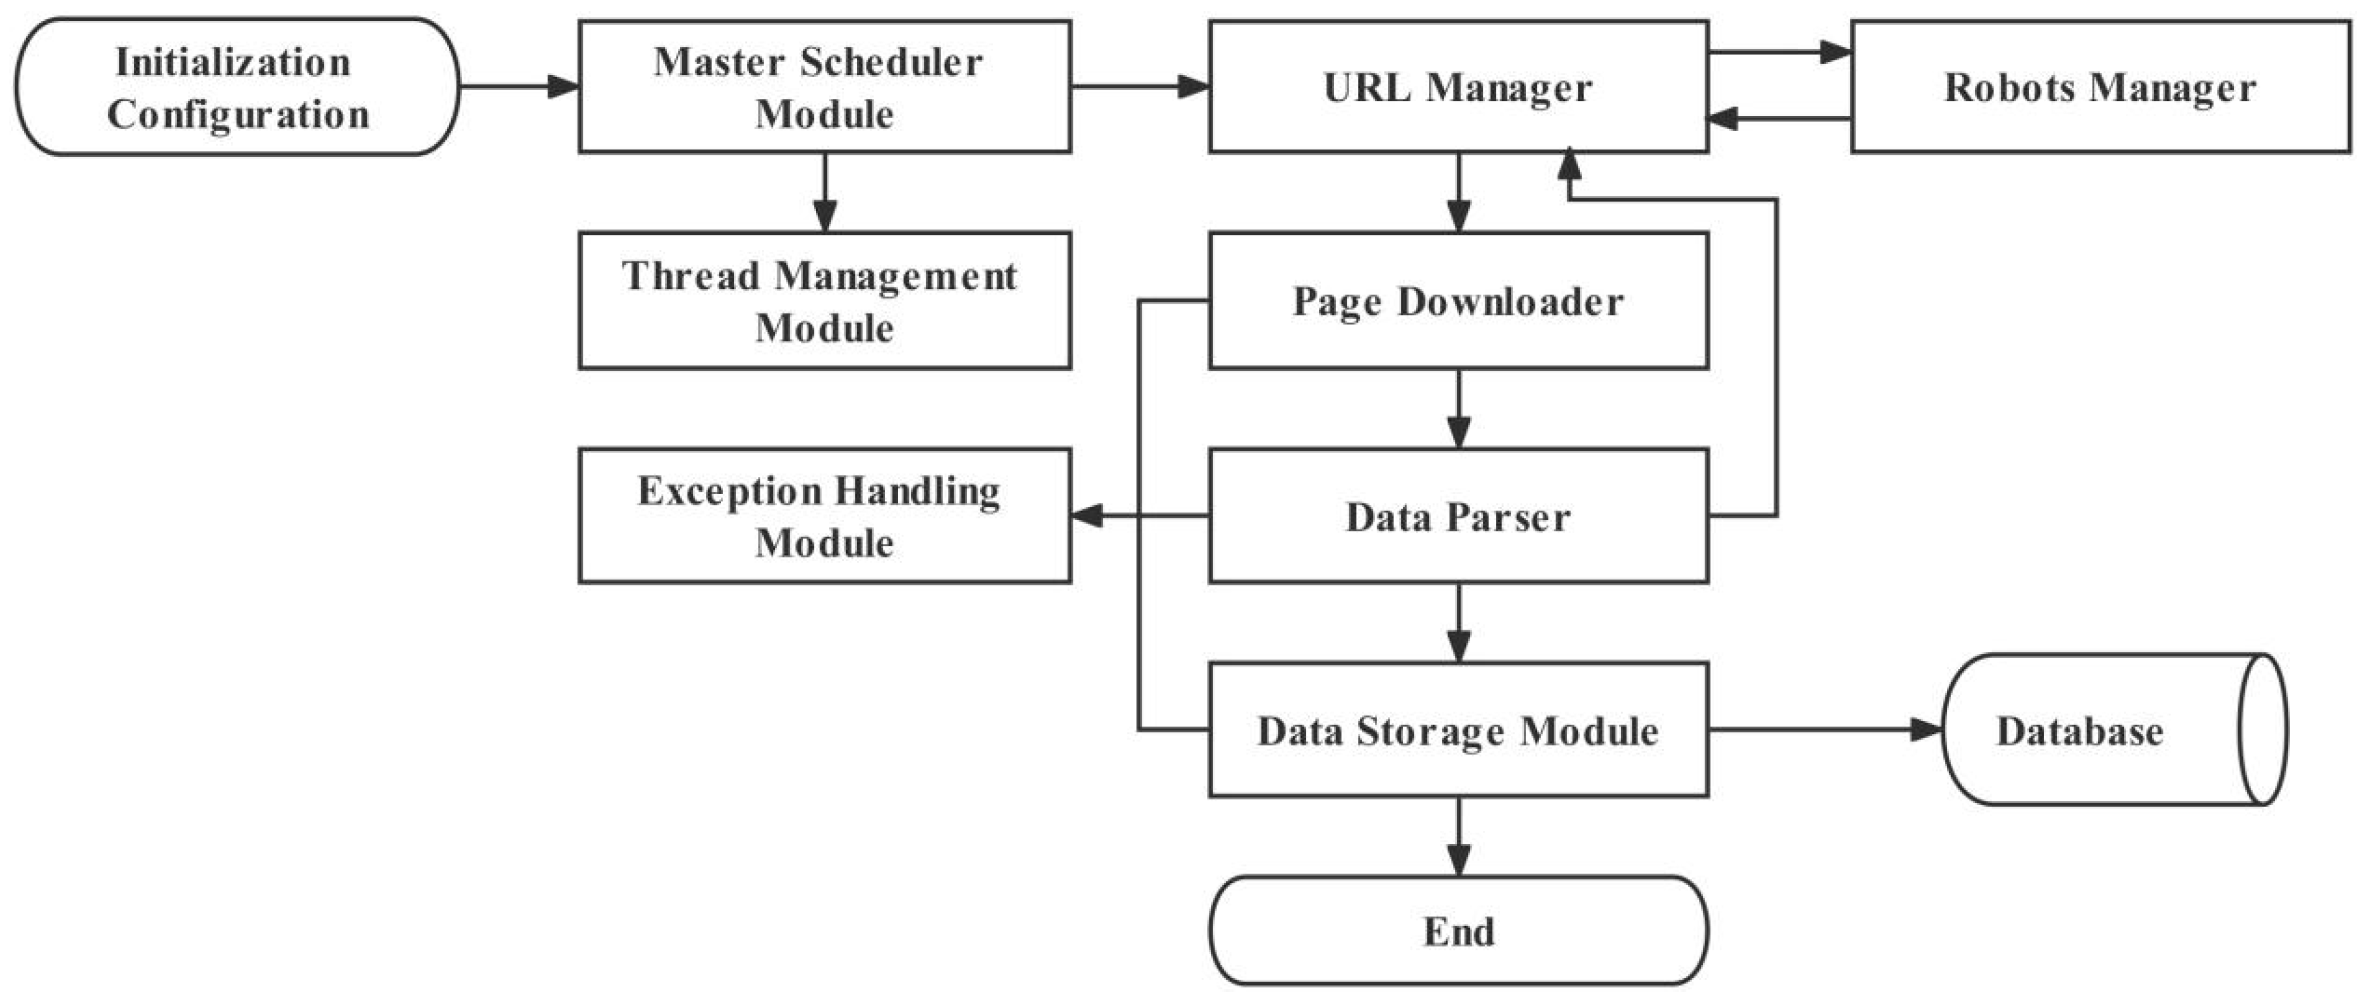
The web crawler system [27] consists of eight functional parts: system scheduling, URL link management, web page download, web page parsing, data storage, robot management, thread management, and risk management. Figure 2 depicts the flow chart of web information crawling in this study.

2.2.3. Entropy Method

Information entropy can be used to calculate the objective weights of each index to avoid bias caused by subjective evaluation. This study used the entropy method to calculate the weights of the evaluation indices of the degree of aging and the service level of elderly care institutions. The specific calculation formula [28] is as follows:
S j = j m W j P ij × 100 ,
where Sj is the composite score of the jth indicator, Wj refers to the weight of indication, and Pij represents the weight of indication in the ith area.

2.2.4. Space Adaptation Analysis

The coupling coordination model involves a coupling degree—C, coordination degree—D, and coordination index—T, which indicate the level of coupling coordination between two or more systems. This study investigated the adaptation degree between the degree of population aging and the service levels of elderly care institutions. The obtained data were first normalized to eliminate the difference in quantitative units between the two systems, thus ensuring the trustworthiness of the analysis results. The calculation formula [29] is as follows:
Χ i = { X i X min X max X min X max X i X max X min
where Χ i and Xi represent the values before and after data normalization, respectively, and Xmin and Xmax correspond to the minimum and maximum values in the sample data, respectively.
C represents the system’s coupling degree, which can be calculated using Formulas (3) and (4).
U i = j = 1 n ij X ij   , j = 1 n = 1 ,   i = 1 , 2 ,
where Ui is the comprehensive evaluation index, U1 corresponds to the comprehensive score for the degree of population aging, U2 is the comprehensive score for the service level of elderly care institutions, and ij corresponds to the weight of each index.
C = 2 ( U 1 U 2 ) U 1 + U 2 ,
When C = 0, no correlation is found between the involved systems. The correlation between the systems increases as C increases. When C = 1, the involved systems show the highest degree of coupling.
The coupling coordination degree model was introduced to further evaluate the coordination between the two systems (i.e., the degree of population aging and the service level of elderly care institutions). The formulas of the coupling coordination degree model are as follows:
D = C × T
T = aU a × bU S ,   a + b = 1
where D represents the coupling coordination degree, C is the coupling degree, and T corresponds to the comprehensive evaluation index of the degree of population aging and the service level of elderly care institutions, which is determined based on U a and U S . a and b in Formula (6) refer to the evolution indices of U a and U S , respectively.
In order to visually describe the adaptation between the service level of elderly care institutions and the degree of population aging, the level of the coupling coordination degree was rated on a scale of 0–10 (Table A2). All statistical analyses in this study were carried out using SPSS statistics 23.0.

3. Results and Discussion

3.1. Degree of Population Aging

There are nearly 1.22 million people over 60-years-old in KM, accounting for 14.40% of the total population. The number of people over 65-years-old is almost 890,000, accounting for 10.45% of the total population, which indicates that KM has entered a mild aging stage. The current status of population aging in the city of KM was further investigated. The visualized data suggest a significant difference in the population aging level between ethnic minority communities and other areas in KM. The distribution regularities are summarized as follows.

3.1.1. Low Population Aging but High Density of the Elderly Population in Central Urban Areas

As illustrated in Figure 3, compared with other administrative regions at the same level, the central urban areas of KM showed lower population aging. The number of individuals aged 60 or older in the majority of townships (subdistricts) in the three central urban areas (WH District, XS District, and PL District) of KM exceeded 10% of the total population, entering the stage of light aging. The number of individuals aged 60 or older in the majority of townships (subdistricts) in the GD District (one of the central urban areas) did not reach 10% of the total population, which suggests that it has not yet entered the aging stage. In a small part of the First Ring Road, the over-60-year-old population accounted for more than 20% of the total population, demonstrating that it was entering a moderate aging stage.
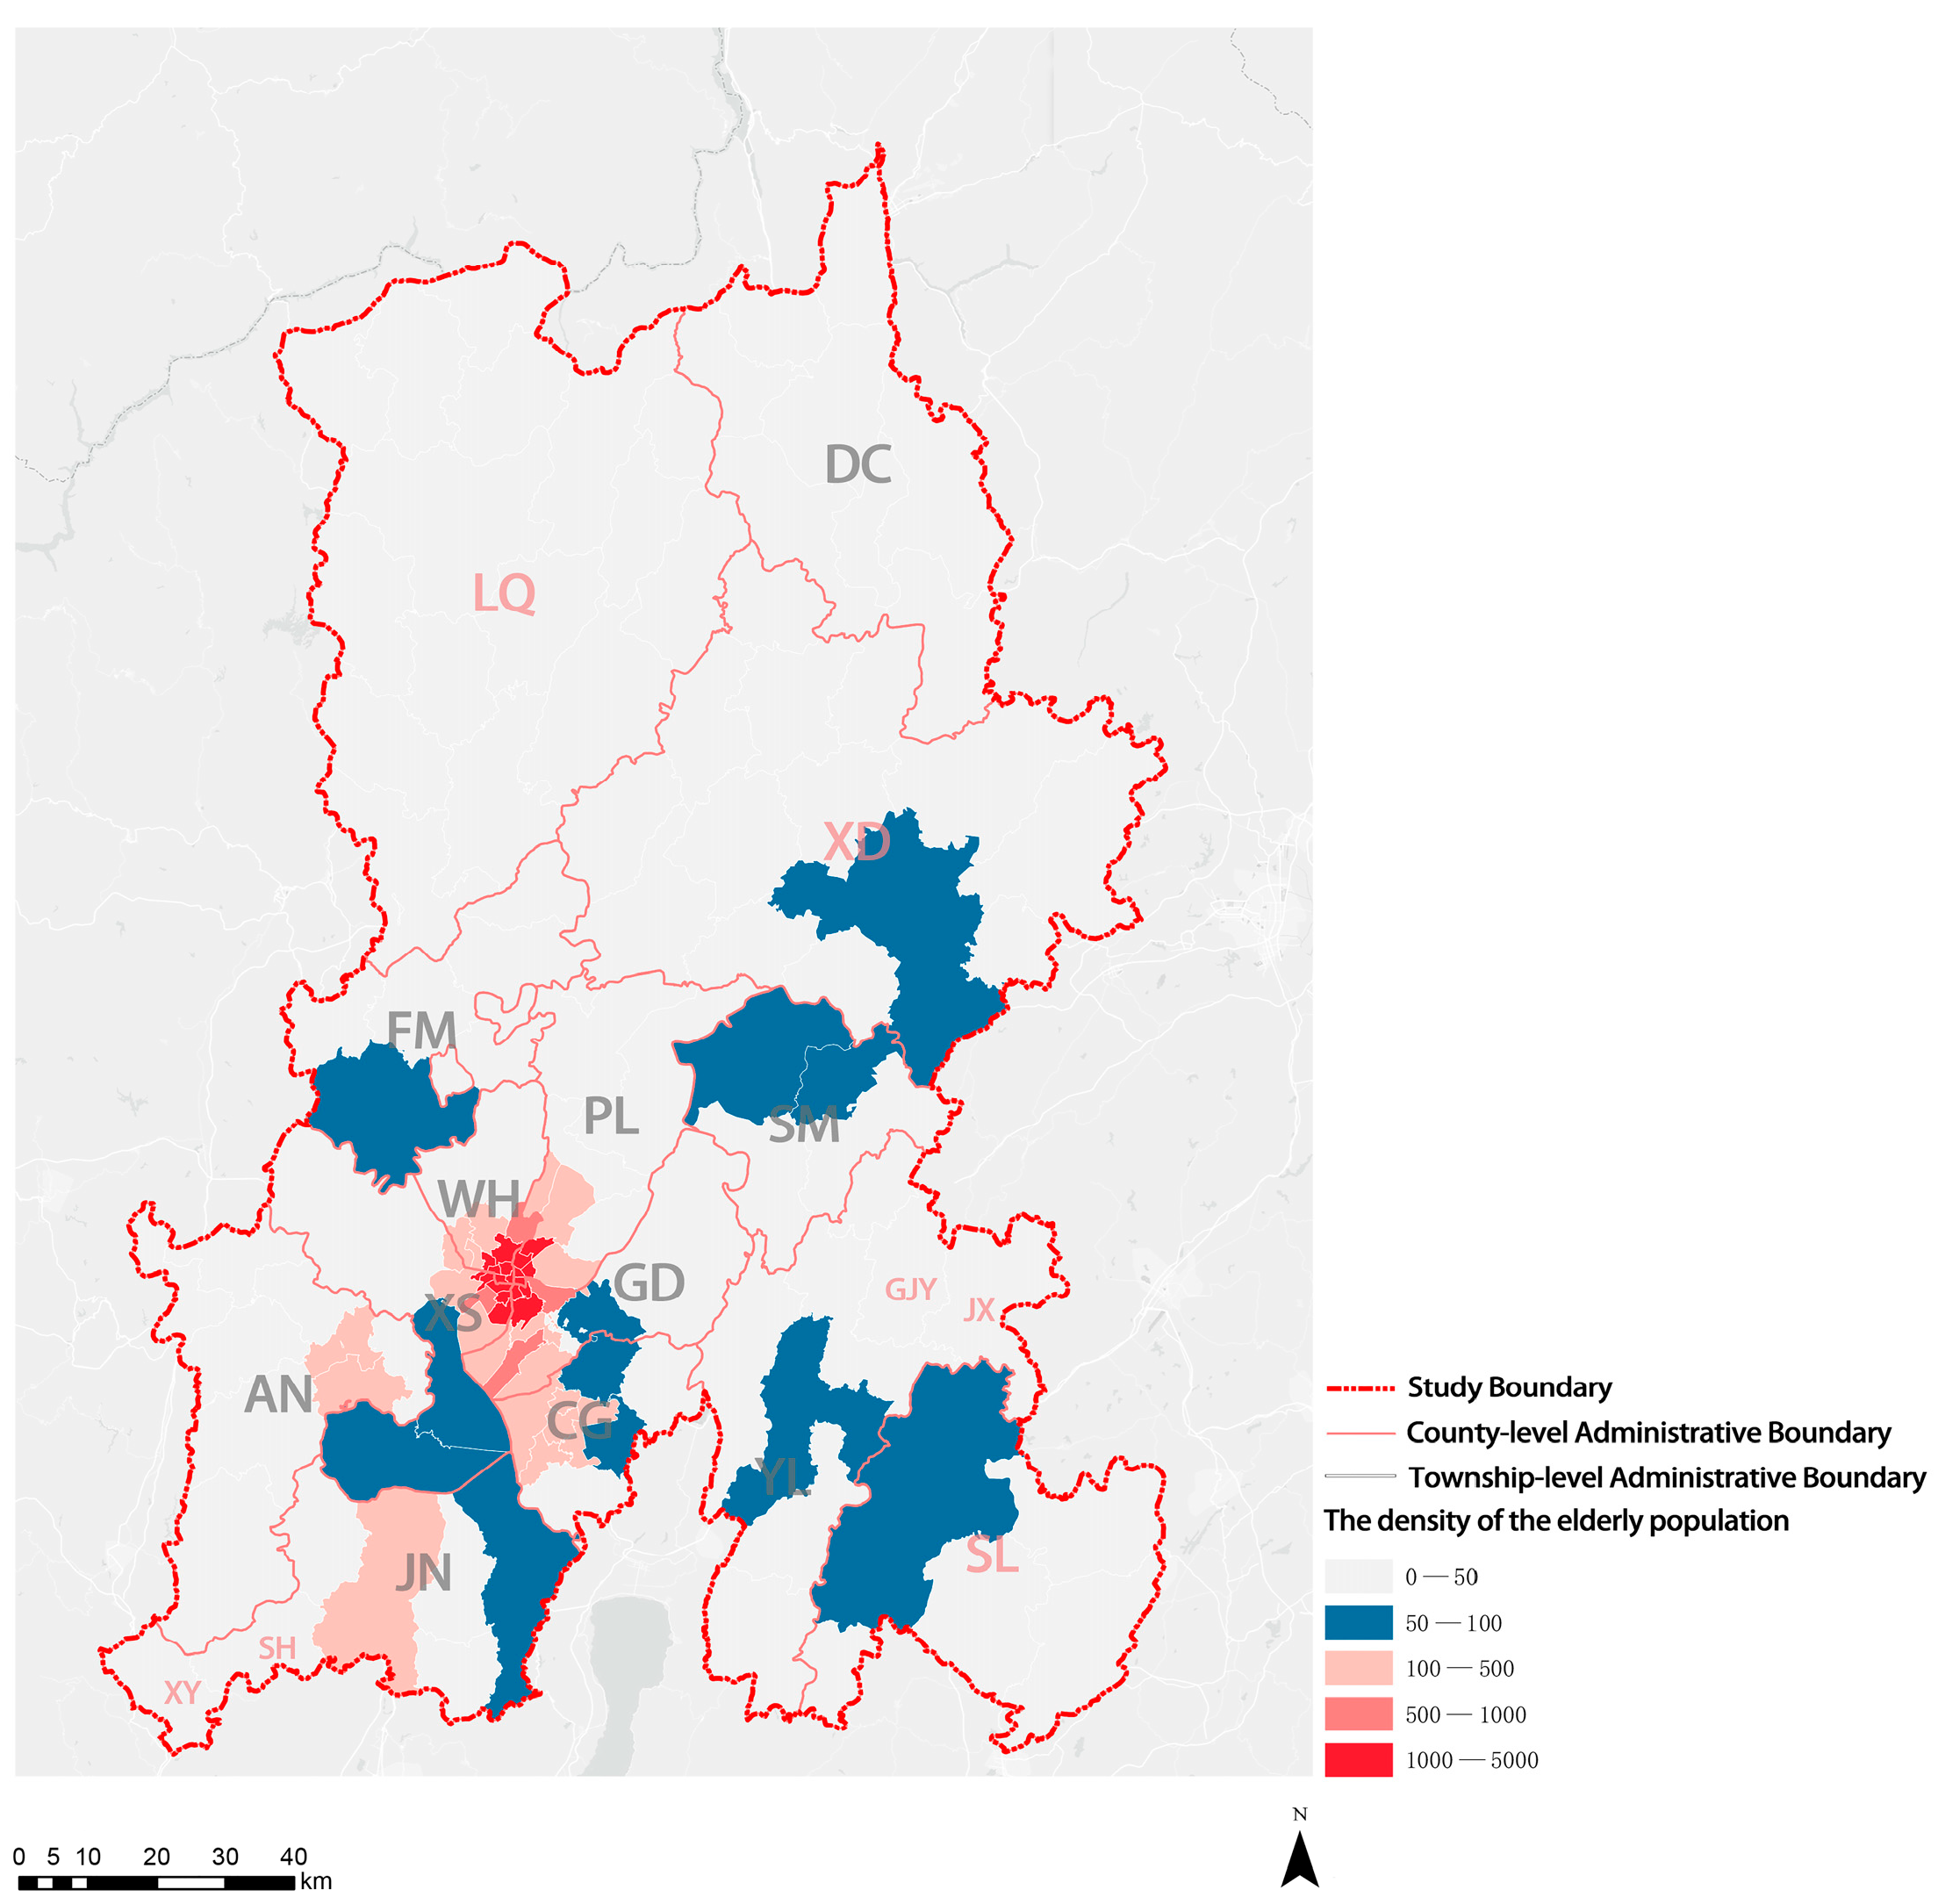
The density of the elderly population is an important index used to evaluate the spatial difference in population aging. Given the shortage of land in the central area of KM, the urban service function is highly concentrated, and the number of elderly individuals per unit area increases accordingly. Therefore, the urban service function and the density of the elderly population were high in the center and low in the surrounding areas (Figure 4).

3.1.2. High Degree of Population Aging and High Dependency Burden for the Working Population in Ethnic Minority Communities

Overall, the rate of population aging was higher in ethnic minority communities than in other areas in KM. LQ Autonomous County had the highest degree of aging of the three autonomous counties. Except for three townships (subdistricts), the number of individuals aged 60 or older in townships (subdistricts) of LQ Autonomous County exceeded 20% of the total population, showing moderate aging. In addition, one township in XD Autonomous County and SL Autonomous County and four ethnic townships in KM had entered mild aging.
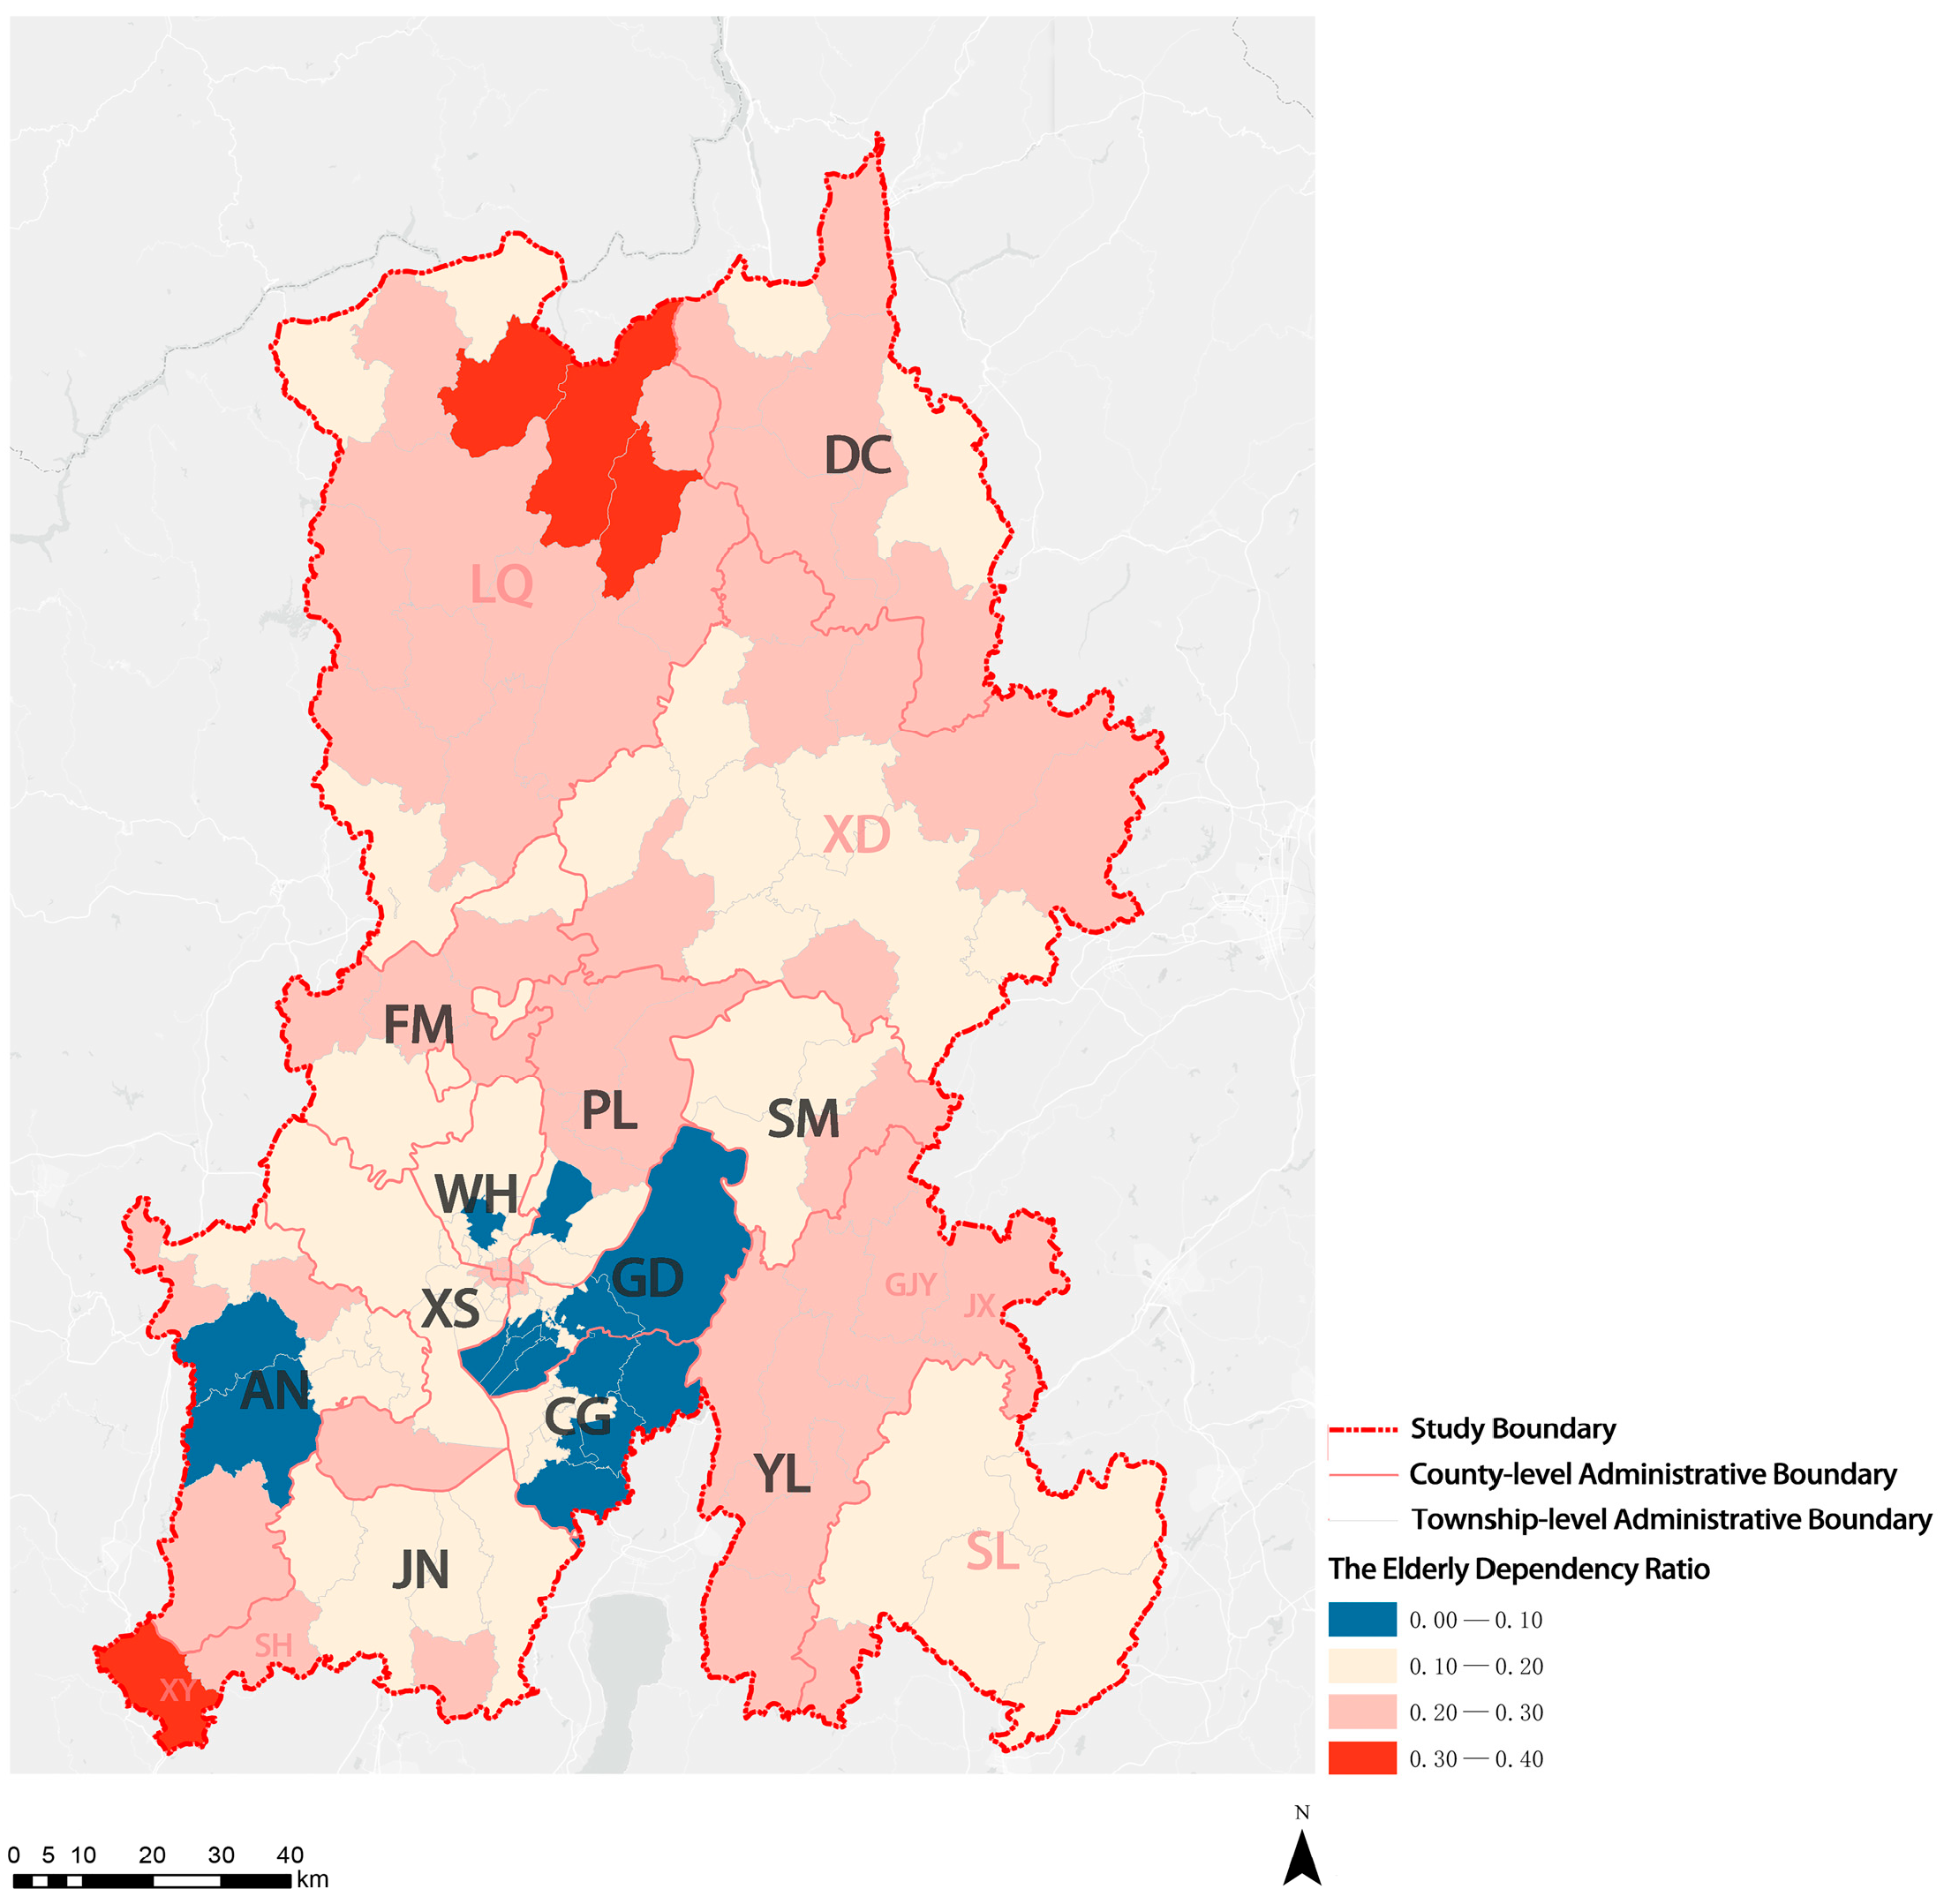
The elderly dependency ratio is an indicator that reflects the social consequences of population aging from an economic perspective. A higher elderly dependency ratio means the working population supports more elderly dependents per capita. In other words, a high elderly dependency ratio signifies a heavier dependency burden on the working population. As shown in Figure 5, the elderly dependency ratio varied between ethnic minority communities and other areas. The mean value of the elderly dependency ratio in all townships (subdistricts) in KM was 0.18. The mean value of the elderly dependency ratio in ethnic minority communities was 0.22, which is higher than that in other areas (0.17). The XY ethnic township and three townships in the LQ Autonomous County had high elderly dependency ratios, with three young persons for every elderly person needed to provide sufficient support.

3.2. Service Level of Elderly Care Institutions

In this study, on the basis of open data, the fundamental service level and the convenience degree of elderly care institutions were analyzed, providing a comprehensive evaluation of the service level of elderly care institutions in KM.

3.2.1. Status of Elderly Care Institutions in KM

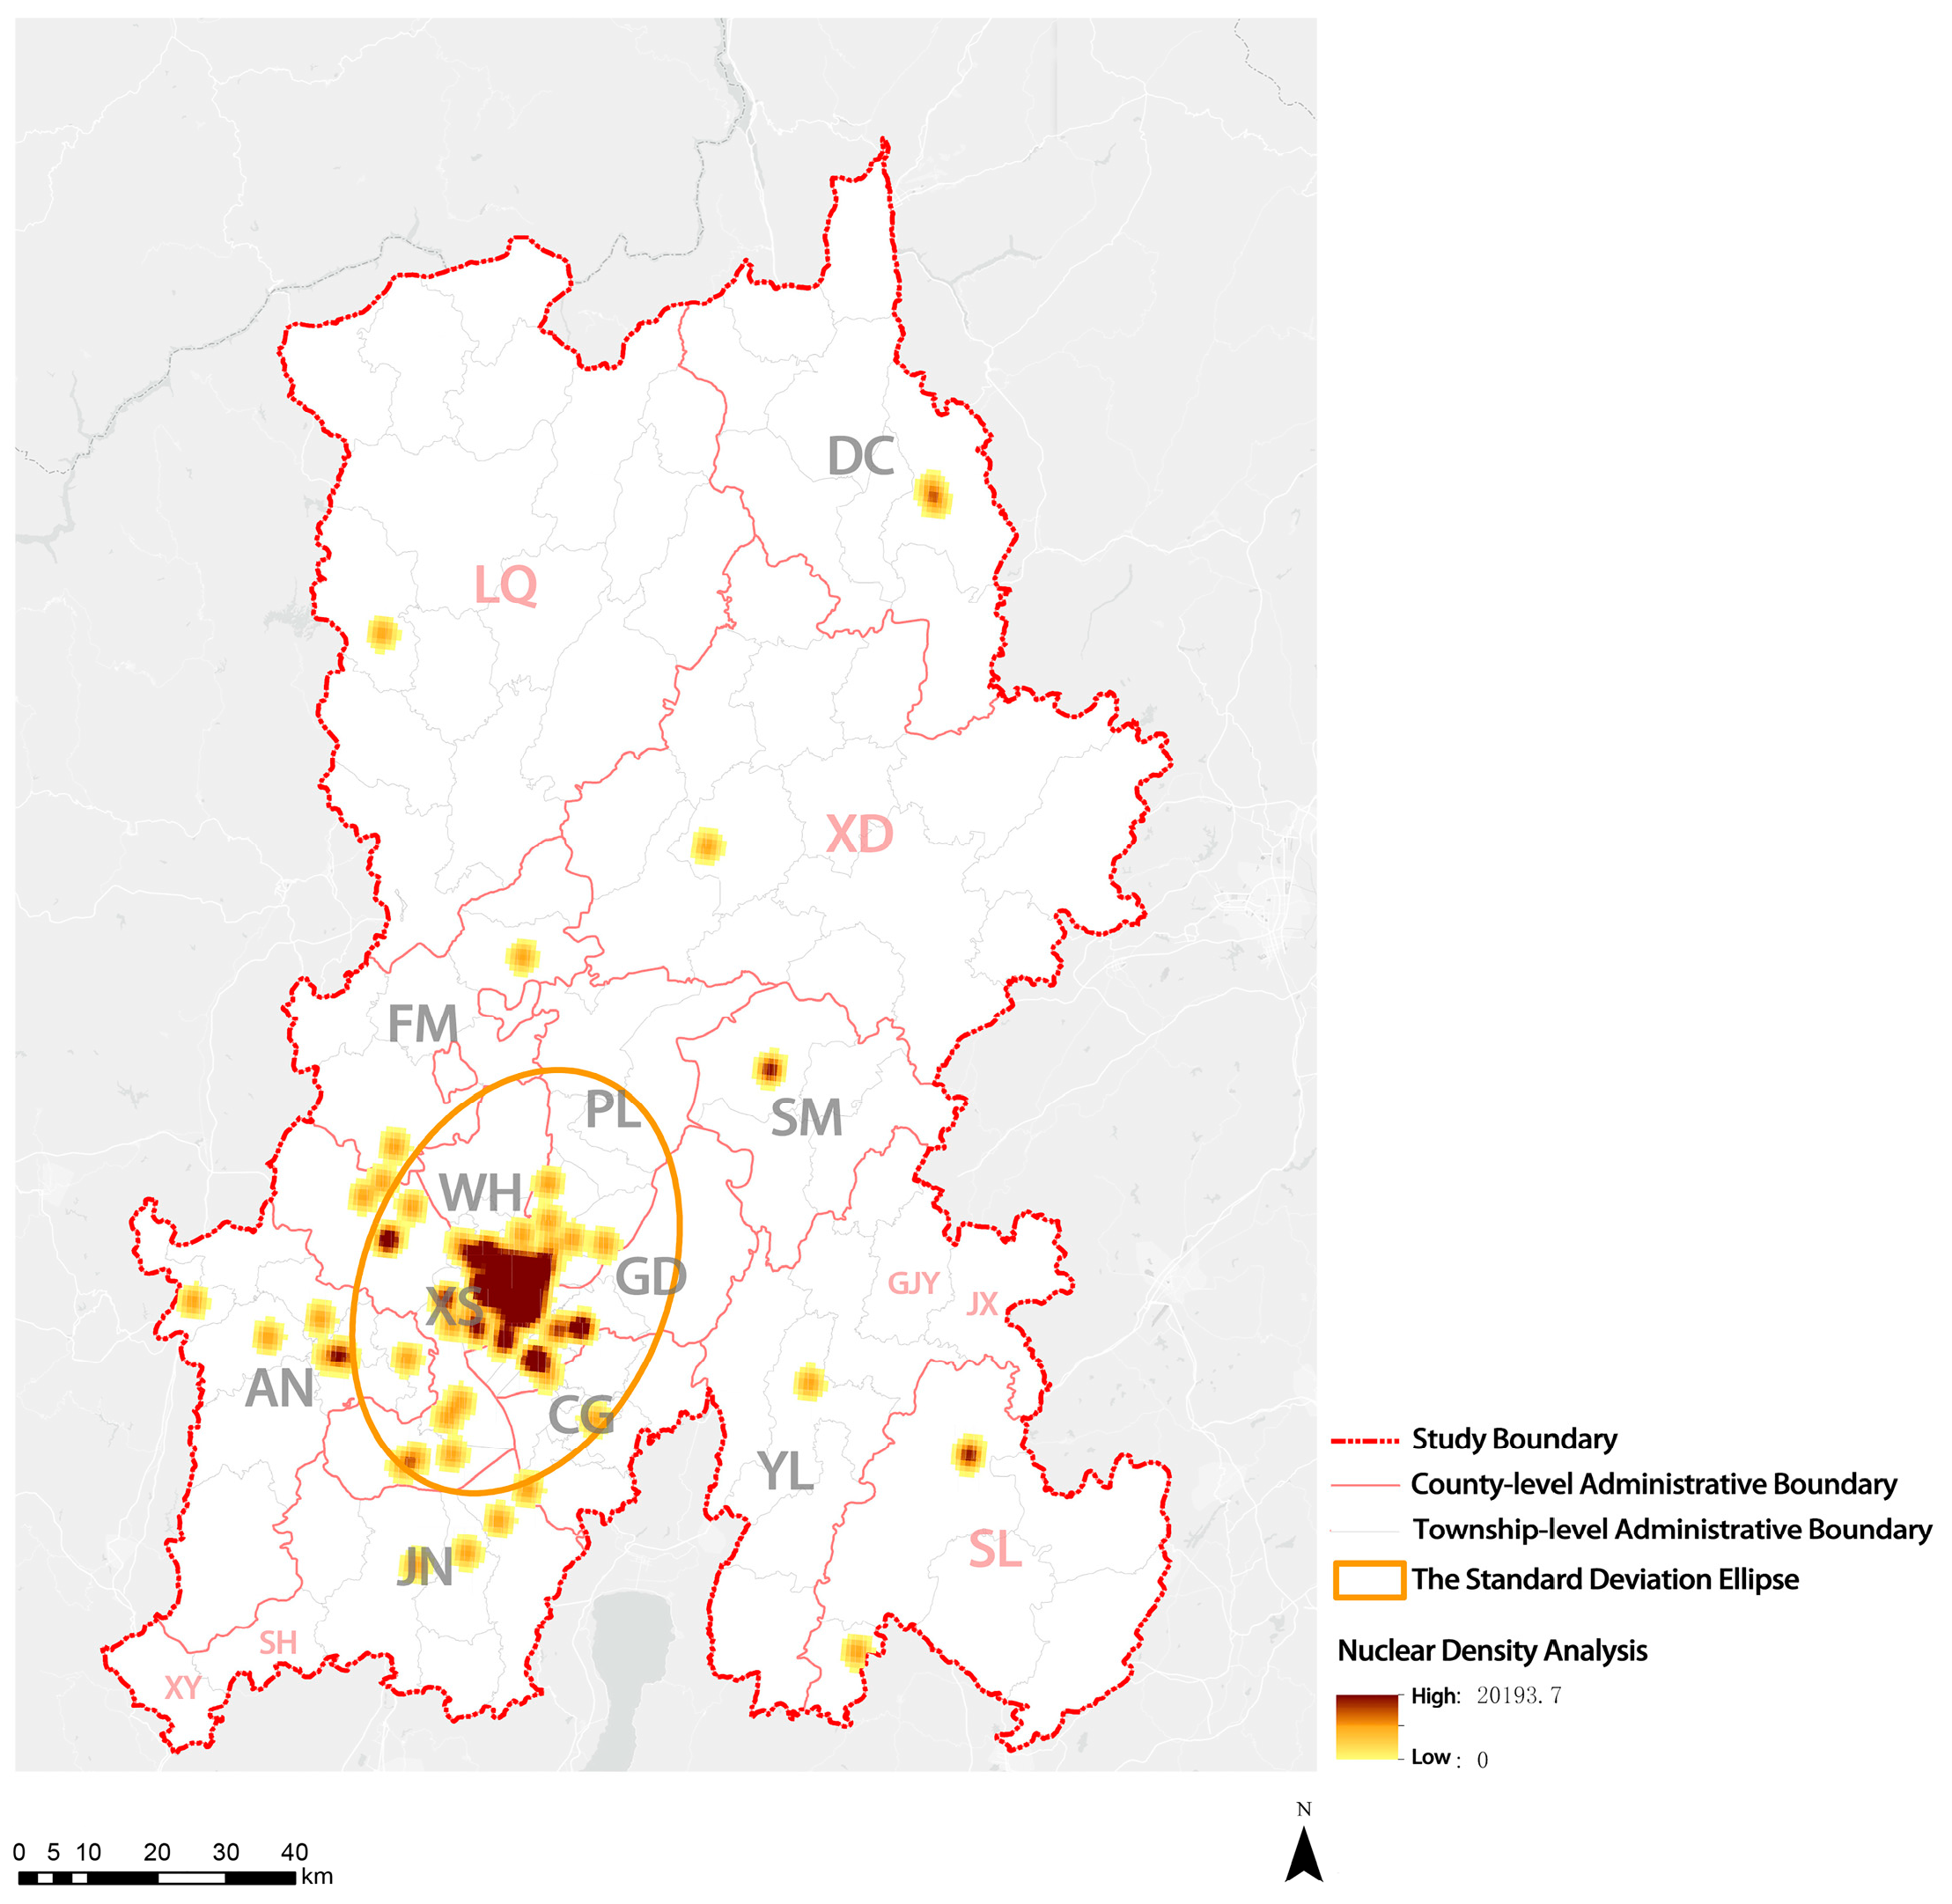
This study analyzed the distribution of elderly care institutions in KM. At present, KM has 126 licensed elderly care institutions, including 52 state-run elderly care institutions, 73 privately owned elderly care institutions, and 1 other type of elderly care institution. The results of the standard deviation ellipse (Figure 6) show that most of the elderly care institutions in KM were located within the First Ring Road at the intersection of the four central urban areas (XS District, PL District, GD District, and WH District).
As shown in Table 1, the main types of elderly care institutions in KM were adult homes and independent living apartments, with 86 in total. There were a total of 40 social welfare institutions, nursing homes, sanatoriums, continuing care retirement communities, retirement homes, senior living communities, and other elderly care institutions. In addition, most elderly care institutions only offer self-care services. Elderly care institutions that offered two or more care types were almost all concentrated in central urban areas (XS District, PL District, GD District, and WH District) and the AN County-Level City (Table 2). Almost all elderly care institutions in ethnic minority communities were state-run institutions and suffered from an insufficient quantity and types of care.

3.2.2. Fundamental Service Level of Elderly Care Institutions

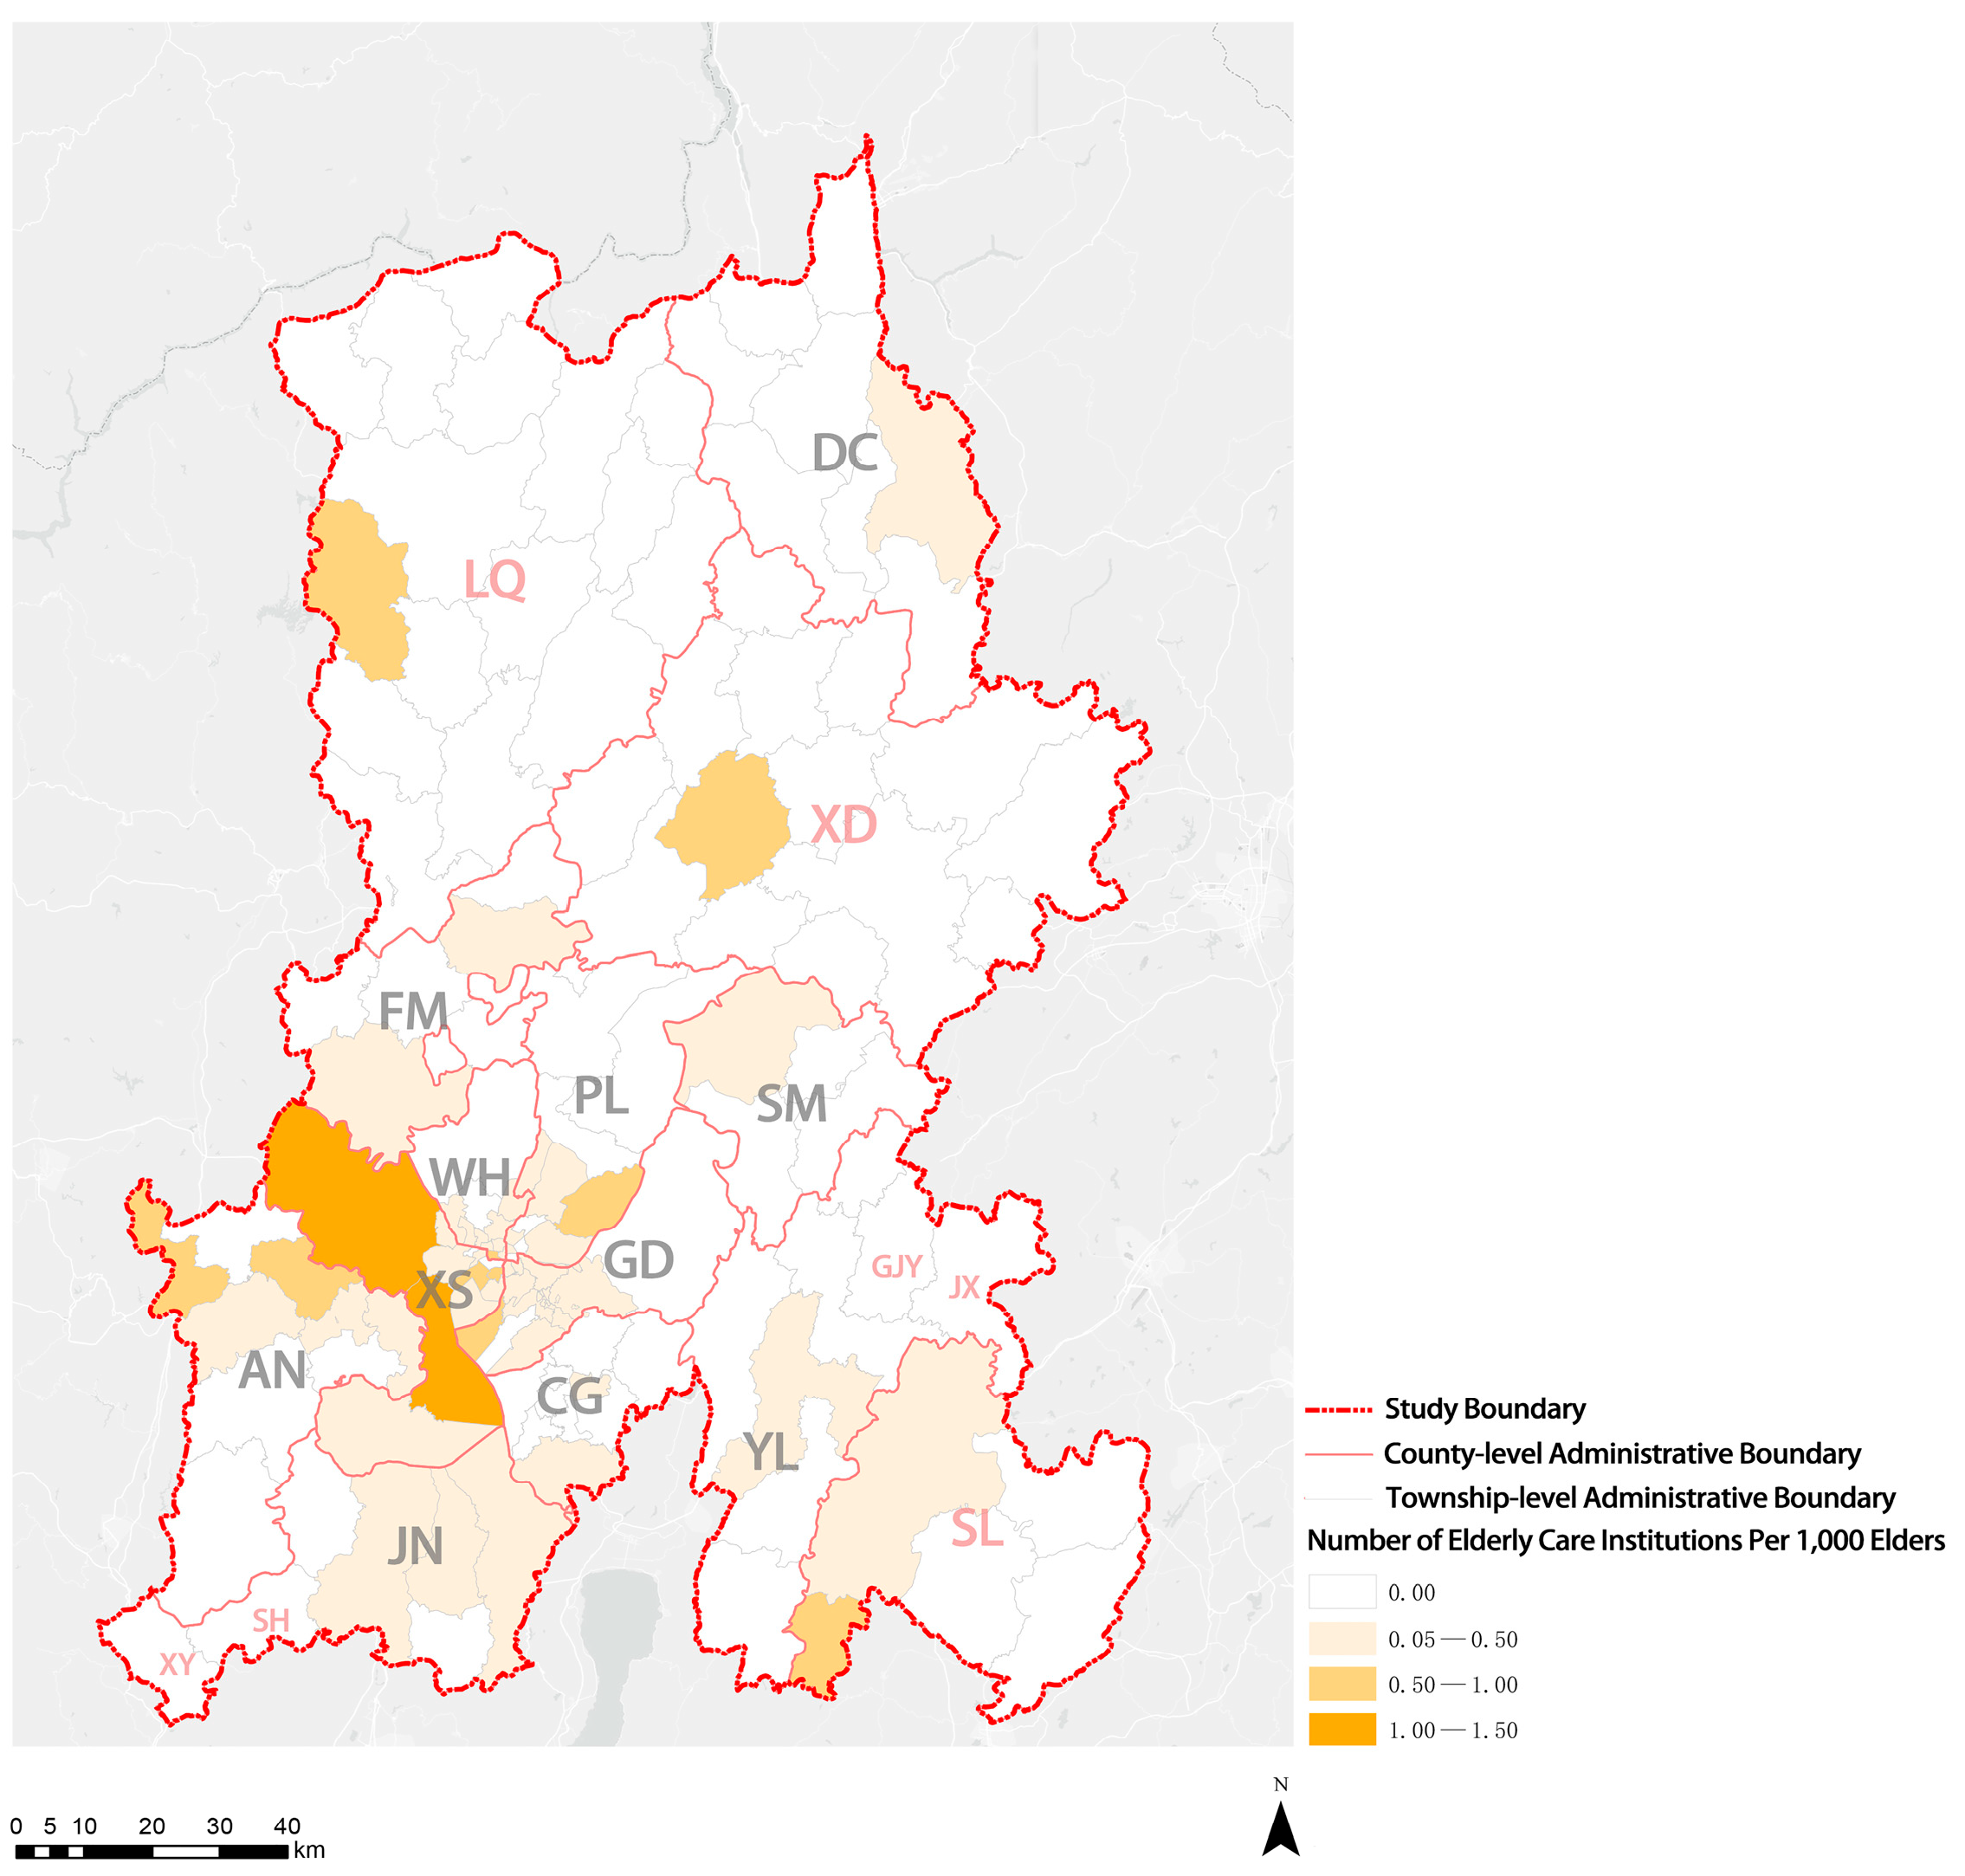
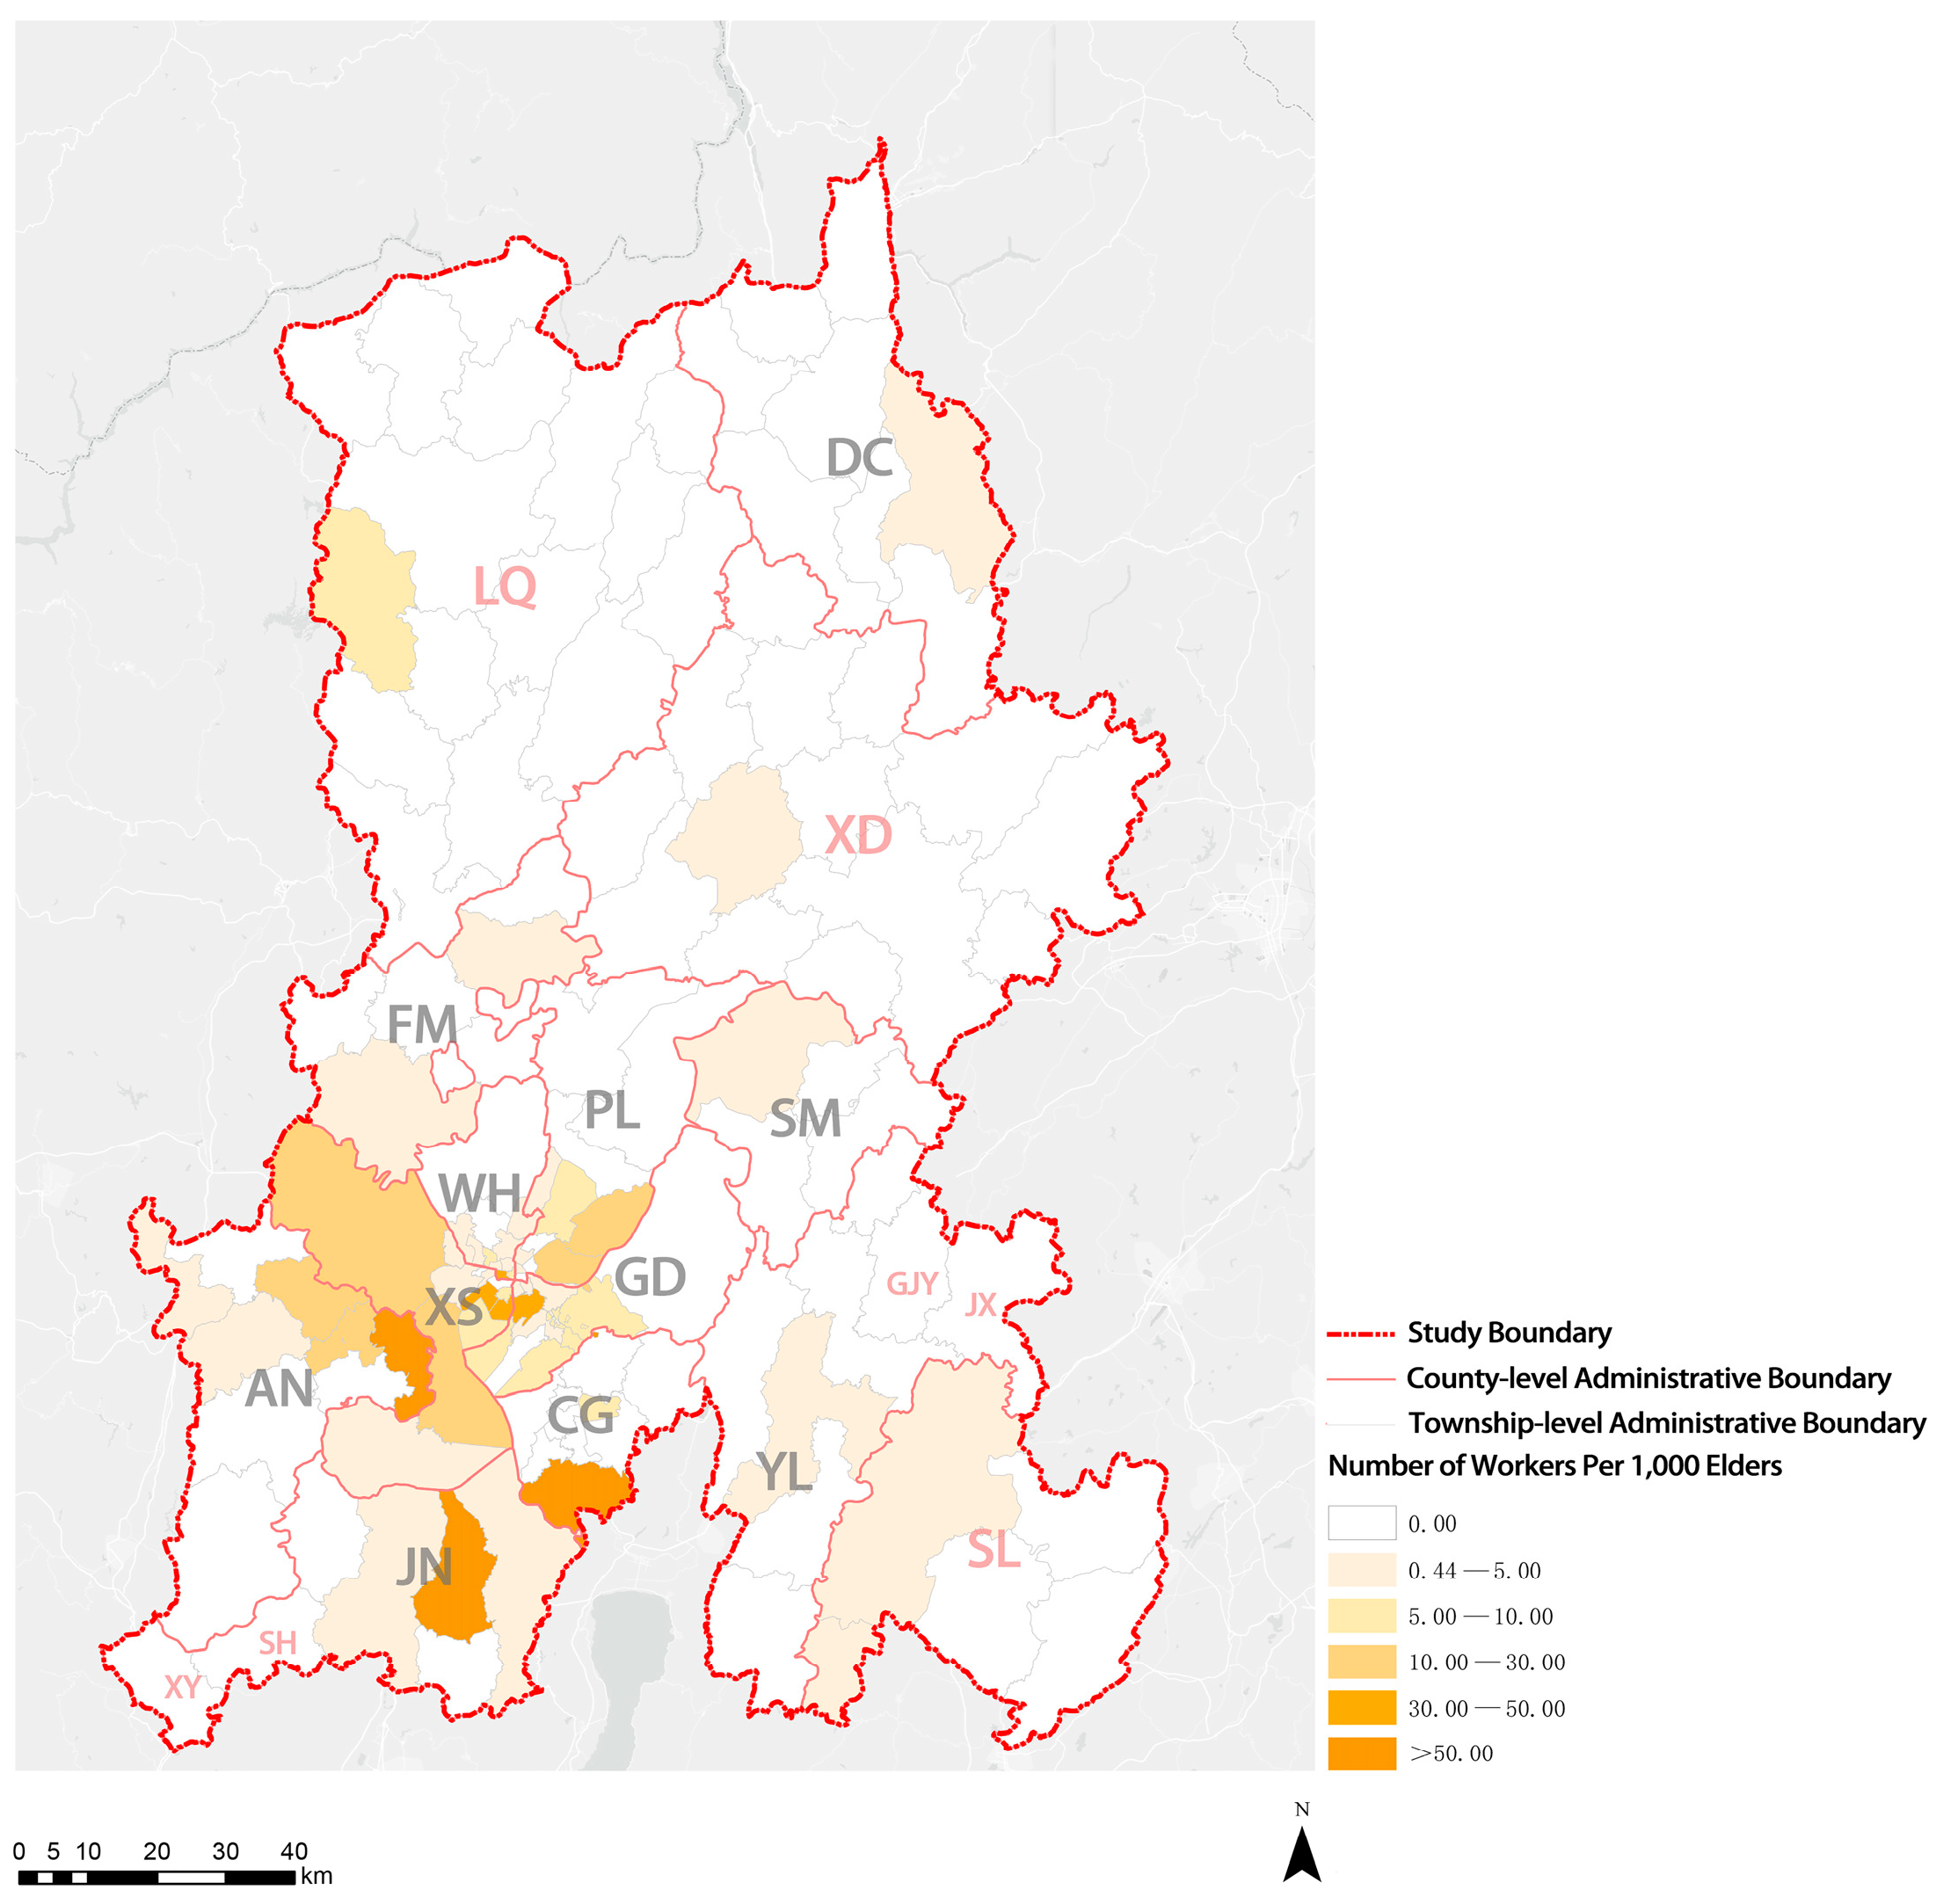
The fundamental service level of elderly care institutions was evaluated in this study mainly considering the number of elderly care institutions per 1000 elders, the number of institutional beds per 1000 elders, and the number of workers per 1000 elders. Overall, the number of elderly care institutions per 1000 elders in KM was 0.14, which is much lower than that in Osaka Prefecture in Japan, which has a well-developed elderly care experience (the number of elderly care institutions per 1000 elders is approximately 1.03) [30]. The number of institutional beds per 1000 elders in KM was approximately 35, which is still much lower than that in Osaka Prefecture (54 beds per 1000 elders). Moreover, the number of workers per 1000 elders was fewer than 8, significantly fewer than that in Osaka Prefecture (76 workers per 1000 elders). The results suggest that, on the whole, KM presents an obvious shortage of elderly care institutions, institutional beds, and related workers.
As shown in Figure 7, in KM, only some subdistricts of XS District had more than 1.0 institutions per 1000 elders. Most townships (subdistricts), especially ethnic minority communities, did not have elderly care institutions. Only four streets had more than 300 beds per 1000 elders, and only one street had more than 550 beds per 1000 elders. The number of institutional beds on most streets in the four central urban areas ranged between 50 and 150 beds per 1000 elders, indicating a noticeable shortage of beds for elderly care institutions. The number of institutional beds in areas outside the main urban areas, especially ethnic minority communities, was fewer than 50 beds or was no beds per 1000 elders (Figure 8). Moreover, the analysis results suggest that eight townships (subdistricts) in the whole city had more than 30 workers per 1000 elders, and only four townships (subdistricts) had more than 50 workers per 1000 elders. Given their small local populations and large number of elderly care institutions, two townships (subdistricts) showed more workers per 1000 elders than the other townships (subdistricts). Five to ten workers were assigned per 1000 elders in the four central urban areas, but fewer than five or no workers were assigned in ethnic minority communities (Figure 9). The results suggest that the shortage of elderly care institutions, institutional beds, and workers in ethnic minority communities is more serious.

3.2.3. Comparison between State-Run and Privately Owned Elderly Care Institutions

Privately owned elderly care institutions outnumbered state-run elderly care institutions by approximately 1.4 times (Table 2). State-run elderly care institutions are social welfare institutions subsidized by the government. Therefore, state-run elderly care institutions are evenly distributed in all districts in the whole city. Privately owned elderly care institutions are self-financing enterprises that need substantial capital investment. Thus, most privately owned elderly care institutions were concentrated in the four most economically developed central urban areas (XS District, PL District, GD District, and WH District) to sustain their operation.
Overall, compared with state-run elderly care institutions, privately owned elderly care institutions had better infrastructure. The majority of state-run elderly care institutions were adult homes, and 36.54% were other types of institutions. Among privately owned elderly care institutions, adult homes accounted for 30.14%, independent living apartments accounted for 31.51%, and other types of institutions accounted for 38.35%. Additionally, the average number of beds, nursing prices, and the number of workers in privately owned elderly care institutions were higher than those in state-run elderly care institutions. Moreover, the types of care provided in privately owned elderly care institutions were more diverse. Specifically, the average number of beds in state-run elderly care institutions was about 102, while that in privately owned elderly care institutions was about 350. The average number of beds in privately owned elderly care institutions was about 3.43 times that in state-run elderly care institutions. Additionally, the average price of nursing care in privately owned elderly care institutions was about 3.05 times that in state-run elderly care institutions. Furthermore, the average number of workers in privately owned elderly care institutions (79) was about 4.39 times that in state-run elderly care institutions (18). Care type Ⅰ (Table 2) accounted for 90.38% of care types in state-run elderly care institutions. For privately owned elderly care institutions, 45.20% of institutions offered care type I, 20.55% of institutions offered care type VI, 9.59% of institutions offered care type VII, and 24.66% offered other care types.

3.2.4. Convenience Degree of Elderly Care Institutions

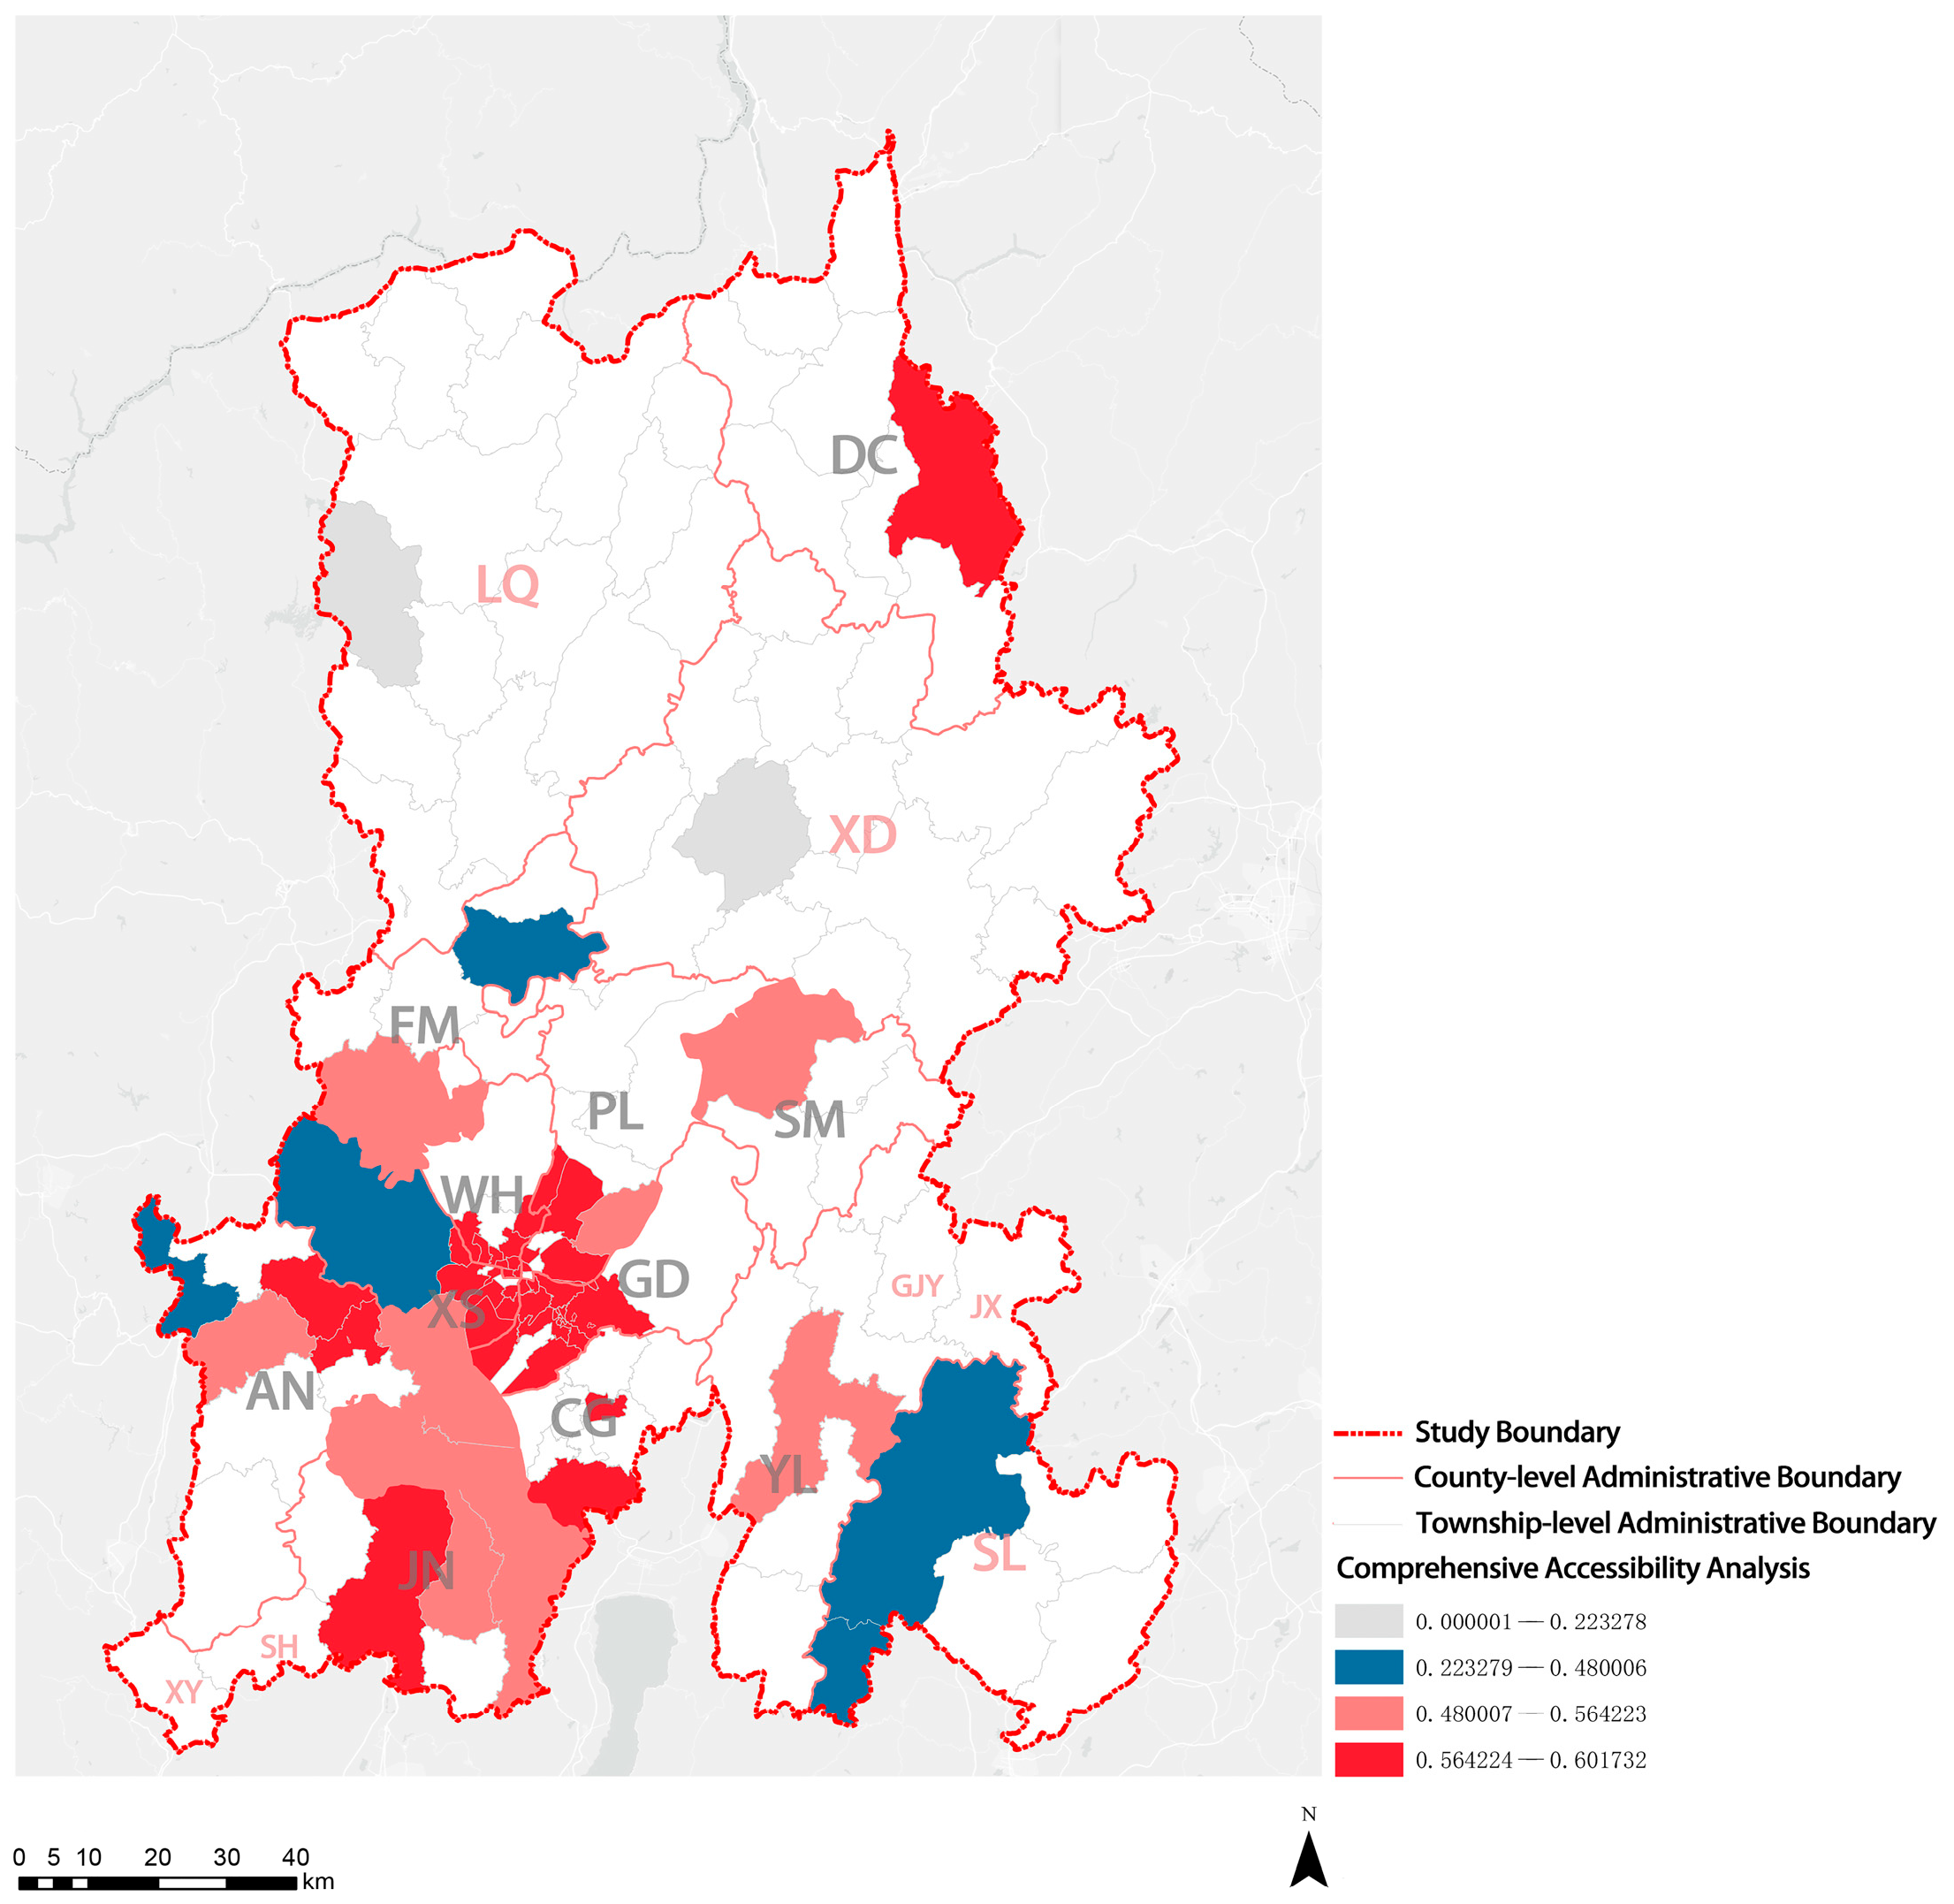
POI service facilities include all kinds of engineering and social service facilities in urban spaces, which can be used for various urban studies. The accessibility of POI service facilities was analyzed to evaluate the convenience degree of elderly care institutions in this study. First, the accessibility of each elderly care institution to eight POI service facilities (healthcare, scenic spot, public facility, life service, shopping service, education, science and culture, sports and leisure, and transportation service; Table 3) was calculated. Then, the entropy method was used to assign the index weight to calculate the comprehensive accessibility of each elderly care institution. Finally, the data were visualized. Figure 10 shows the visualized accessibility of POI service facilities in KM. XS District, PL District, GD District, WH District, CG District, JN District, and AN County-Level City had higher comprehensive accessibility than DC District, SM County, YL County, and FM County. XD Autonomous County, SL Autonomous County, and LQ Autonomous County had the lowest comprehensive accessibility. Compared with that in other areas in KM, the convenience degree of elderly care institutions in ethnic minority communities was poor, reflecting an insufficient number and the unreasonable distribution of POI service facilities. Additionally, the comprehensive accessibility of privately owned elderly care institutions to POI service facilities was higher than that of state-run elderly care institutions.

3.3. Coupling Coordination Degree

This study analyzed the adaptation of the degree of population aging and the service level of elderly care institutions in KM using the coupling coordination model. On the basis of previous studies, evaluation indicators for the service level of elderly care institutions and population aging were proposed (Table 4). Then, the entropy method was used to calculate the weights of the indicators with respect to the degree of population aging and the service level of institutions. The total score of the degree of population aging and the service level of institutions was obtained according to indicator weights. Finally, the coupling degree C value, coordination index T value, and coupling coordination degree D value, measured using the coupling coordination model, were introduced to characterize the adaptation of the service level of elderly care institutions and the degree of population aging. As shown in Table A2, the coupling coordination degree was classified into 10 levels.
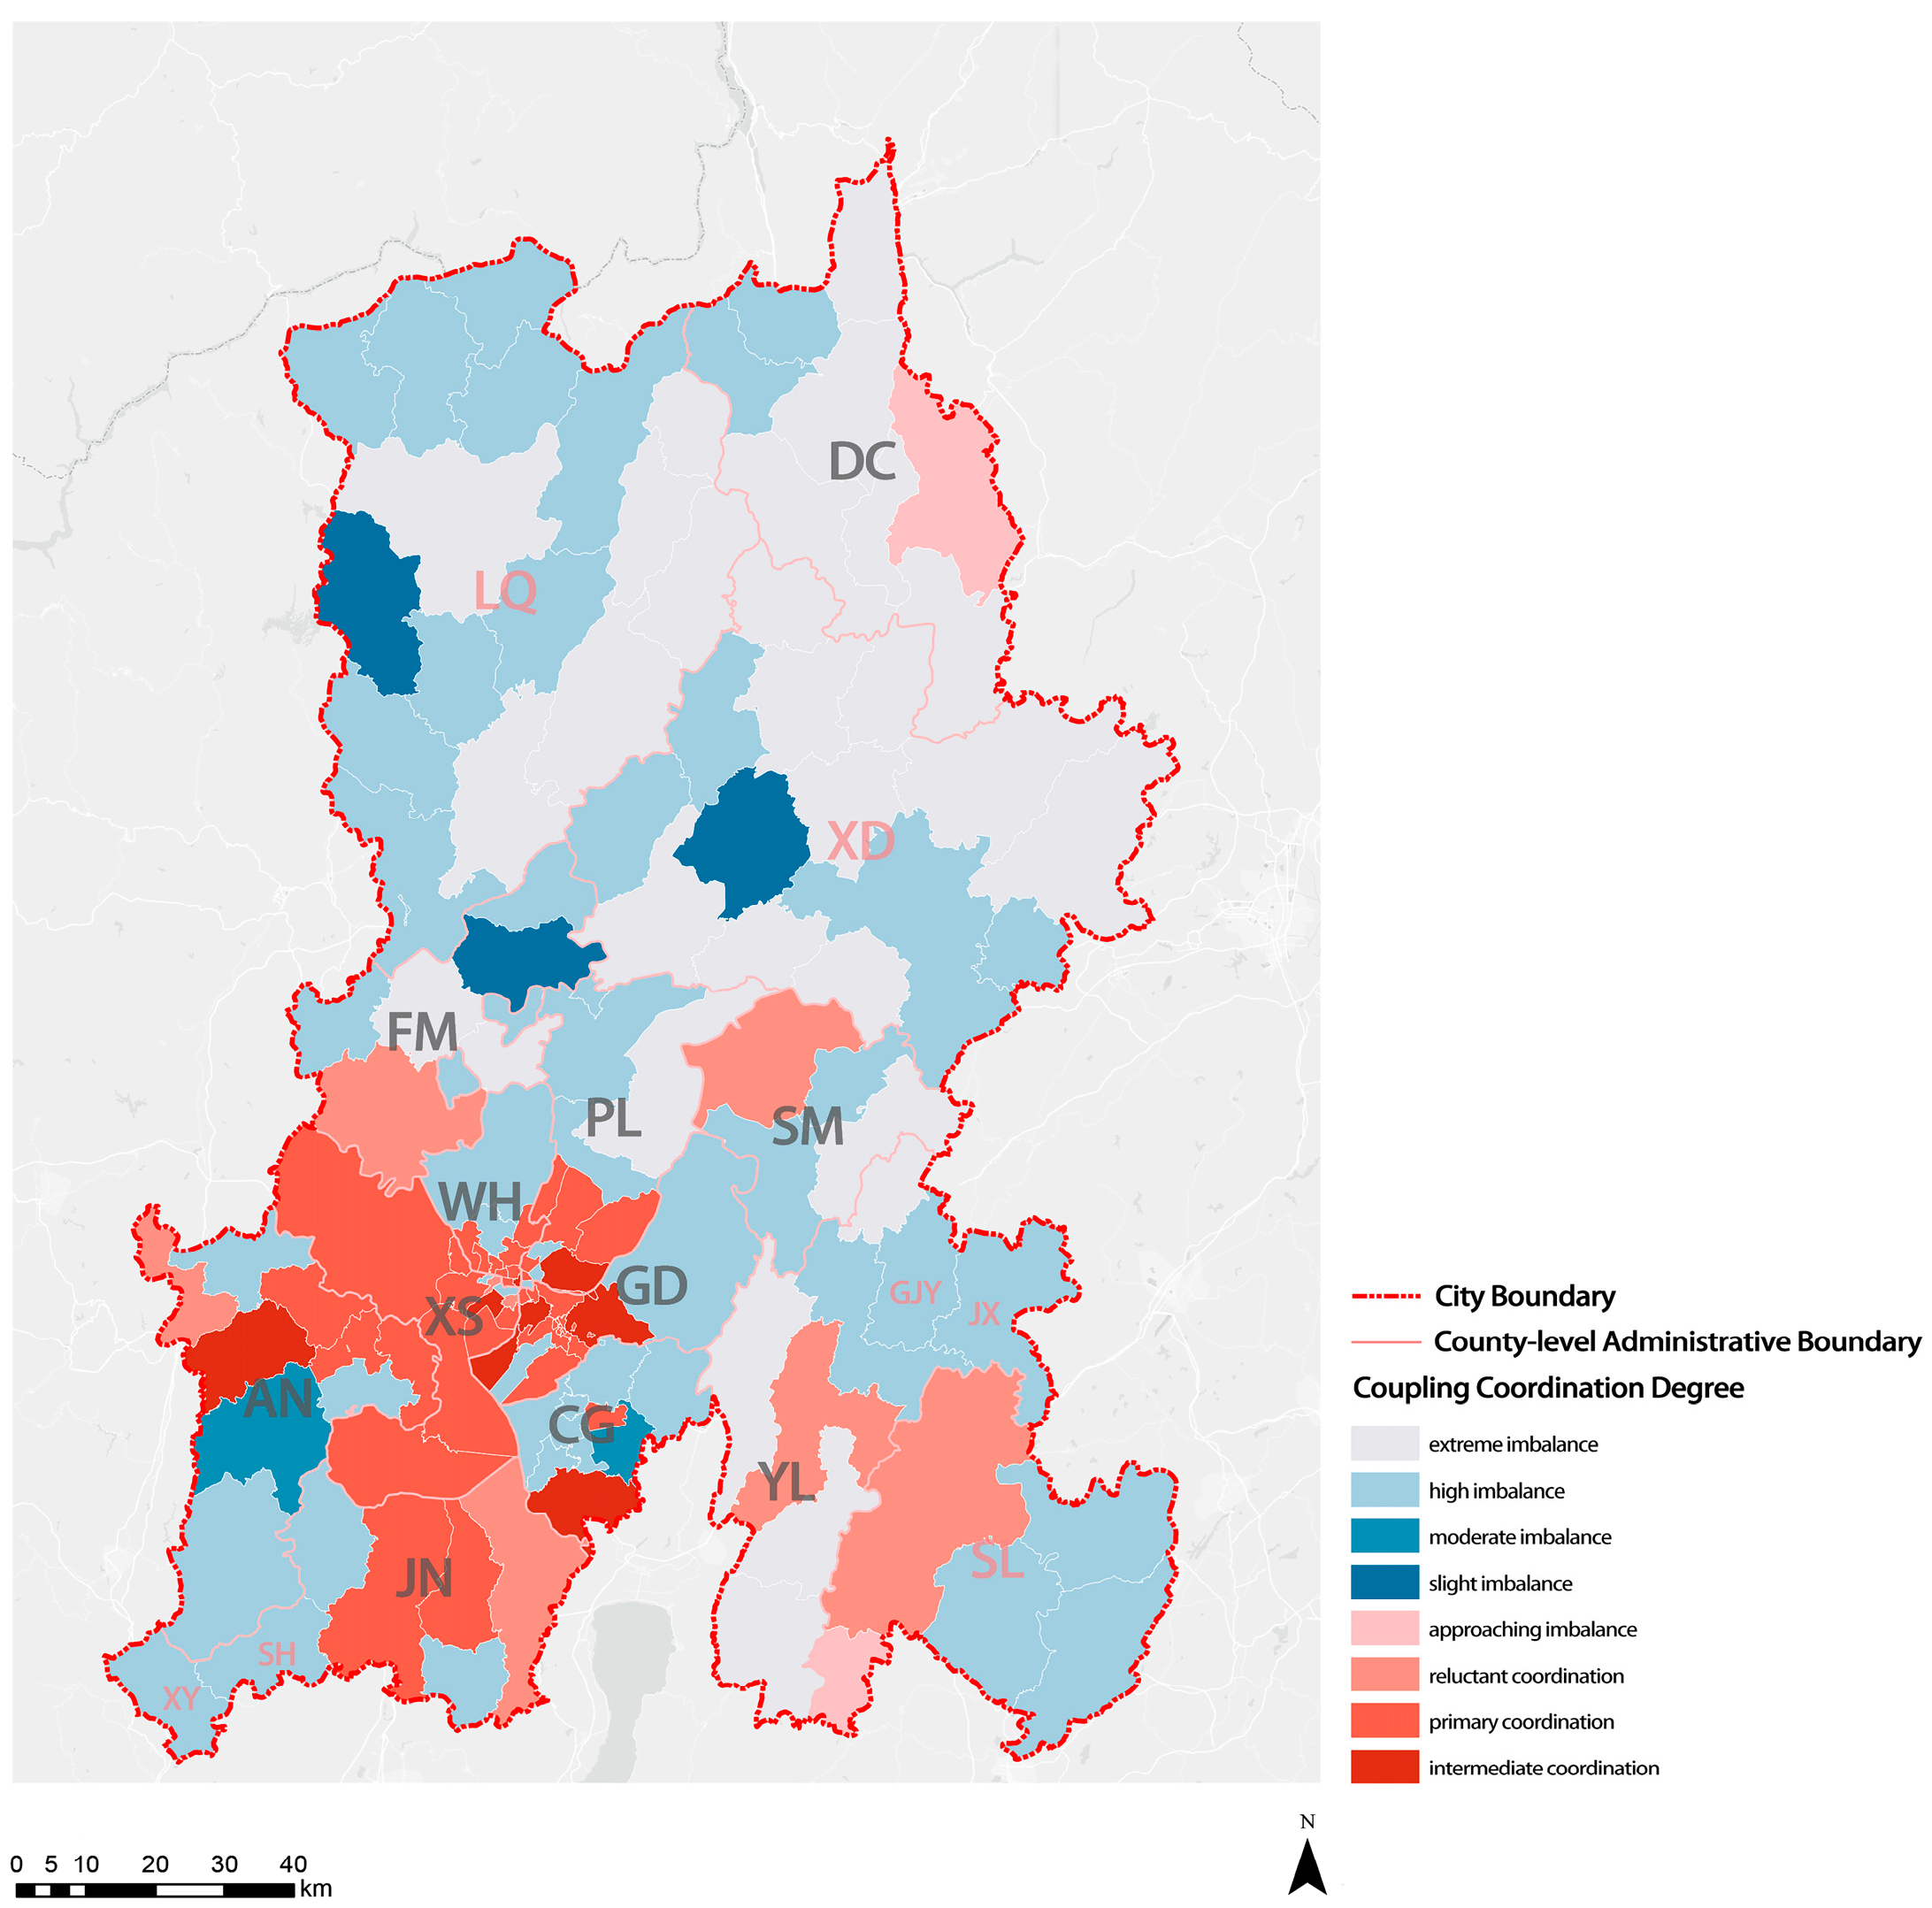
The calculation results for the coupling coordination between the degree of population aging and the service level of elderly care institutions in KM are shown in Table A3. Fewer than half of the townships (subdistricts) reached reluctant, primary, or intermediate coordination for the degree of population aging and the service level of elderly care (Figure 11). These townships (subdistricts) were mainly under the jurisdiction of seven districts (GD District, WH District, XS District, PL District, JN District, CG District, and DC District). Except for those in DC District, the degree of population aging and the service level of elderly institutions in six districts in KM were comparatively coordinated. The coupling coordination degree of the population aging and the service level of elderly care institutions for the seven districts ranked from high to low followed the order: GD District, WH District, XS District, PL District, JN District, CG District, and DC District. Most townships (subdistricts) in the AN County-Level City showed intermediate coordination or a moderate imbalance in the degree of population aging and the service level of elderly care institutions. Most townships (subdistricts) in SM County and SL Autonomous County showed a moderate imbalance in the degree of population aging and the service level of elderly care institutions. Most townships (subdistricts) in FM County, YL County, LQ Autonomous County, and XD Autonomous County showed a serious mismatch in the area’s current degree of population aging and the coupling coordination degree with a moderate or high imbalance. D values for the above counties were generally low. Twenty-eight townships (subdistricts) showed a high imbalance in the degree of population aging and the service level of elderly care institutions, of which sixteen were under the jurisdiction of XD Autonomous County and LQ Autonomous County. Overall, the imbalance in the coupling coordination between the degree of aging and the service level of elderly care institutions in ethnic minority communities was severe.

4. Conclusions

This study took the multi-ethnic city KM as an example to analyze the equity of elderly care facility allocation at a township (subdistrict) scale. The study found the following. ① Regional differences can be seen in the population aging. There was a significant shortage of young people in economically underdeveloped ethnic minority communities, which led to serious population aging. Although the population aging in central urban areas was relatively low, it was constrained by the limited space; thus, the density of elders in central urban areas is considerable. ② The distribution of elderly services in different districts or counties was imbalanced. There were significant differences between urban and rural areas. Elderly service resources were largely centered in the four central urban areas, while all ethnic minority communities were located in counties and townships. Therefore, the number of elderly care institutions in ethnic minority communities, institutional beds, and workers per 1000 elders fell significantly short. ③ The overall convenience of elderly care institutions was low. Relevant service facilities were insufficient and unevenly distributed. A significant difference was seen in the comprehensive accessibility to POI facilities between ethnic minority communities and other areas in KM, indicating a lack of equity. ④ Compared with state-run elderly care institutions, privately owned elderly care institutions offered more types of care, better infrastructure, and better comprehensive accessibility to POI service facilities. ⑤ The coupling coordination between the degree of aging and the service level of elderly care institutions in the majority of the areas in KM showed poor adaptation. Furthermore, the coupling coordination degree in most ethnic minority communities was imbalanced.
Based on the above study results, the following recommendations are proposed:
(1)
Elderly care resources should be allocated more equitably. More attention should be paid to ameliorating the unreasonable distribution of public infrastructure. Furthermore, the spatial distribution of the population should be managed via the rational layout of public infrastructure to alleviate excessive aging in the regional population.
(2)
The elderly care facilities in ethnic minority communities should be improved. Factors, including the economy, population, ethnic culture, and religious beliefs of ethnic minorities should be considered to construct elderly care institutions with suitable care types. The coverage, number of beds, and number of workers in state-run elderly care institutions should be improved. Considering the unique ethnic culture and ecological environment of ethnic minority communities, elderly care institutions can be developed in such a way to attract urban elders and stimulate the economy in ethnic minority areas, promoting the gradual improvement of elderly care facilities for ethnic minorities.
(3)
More public funds and resources should be allocated to ethnic minority communities to improve the equity of allocation. The planning and construction of elderly care institutions should also consider the characteristics of minority nationalities and accommodate the elderly’s care needs in terms of religious beliefs, dietary habits, interior decoration style, and customs to optimize elderly care for the ethnic minorities.

Author Contributions

Conceptualization, H.H. and Y.G. (Yang Gu); methodology, Y.C.; software, H.H.; validation, Y.C. and Y.G. (Yang Gu); formal analysis, H.H.; investigation, Y.L.; resources, Y.L.; data curation, Y.G. (Yang Gu); writing—original draft preparation, H.H.; writing—review and editing, Y.L. and Y.G. (Ying Gu); visualization, Y.C. and Y.G. (Yang Gu); supervision, Y.G. (Ying Gu); project administration, Y.G. (Ying Gu); funding acquisition, Y.G. (Ying Gu). All authors have read and agreed to the published version of the manuscript.

Funding

This research was funded by the National Natural Science Foundation of China (Grant No. 32102073).

Institutional Review Board Statement

Not applicable.

Informed Consent Statement

Not applicable.

Data Availability Statement

Not applicable.

Conflicts of Interest

The authors declare no conflict of interest.

Appendix A

Table A1. Abbreviations of geographical names in manuscript.
No.Full NameAbbreviationAdministrative Districts
1Kunming CityKM CityCity
2Anning CityAN CityCounty-level City
3Songming CountySM CountyCounty
4Yiliang CountyYL County
5Fumin CountyFM County
6Panlong DistrictPL DistrictDistrict
7Wuhua DistrictWH District
8Guandu DistrictGD District
9Xishan DistrictXS District
10Dongchuan DistrictDC District
11Chenggong DistrictCG District
12Jinning DistrictJN District
13Shilin Yi Autonomous CountySL Autonomous CountyAutonomous County
14Xundian Hui Autonomous CountyXD Autonomous County
15Luquan Miao Autonomous CountyLQ Autonomous County
16Xiyang Yi Ethnic TownshipXY Ethnic TownshipEthnic Township
17Shuanghe Yi Ethnic TownshipSH Ethnic Township
18Jiuxiang Yi and Hui Ethnic TownshipJX Ethnic Township
19Gengjiaying Yi and Miao Ethnic TownshipGJY Ethnic Township
Table A2. Coupling coordination level classification criteria.
The Range of D ValueCoupling Coordination LevelMeaning
(0.0–0.1)1extreme imbalance
[0.1–0.2)2high imbalance
[0.2–0.3)3moderate imbalance
[0.3–0.4)4slight imbalance
[0.4–0.5)5approaching imbalance
[0.5–0.6)6reluctant coordination
[0.6–0.7)7primary coordination
[0.7–0.8)8intermediate coordination
[0.8–0.9)9high coordination
[0.9–1.0)10quality coordination
Table A3. Calculation results of coupling coordination degree between the degree of population aging and the service level of elderly care institutions in KM city.
No.Coupling Degree C ValueCoordination Index T ValueCoupling Coordination Degree D ValueLevelCoupling Coordination Degree
10.9290.2670.4985approaching imbalance
20.9890.1950.4395approaching imbalance
30.7760.3120.4925approaching imbalance
40.8910.3330.5456reluctant coordination
50.9430.5240.7038intermediate coordination
60.9680.4890.6887primary coordination
70.8870.4340.627primary coordination
80.9440.5020.6887primary coordination
90.920.6240.7588intermediate coordination
100.7780.4310.5796reluctant coordination
110.8490.6380.7368intermediate coordination
120.9560.7650.8559high coordination
130.9510.6130.7648intermediate coordination
140.9780.5840.7568intermediate coordination
150.9830.6650.8089high coordination
160.9830.6380.7928intermediate coordination
170.9770.5920.7618intermediate coordination
180.9330.4550.6527primary coordination
190.990.6430.7988intermediate coordination
200.9120.5420.7038intermediate coordination
210.970.5710.7458intermediate coordination
220.9970.6620.8129high coordination
230.9750.5920.768intermediate coordination
240.9690.6160.7738intermediate coordination
250.9670.6260.7788intermediate coordination
260.9870.6660.8119high coordination
270.9750.6610.8039high coordination
280.9550.6240.7728intermediate coordination
290.920.5270.6967primary coordination
300.9820.6580.8049high coordination
310.9670.5680.7418intermediate coordination
320.9440.5210.7018intermediate coordination
330.880.5220.6787primary coordination
340.9770.5910.768intermediate coordination
350.9810.5950.7648intermediate coordination
360.9730.660.8019high coordination
370.9540.6160.7668intermediate coordination
380.950.5270.7088intermediate coordination
390.9710.5880.7568intermediate coordination
400.8860.4580.6377primary coordination
410.9830.6260.7848intermediate coordination
420.940.4630.667primary coordination
430.940.5290.7058intermediate coordination
440.9470.5620.7298intermediate coordination
450.8550.5860.7088intermediate coordination
460.9720.6040.7668intermediate coordination
470.9670.6020.7638intermediate coordination
480.9110.570.7218intermediate coordination
490.9810.5850.7578intermediate coordination
500.9750.6110.7718intermediate coordination
510.9920.6620.819high coordination
520.9540.5680.7368intermediate coordination
530.6310.0450.1682high imbalance
540.5720.0560.1782high imbalance
550.5540.060.1822high imbalance
560.5970.050.1742high imbalance
570.9410.0150.1192high imbalance
580.2660.2780.2723moderate imbalance
590.2630.2840.2733moderate imbalance
600.2870.2370.2613moderate imbalance
610.3210.1890.2463moderate imbalance
620.2280.3790.2943moderate imbalance
630.3030.2130.2543moderate imbalance
640.4030.1180.2183moderate imbalance
650.3330.1750.2423moderate imbalance
660.3130.20.253moderate imbalance
670.240.3420.2873moderate imbalance
680.1990.50.3154slight imbalance
690.2590.2930.2763moderate imbalance
700.3750.1370.2273moderate imbalance
710.2640.2810.2733moderate imbalance
720.2830.2450.2633moderate imbalance
730.2020.4840.3134slight imbalance
740.2430.3340.2853moderate imbalance
750.2960.2230.2573moderate imbalance
760.6510.0420.1642high imbalance
770.4080.1150.2163moderate imbalance
780.4770.0820.1982high imbalance
790.5060.0730.1922high imbalance
800.6170.0470.172high imbalance
810.3910.1250.2223moderate imbalance
820.3840.130.2243moderate imbalance
830.430.1030.213moderate imbalance
840.5170.070.192high imbalance
850.4360.10.2093moderate imbalance
860.4740.0840.1992high imbalance
870.5480.0610.1832high imbalance
880.5490.0610.1832high imbalance
890.6490.0420.1652high imbalance
900.5950.0510.1742high imbalance
910.4570.0910.2033moderate imbalance
920.7550.0290.1482high imbalance
930.4710.0850.22high imbalance
940.640.0430.1662high imbalance
950.410.1140.2163moderate imbalance
9610.010.12high imbalance
970.3630.1460.2313moderate imbalance
980.4310.1020.213moderate imbalance
990.4780.0820.1982high imbalance
1000.4350.10.2093moderate imbalance
1010.3520.1560.2343moderate imbalance
1020.5020.0740.1932high imbalance
1030.340.1680.2393moderate imbalance
1040.3440.1640.2373moderate imbalance
1050.3140.1970.2493moderate imbalance
1060.3590.150.2323moderate imbalance
1070.3130.20.253moderate imbalance
1080.5560.0590.1822high imbalance
1090.3280.1810.2443moderate imbalance
1100.4570.090.2033moderate imbalance
1110.3950.1230.223moderate imbalance
1120.3140.1980.2493moderate imbalance
1130.3470.1610.2363moderate imbalance
1140.3460.1620.2373moderate imbalance
1150.4080.1150.2173moderate imbalance
1160.4680.0860.2013moderate imbalance
1170.4810.0810.1982high imbalance
1180.3950.1230.223moderate imbalance
1190.8560.0210.1332high imbalance
1200.4610.0890.2023moderate imbalance
1210.3970.1210.223moderate imbalance
1220.4090.1150.2163moderate imbalance
1230.4760.0830.1992high imbalance
1240.3810.1320.2253moderate imbalance
1250.6110.0480.1712high imbalance
1260.2830.2450.2633moderate imbalance
1270.4730.0840.22high imbalance
1280.3990.120.2193moderate imbalance
1290.4820.0810.1972high imbalance
1300.3890.1270.2223moderate imbalance
1310.410.1140.2163moderate imbalance
1320.3140.1980.2493moderate imbalance

References

  1. The Seventh National Census of China in 2021. National Bureau of Statistics of China. 2021. Available online: http://www.stats.gov.cn/ (accessed on 5 October 2022).
  2. Mutchler, J.E.; Li, Y.; Xu, P. How strong is the Social Security safety net? Using the Elder Index to assess gaps in economic security. J. Aging Soc. Policy 2019, 31, 123–137. [Google Scholar] [CrossRef]
  3. Ethnic and Religious Affairs Commission of Yunnan Province. 2021. Available online: https://mzzj.yn.gov.cn/ (accessed on 15 January 2023).
  4. Nishino, T.; Kasai, S. Development of a location optimization planning framework for care facilities based on estimation of distribution of senior people on GIS. J. Archit. Build. Sci. 2019, 25, 813–818. [Google Scholar] [CrossRef]
  5. Ozawa, W.; Yano, K.; Tomoki, N.; Kato, H. On Geographical Information System for Observing Support Activities Regarding Aged Solitary People in Kyoto City: Part 2. Ritsumeikan Soc. Sci. Rev. 2020, 56, 109–129. [Google Scholar] [CrossRef]
  6. Nishimura, J.; Inoue, K.; Tanaka, T.; Matsuo, K.; Yokoyama, M. Research on the influence of street characteristics on pedestrian volume in the domination area of a regional central city. J. City Plan. Inst. Jpn. 2021, 56, 485–492. [Google Scholar] [CrossRef]
  7. Moriya, K.; Tokunaga, Y. A Study on Social Benefits Evaluation Method for Regional Public Transportation Planning Considering Generational Differences. City Plan. Rev. 2021, 20, 73–78. [Google Scholar] [CrossRef]
  8. Kusunoki, K.; Yoshikawa, T. Analysis of trends in the distribution of ling-term care beds and psychiatric beds in secondary and first medical areas. City Plan. Rev. 2020, 18, 363–368. [Google Scholar] [CrossRef] [PubMed]
  9. Takahashi, N.; Nagaie, T.; Miyatake, M. A Study on the Variation of Evacuation time considering with snow cover in tsunami disaster. J. Jpn. Soc. Civ. Eng. Ser. B3 Ocean. Eng. 2020, 76, I_1013–I_1018. [Google Scholar] [CrossRef] [PubMed]
  10. Dosen, K.M.; Karasiuk, A.A.; Marcaccio, A.C.; Miljak, S.; Nair, M.H.; Radauskas, V.J. Code grey: Mapping healthcare service deserts in Hamilton, Ontario and the impact on senior populations. Cartogr. Int. J. Geogr. Inf. Geovis. 2017, 52, 125–131. [Google Scholar] [CrossRef]
  11. Wang, J.; Kwan, M.P. Hexagon-based adaptive crystal growth Voronoi diagrams based on weighted planes for service area delimitation. ISPRS Int. J. Geo-Inf. 2018, 7, 257. [Google Scholar] [CrossRef]
  12. Ngui, A.N.; Apparicio, P. Optimizing the two-step floating catchment area method for measuring spatial accessibility to medical clinics in Montreal. BMC Health Serv. Res. 2011, 11, 166. [Google Scholar] [CrossRef] [PubMed] [Green Version]
  13. Yu, S.; Li, W. Research on the application of GIS in the problem of aging. In Proceedings of the 2019 4th International Conference on Humanities Science and Society Development, Xiamen, China, 24 May 2019; pp. 279–282. [Google Scholar] [CrossRef]
  14. Yu, B.J.; Cui, X.; Liu, X.Y.; Cheng, Y. Accessibility Research and Spatial Distribution Characteristics of Residential Care Facilities in Chengdu: Based on Two-step Floating Catchment Area Method. Huazhong Archit. 2022, 40, 83–87. [Google Scholar] [CrossRef]
  15. Li, S.H.; Song, Q.Q.; Wan, S. Research on the Site Selection of Endowment Real Estate Project Based on GIS—Take Tianjin City as an Example. J. Tianjin Univ. Soc. Sci. 2017, 19, 204–209. [Google Scholar] [CrossRef]
  16. Yan, H.; Luo, Z.F.; Sun, Y.; Tang, X.L.; Yang, J. Planning Site Selection of Services for the Elders Based on POI Data in Changsha City. J. Shaoguan Univ. Nat. Sci. 2022, 43, 86–90. [Google Scholar] [CrossRef]
  17. Xu, Y.S.; Zhou, D.; Qiu, Z.W.; Li, Z. A Study on the Planning and Layout of Care Facilities Based on Spatial Distributive Characteristics of the Elderly People. Archit. J. 2017, 9, 74–77. [Google Scholar] [CrossRef]
  18. Chen, L.; Chen, Z.; Qiu, C.S.; Chen, W.D. Research on the Distribution, Operation Status and Countermeasures of Pension Institutions from the Perspective of Industry Development: A Case Study of Chengdu. Urban Rural Plan. 2021, Z1, 165–174. [Google Scholar] [CrossRef]
  19. Ji, Y.Q.; Jiang, H.M. Spatial and Temporal Differences and Influencing Factors of the Adaptation Degree of Aging and Pension Resources in the New Era. Sci. Geogr. Sin. 2022, 42, 854–862. [Google Scholar] [CrossRef]
  20. Zhao, P.J.; Luo, J.; Hu, H.Y. Character of the Elderly’s Life Circle and Public Service. Facilities Configuration by Using Big Data: A Case of Beijing. Sci. Geogr. Sin. 2022. Available online: https://kns.cnki.net/kcms/detail/22.1124.P.20220809.1537.010.html (accessed on 11 August 2022).
  21. Guo, J.X.; Zhang, S.; Liu, H. Research on Location Allocation of Community Pension Service Facilities from the Perspective of Life Circle: A Case Study of Nankai District, Tianjin. J. Tianjin Chengjian Univ. 2022, 28, 6–12. [Google Scholar] [CrossRef]
  22. Xu, X.J. Research on Accessibility Evaluation of Community Elderly Care Service Facilities in Guang-zhou from Perspective of Community Differentiation. Urban Archit. Space 2022, 29, 98–101. [Google Scholar] [CrossRef]
  23. Zhao, Y.; Xu, F.; Wan, Y.L. Spatial Accessibility and Supply-demand Balance Analysis Method of Park Green Space based on Modified Gravity Model. J. Geo-Inf. Sci. 2022. Available online: https://kns.cnki.net/kcms/detail/11.5809.P.20220808.1651.002.html (accessed on 9 August 2022).
  24. Aziz, A.; Li, J.; Hu, S.; Hu, R. Spatial accessibility of township to county hospital and its disparity among age and urbanizing groups in Anhui, China-a GIS analysis. Comput. Urban Sci. 2022, 2, 9. [Google Scholar] [CrossRef]
  25. Chen, L.; Guo, W.; Perez, C. Social support and life satisfaction of ethnic minority elderly in China. Int. J. Aging Hum. Dev. 2019, 92, 301–321. [Google Scholar] [CrossRef] [PubMed]
  26. Ran, L.; Jiang, X.; Li, B.; Kong, H.; Du, M.; Wang, X.; Liu, Q. Association among activities of daily living, instrumental activities of daily living and health-related quality of life in elderly Yi ethnic minority. BMC Geriatr. 2017, 17, 74. [Google Scholar] [CrossRef] [PubMed]
  27. Chen, Z.S.; Liu, X.L.; Chin, K.S.; Pedrycz, W.; Tsui, K.L.; Skibniewski, M.J. Online-review analysis based large-scale group decision-making for determining passenger demands and evaluating passenger satisfaction: Case study of high-speed rail system in China. Inf. Fusion 2021, 69, 22–39. [Google Scholar] [CrossRef]
  28. Zhang, H.F.; Yang, F.T.; Jin, Q.L. Public Cultural Services and High-Quality Economic Development Policy Implications Based on Coupling Coordination Degree Model. Rev. Econ. Manag. 2022, 38, 58–70. [Google Scholar] [CrossRef]
  29. Wang, D.; Jiang, D.; Fu, J.; Lin, G.; Zhang, J. Comprehensive assessment of production–living–ecological space based on the coupling coordination degree model. Sustainability 2020, 12, 2009. [Google Scholar] [CrossRef] [Green Version]
  30. Osaka Prefectural Plan for Senior Citizens 2021. Osaka Prefectural Government. 2022. Available online: https://www.pref.osaka.lg.jp/kaigoshien/keikaku/index.html (accessed on 8 November 2022).
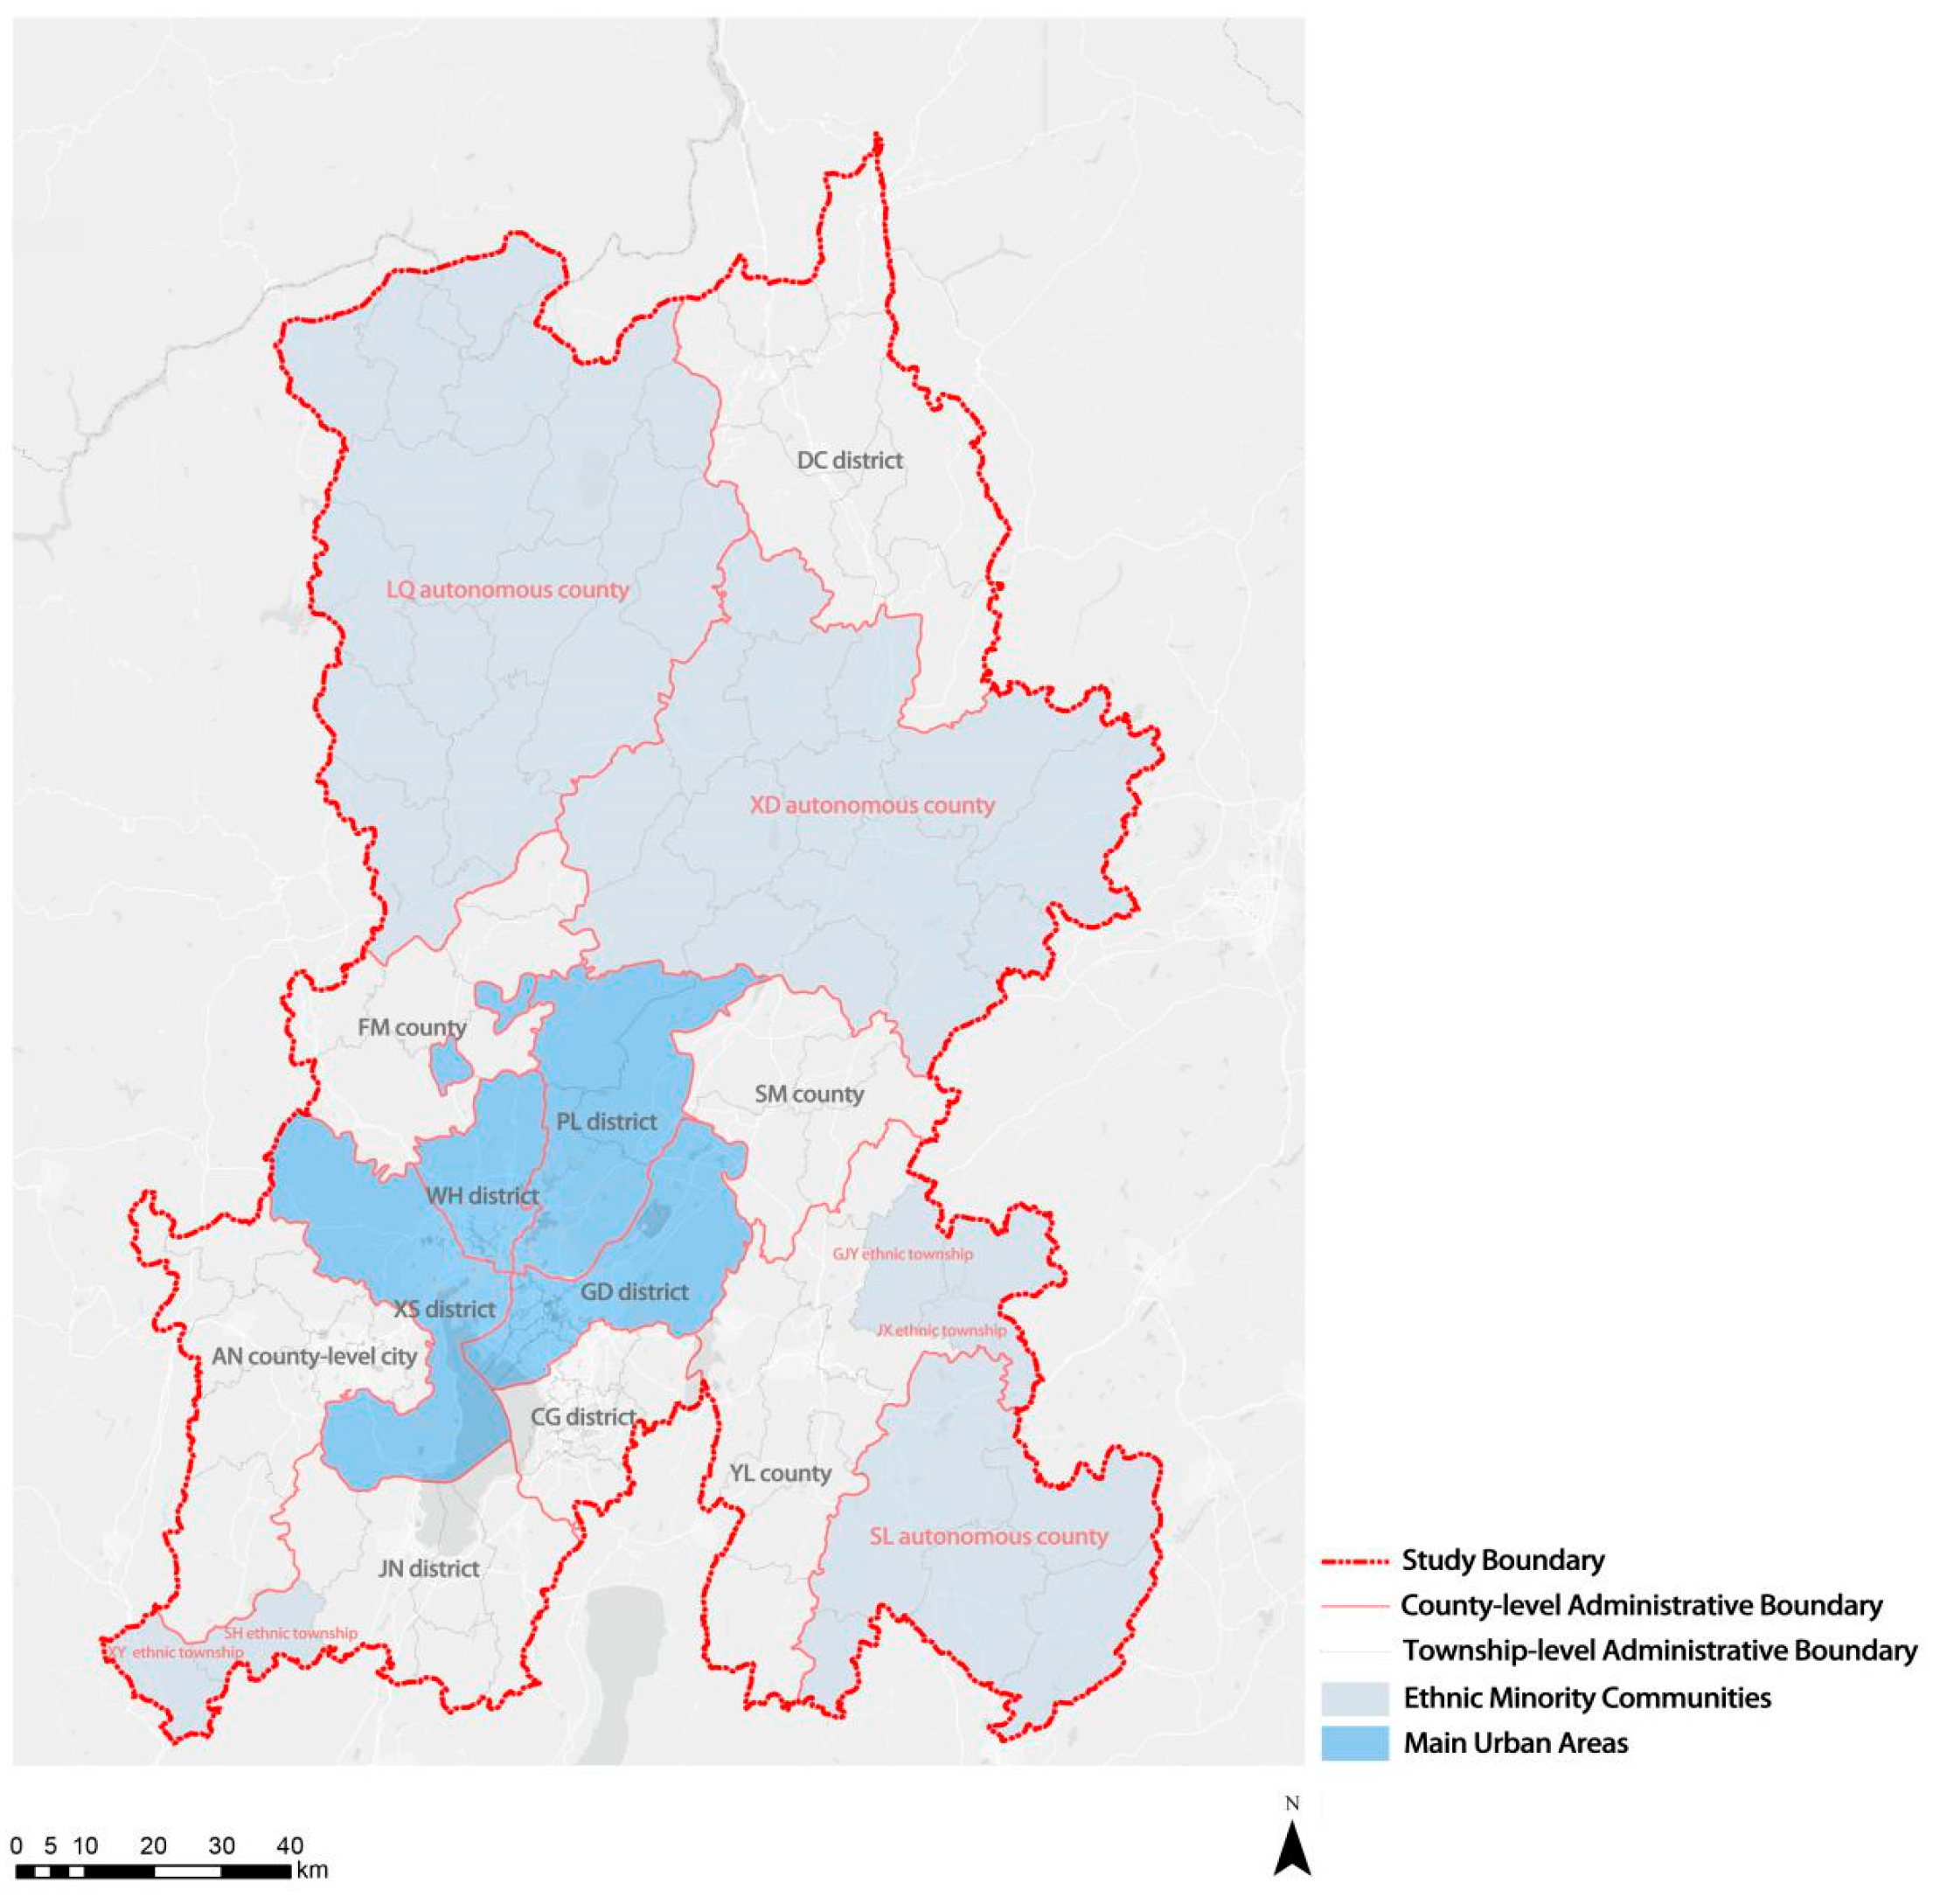
Figure 1. Study area (different districts/counties and townships/subdistricts are marked).
Ijerph 20 03291 g001
Figure 2. Flow chart of web information crawling.
Ijerph 20 03291 g002
Figure 3. Visualization of distribution results of percentage of the elderly population in KM.
Ijerph 20 03291 g003
Figure 4. Visualization of distribution results of population density of the elderly population in KM.
Ijerph 20 03291 g004
Figure 5. Visualization of distribution results of elderly dependency ratio in KM.
Ijerph 20 03291 g005
Figure 6. Distribution of elderly care institutions in KM.
Ijerph 20 03291 g006
Figure 7. Visualization of distribution results of the number of institutions per 1000 elders.
Ijerph 20 03291 g007
Figure 8. Visualization of distribution results of the number of institutional beds per 1000 elders.
Ijerph 20 03291 g008
Figure 9. Visualization of distribution results of the number of workers per 1000 elders.
Ijerph 20 03291 g009
Figure 10. Visualization of distribution results of convenience analysis of elderly care institutions.
Ijerph 20 03291 g010
Figure 11. Visualization of distribution results of coupling coordination between the degree of population aging and service level of elderly care institutions.
Ijerph 20 03291 g011
Table 1. Types of elderly care institutions in KM.
Administrative District
Institution Type
Social Welfare InstitutionNursing HomeAdult HomeIndependent Living ApartmentSanatoriumContinuing Care Retirement CommunityRetirement HomeAssisted LivingOthersTotal
WH District101061110424
PL District00730011113
GD District019120000527
XS District001891040638
DC District1000001002
CG District0010000102
JN District0010001103
FM County0020000002
YL County0000001001
SM County0020000002
SL Autonomous County0020000013
LQ Autonomous County0010000001
XD Autonomous County1000000001
AN County-Level City0021100037
Total315531319320126
Table 2. Organization type and care type of the involved elderly care institutions.
Administrative DistrictsOrganization TypeCare Type
State-RunPrivately OwnedOthersTotalIIIIIIIVVVIVIITotal
WH District11121241911002124
PL District49013713011013
GD District7200271602116127
XS District14240382315005438
DC District200210001002
CG District110210000012
JN District120310000113
FM County200220000002
YL County100110000001
SM County200220000002
SL Autonomous County210321000003
LQ Autonomous County100110000001
XD Autonomous County100110000001
AN County-Level Cities340730000407
Total527311268041113198126
I self-care; II self-care and half-care; III self-care, half-care, and full care; IV half-care, full care, and special care; V self-care, half-care, and special care; VI self-care, half-care, full care, and special care; VII self-care, half-care, full care, special care, and specialized care.
Table 3. Selected POI service facilities around elderly care institutions.
ServiceFacility
HealthcareGeneral hospitals, specialized hospitals, clinics, emergency centers, disease prevention institutions, pharmacies
Scenic spotPark square, scenic spot
Public facilityNewsstands, public telephones, public toilets, emergency shelters
Life serviceDaily services, travel agencies, information centers, ticket offices, post offices, express services, telecommunication offices, offices, water offices, electric power offices, beauty salons, repair stations, photography and printing stores, bath and massage facilities, laundries, funeral facilities
Shopping serviceShopping-related places, shopping malls, convenience stores, home appliance stores, supermarkets, flower stores, pet markets, home building material markets, general markets, cultural goods stores, sporting goods stores, specialty shopping streets, clothing stores, specialty stores, personal goods stores
Education, science, and cultureScience, education and culture places, museums, exhibition halls, convention centers, art galleries, libraries, science and technology museums, planetariums, cultural palaces, archives, literary and artistic groups
Sports and leisureSports and leisure services, sports venues, golf-related, entertainment venues, vacation retreats, leisure venues, movie theaters
Transportation serviceSubway stations, bus stops, drop-off, pick-up areas
Table 4. Evaluation indicators for the service level of elderly care institutions and the degree of population aging.
Tier 1 IndicatorsTier 2 IndicatorsTier 3 IndicatorsWeightData Source
Service level of senior care institutionsFundamental service levelNumber of elderly care institutions per 1000 elders0.090Linkolder and Elderly Care Information Network
Number of beds per 1000 elders0.102
Number of workers per 1000 elders0.109
Average price of bed and nursing care fees0.096
Convenience of livingMedical service facilities0.075AMAP
Green space service facilities0.076
Public service facilities0.076
Living service facilities0.075
Shopping service facilities0.075
Scientific, educational, and cultural facilities0.075
Transportation service facilities0.076
Sports and leisure facilities0.075
Degree of population agingProportion of populationPercentage of population aged 0–140.094Data of the Seventh National Population Census
Percentage of population aged 15–590.353
Proportion of population aged 60 or older0.141
Elderly-to-child ratio0.219
Dependency ratioTotal dependency ratio0.063
Child dependency ratio0.048
Elderly dependency ratio0.082
Disclaimer/Publisher’s Note: The statements, opinions and data contained in all publications are solely those of the individual author(s) and contributor(s) and not of MDPI and/or the editor(s). MDPI and/or the editor(s) disclaim responsibility for any injury to people or property resulting from any ideas, methods, instructions or products referred to in the content.