

Gender Differences in Determinants of the Components of the Frailty Phenotype among Older Adults in India: Findings from LASI Wave-1


Abstract
:1. Introduction
2. Materials and Methods
2.1. Data Source and Study Sample
2.2. Assessment of Frailty
- Exhaustion: Individuals were asked two questions from the CES-D scale: “how often they felt tired or low in energy last week?”. Those who responded “often” (3 or 4 days) or “most or all of the time” (5–7 days) were considered Exhausted = 1, and others were considered as No = 0.
- Weak grip strength: LASI measured handgrip strength using a handheld Smedley’s Hand Dynamometer. The average score (in kg) for the two successive trails of the dominant hand were calculated and considered as the final grip strength. The score in the bottom quintile was observed as weak grip strength and was adjusted for gender and body mass index. Low grip strength was considered as Yes = 1, and other was considered as No = 0.
- Slow walking time: Respondents were asked to walk 4 m at a usual walking pace twice. The time taken to walk was recorded in seconds, and the mean time was calculated. The score in the bottom quintile of the time values was adjusted for gender and height (median). Slow walk was considered as Yes = 1, and other was No = 0.
- Unintentional weight loss: Individuals were asked “whether they thought they had lost weight in the last 12 months because there was not enough food in their household”. Those who responded Yes = 1 were considered as having weight loss, and others were considered as No = 0.
- Low physical activity: We did not calculate physical activity as assessed by Fried et al., (2001) using the Minnesota Leisure Activity Questionnaire [9]. In LASI, participants were asked about their physical activity “How often do you take part in sports or vigorous activities”. Those who did not engage in moderate or vigorous physical activity (1–3 times a month or hardly ever or never) for a given time throughout the week were considered Physically Inactive = 1, and others were considered as Active = 0.
2.3. Background Characteristics
2.4. Statistical Analysis
3. Results
4. Discussion
5. Conclusions
Author Contributions
Funding
Institutional Review Board Statement
Informed Consent Statement
Data Availability Statement
Acknowledgments
Conflicts of Interest
References
- Fried, L.P.; Cohen, A.A.; Xue, Q.L.; Walston, J.; Bandeen-Roche, K.; Varadhan, R. The physical frailty syndrome as a transition from homeostatic symphony to cacophony. Nat. Aging 2021, 1, 36–46. [Google Scholar] [CrossRef]
- Gordon, A.L.; Masud, T.; Gladman, J.R. Now that we have a definition for physical frailty, what shape should frailty medicine take? Age Ageing 2014, 43, 8–9. [Google Scholar] [CrossRef]
- Dent, E.; Morley, J.E.; Cruz-Jentoft, A.J.; Woodhouse, L.; Rodríguez-Mañas, L.; Fried, L.P.; Woo, J.; Aprahamian, I.; Sanford, A.; Lundy, J.; et al. Physical frailty: ICFSR international clinical practice guidelines for identification and management. J. Nutr. Health Aging 2019, 23, 771–787. [Google Scholar] [CrossRef]
- Siriwardhana, D.D.; Hardoon, S.; Rait, G.; Weerasinghe, M.C.; Walters, K.R. Prevalence of frailty and prefrailty among community-dwelling older adults in low-income and middle-income countries: A systematic review and meta-analysis. BMJ Open 2018, 8, e018195. [Google Scholar] [CrossRef]
- Biritwum, R.B.; Minicuci, N.; Yawson, A.E.; Theou, O.; Mensah, G.P.; Naidoo, N.; Wu, F.; Guo, Y.; Zheng, Y.; Jiang, Y.; et al. Prevalence of and factors associated with frailty and disability in older adults from China, Ghana, India, Mexico, Russia and South Africa. Maturitas 2016, 91, 8–18. [Google Scholar] [CrossRef]
- Srivastava, S.; Muhammad, T. Socioeconomic vulnerability and frailty among community-dwelling older adults: Cross-sectional findings from longitudinal aging study in India, 2017–2018. BMC Geriatr. 2022, 22, 201. [Google Scholar] [CrossRef]
- MOSPI. Elderly in India-Profile and Programmes. Central Statistics Office. Ministry of Statistics and Programme Implementation. Government of India. 2016. Available online: http://mospi.nic.in/sites/default/files/publication_reports/ElderlyinIndia_2016.pdf (accessed on 19 November 2022).
- Hubbard, R.E. Sex differences in frailty. Frailty Aging 2015, 41, 41–53. [Google Scholar] [CrossRef]
- Fried, L.P.; Tangen, C.M.; Walston, J.; Newman, A.B.; Hirsch, C.; Gottdiener, J.; Seeman, T.; Tracy, R.; Kop, W.J.; Burke, G.; et al. Frailty in older adults: Evidence for a phenotype. J. Gerontol. Ser. A Biol. Sci. Med. Sci. 2001, 56, M146–M157. [Google Scholar] [CrossRef]
- Gagesch, M.; Chocano-Bedoya, P.O.; Abderhalden, L.A.; Freystaetter, G.; Sadlon, A.; Kanis, J.A.; Kressig, R.W.; Guyonnet, S.; DaSilva, J.A.; Felsenberg, D.; et al. Prevalence of physical frailty: Results from the DO-HEALTH study. J. Frailty Aging 2022, 11, 18–25. [Google Scholar] [CrossRef]
- Lee, S.; Kim, M.; Lee, Y.; Kim, J.; Jang, H.C.; Cho, B.; Choi, K.M.; Roh, E.; Son, S.J.; Lee, J.H.; et al. The effect of sex and physical frailty on incident disability after 2 years among community-dwelling older adults: KFACS study. BMC Geriatr. 2022, 22, 588. [Google Scholar] [CrossRef]
- Xue, Q.L. The frailty syndrome: Definition and natural history. Clin. Geriatr. Med. 2011, 27, 1–15. [Google Scholar] [CrossRef]
- Buta, B.J.; Walston, J.D.; Godino, J.G.; Park, M.; Kalyani, R.R.; Xue, Q.L.; Bandeen-Roche, K.; Varadhan, R. Frailty assessment instruments: Systematic characterization of the uses and contexts of highly-cited instruments. Ageing Res. Rev. 2016, 26, 53–61. [Google Scholar] [CrossRef]
- International Institute for Population Sciences (IIPS); National Programme for Health Care of Elderly (NPHCE); MoHFW, Harvard T. H. Chan School of Public Health (HSPH); the University of Southern California (USC). Longitudinal Ageing Study in India (LASI) Wave 1, 2017–2018, India Report; International Institute for Population Sciences: Mumbai, India, 2020; Available online: https://www.iipsindia.ac.in/sites/default/files/LASI_India_Report_2020_compressed.pdf (accessed on 19 November 2022).
- Das, S.; Mukhopadhyay, S.; Mukhopadhyay, B. The Association between Physical Frailty and Psycho-Social Health in Determining Geriatric Health-Related Quality of Life in Rural West Bengal, India. Ageing Int. 2022, 3, 1–15. [Google Scholar] [CrossRef]
- Ge, M.L.; Simonsick, E.M.; Dong, B.R.; Kasper, J.D.; Xue, Q.L. Frailty, with or without cognitive impairment, is a strong predictor of recurrent falls in a US population-representative sample of older adults. J. Gerontol. Ser. A 2021, 76, e354–e360. [Google Scholar] [CrossRef]
- Shalini, T.; Chitra, P.S.; Kumar, B.N.; Madhavi, G.; Reddy, G.B. Frailty and nutritional status among urban older adults in South India. J. Aging Res. 2020, 2020, 8763413. [Google Scholar] [CrossRef]
- Newcombe, R.G. Two-sided confidence intervals for the single proportion: Comparison of seven methods. Stat. Med. 1998, 17, 857–872. [Google Scholar] [CrossRef]
- Kozakai, R. Grip strength and healthy aging. J. Phys. Fit. Sport. Med. 2017, 6, 145–149. [Google Scholar] [CrossRef]
- Ramlagan, S.; Peltzer, K.; Phaswana-Mafuya, N. Hand grip strength and associated factors in non-institutionalised men and women 50 years and older in South Africa. BMC Res Notes 2014, 7, 8. [Google Scholar] [CrossRef]
- Syddall, H.; Cooper, C.; Martin, F.; Briggs, R.; Aihie Sayer, A. Is grip strength a useful single marker of frailty? Age ageing 2003, 32, 650–656. [Google Scholar] [CrossRef]
- Xue, Q.L.; Bandeen-Roche, K.; Varadhan, R.; Zhou, J.; Fried, L.P. Initial manifestations of frailty criteria and the development of frailty phenotype in the Women’s Health and Aging Study II. J. Gerontol. Ser. A Biol. Sci. Med. Sci. 2008, 63, 984–990. [Google Scholar] [CrossRef]
- Dodds, R.M.; Syddall, H.E.; Cooper, R.; Kuh, D.; Cooper, C.; Sayer, A.A. Global variation in grip strength: A systematic review and meta-analysis of normative data. Age Ageing 2016, 45, 209–216. [Google Scholar] [CrossRef] [PubMed]
- Dudzińska-Griszek, J.; Szuster, K.; Szewieczek, J. Grip strength as a frailty diagnostic component in geriatric inpatients. Clin. Interv. Aging 2017, 12, 1151. [Google Scholar] [CrossRef] [PubMed]
- Sella-Weiss, O. Association between swallowing function, malnutrition and frailty in community dwelling older people. Clin. Nutr. ESPEN 2021, 45, 476–485. [Google Scholar] [CrossRef] [PubMed]
- Lenardt, M.H.; Binotto, M.A.; Carneiro, N.H.; Cechinel, C.; Betiolli, S.E.; Lourenço, T.M. Handgrip strength and physical activity in frail elderly. Rev. Esc. Enferm. USP 2016, 50, 86–92. [Google Scholar] [CrossRef]
- Das, S.; Chandel, S. Frailty pattern among elderly rural women of India. Indian J. Gerontol. 2018, 32, 138–148. [Google Scholar]
- Muhammad, T.; Saravanakumar, P.; Sharma, A.; Srivastava, S.; Irshad, C.V. Association of food insecurity with physical frailty among older adults: Study based on LASI, 2017–2018. Arch. Gerontol. Geriatr. 2022, 103, 104762. [Google Scholar] [CrossRef]
- Bohannon, R.W. Grip strength: An indispensable biomarker for older adults. Clin. Interv. Aging 2019, 4, 1681. [Google Scholar] [CrossRef]
- Sundarakumar, J.S.; Raviteja, K.V.; Muniz-Terrera, G.; Ravindranath, V. Normative data for three physical frailty parameters in an aging, rural Indian population. Health Sci. Rep. 2022, 5, e567. [Google Scholar] [CrossRef]
- Dodds Richard, M.; Syddall Holly, E.; Cooper Rachel, B.M.; Deary Ian, J.; Dennison Elaine, M.; Der Geoff, G.C.; Inskip Hazel, M.; Jagger Carol, K.T.; Lawlor Debbie, A.; Robinson Sian, M.; et al. Grip Strength across the Life Course: Normative Data from Twelve British Studies. PLoS ONE 2014, 9, e113637. [Google Scholar] [CrossRef]
- Lino, V.T.; Rodrigues, N.C.; O’Dwyer, G.; Andrade, M.K.; Mattos, I.E.; Portela, M.C. Handgrip strength and factors associated in poor elderly assisted at a primary care unit in Rio de Janeiro, Brazil. PLoS ONE 2016, 11, e0166373. [Google Scholar] [CrossRef]
- Gallup, A.C.; O’Brien, D.T.; White, D.D.; Wilson, D.S. Handgrip strength and socially dominant behavior in male adolescents. Evol. Psychol. 2010, 8, 147470491000800207. [Google Scholar] [CrossRef]
- Mitchell, W.K.; Williams, J.; Atherton, P.; Larvin, M.; Lund, J.; Narici, M. Sarcopenia, dynapenia, and the impact of advancing age on human skeletal muscle size and strength; a quantitative review. Front. Physiol. 2012, 3, 260. [Google Scholar] [CrossRef] [PubMed]
- Goodpaster, B.H.; Park, S.W.; Harris, T.B.; Kritchevsky, S.B.; Nevitt, M.; Schwartz, A.V.; Simonsick, E.M.; Tylavsky, F.A.; Visser, M.; Newman, A.B. The loss of skeletal muscle strength, mass, and quality in older adults: The health, aging and body composition study. J. Gerontol. Ser. A Biol. Sci. Med. Sci. 2006, 61, 1059–1064. [Google Scholar] [CrossRef] [PubMed]
- Oksuzyan, A.; Maier, H.; McGue, M.; Vaupel, J.W.; Christensen, K. Sex differences in the level and rate of change of physical function and grip strength in the Danish 1905-cohort study. J. Aging Health 2010, 22, 589–610. [Google Scholar] [CrossRef]
- da Silva, V.D.; Tribess, S.; Meneguci, J.; Sasaki, J.E.; Garcia-Meneguci, C.A.; Carneiro, J.A.; Virtuoso, J.S. Association between frailty and the combination of physical activity level and sedentary behavior in older adults. BMC Public Health 2019, 19, 709. [Google Scholar] [CrossRef]
- Haider, S.; Grabovac, I.; Dorner, T.E. Effects of physical activity interventions in frail and prefrail community-dwelling people on frailty status, muscle strength, physical performance and muscle mass-a narrative review. Wien Klin. Wochenschr. 2019, 131, 244–254. [Google Scholar] [CrossRef]
- O’Connell, M.L.; Coppinger, T.; McCarthy, A.L. The role of nutrition and physical activity in frailty: A review. Clin. Nutr. ESPEN 2020, 35, 1–11. [Google Scholar] [CrossRef]
- Sobhani, A.; Sharifi, F.; Fadayevatan, R.; Kamrani, A.A.A.; Moodi, M.; Khorashadizadeh, M.; Kazemi, T.; Khodabakhshi, H.; Fakhrzadeh, H.; Arzaghi, M.; et al. Low physical activity is the strongest factor associated with frailty phenotype and frailty index: Data from baseline phase of Birjand Longitudinal Aging Study (BLAS). BMC Geriatr. 2022, 22, 498. [Google Scholar] [CrossRef]
- Fried, L.P. Interventions for human frailty: Physical activity as a model. Cold Spring Harb. Perspect. Med. 2016, 6, a025916. [Google Scholar] [CrossRef] [PubMed]
- Angulo, J.; El Assar, M.; Álvarez-Bustos, A.; Rodríguez-Mañas, L. Physical activity and exercise: Strategies to manage frailty. Redox Biol. 2020, 35, 101513. [Google Scholar] [CrossRef]
- Landi, F.; Abbatecola, A.M.; Provinciali, M.; Corsonello, A.; Bustacchini, S.; Manigrasso, L.; Cherubini, A.; Bernabei, R.; Lattanzio, F. Moving against frailty: Does physical activity matter? Biogerontology 2010, 11, 537–545. [Google Scholar] [CrossRef] [PubMed]
- Blodgett, J.; Theou, O.; Kirkland, S.; Andreou, P.; Rockwood, K. The association between sedentary behaviour, moderate–vigorous physical activity and frailty in NHANES cohorts. Maturitas 2015, 80, 187–191. [Google Scholar] [CrossRef] [PubMed]
- Wanaratna, K.; Muangpaisan, W.; Kuptniratsaikul, V.; Chalermsri, C.; Nuttamonwarakul, A. Prevalence and factors associated with frailty and cognitive frailty among community-dwelling elderly with knee osteoarthritis. J. Community Health 2019, 44, 587–595. [Google Scholar] [CrossRef] [PubMed]
- Kendhapedi, K.K.; Devasenapathy, N. Prevalence and factors associated with frailty among community-dwelling older people in rural Thanjavur district of South India: A cross-sectional study. BMJ OPEN 2019, 9, e032904. [Google Scholar] [CrossRef]
- Shilpa, K.; Norman, G. Prevalence of frailty and its association with lifestyle factors among elderly in rural Bengaluru. J. Fam. Med. Prim. Care 2022, 11, 2083–2089. [Google Scholar] [CrossRef]
- Azevedo, M.R.; Araújo, C.L.; Reichert, F.F.; Siqueira, F.V.; da Silva, M.C.; Hallal, P.C. Gender differences in leisure-time physical activity. Int. J. Public Health 2007, 52, 8–15. [Google Scholar] [CrossRef]
- Sun, F.; Norman, I.J.; While, A.E. Physical activity in older people: A systematic review. BMC Public Health 2013, 13, 449. [Google Scholar] [CrossRef]
- Lee, Y.S. Gender differences in physical activity and walking among older adults. J. Women Aging 2005, 17, 55–70. [Google Scholar] [CrossRef]
- Guthold, R.; Ono, T.; Strong, K.L.; Chatterji, S.; Morabia, A. Worldwide variability in physical inactivity: A 51-country survey. Am. J. Prev. Med. 2008, 34, 486–494. [Google Scholar] [CrossRef]

| Background Characteristics (%) | Male | Female | |||||||||
|---|---|---|---|---|---|---|---|---|---|---|---|
| 60–69 | 70–79 | ≥80 | N | p-Value | 60–69 | 70–79 | ≥80 | N | p-Value | ||
| Place of Residence | Urban | 28.61 | 29.89 | 25.25 | 4892 | <0.001 | 31.39 | 31.04 | 27.87 | 5572 | 0.071 |
| Rural | 71.39 | 70.11 | 74.75 | 9993 | 68.61 | 68.96 | 72.13 | 10,521 | |||
| Marital Status | Currently in wedlock | 86.71 | 77.10 | 57.53 | 12,246 | <0.001 | 57.88 | 31.68 | 11.81 | 7513 | <0.001 |
| Not in wedlock | 13.29 | 22.90 | 42.47 | 2639 | 42.12 | 68.32 | 88.19 | 8580 | |||
| Education level | No education | 35.07 | 40.03 | 46.71 | 5398 | <0.001 | 68.58 | 74.74 | 82.81 | 11,230 | <0.001 |
| Primary | 28.26 | 30.44 | 32.85 | 4441 | 17.97 | 16.9 | 13.28 | 3012 | |||
| Secondary | 23.41 | 18.2 | 11.49 | 3240 | 9.39 | 6.11 | 3.04 | 1291 | |||
| Higher and above | 13.25 | 11.34 | 8.95 | 1806 | 4.06 | 2.25 | 0.86 | 560 | |||
| Work Status | Never worked | 3.35 | 4.26 | 5.12 | 811 | <0.001 | 45.84 | 50.1 | 52.02 | 7940 | <0.001 |
| Currently working | 56.77 | 30.89 | 12.22 | 6281 | 25.21 | 11.64 | 2.56 | 2951 | |||
| Not currently working | 29.45 | 50.05 | 68.63 | 5784 | 27.14 | 36.29 | 43.45 | 4846 | |||
| Retired | 10.43 | 14.8 | 14.03 | 1991 | 1.81 | 1.97 | 1.97 | 349 | |||
| Alcohol | No | 69.45 | 73.78 | 79.22 | 10,227 | <0.001 | 97.43 | 97.51 | 97.18 | 15,414 | 0.775 |
| Yes | 30.55 | 26.22 | 20.78 | 4651 | 2.57 | 2.49 | 2.82 | 679 | |||
| Smoking | No | 39.85 | 41.87 | 41.65 | 6549 | <0.001 | 79.31 | 76.70 | 74.32 | 12,417 | <0.001 |
| Yes | 60.15 | 58.13 | 58.35 | 8327 | 20.69 | 23.30 | 25.68 | 3670 | |||
| ADL | No | 85.29 | 78.57 | 63.03 | 12,323 | <0.001 | 81.34 | 69.13 | 57.48 | 12,319 | <0.001 |
| Yes | 14.71 | 21.43 | 36.97 | 2559 | 18.66 | 30.87 | 42.52 | 3772 | |||
| IADL | No | 69.99 | 57.26 | 40.51 | 9770 | <0.001 | 52.01 | 37.66 | 24.75 | 7729 | <0.001 |
| Yes | 30.01 | 42.74 | 59.49 | 5100 | 47.99 | 62.34 | 75.25 | 8333 | |||
| Total | 47.04 | 48.86 | 47.50 | 14,885 | <0.001 | 52.96 | 51.14 | 52.50 | 16,093 | <0.001 | |
| Fried Frailty Component | 60–69 Year Old | 70–79 Year Old | 80+ Year Old | Total | ||||
|---|---|---|---|---|---|---|---|---|
| Male N (W %) | Female N (W %) | Male N (W %) | Female N (W %) | Male N (W %) | Female N (W %) | Male N (W %) | Female N (W %) | |
| Exhaustion | 3053 (37.04) | 3675 (37.97) | 1672 (39.26) | 1820 (41.14) | 616 (39.18) | 717 (43.92) | 5341 (37.94) | 6212 (39.54) |
| Weak grip strength | 5619 (72.3) | 5023 (58.54) | 3406 (86.84) | 2998 (77.54) | 1219 (95.32) | 1183 (89.18) | 10244 (79.07) | 9204 (67.09) |
| Walk time | 695 (8.06) | 1572 (16.96) | 816 (19.72) | 1472 (35.43) | 544 (45.23) | 805 (58.45) | 2055 (15.4) | 3849 (26.31) |
| Weight loss | 364 (5.76) | 443 (5.22) | 207 (5.90) | 224 (6.32) | 74 (6.20) | 76 (5.10) | 645 (5.85) | 743 (5.53) |
| Low physical activity | 5181 (55.68) | 7640 (76.94) | 3268 (73.14) | 3843 (87.06) | 1301 (85.85) | 1538 (92.95) | 9750 (64.21) | 13021 (81.63) |
| Frailty combined | 1610 (19.87) | 2346 (24.81) | 1475 (35.04) | 1887 (41.58) | 764 (51.34) | 943 (56.8) | 3849 (27.85) | 5176 (33.16) |
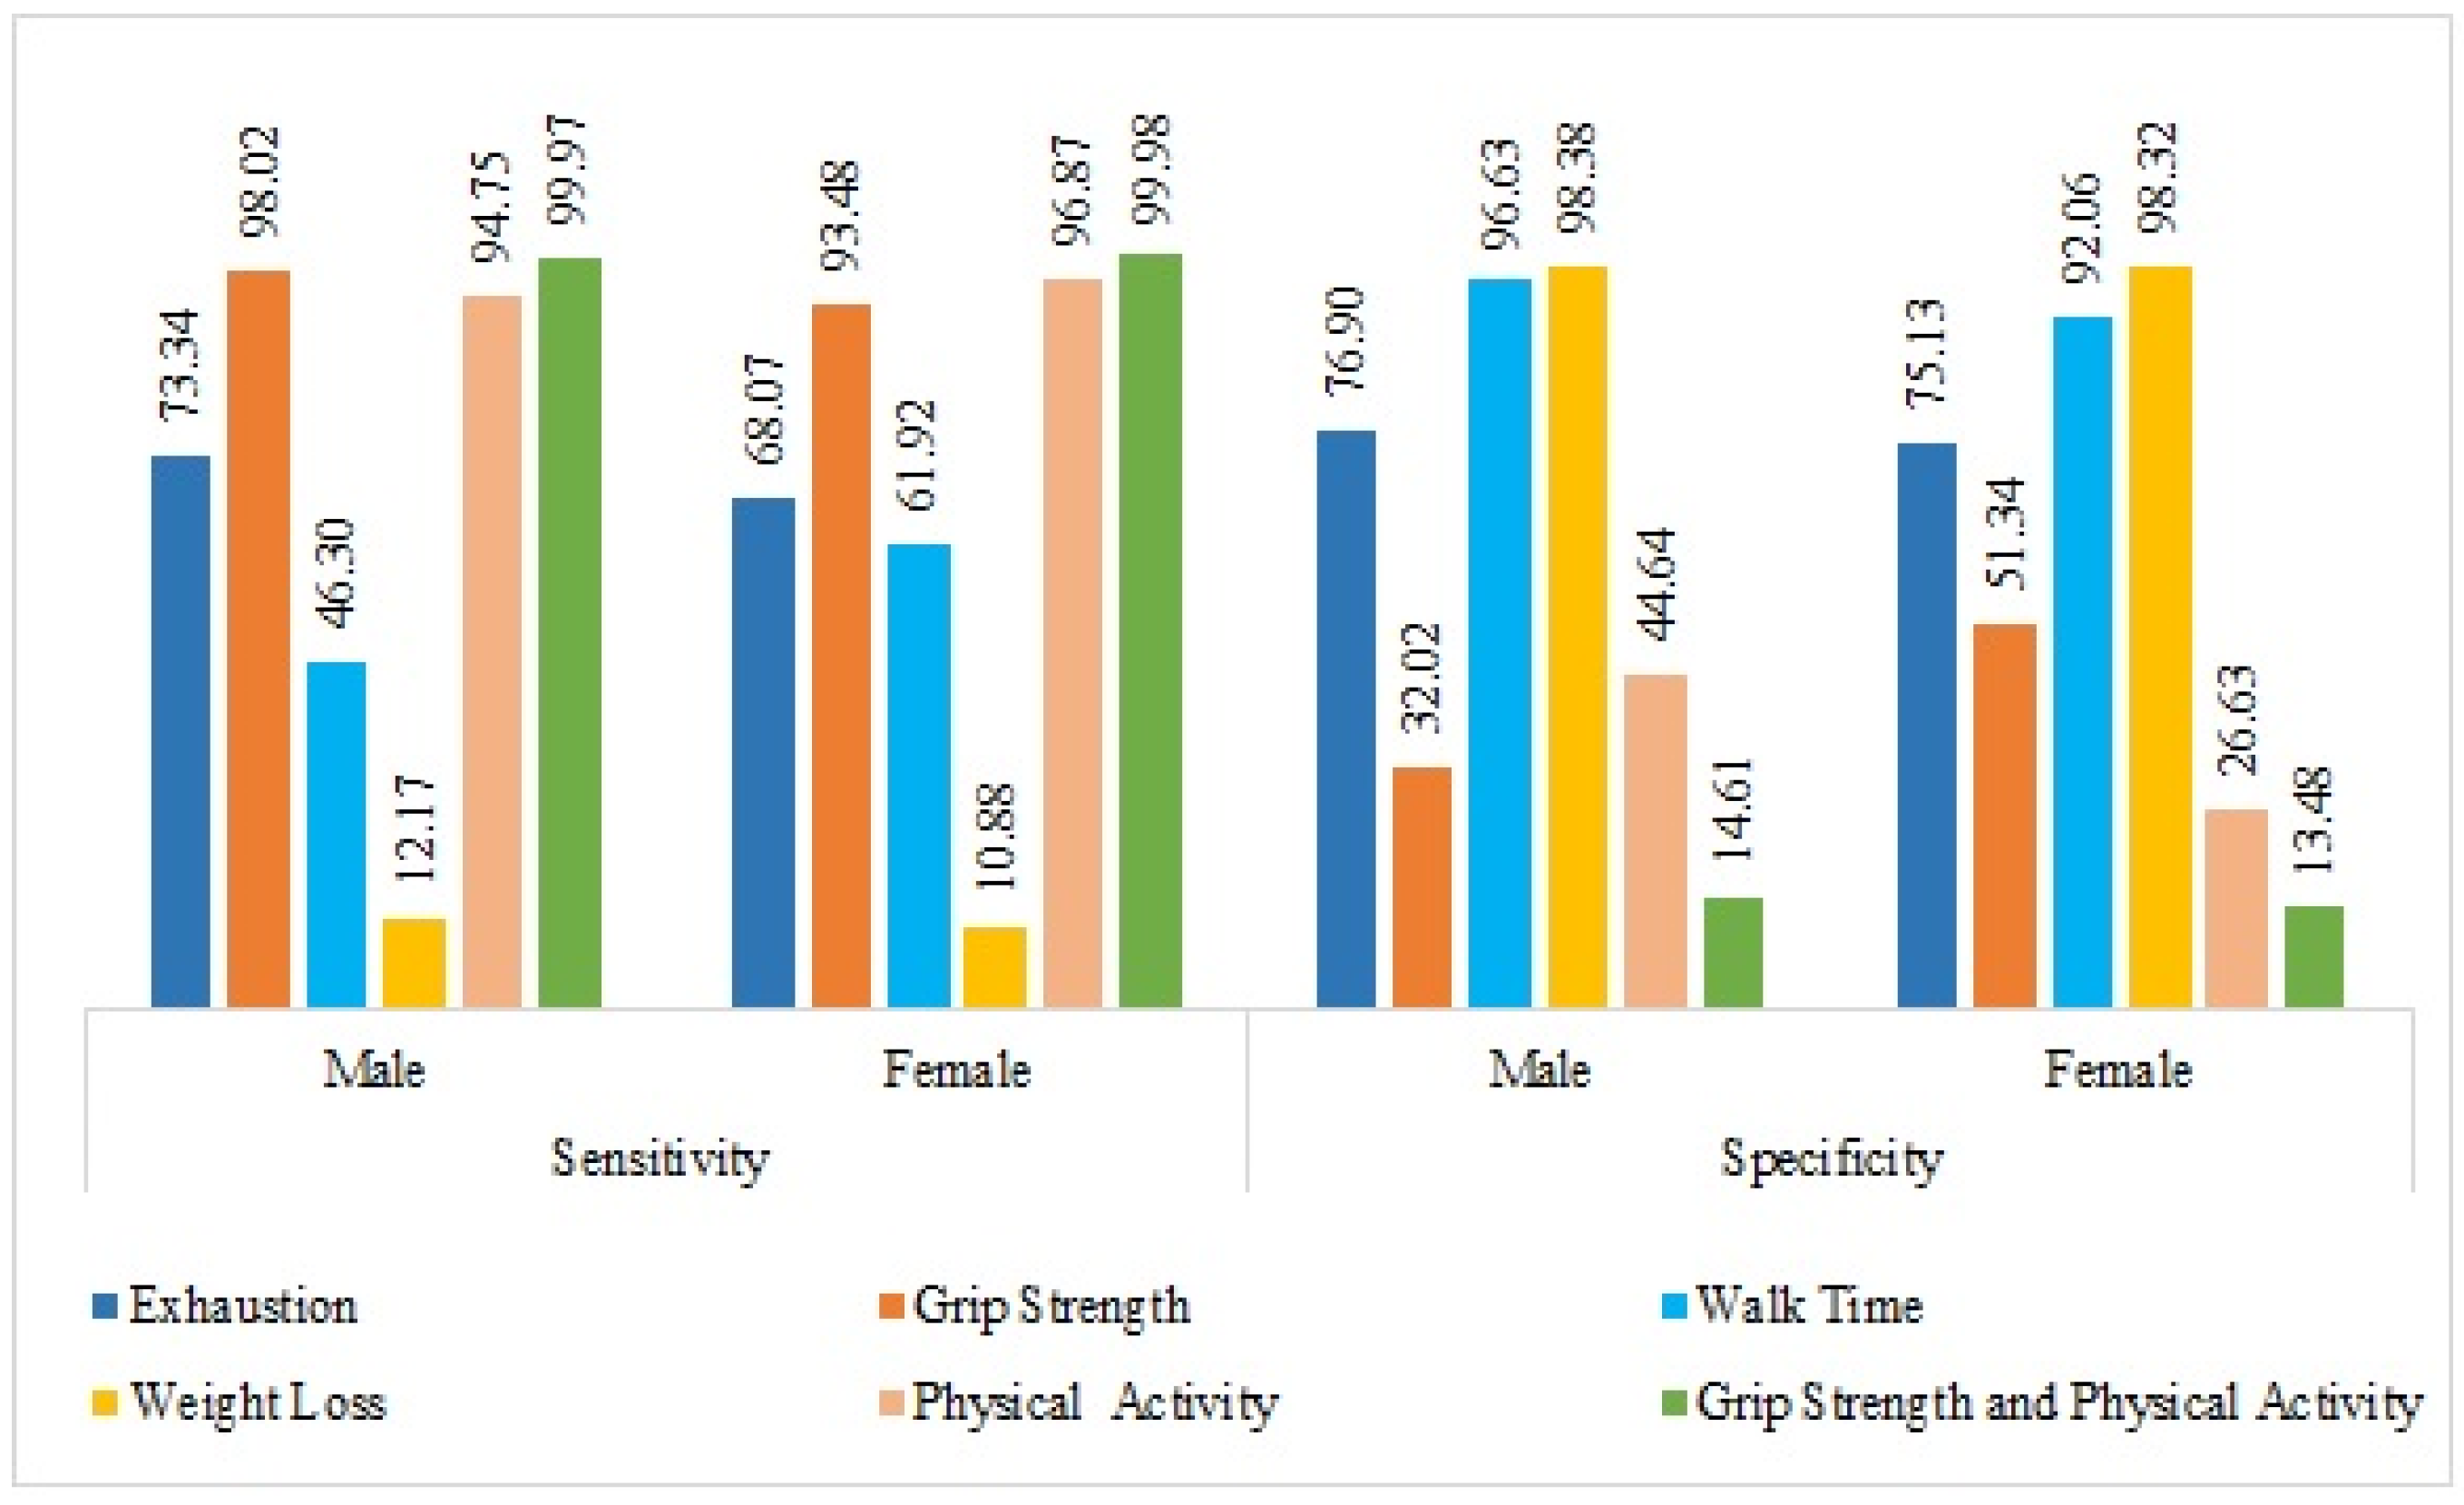
| Fried Frailty Components | Sensitivity % (95% C.I.) | Specificity % (95% C.I.) | Positive Predictive Value (95% C.I.) | Negative Predictive Value (95% C.I.) | Prevalence (95% C.I.) |
|---|---|---|---|---|---|
| Male | |||||
| Individual Marker | |||||
| Exhaustion | 73.34 (72.63,74.06) | 76.9 (76.22,77.58) | 52.65 (51.84,53.45) | 89.18 (88.68,89.68) | 25.93 (25.23,26.64) |
| Grip strength | 98.02 (97.78,98.25) | 32.02 (31.23,32.81) | 36.17 (35.35,36.98) | 97.62 (97.36,97.88) | 28.21 (27.45,28.97) |
| Walk time | 46.3 (45.46,47.14) | 96.63 (96.32,96.93) | 84.04 (83.42,84.66) | 82.43 (81.79,83.08) | 27.72 (26.96,28.47) |
| Weight loss | 12.17 (11.64,12.69) | 98.38 (98.17,98.58) | 72.25 (71.53,72.97) | 76.31 (75.63,77) | 25.8 (25.09,26.5) |
| Physical activity | 94.75 (94.39,95.11) | 44.64 (43.84,45.44) | 37.41 (36.63,38.18) | 96.06 (95.74,96.37) | 25.88 (25.18,26.58) |
| Combined Markers | |||||
| Grip strength and physical activity | 99.97 (99.95,100) | 14.61 (14.02,15.21) | 31.28 (30.5,32.06) | 99.93 (99.89,99.97) | 27.99 (27.24,28.75) |
| Female | |||||
| Individual Marker | |||||
| Exhaustion | 68.07 (67.35,68.79) | 75.13 (74.46,75.8) | 56.52 (55.75,57.29) | 83.21 (82.63,83.78) | 32.2 (31.48,32.92) |
| Grip strength | 93.48 (93.07,93.88) | 51.34 (50.52,52.16) | 51.38 (50.56,52.2) | 93.47 (93.06,93.87) | 35.49 (34.7,36.27) |
| Walk time | 61.92 (61.13,62.72) | 92.06 (91.62,92.51) | 80.75 (80.1,81.39) | 81.81 (81.18,82.44) | 34.96 (34.18,35.74) |
| Weight loss | 10.88 (10.4,11.37) | 98.32 (98.12,98.52) | 75.37 (74.7,76.04) | 70.03 (69.32,70.74) | 32.07 (31.35,32.79) |
| Physical activity | 96.87 (96.6,97.14) | 26.63 (25.95,27.31) | 38.51 (37.76,39.26) | 94.72 (94.37,95.07) | 32.17 (31.45,32.89) |
| Combined Markers | |||||
| Grip strength and physical activity | 99.98 (99.96,100) | 13.48 (12.92,14.03) | 38.43 (37.64,39.22) | 99.92 (99.88,99.97) | 35.07 (34.3,35.85) |
Disclaimer/Publisher’s Note: The statements, opinions and data contained in all publications are solely those of the individual author(s) and contributor(s) and not of MDPI and/or the editor(s). MDPI and/or the editor(s) disclaim responsibility for any injury to people or property resulting from any ideas, methods, instructions or products referred to in the content. |
© 2023 by the authors. Licensee MDPI, Basel, Switzerland. This article is an open access article distributed under the terms and conditions of the Creative Commons Attribution (CC BY) license (https://creativecommons.org/licenses/by/4.0/).
Share and Cite
Das, S.; Prasad, J. Gender Differences in Determinants of the Components of the Frailty Phenotype among Older Adults in India: Findings from LASI Wave-1. Int. J. Environ. Res. Public Health 2023, 20, 3055. https://doi.org/10.3390/ijerph20043055
Das S, Prasad J. Gender Differences in Determinants of the Components of the Frailty Phenotype among Older Adults in India: Findings from LASI Wave-1. International Journal of Environmental Research and Public Health. 2023; 20(4):3055. https://doi.org/10.3390/ijerph20043055
Chicago/Turabian StyleDas, Sayani, and Jitender Prasad. 2023. "Gender Differences in Determinants of the Components of the Frailty Phenotype among Older Adults in India: Findings from LASI Wave-1" International Journal of Environmental Research and Public Health 20, no. 4: 3055. https://doi.org/10.3390/ijerph20043055
APA StyleDas, S., & Prasad, J. (2023). Gender Differences in Determinants of the Components of the Frailty Phenotype among Older Adults in India: Findings from LASI Wave-1. International Journal of Environmental Research and Public Health, 20(4), 3055. https://doi.org/10.3390/ijerph20043055