

Causal Relationships between Daily Physical Activity, Physical Function, and Cognitive Function Ultimately Leading to Happiness


Abstract
:1. Introduction
2. Materials and Methods
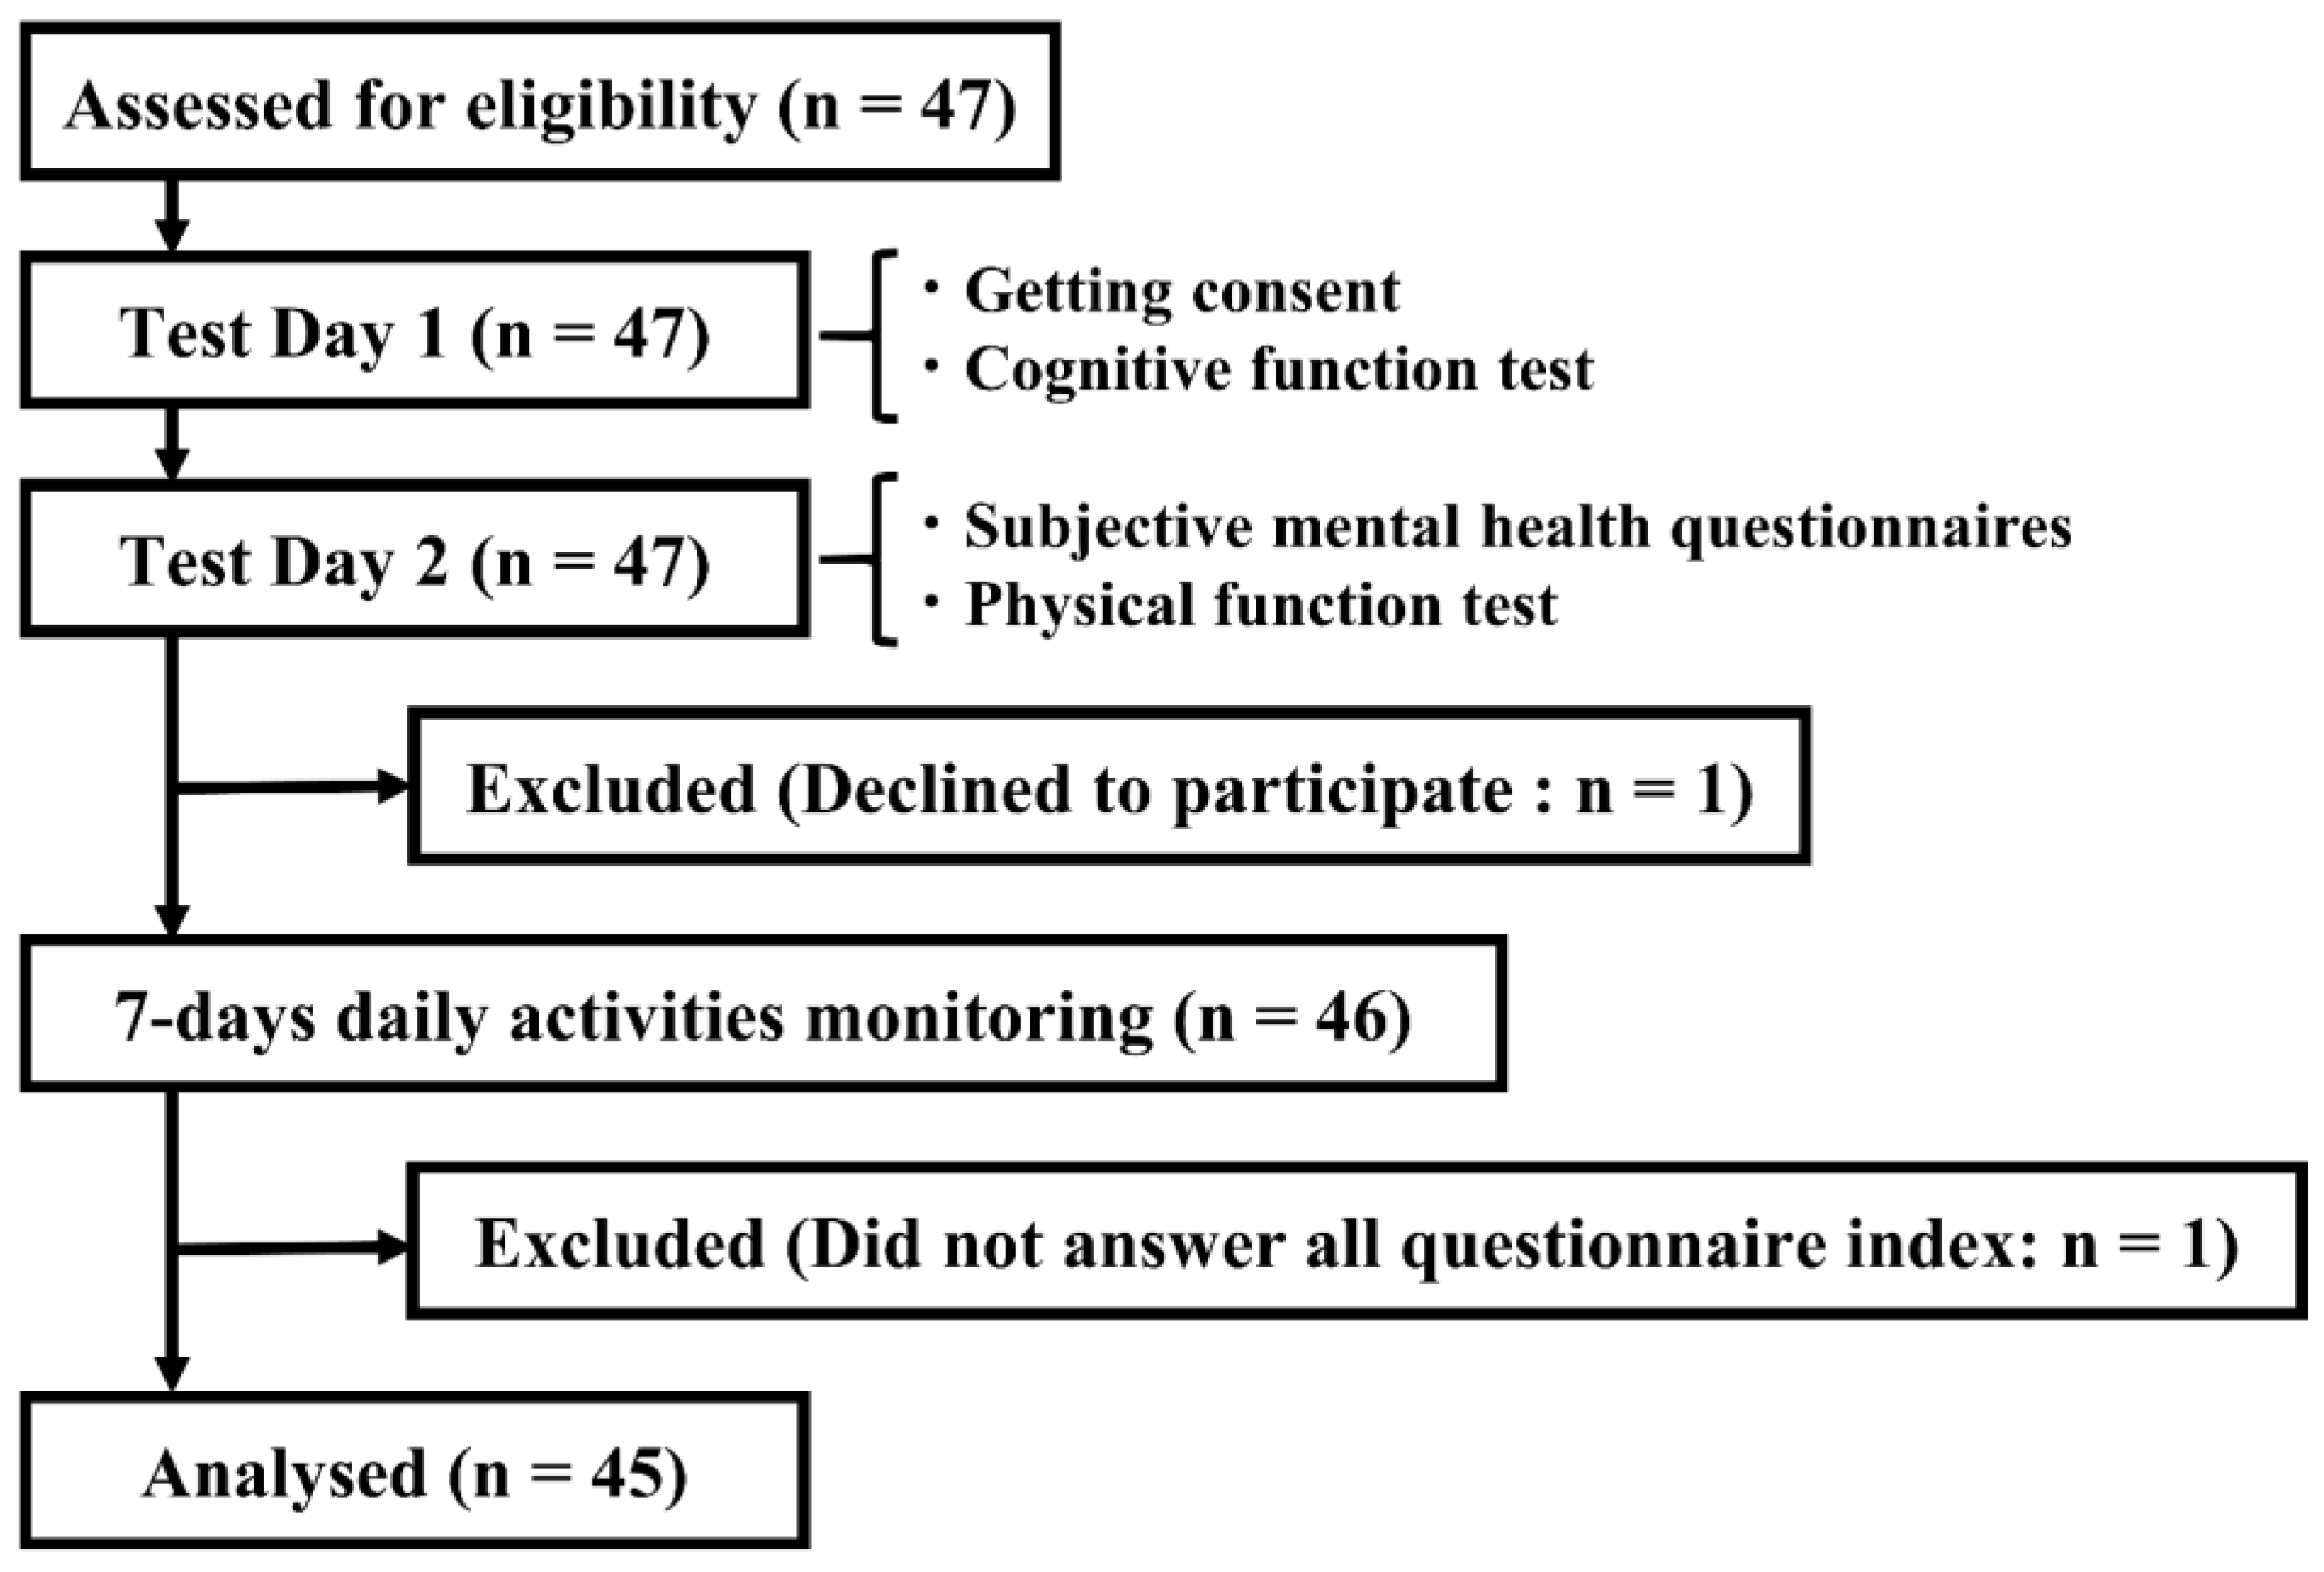
2.1. Participants
2.2. Measurement
2.2.1. Subjective Mental Health Indicator
2.2.2. Cognitive Function Indicator
2.2.3. Physical Function Indicator
2.2.4. Daily Physical Activity Indicator
2.3. Statistical Analysis
3. Results
4. Discussion
5. Conclusions
Supplementary Materials
Author Contributions
Funding
Institutional Review Board Statement
Informed Consent Statement
Data Availability Statement
Conflicts of Interest
References
- Oliveira, J.S.; Pinheiro, M.B.; Fairhall, N.; Walsh, S.; Chesterfield Franks, T.C.; Kwok, W.; Bauman, A.; Sherrington, C. Evidence on physical activity and the prevention of frailty and sarcopenia among older people: A systematic review to inform the World Health Organization physical activity guidelines. J. Phys. Act. Health 2020, 17, 1247–1258. [Google Scholar] [CrossRef] [PubMed]
- Sánchez-González, J.L.; Sánchez-Rodríguez, J.L.; Martín-Vallejo, J.; Martel-Martel, A.; González-Sarmiento, R. Effects of physical exercise on cognition and telomere length in healthy older women. Brain Sci. 2021, 11, 1417. [Google Scholar] [CrossRef] [PubMed]
- Lautenschlager, N.T.; Cox, K.L.; Flicker, L.; Foster, J.K.; van Bockxmeer, F.M.; Xiao, J.; Greenop, K.R.; Almeida, O.P. Effect of physical activity on cognitive function in older adults at risk for Alzheimer disease: A randomized trial. JAMA 2008, 300, 1027–1037. [Google Scholar] [CrossRef] [PubMed]
- Sáez de Asteasu, M.L.; Martínez-Velilla, N.; Zambom-Ferraresi, F.; Casas-Herrero, Á.; Cadore, E.L.; Galbete, A.; Izquierdo, M. Assessing the impact of physical exercise on cognitive function in older medical patients during acute hospitalization: Secondary analysis of a randomized trial. PLoS Med. 2019, 16, e1002852. [Google Scholar] [CrossRef]
- Zhang, S.; Zhen, K.; Su, Q.; Chen, Y.; Lv, Y.; Yu, L. The effect of aerobic exercise on cognitive function in people with Alzheimer’s disease: A systematic review and meta-analysis of randomized controlled trials. Int. J. Environ. Res. Public Health 2022, 19, 15700. [Google Scholar] [CrossRef] [PubMed]
- Northey, J.M.; Cherbuin, N.; Pumpa, K.L.; Smee, D.J.; Rattray, B. Exercise interventions for cognitive function in adults older than 50: A systematic review with meta-analysis. Br. J. Sport. Med. 2018, 52, 154–160. [Google Scholar] [CrossRef]
- Babaei, P.; Azari, H.B. Exercise training improves memory performance in older adults: A narrative review of evidence and possible mechanisms. Front. Hum. Neurosci. 2021, 15, 771553. [Google Scholar] [CrossRef]
- Oudbier, S.J.; Goh, J.; Looijaard, S.M.L.M.; Reijnierse, E.M.; Meskers, C.G.M.; Maier, A.B. Pathophysiological mechanisms explaining the association between low skeletal muscle mass and cognitive function. J. Gerontol. A Biol. Sci. Med. Sci. 2022, 77, 1959–1968. [Google Scholar] [CrossRef]
- Wang, R.; Holsinger, R.M.D. Exercise-induced brain-derived neurotrophic factor expression: Therapeutic implications for Alzheimer’s dementia. Ageing Res. Rev. 2018, 48, 109–121. [Google Scholar] [CrossRef]
- Cassilhas, R.C.; Tufik, S.; de Mello, M.T. Physical exercise, neuroplasticity, spatial learning and memory. Cell. Mol. Life Sci. 2016, 73, 975–983. [Google Scholar] [CrossRef]
- Kirk-Sanchez, N.J.; McGough, E.L. Physical exercise and cognitive performance in the elderly: Current perspectives. Clin. Interv. Aging 2014, 9, 51–62. [Google Scholar] [CrossRef]
- Lenze, E.J.; Voegtle, M.; Miller, J.P.; Ances, B.M.; Balota, D.A.; Barch, D.; Depp, C.A.; Diniz, B.S.; Eyler, L.T.; Foster, E.R.; et al. Effects of mindfulness training and exercise on cognitive function in older adults: A randomized clinical trial. JAMA 2022, 328, 2218–2229. [Google Scholar] [CrossRef] [PubMed]
- Sánchez-González, J.L.; Sánchez-Rodríguez, J.L.; Juárez-Vela, R.; Ruiz de Viñaspre-Hernandez, R.; González-Sarmiento, R.; Martin-Vallejo, F.J. Analysis of telomere length and its implication in neurocognitive functions in elderly women. J. Clin. Med. 2022, 11, 1728. [Google Scholar] [CrossRef] [PubMed]
- Lamb, S.E.; Sheehan, B.; Atherton, N.; Nichols, V.; Collins, H.; Mistry, D.; Dosanjh, S.; Slowther, A.M.; Khan, I.; Petrou, S.; et al. Dementia And Physical Activity (DAPA) trial of moderate to high intensity exercise training for people with dementia: Randomised controlled trial. BMJ 2018, 361, k1675. [Google Scholar] [CrossRef]
- Tse, M.M.; Tang, S.K.; Wan, V.T.; Vong, S.K. The effectiveness of physical exercise training in pain, mobility, and psychological well-being of older persons living in nursing homes. Pain Manag. Nurs. 2014, 15, 778–788. [Google Scholar] [CrossRef] [PubMed]
- Groessl, E.J.; Kaplan, R.M.; Rejeski, W.J.; Katula, J.A.; Glynn, N.W.; King, A.C.; Anton, S.D.; Walkup, M.; Lu, C.J.; Reid, K.; et al. Physical activity and performance impact long-term quality of life in older adults at risk for major mobility disability. Am. J. Prev. Med. 2019, 56, 141–146. [Google Scholar] [CrossRef]
- Wang, F.; Orpana, H.M.; Morrison, H.; de Groh, M.; Dai, S.; Luo, W. Long-term association between leisure-time physical activity and changes in happiness: Analysis of the prospective national population health survey. Am. J. Epidemiol. 2012, 176, 1095–1100. [Google Scholar] [CrossRef]
- Wilson, R.S.; Boyle, P.A.; Segawa, E.; Yu, L.; Begeny, C.T.; Anagnos, S.E.; Bennett, D.A. The influence of cognitive decline on well-being in old age. Psychol. Aging 2013, 28, 304–313. [Google Scholar] [CrossRef]
- Constantinidou, F.; Prokopiou, J.; Nikou, M.; Papacostas, S. Cognitive-linguistic performance and quality of life in healthy aging. Folia Phoniatr. Logop. 2015, 67, 145–155. [Google Scholar] [CrossRef]
- Hills, P.; Argyle, M. The Oxford Happiness Questionnaire: A compact scale for the measurement of psychological well-being. Pers. Individ. Dif. 2002, 33, 1073–1082. [Google Scholar] [CrossRef]
- World Health Organization. WHO QOL 26; Japanese Version; Tazaki, M., Nakane, Y., Eds.; Kaneko Syobo: Tokyo, Japan, 2006. [Google Scholar]
- MiniMental, L.L.C. MMSE; Japanese Version; Sugisita, M., Ed.; Nihon Bunka Kagakusya: Tokyo, Japan, 2020. [Google Scholar]
- Wechsler, D. Wechsler Adult Intelligence Scale, 4th ed.; Japanese Version; Ueno, K., Iwakuma, T., Dairoku, H., Yamanaka, K., Matsuda, O., Eds.; Nihon Bunka Kagakusya: Tokyo, Japan, 2018. [Google Scholar]
- Seichi, A.; Hoshino, Y.; Doi, T.; Akai, M.; Tobimatsu, Y.; Iwaya, T. Development of a screening tool for risk of locomotive syndrome in the elderly: The 25-question Geriatric Locomotive Function Scale. J. Orthop. Sci. 2012, 17, 163–172. [Google Scholar] [CrossRef] [PubMed]
- Muñoz-Mendoza, C.L.; Cabrero-García, J.; Reig-Ferrer, A.; Cabañero-Martínez, M.J. Evaluation of walking speed tests as a measurement of functional limitations in elderly people: A structured review. Int. J. Clin. Health Psychol. 2010, 10, 359–378. [Google Scholar]
- Ogata, T.; Muranaga, S.; Ishibashi, H.; Ohe, T.; Izumida, R.; Yoshimura, N.; Iwaya, T.; Nakamura, K. Development of a screening program to assess motor function in the adult population: A cross-sectional observational study. J. Orthop. Sci. 2015, 20, 888–895. [Google Scholar] [CrossRef]
- Inada, Y.; Tohda, C.; Yang, X. Effects of Cistanche tubulosa wight extract on locomotive syndrome: A placebo-controlled, randomized, double-blind study. Nutrients 2021, 13, 264. [Google Scholar] [CrossRef]
- Patria, B. Modeling the effects of physical activity, education, health, and subjective wealth on happiness based on Indonesian national survey data. BMC Public Health 2022, 22, 959. [Google Scholar] [CrossRef]
- Severinsen, M.C.K.; Pedersen, B.K. Muscle-organ crosstalk: The emerging roles of myokines. Endocr. Rev. 2020, 41, 594–609. [Google Scholar] [CrossRef] [PubMed]
- Valenzuela, P.L.; Castillo-García, A.; Morales, J.S.; de la Villa, P.; Hampel, H.; Emanuele, E.; Lista, S.; Lucia, A. Exercise benefits on Alzheimer’s disease: State-of-the-science. Ageing Res. Rev. 2020, 62, 101108. [Google Scholar] [CrossRef] [PubMed]
- Zaninotto, P.; Steptoe, A. Association between subjective well-being and living longer without disability or illness. JAMA Netw. Open 2019, 2, e196870. [Google Scholar] [CrossRef]
- Steptoe, A. Investing in happiness: The gerontological perspective. Gerontology 2019, 65, 634–639. [Google Scholar] [CrossRef]
- Mori, T.; Nagai, K.; Tamaki, K.; Kusunoki, H.; Wada, Y.; Tsuji, S.; Matsuzawa, R.; Sano, K.; Amano, M.; Shinmura, K. Impact of quality of life on future frailty status of rural Japanese community-dwelling older adults. Exp. Gerontol. 2022, 168, 111930. [Google Scholar] [CrossRef]


| Mean | SD | 95% CI | |||
|---|---|---|---|---|---|
| Chraracteristics | |||||
| Gender (Male:Female) | 24:21 | ||||
| Age (years) | 72.78 | 5.23 | 71.25 | – | 74.30 |
| Education (years) | 14.18 | 2.26 | 13.52 | – | 14.84 |
| Subjective mental health | |||||
| Happiness (points) | 3.98 | 0.54 | 3.82 | – | 4.14 |
| QOL (points) | 3.60 | 0.46 | 3.46 | – | 3.73 |
| Cognitive function | |||||
| MMSE-J | 28.29 | 1.41 | 27.88 | – | 28.70 |
| WAIS-Ⅳ | 87.42 | 11.97 | 83.92 | – | 90.92 |
| Block design | 11.58 | 2.79 | 10.76 | – | 12.39 |
| Similarities | 12.02 | 2.78 | 11.21 | – | 12.83 |
| Digit Span | 13.07 | 2.90 | 12.22 | – | 13.91 |
| Matrix reasoning | 13.04 | 3.10 | 12.14 | – | 13.95 |
| Symbolic search | 12.31 | 2.90 | 11.46 | – | 13.16 |
| Comprehension | 13.02 | 2.57 | 12.27 | – | 13.77 |
| Coding | 12.38 | 2.11 | 11.76 | – | 13.00 |
| Physical function | |||||
| GLFS-25 | 5.90 | 5.40 | 4.32 | – | 7.48 |
| 5 m walk test (m/s) | 2.35 | 0.52 | 2.20 | – | 2.50 |
| 2 step test (m/step) | 1.29 | 0.15 | 1.25 | – | 1.34 |
| Stand up test (points) | 18.09 | 12.83 | 14.34 | – | 21.84 |
| Daily physical activities | |||||
| Steps (steps/day) | 6103.19 | 2859.59 | 5267.69 | – | 6938.69 |
| Calore consumption (kcal/day) | 134.76 | 117.84 | 100.33 | – | 169.19 |
| MVPA(%) | 1.44 | 1.48 | 1.01 | – | 1.88 |
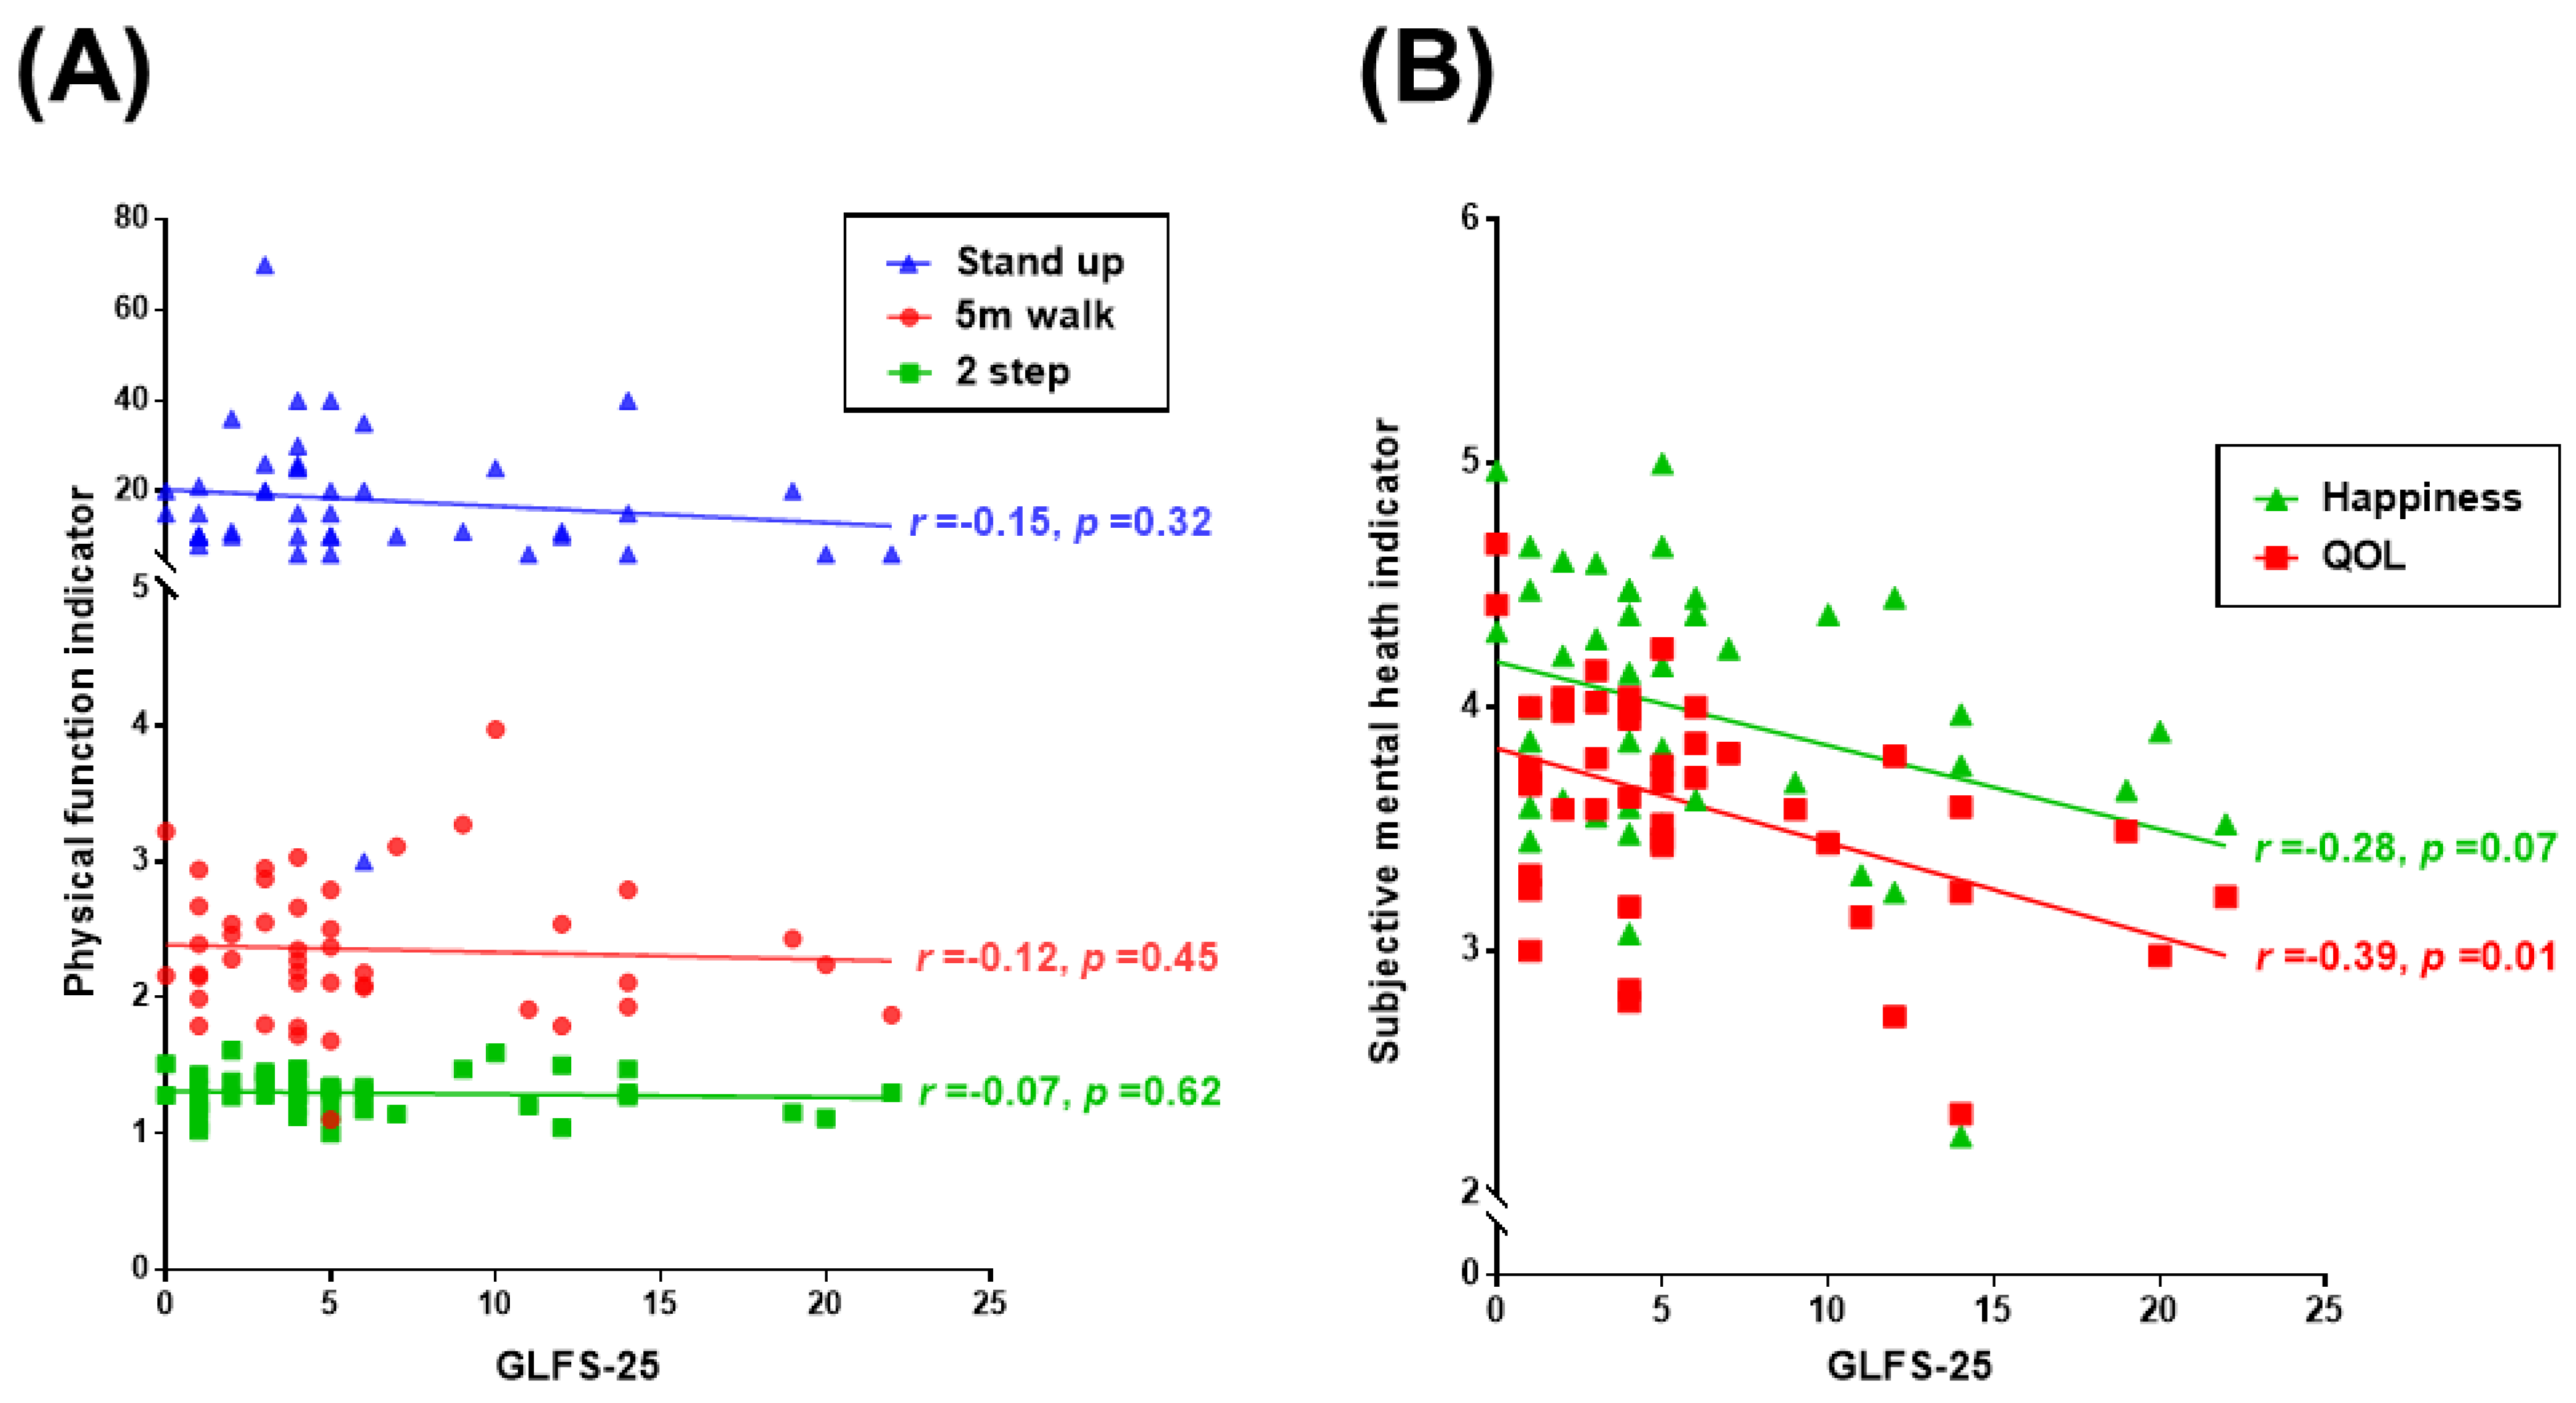
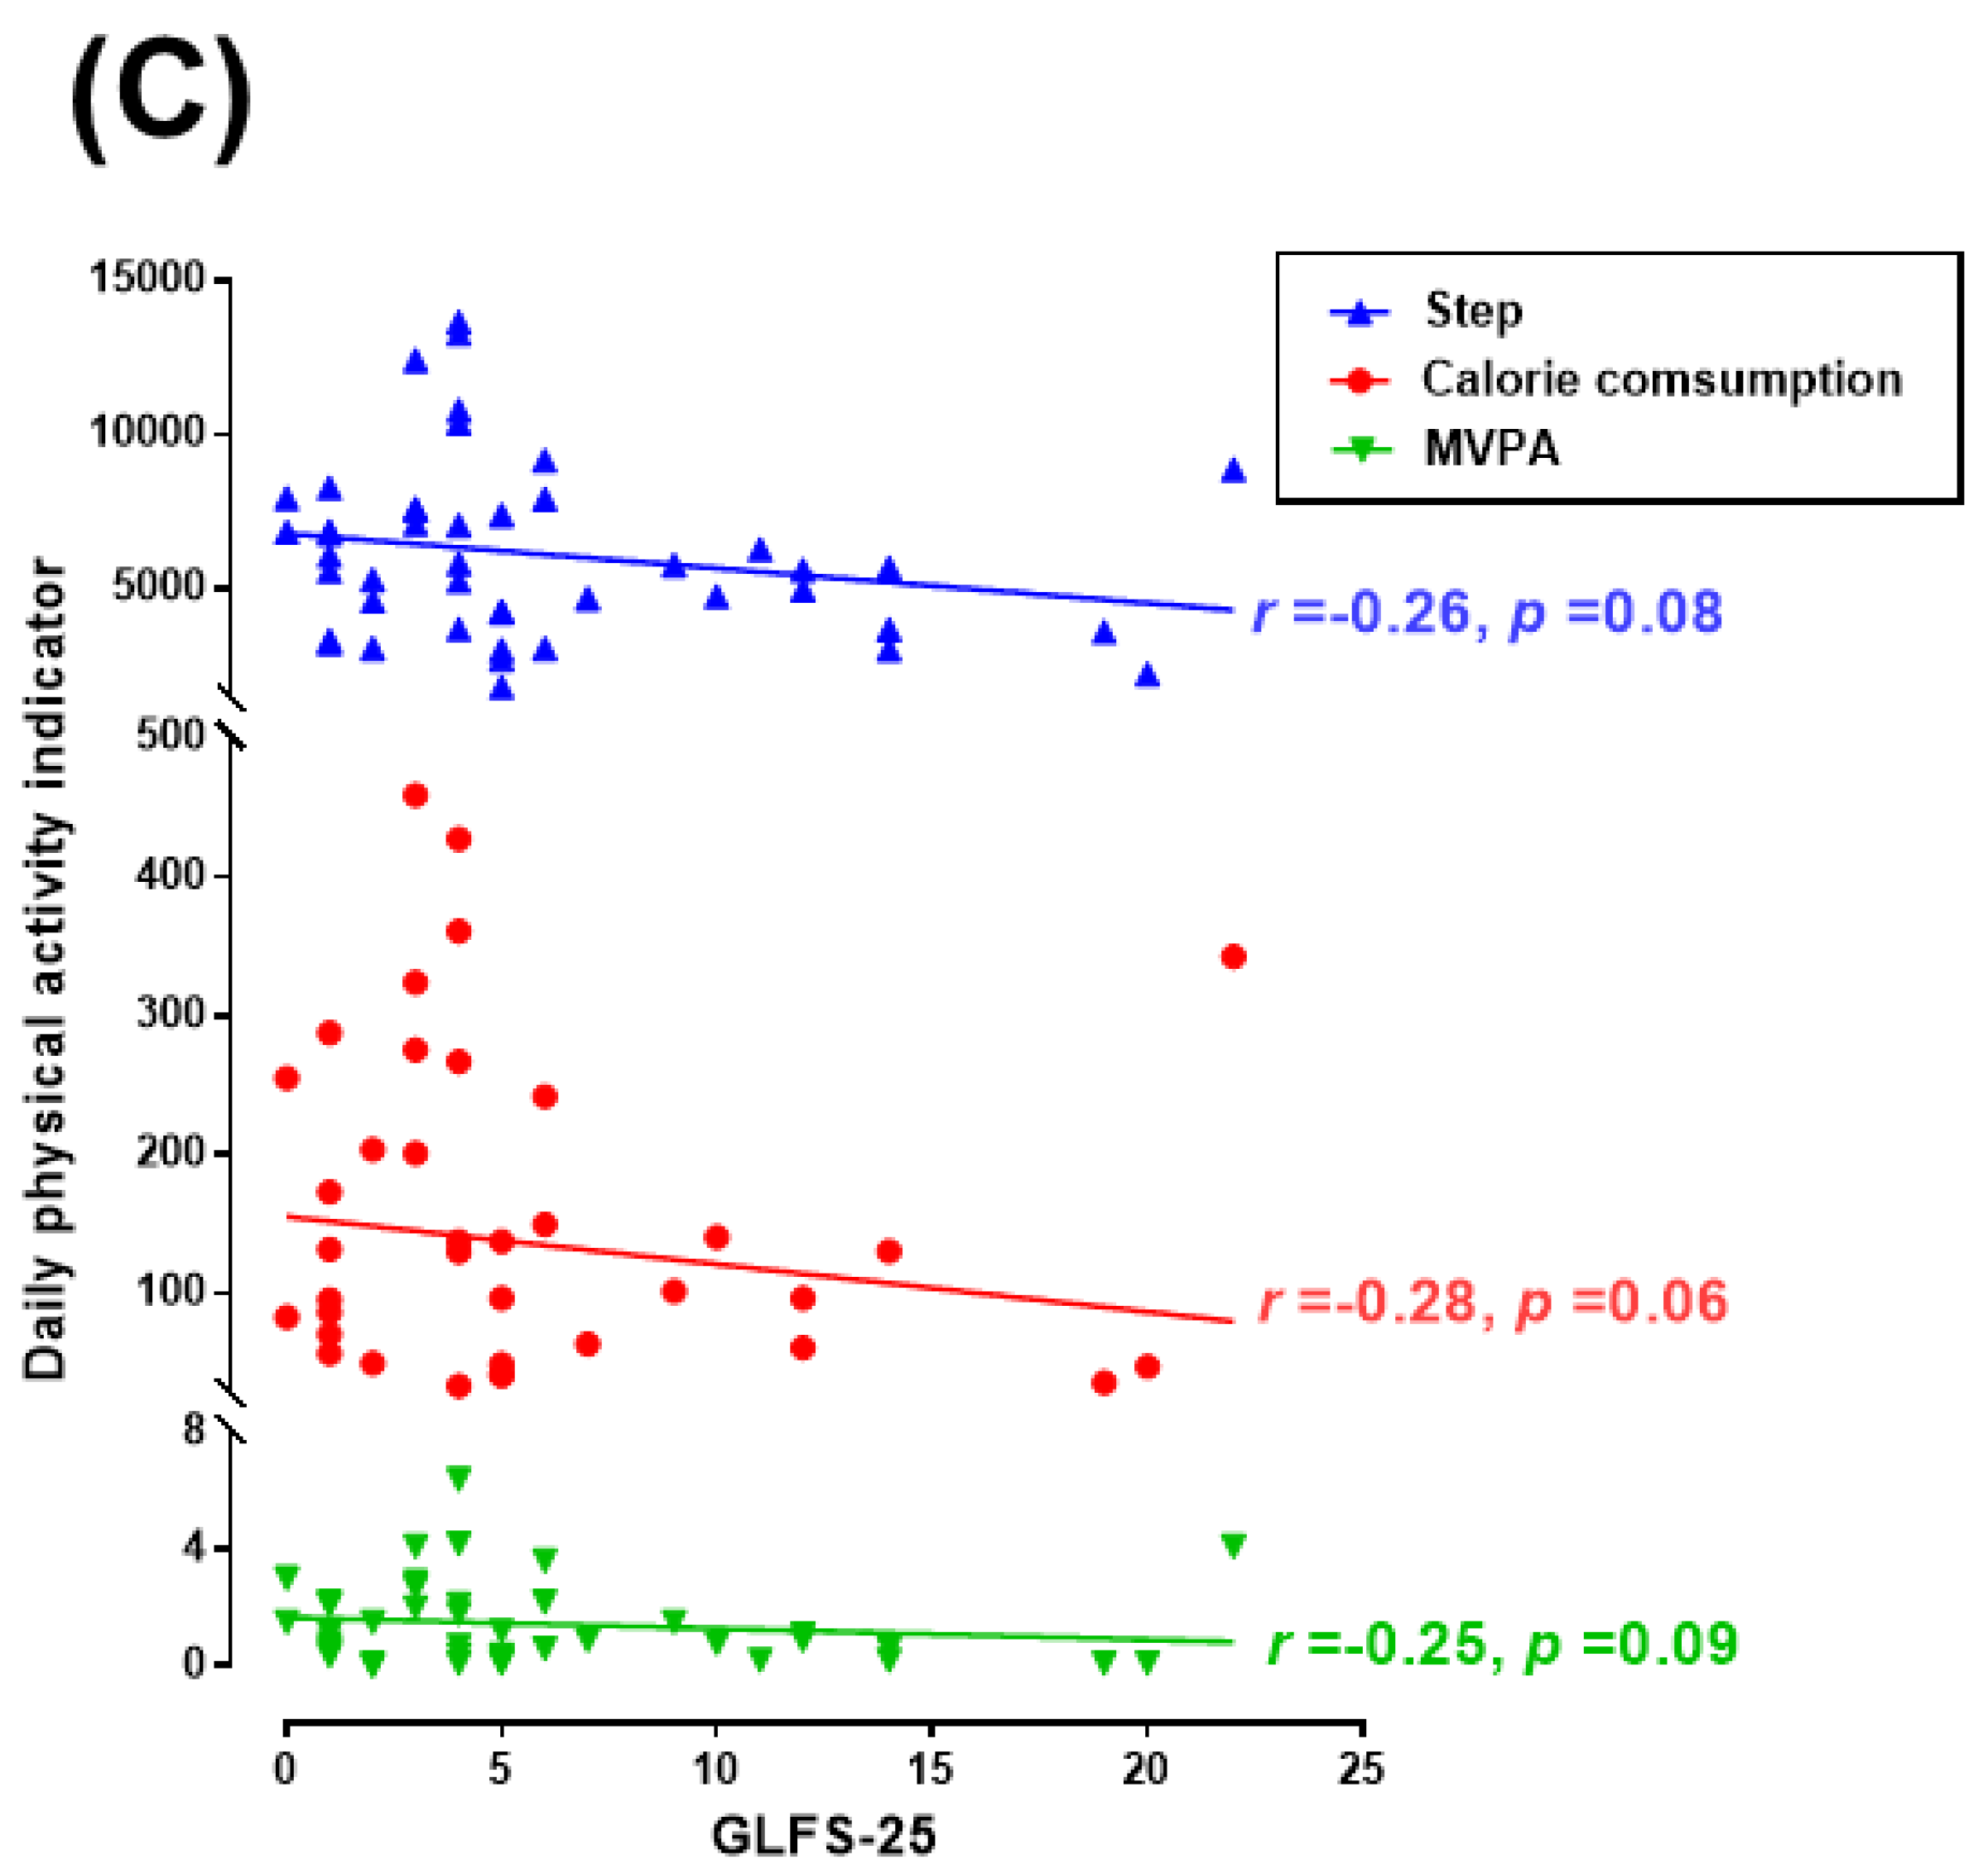
| Indicator | Subjective Mental Health | Cognitive Function | Physical Function | Daily Physical Activities | |||||||||||||||||
|---|---|---|---|---|---|---|---|---|---|---|---|---|---|---|---|---|---|---|---|---|---|
| Test | QOL | Happiness | MMSE−J | WAIS−Ⅳ | GLFS−25 | 5 m Walk | 2−Step | Stand up | Calorie Consumption | Steps | |||||||||||
| Subjective mental health | Happiness | 0.70 | ** | ||||||||||||||||||
| Cognitive function | MMSE-J | 0.11 | −0.09 | ||||||||||||||||||
| WAIS-Ⅳ | 0.14 | 0.00 | 0.43 | ** | |||||||||||||||||
| Physical function | GLFS-25 | −0.39 | ** | −0.28 | # | 0.06 | −0.13 | ||||||||||||||
| 5 m walk | 0.08 | 0.12 | 0.10 | 0.34 | * | −0.12 | |||||||||||||||
| 2-step | 0.06 | −0.01 | 0.51 | ** | 0.21 | −0.07 | 0.51 | ** | |||||||||||||
| Stand up | 0.25 | 0.04 | 0.30 | * | 0.27 | # | −0.15 | 0.19 | 0.44 | ** | |||||||||||
| Daily physical activities | Calorie consumption | 0.15 | 0.09 | 0.25 | # | 0.25 | −0.28 | # | 0.15 | 0.31 | * | 0.34 | * | ||||||||
| Steps | 0.09 | −0.08 | 0.18 | 0.08 | −0.26 | # | 0.05 | 0.28 | # | 0.24 | 0.78 | ** | |||||||||
| MVPA | 0.26 | # | 0.08 | 0.28 | # | 0.28 | # | −0.25 | # | 0.04 | 0.30 | * | 0.30 | * | 0.83 | ** | 0.83 | ** | |||
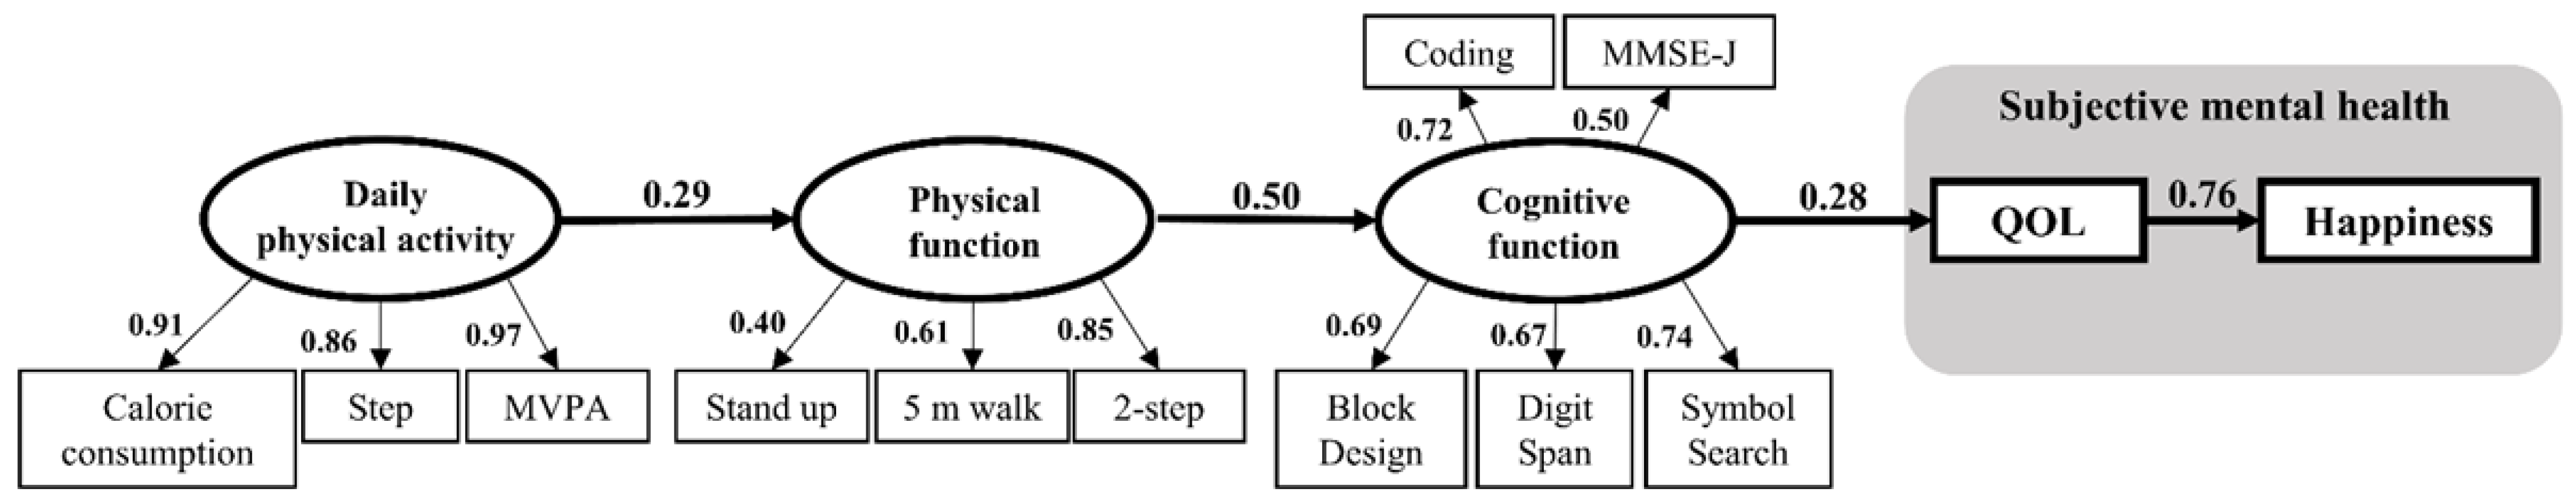
| β | p | ||||
|---|---|---|---|---|---|
| Between indicator index | |||||
| Daily physical activity | → | Physical function | 0.29 | 0.095 | # |
| Physical function | → | Cognitive function | 0.50 | 0.026 | * |
| Cognitive function | → | QOL | 0.28 | 0.098 | # |
| QOL | → | Happiness | 0.76 | 0.000 | *** |
| Within indicator index | |||||
| Daily physical activity | → | MVPA | 0.97 | 0.000 | *** |
| Daily physical activity | → | Steps | 0.86 | 0.000 | *** |
| Daily physical activity | → | Calorie consumption | 0.91 | 0.000 | *** |
| Physical function | → | 2-step | 0.85 | 0.000 | *** |
| Physical function | → | 5 m walk | 0.61 | 0.005 | ** |
| Physical function | → | Stand up | 0.40 | 0.031 | * |
| Cognitive function | → | Brock design | 0.69 | 0.000 | *** |
| Cognitive function | → | Digit span | 0.67 | 0.000 | *** |
| Cognitive function | → | Symbol Search | 0.74 | 0.000 | *** |
| Cognitive function | → | Coding | 0.72 | 0.000 | *** |
| Cognitive function | → | MMSE-J | 0.50 | 0.004 | ** |
Disclaimer/Publisher’s Note: The statements, opinions and data contained in all publications are solely those of the individual author(s) and contributor(s) and not of MDPI and/or the editor(s). MDPI and/or the editor(s) disclaim responsibility for any injury to people or property resulting from any ideas, methods, instructions or products referred to in the content. |
© 2023 by the authors. Licensee MDPI, Basel, Switzerland. This article is an open access article distributed under the terms and conditions of the Creative Commons Attribution (CC BY) license (https://creativecommons.org/licenses/by/4.0/).
Share and Cite
Inada, Y.; Tohda, C. Causal Relationships between Daily Physical Activity, Physical Function, and Cognitive Function Ultimately Leading to Happiness. Int. J. Environ. Res. Public Health 2023, 20, 3016. https://doi.org/10.3390/ijerph20043016
Inada Y, Tohda C. Causal Relationships between Daily Physical Activity, Physical Function, and Cognitive Function Ultimately Leading to Happiness. International Journal of Environmental Research and Public Health. 2023; 20(4):3016. https://doi.org/10.3390/ijerph20043016
Chicago/Turabian StyleInada, Yuna, and Chihiro Tohda. 2023. "Causal Relationships between Daily Physical Activity, Physical Function, and Cognitive Function Ultimately Leading to Happiness" International Journal of Environmental Research and Public Health 20, no. 4: 3016. https://doi.org/10.3390/ijerph20043016
APA StyleInada, Y., & Tohda, C. (2023). Causal Relationships between Daily Physical Activity, Physical Function, and Cognitive Function Ultimately Leading to Happiness. International Journal of Environmental Research and Public Health, 20(4), 3016. https://doi.org/10.3390/ijerph20043016