
Association between Air Pollution and Physical Activity and Sedentary Behavior among Adults Aged 60 Years or Older in China: A Cross-Sectional Study

 , , , and
Abstract
1. Introduction
2. Materials and Methods
2.1. Participants
2.2. Measures
2.2.1. PA and SB Measurements
2.2.2. Environment Measures
2.3. Data Analysis
3. Results
3.1. Descriptive Statistics
3.2. The Relationship between Air Pollution and MVPA, LPA, and SB
4. Discussion
5. Conclusions
Author Contributions
Funding
Institutional Review Board Statement
Informed Consent Statement
Data Availability Statement
Acknowledgments
Conflicts of Interest
References
- Ji, J.S. Air pollution and China’s ageing society. Lancet Public Health 2018, 3, e457–e458. [Google Scholar] [CrossRef] [PubMed]
- Lelieveld, J.; Evans, J.S.; Fnais, M.; Giannadaki, D.; Pozzer, A. The contribution of outdoor air pollution sources to premature mortality on a global scale. Nature 2015, 525, 367–371. [Google Scholar] [CrossRef] [PubMed]
- Shumake, K.L.; Sacks, J.D.; Lee, J.S.; Johns, D.O. Susceptibility of older adults to health effects induced by ambient air pollutants regulated by the European Union and the United States. Aging Clin. Exp. Res. 2013, 25, 3–8. [Google Scholar] [CrossRef] [PubMed]
- Di, Q.; Dai, L.; Wang, Y.; Zanobetti, A.; Choirat, C.; Schwartz, J.D.; Dominici, F. Association of short-term exposure to air pollution with mortality in older adults. JAMA 2017, 318, 2446–2456. [Google Scholar] [CrossRef]
- Liao, D.; Creason, J.; Shy, C.; Williams, R.; Watts, R.; Zweidinger, R. Daily variation of particulate air pollution and poor cardiac autonomic control in the elderly. Environ. Health Perspect. 1999, 107, 521–525. [Google Scholar] [CrossRef]
- Van der Zee, S.C.; Hoek, G.; Boezen, M.; Schouten, J.P.; Van Wijnen, J.H.; Brunekreef, B. Acute effects of air pollution on respiratory health of 50–70 yr old adults. Eur. Respir. J. 2000, 15, 700–709. [Google Scholar] [CrossRef]
- Di, Q.; Wang, Y.; Zanobetti, A.; Wang, Y.; Koutrakis, P.; Choirat, C.; Schwartz, J.D.; Dominici, F. Air pollution and mortality in the Medicare population. N. Engl. J. Med. 2017, 376, 2513–2522. [Google Scholar] [CrossRef]
- Lee, I.; Shiroma, E.J.; Lobelo, F.; Puska, P.; Blair, S.N.; Katzmarzyk, P.T. Effect of physical inactivity on major non-communicable diseases worldwide: An analysis of burden of disease and life expectancy. Lancet 2012, 380, 219–229. [Google Scholar] [CrossRef]
- WHO. Global Recommendations on Physical Activity for Health; World Health Organization: Geneva, Switzerland, 2010.
- Hou, P.; Wu, S.L. Long-term Changes in Extreme Air Pollution Meteorology and the Implications for Air Quality. Sci. Rep. 2016, 6, 23792. [Google Scholar] [CrossRef]
- Li, F.; Liu, Y.; Lü, J.; Liang, L.; Harmer, P. Ambient air pollution in China poses a multifaceted health threat to outdoor physical activity. J. Epidemiol. Community Health 2015, 69, 201–204. [Google Scholar] [CrossRef]
- Mazzeo, R.S.; Cavanagh, P.; Evans, W.J.; Fiatarone, M.; Hagberg, J.; McAuley, E.; Startzell, J. Exercise and physical activity for older adults. Med. Sci. Sport. Exerc. 1998, 30, 992–1008. [Google Scholar]
- Owen, N.; Healy, G.N.; Matthews, C.E.; Dunstan, D.W. Too much sitting: The population-health science of sedentary behavior. Exerc. Sport Sci. Rev. 2010, 38, 105. [Google Scholar] [CrossRef]
- Haskell, W.L.; Lee, I.M.; Pate, R.R.; Powell, K.E.; Blair, S.N.; Franklin, B.A.; Macera, C.A.; Heath, G.W.; Thompson, P.D.; Bauman, A. Physical Activity and Public Health: Updated Recommendation for Adults from the American College of Sports Medicine and the American Heart Association. Med. Sci. Sport Exerc. 2007, 39, 1423–1434. [Google Scholar] [CrossRef] [PubMed]
- Davis, M.G.; Fox, K.R.; Hillsdon, M.; Sharp, D.J.; Coulson, J.C.; Thompson, J.L. Objectively measured physical activity in a diverse sample of older urban UK adults. Med. Sci. Sport. Exerc. 2011, 43, 647–654. [Google Scholar] [CrossRef]
- Matthews, C.E.; Chen, K.Y.; Freedson, P.S.; Buchowski, M.S.; Beech, B.M.; Pate, R.R.; Troiano, R.P. Amount of time spent in sedentary behaviors in the United States, 2003–2004. Am. J. Epidemiol. 2008, 167, 875–881. [Google Scholar] [CrossRef] [PubMed]
- Hallal, P.C.; Andersen, L.B.; Bull, F.C.; Guthold, R.; Haskell, W.; Ekelund, U. Global physical activity levels: Surveillance progress, pitfalls, and prospects. Lancet 2012, 380, 247–257. [Google Scholar] [CrossRef] [PubMed]
- Katzmarzyk, P.T.; Church, T.S.; Craig, C.L.; Bouchard, C. Sitting time and mortality from all causes, cardiovascular disease, and cancer. Med. Sci. Sport. Exerc. 2009, 41, 998–1005. [Google Scholar] [CrossRef] [PubMed]
- Zhang, Q.; Zheng, Y.X.; Tong, D.; Shao, M.; Wang, S.X.; Zhang, Y.H.; Xu, X.; Wang, J.; He, H.; Liu, W.; et al. Drivers of improved PM2.5 air quality in China from 2013-2017. Proc. Natl. Acad. Sci. USA 2019, 110, 24463–24469. [Google Scholar] [CrossRef] [PubMed]
- Pope, C.A.; Burnett, R.T.; Thun, M.J.; Calle, E.E.; Krewski, D.; Ito, K.; Thurston, G.D. Lung cancer, cardiopulmonary mortality, and long-term exposure to fine particulate air pollution. J. Am. Med. Assoc. 2002, 287, 1132–1141. [Google Scholar] [CrossRef]
- Dockery, D.W.; Pope, C.A.; Xu, X.P.; Spengler, J.D.; Ware, J.H.; Fay, M.E.; Ferris, B.G.; Speizer, F.E. An association between air-pollution and mortality in 6 united-states cities. N. Engl. J. Med. 1993, 329, 1753–1759. [Google Scholar] [CrossRef]
- An, R.; Shen, J.; Ying, B.; Tainio, M.; Andersen, Z.J.; de Nazelle, A. Impact of ambient air pollution on physical activity and sedentary behavior in China: A systematic review. Environ. Res. 2019, 176, 108545. [Google Scholar] [CrossRef] [PubMed]
- An, R.; Zhang, S.; Ji, M.; Guan, C. Impact of ambient air pollution on physical activity among adults: A systematic review and meta-analysis. Perspect. Public Health 2018, 138, 111–121. [Google Scholar] [CrossRef] [PubMed]
- Luo, L.; Cao, Y.; Hu, Y.; Wen, S.; Tang, K.; Ding, L.; Song, N. The Associations between Meeting 24-Hour MovementGuidelines (24-HMG) and Self-Rated Physical and Mental Health in Older Adults—Cross Sectional Evidence from China. Int. J. Environ. Res. Public Health 2022, 19, 13407. [Google Scholar] [CrossRef] [PubMed]
- Guan, W.-J.; Zheng, X.-Y.; Chung, K.F.; Zhong, N.-S. Impact of air pollution on the burden of chronic respiratory diseases in China: Time for urgent action. Lancet 2016, 388, 1939–1951. [Google Scholar] [CrossRef] [PubMed]
- Huang, W.Z.; Yang, B.-Y.; Zeeshan, M.; Dong, G.H. Associations between ambient particulate matter and lung cancer: A systematic review and meta-analyses up to 2020. Air Pollut. Clim. Health 2021, 2021, 207–228. [Google Scholar]
- Xing, Y.F.; Xu, Y.H.; Shi, M.H.; Lian, Y.X. The impact of PM2.5 on the human respiratory system. J. Thorac. Dis. 2016, 8, E69. [Google Scholar]
- Chen, R.; Yin, P.; Meng, X.; Wang, L.; Liu, C.; Niu, Y.; Liu, Y.N.; Liu, J.M.; Qi, J.L.; You, J.L.; et al. Associations between coarse particulate matter air pollution and cause-specific mortality: A nationwide analysis in 272 Chinese cities. Environ. Health Perspect. 2019, 127, 017008. [Google Scholar] [CrossRef]
- Li, T.; Zhang, Y.; Wang, J.; Xu, D.; Yin, Z.; Chen, H.; Lv, Y.B.; Luo, J.S.; Zeng, Y.; Liu, Y.; et al. All-cause mortality risk associated with long-term exposure to ambient PM2.5 in China: A cohort study. Lancet Public Health 2018, 3, e470–e477. [Google Scholar] [CrossRef]
- Yu, M.; Wu, Y.; Gordon, S.P.; Cheng, J.L.; Chen, P.P.; Wang, Y.Y.; Yu, H.J. Objectively measured association between air pollution and physical activity, sedentary behavior in college students in Beijing. Environ. Res. 2021, 194, 110492. [Google Scholar] [CrossRef]
- Tainio, M.; Andersen, Z.J.; Nieuwenhuijsen, M.J.; Hu, L.; De Nazelle, A.; An, R.; Garcia, L.M.T.; Goenka, S.; Zapata-Diomedi, B.; Bull, F.; et al. Air pollution, physical activity and health: A mapping review of the evidence. Environ. Int. 2021, 147, 105954. [Google Scholar] [CrossRef]
- Yu, H.; An, R.; Andrade, F. Ambient fine particulate matter air pollution and physical activity: A longitudinal study of university retirees in Beijing, China. Am. J. Health Behav. 2017, 41, 401–410. [Google Scholar] [CrossRef] [PubMed]
- Huang, B.; Xiao, T.; Grekousis, G.; Zhao, H.; He, J.; Dong, G.; Ye, L. Greenness-air pollution-physical activity-hypertension association among middle-aged and older adults: Evidence from urban and rural China. Environ. Res. 2021, 195, 110836. [Google Scholar] [CrossRef] [PubMed]
- Sun, S.; Cao, W.; Qiu, H.; Ran, J.; Lin, H.; Shen, C.; Lee, R.S.Y.; Tian, L. Benefits of physical activity not affected by air pollution: A prospective cohort study. Int. J. Epidemiol. 2020, 49, 142–152. [Google Scholar] [CrossRef] [PubMed]
- Macfarlane, D.J.; Lee, C.C.; Ho, E.Y.; Chan, K.L.; Chan, D.T. Reliability and validity of the Chinese version of IPAQ (short, last 7 days). J. Sci. Med. Sport 2007, 10, 45–51. [Google Scholar] [CrossRef] [PubMed]
- Qiuying, W. Sports livelihood happiness index-based on 36 big and middle scale cities in China. Stat. Theory Pract. 2021, 8, 33–37. [Google Scholar]
- Bernard, P.; Chevance, G.; Kingsbury, C.; Baillot, A.; Romain, A.J.; Molinier, V.; Gadais, T.; Dancause, K. Climate Change, Physical Activity and Sport: A Systematic Review. Sport. Med. 2021, 51, 1041–1059. [Google Scholar] [CrossRef]
- An, R.; Kang, H.; Cao, L.; Xiang, X. Engagement in outdoor physical activity under ambient fine particulate matter pollution: A risk-benefit analysis. J. Sport Health Sci. 2022, 11, 537–544. [Google Scholar] [CrossRef]
- Wen, X.; Balluz, L.; Mokdad, A. Association Between Media Alerts of Air Quality Index and Change of Outdoor Activity Among Adult Asthma in Six States, BRFSS, 2005. J. Community Health 2009, 34, 40–46. [Google Scholar] [CrossRef]
- Kim, M.; Lee, S.; Park, D.; Kim, C.; Lee, K.; Hwang, J. Relationship Between the Actual Fine Dust Concentration and Media Exposure that Influenced the Changes in Outdoor Activity Behavior in South Korea. Sci. Rep. 2020, 10, 12006. [Google Scholar] [CrossRef]
- Kirkland, J.L.; Peterson, C. Healthspan, translation, and new outcomes for animal studies of aging. J. Gerontol. Ser. A Biomed. Sci. Med. Sci. 2009, 64, 209–212. [Google Scholar] [CrossRef]
- Mahjur, M.; Norasteh, A.A. The Effect of Unsupervised Home-Based Exercise Training on Physical Functioning Outcomes in Older Adults: A Systematic Review and Meta-Analysis of Randomized Controlled Trials. Biol. Res. Nurs. 2021, 23, 504–512. [Google Scholar] [CrossRef] [PubMed]
- Li, H.; Chen, X.; Fang, Y. The Development Strategy of Home-Based Exercise in China Based on the SWOT-AHP Model. Int. J. Environ. Res. Public Health 2021, 18, 1224. [Google Scholar] [CrossRef] [PubMed]
- Zhang, S.X.; Wang, Z.Z.; Chang, R.J.; Wang, H.W.; Xu, C.; Yu, X.Y.; Tsamlag, L.; Dong, Y.Q.; Wang, H.; Cai, Y. COVID-19 containment: China provides important lessons for global response. Front. Med. 2020, 14, 215–219. [Google Scholar] [CrossRef] [PubMed]


| Variable | |||
|---|---|---|---|
| Men | Women | Total | |
| Sex, n (%) | 5747 (50.43) | 5649 (49.57) | 11,396 (100) |
| Age (y), mean (SD) | 73.50 (6.38) | 73.67(6.82) | 73.59 (6.61) |
| Nationality, n (%) | |||
| Han | 5389 (47.29) | 5325 (46.73) | 10,714 (94.02) |
| Minority groups | 358 (3.14) | 324 (2.84) | 682 (5.98) |
| BMI, n (%) a | |||
| Lean | 302(2.65) | 294(2.58) | 596 (5.23) |
| Normal | 4471 (39.23) | 4128 (36.22) | 8599 (75.46) |
| Overweight | 974 (8.55) | 1227(10.77) | 2201(19.31) |
| Education ≤ 9 years, n (%) a | 573 (5.03) | 390 (3.42) | 963 (8.45) |
| Marital status, n (%) | |||
| Married | 4759 (41.76) | 3831 (33.62) | 8590 (75.38) |
| Widowed | 870 (7.63) | 1747 (15.33) | 2617 (22.96) |
| Divorced/separated | 56 (0.49) | 53(0.47) | 109(0.96) |
| Never married | 62 (0.54) | 18 (0.16) | 80 (0.7) |
| Retirement status n (%) | |||
| Yes | 2359 (20.70) | 2280 (20.01) | 4639 (40.71) |
| No | 3388 (29.73) | 3369 (29.56) | 6757(59.29) |
| Smoking, n (%) | 2784 (24.43) | 390 (3.42) | 3174 (27.85) |
| Physical health, n (%) | 5747 (50.43) | 5649 (49.57) | 11,396 (100.0) |
| Fair, good, or excellent health | 4943 (43.37) | 4629 (40.62) | 9572 (83.99) |
| Poor or very poor health | 794 (6.97) | 1013 (8.89) | 1807 (15.86) |
| No answer | 10 (0.09) | 7 (0.06) | 17 (0.15) |
| Mental health, n (%) | 5747 (50.43) | 5649 (49.57) | 11,396 (100.0) |
| Good or excellent | 4645 (40.76) | 4559 (40.01) | 9204 (80.77) |
| Poor | 883 (7.75) | 870 (7.63) | 1753 (15.38) |
| No answer | 219 (1.92) | 220 (1.93) | 439 (3.85) |
| Disease number, mean (SD) | 1.31 (1.36) | 1.50 (1.48) | 1.40 (1.42) |
| PA and SB | |||
| MVPA (h/week), mean (SD) a | 0.87 (2.91) | 0.73 (2.43) | 0.80 (2.68) |
| LPA (h/week), Mean (SD) a | 12.48 (10.83) | 12.09 (10.62) | 12.29 (10.73) |
| SB (h/week), mean (SD) a | 23.37 (12.30) | 24.13 (12.95) | 23.75 (12.63) |
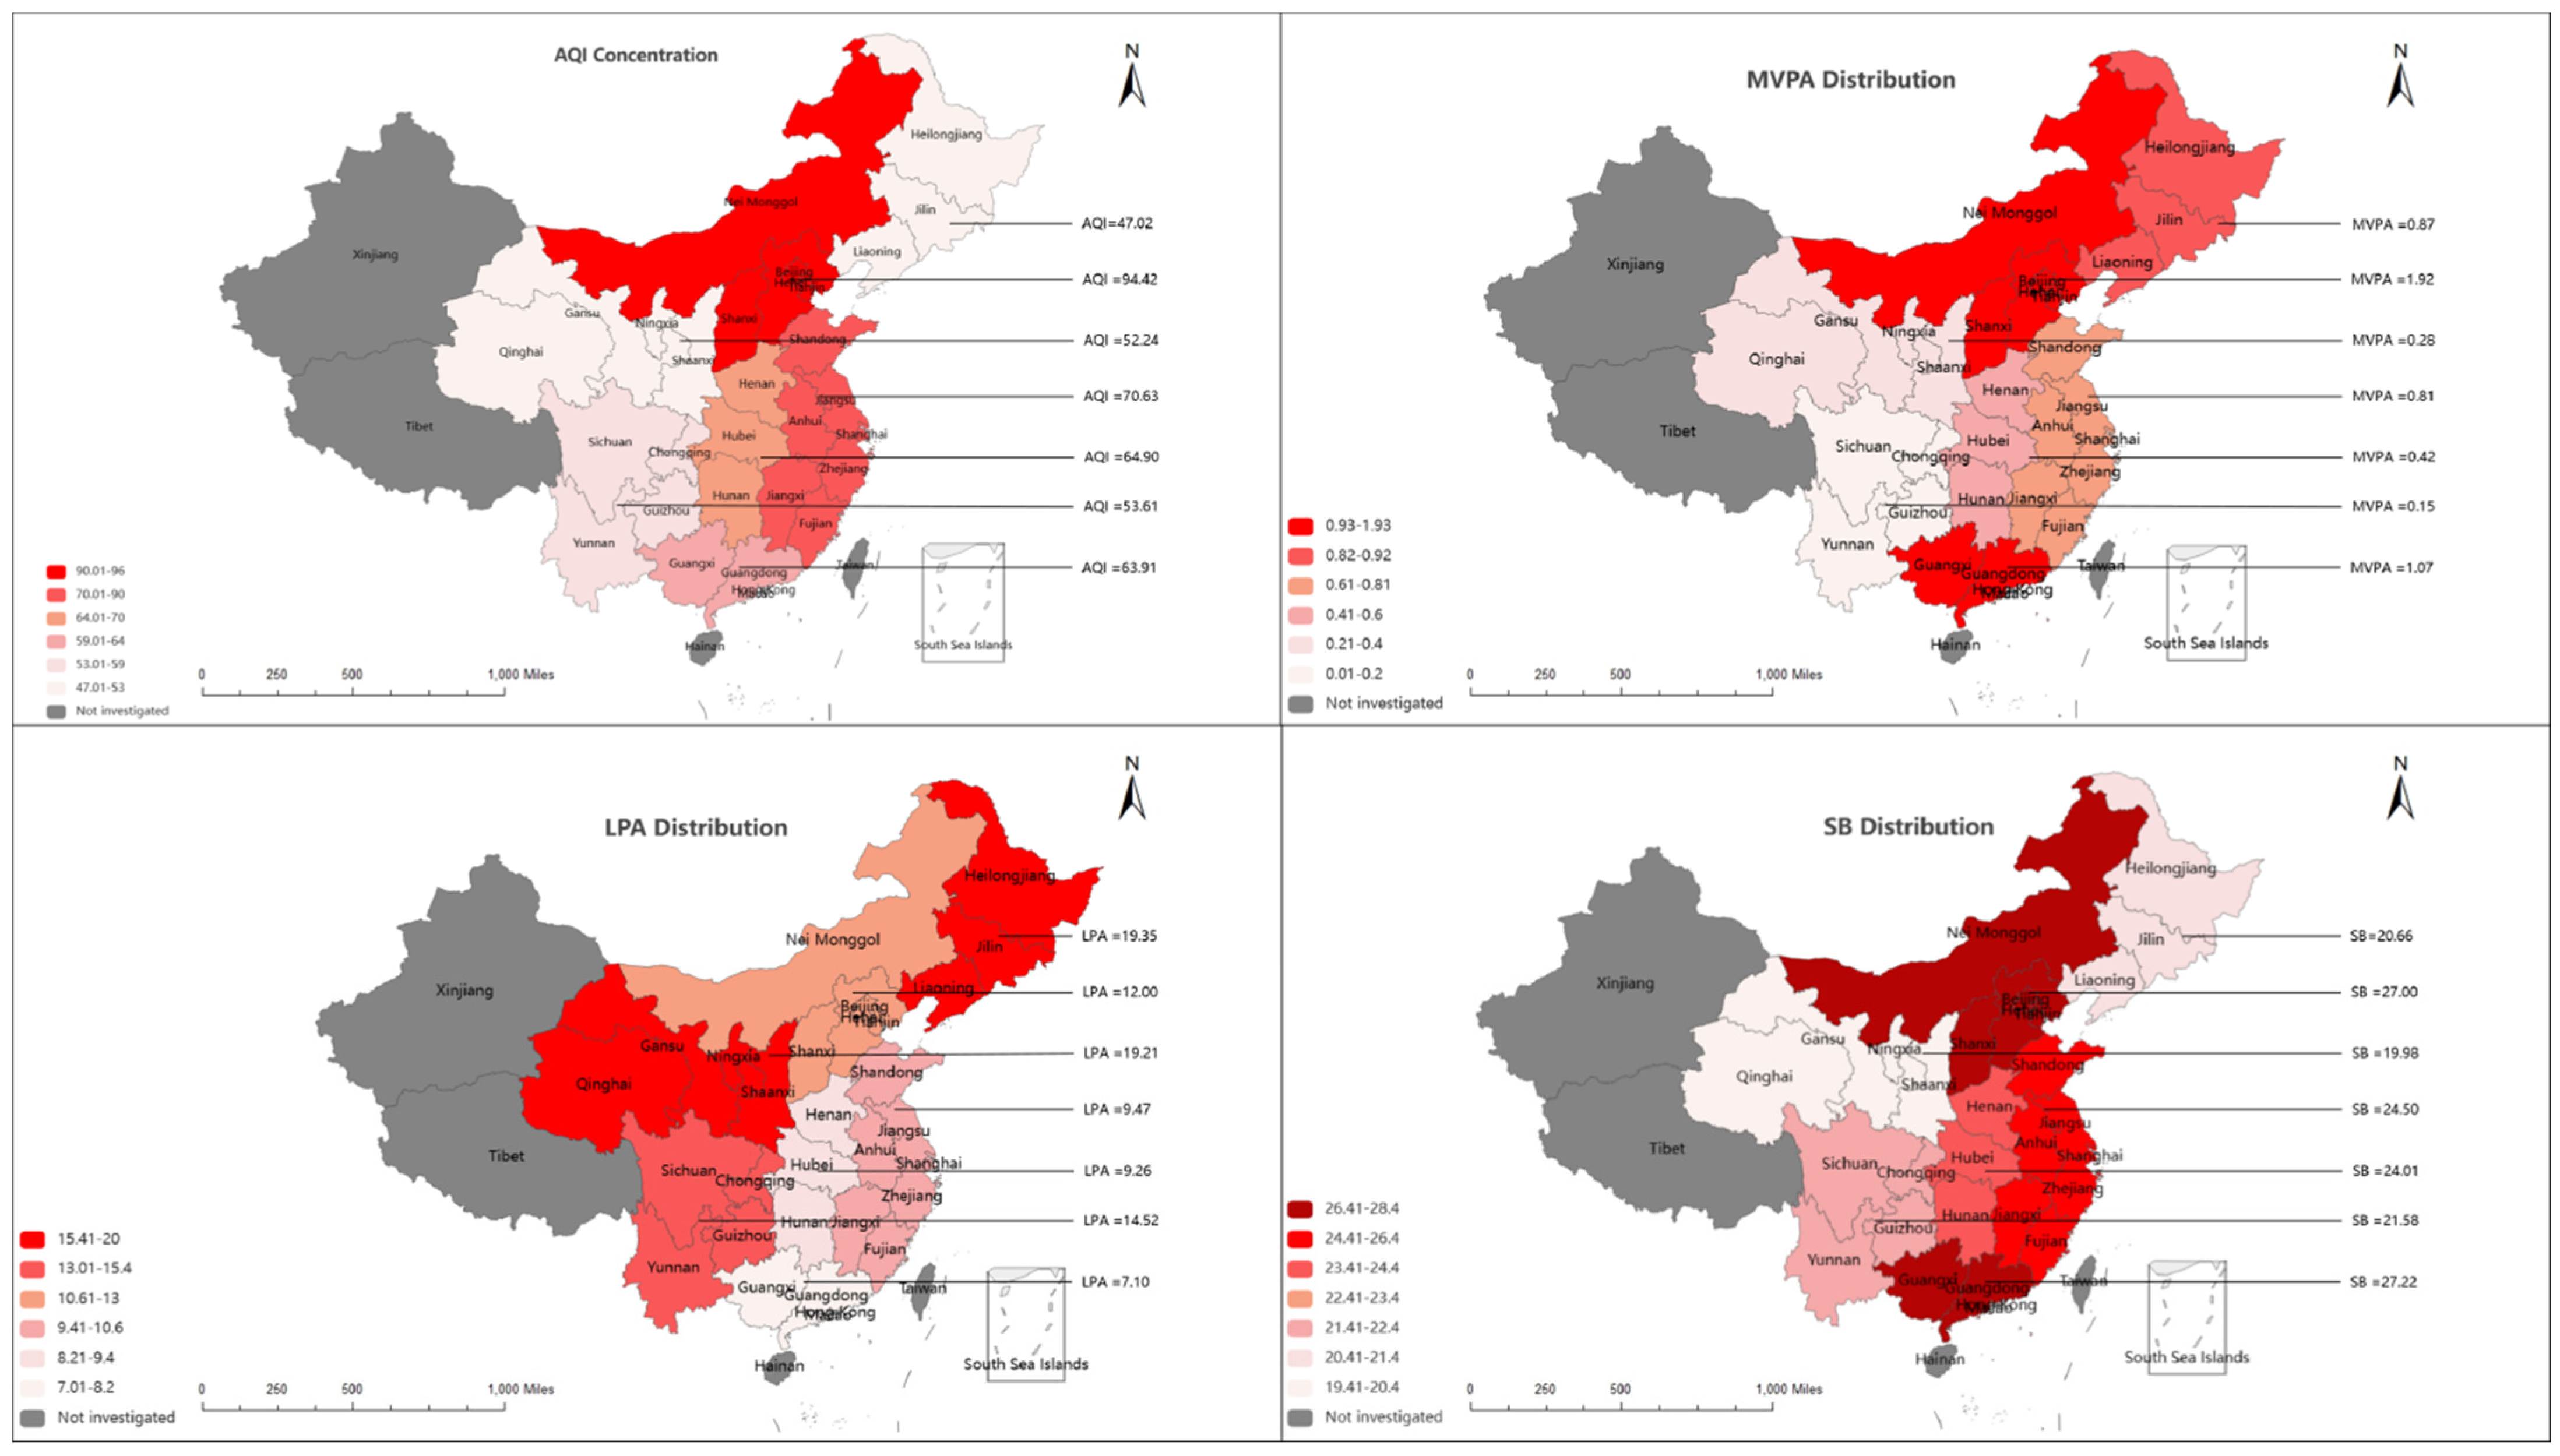
| Zones a | Huabei | Dongbei | Huadong | Huazhong | Huanan | Xinan | Xibei |
|---|---|---|---|---|---|---|---|
| Dependent variables | n = 1558 | n = 1531 | n = 3359 | n = 1721 | n = 876 | n = 1585 | n = 766 |
| MVPA (h/week), mean (SD) | 1.92 (3.55) | 0.87 (2.90) | 0.81 (2.85) | 0.42 (2.74) | 1.07 (2.09) | 0.15 (0.95) | 0.28 (1.16) |
| LPA (h/week), mean (SD) | 12.00 (9.16) | 19.35 (8.54) | 9.47 (10.08) | 9.26 (10.77) | 7.10 (9.28) | 14.52 (11.26) | 19.21 (9.16) |
| SB (h/week), mean (SD) | 27.00 (15.68) | 20.66 (7.80) | 24.50 (15.94) | 24.01 (10.39) | 27.22 (10.06) | 21.58 (8.58) | 19.98 (6.87) |
| Air pollution | |||||||
| AQI (µg/m3), mean (SD) | 94.42 (48.69) | 47.02 (14.38) | 70.63 (26.80) | 64.90 (23.35) | 63.91 (14.14) | 53.61 (18.42) | 52.24 (11.16) |
| PM2.5 (µg/m3), mean (SD) | 46.98 (23.59) | 23.71 (14.49) | 29.61 (13.23) | 34.56 (19.46) | 29.20 (11.64) | 27.60 (15.31) | 21.54 (5.97) |
| PM10 (µg/m3), mean (SD) | 110.94 (74.20) | 46.29 (20.13) | 66.67 (47.41) | 57.59 (27.02) | 57.32 (24.14) | 44.67 (24.04) | 47.11 (16.25) |
| NO2 (µg/m3), mean (SD) | 34.77 (11.25) | 25.92 (8.77) | 26.80 (10.71) | 21.94 (8.88) | 25.78 (9.17) | 21.63 (7.64) | 28.35 (14.61) |
| Environmental covariates | |||||||
| Temperature (°C), mean (SD) | 16.60 (47.07) | 9.03 (6.44) | 20.27 (5.12) | 20.30 (4.05) | 23.75 (2.36) | 18.28 (4.87) | 11.86 (6.85) |
| Sun (day/week), mean (SD) | 2.31 (1.35) | 1.97 (1.81) | 1.04 (1.22) | 0.96 (1.33) | 0.92 (1.68) | 1.52 (1.86) | 1.27 (1.69) |
| Rain (day/week), mean (SD) | 1.44 (1.58) | 1.95 (1.56) | 2.89 (2.07) | 3.18 (1.88) | 1.98 (1.50) | 3.02 (2.02) | 3.04 (1.90) |
| Dependent Variable | Men | Women | Total | |||
|---|---|---|---|---|---|---|
| Coefficient (95%CI) | n | Coefficient (95%CI) | n | Coefficient (95%CI) | n | |
| AQI Moderate and Vigorous PA (h/week) | −3.48 *** (−5.19, −1.76) | 912 | −1.11 * (−2.11, −0.12) | 832 | −2.34 *** (−3.36, −1.32) | 1744 |
| PM2.5 Moderate and Vigorous PA (h/week) | −3.65 *** (−5.37, −1.93) | 912 | −1.44 ** (−2.47, −0.42) | 832 | −2.58 *** (−3.61, −1.55) | 1744 |
| PM10 Moderate and Vigorous PA (h/week) | −2.89 *** (−4.73, −1.05) | 912 | −1.03 (−2.10, −0.04) | 832 | −1.96 *** (−3.05, −0.86) | 1744 |
| NO2 Moderate and Vigorous PA (h/week) | −1.98 ** (−3.48, −0.49) | 912 | −0.29 (−1.14, 0.55) | 832 | −1.19 ** (−2.06, −0.31) | 1744 |
| Dependent Variable | Men | Women | Total | |||
|---|---|---|---|---|---|---|
| Coefficient (95%CI) | n | Coefficient (95%CI) | n | Coefficient (95%CI) | n | |
| AQI LPA(h/week) | −6.35 *** (−7.87, −4.84) | 4342 | −5.78 *** (−7.35, −4.20) | 4262 | −6.06 *** (−7.15, −4.97) | 8604 |
| PM2.5 LPA(h/week) | −5.21 *** (−6.62, −3.81) | 4342 | −4.48 *** (−5.94, −3.03) | 4262 | −4.86 *** (−5.88, −3.85) | 8604 |
| PM10 LPA(h/week) | −5.12 *** (−6.65, −3.59) | 4342 | −4.45 *** (−6.05, −2.85) | 4262 | −4.78 *** (−5.89, −3.68) | 8604 |
| NO2 LPA(h/week) | −4.38 *** (−5.75, −3.01) | 4342 | −4.79 *** (−6.20, −3.38) | 4262 | −4.59 *** (−5.57, −3.61) | 8604 |
| Dependent Variable | Men | Women | Total | |||
|---|---|---|---|---|---|---|
| Coefficient (95%CI) | n | Coefficient (95%CI) | n | Coefficient (95%CI) | n | |
| AQI Sedentary Behavior (h/week) | 1.11 ** (0.35, 1.88) | 5747 | 1.54 *** (0.73, 2.34) | 5649 | 1.32 *** (0.77, 1.88) | 11,396 |
| PM2.5 Sedentary Behavior (h/week) | 0.55 (−0.17, 1.27) | 5747 | 0.68 * (0.08, 1.44) | 5649 | 0.62 * (0.09, 1.14) | 11,396 |
| PM10 Sedentary Behavior (h/week) | 0.81 * (0.04, 1.58) | 5747 | 1.27 *** (0.46, 2.09) | 5649 | 1.03 *** (0.48, 1.59) | 11,396 |
| NO2 Sedentary Behavior (h/week) | 1.05 ** (0.34, 1.76) | 5747 | 0.90 * (0.15, 1.66) | 5649 | 0.98 *** (0.46, 1.49) | 11,396 |
Disclaimer/Publisher’s Note: The statements, opinions and data contained in all publications are solely those of the individual author(s) and contributor(s) and not of MDPI and/or the editor(s). MDPI and/or the editor(s) disclaim responsibility for any injury to people or property resulting from any ideas, methods, instructions or products referred to in the content. |
© 2023 by the authors. Licensee MDPI, Basel, Switzerland. This article is an open access article distributed under the terms and conditions of the Creative Commons Attribution (CC BY) license (https://creativecommons.org/licenses/by/4.0/).
Share and Cite
Zhan, B.; Wang, Q.; Zhou, Z.; Li, X.; Yu, H.; Li, B.; Liao, M. Association between Air Pollution and Physical Activity and Sedentary Behavior among Adults Aged 60 Years or Older in China: A Cross-Sectional Study. Int. J. Environ. Res. Public Health 2023, 20, 2352. https://doi.org/10.3390/ijerph20032352
Zhan B, Wang Q, Zhou Z, Li X, Yu H, Li B, Liao M. Association between Air Pollution and Physical Activity and Sedentary Behavior among Adults Aged 60 Years or Older in China: A Cross-Sectional Study. International Journal of Environmental Research and Public Health. 2023; 20(3):2352. https://doi.org/10.3390/ijerph20032352
Chicago/Turabian StyleZhan, Bing, Qiurui Wang, Zhixiong Zhou, Xiaotian Li, Hongjun Yu, Bingzhao Li, and Mingxia Liao. 2023. "Association between Air Pollution and Physical Activity and Sedentary Behavior among Adults Aged 60 Years or Older in China: A Cross-Sectional Study" International Journal of Environmental Research and Public Health 20, no. 3: 2352. https://doi.org/10.3390/ijerph20032352
APA StyleZhan, B., Wang, Q., Zhou, Z., Li, X., Yu, H., Li, B., & Liao, M. (2023). Association between Air Pollution and Physical Activity and Sedentary Behavior among Adults Aged 60 Years or Older in China: A Cross-Sectional Study. International Journal of Environmental Research and Public Health, 20(3), 2352. https://doi.org/10.3390/ijerph20032352