
Research on Influencing Factors of Satisfaction with the Use of Public Health Internet Platform: Evidence from Ding Xiang Doctor (DXY) Internet Medical Platform


Abstract
1. Introduction
2. Literature Review
2.1. Research on Internet Health Platform
2.2. Research Related to User Satisfaction and User Perception
2.3. Related Research on Evaluation Index System
3. Research Methodology
3.1. Construction of Evaluation Index System

| Guideline Layer | Program Level | Indicator Source |
|---|---|---|
| Q: Perceived quality | Qa1: Information authority | Nahapiet (2000) [44] Parasuraman et al. (2005) [45] Sabiote et al. (2012) [46] Sheng et al. (2010) [47] Yoo et al. (2001) [48] Barnes et al. (2002) [49] Barrera et al. (2014) [50] Barrutia et al. (2012) [51] Rolland et al. (2010) [52] |
| Qa2: Information validity | ||
| Qa3: Information intelligibility | ||
| Qa4: Design aesthetics | ||
| Qb1: Information professionalism | ||
| Qb2: Question responsiveness | ||
| Qc1: Convenience of operation | ||
| Qc2: Information timeliness | ||
| Qc3: Information comprehensiveness | ||
| Qc4: Classification clarity | ||
| V: Perceived value | Va1: Personalization | Magee et al. (2012) [11] Barnes et al. (2002) [49] Barrera et al. (2014) [50] Xinyao et al. (2010) [53] |
| Va2: Privacy | ||
| Vb1: Time and expense cost | ||
| Vb3: Communication cost | ||
| Vc1: Science | ||
| T: Users trust | Ta1: Development prospects | Barrutia et al. (2012) [51] |
| Tb1: Utilization rate | ||
| Tc1: Recommendability | ||
| P: User participation | Pa1: Online consultation | Tang et al. (2015) [36] Rolland et al. (2010) [52] |
| Pa2: Willingness to pay to use | ||
| Pb1: Browse information frequency | ||
| Pb2: Online appointment willingness | ||
| Pc1: Interactive Discussion Willingness |
3.2. Questionnaire Method
3.3. Hierarchical Analysis and Entropy Method of Integrated Weighting
3.3.1. Build a Comparison Judgment Matrix
3.3.2. Calculate the Weighting Factor
3.3.3. Consistency Check
4. Result
4.1. Reliability and Validity Tests
4.1.1. Reliability Test
4.1.2. Validity Test
4.2. Basic Characteristics of Survey Respondents
4.3. Indicator Weights Established
4.3.1. Hierarchical Analysis Method to Determine the Index System Weights
4.3.2. Entropy Value Method to Determine the Index System Weights
4.3.3. Combined Weights for the Combination of Hierarchical Analysis and the Entropy Method
4.4. Data Analysis
5. Discussion and Suggestions
5.1. Perceived Quality Dimension
5.2. Perceived Value Dimension
5.3. User Trust Dimension
6. Conclusions
Author Contributions
Funding
Institutional Review Board Statement
Informed Consent Statement
Data Availability Statement
Conflicts of Interest
Appendix A
| Indicators | Total Correlation of Correction Items | Alpha Coefficient of the Term Has Been Deleted | Cronbach’s Alpha Coefficient |
|---|---|---|---|
| Qa1 | 0.775 | 0.977 | 0.978 |
| Qa2 | 0.804 | 0.977 | |
| Qa3 | 0.798 | 0.977 | |
| Qa4 | 0.725 | 0.977 | |
| Qb1 | 0.779 | 0.977 | |
| Qb2 | 0.809 | 0.977 | |
| Qc1 | 0.802 | 0.977 | |
| Qc2 | 0.807 | 0.977 | |
| Qc3 | 0.834 | 0.976 | |
| Qc4 | 0.835 | 0.976 | |
| Va1 | 0.799 | 0.977 | |
| Va2 | 0.789 | 0.977 | |
| Vb1 | 0.786 | 0.977 | |
| Vb3 | 0.817 | 0.976 | |
| Vc1 | 0.828 | 0.976 | |
| Ta1 | 0.830 | 0.976 | |
| Tb1 | 0.783 | 0.977 | |
| Tc1 | 0.802 | 0.977 | |
| Pa1 | 0.794 | 0.977 | |
| Pa2 | 0.693 | 0.977 | |
| Pb1 | 0.831 | 0.976 | |
| Pb2 | 0.780 | 0.977 | |
| Pc1 | 0.741 | 0.977 |
| Indicators | Factor Loading Coefficient | Common Degree (Variance of Common Factor) | |
|---|---|---|---|
| Factor 1 | Factor 2 | ||
| Qa1 | 0.641 | 0.472 | 0.634 |
| Qa2 | 0.663 | 0.488 | 0.679 |
| Qa3 | 0.779 | 0.345 | 0.726 |
| Qa4 | 0.594 | 0.455 | 0.560 |
| Qb1 | 0.685 | 0.429 | 0.653 |
| Qb2 | 0.797 | 0.339 | 0.750 |
| Qc1 | 0.744 | 0.391 | 0.707 |
| Qc2 | 0.668 | 0.489 | 0.685 |
| Qc3 | 0.801 | 0.372 | 0.779 |
| Qc4 | 0.823 | 0.346 | 0.798 |
| Va1 | 0.723 | 0.412 | 0.693 |
| Va2 | 0.832 | 0.270 | 0.765 |
| Vb1 | 0.798 | 0.306 | 0.730 |
| Vb3 | 0.726 | 0.435 | 0.716 |
| Vc1 | 0.732 | 0.444 | 0.732 |
| Ta1 | 0.559 | 0.650 | 0.734 |
| Tb1 | 0.435 | 0.727 | 0.718 |
| Tc1 | 0.388 | 0.809 | 0.805 |
| Pa1 | 0.412 | 0.768 | 0.760 |
| Pa2 | 0.224 | 0.843 | 0.760 |
| Pb1 | 0.555 | 0.656 | 0.739 |
| Pb2 | 0.390 | 0.772 | 0.748 |
| Pc1 | 0.319 | 0.802 | 0.744 |
| Characteristic root value (before rotation) | 15.921 | 1.437 | - |
| Variance interpretation rate % (before rotation) | 66.336% | 5.989% | - |
| Cumulative variance interpretation rate % (before rotation) | 66.336% | 72.325% | - |
| Characteristic root value (after rotation) | 9.958 | 7.400 | - |
| Variance interpretation rate % (after rotation) | 41.492% | 30.834% | - |
| Cumulative variance interpretation rate % (after rotation) | 41.492% | 72.325% | - |
| KMO value | 0.977 | - | |
| Bartlett’s sphericity test | 10,499.405 | - | |
| df | 276 | - | |
| p | 0.000 | - | |
| Item | Qa1 | Qa2 | Qa3 | Qa4 | Qb1 | Qb2 | Qc1 | Qc2 | Qc3 | Qc4 | Eigenvector | Weighting Value | Maximum Eigenvalue | CI Value | CR Value |
|---|---|---|---|---|---|---|---|---|---|---|---|---|---|---|---|
| Qa1 | 1 | 0.997 | 0.919 | 0.988 | 0.946 | 0.902 | 0.935 | 0.941 | 0.903 | 0.906 | 0.942 | 9.423% | 10.000 | 0.000 | 0.000 |
| Qa2 | 1.003 | 1 | 0.922 | 0.991 | 0.950 | 0.905 | 0.938 | 0.944 | 0.906 | 0.909 | 0.945 | 9.455% | |||
| Qa3 | 1.088 | 1.085 | 1 | 1.075 | 1.030 | 0.982 | 1.018 | 1.024 | 0.983 | 0.986 | 1.026 | 10.256% | |||
| Qa4 | 1.012 | 1.009 | 0.930 | 1 | 0.958 | 0.913 | 0.947 | 0.953 | 0.915 | 0.917 | 0.954 | 9.540% | |||
| Qb1 | 1.057 | 1.053 | 0.971 | 1.044 | 1 | 0.953 | 0.988 | 0.994 | 0.955 | 0.958 | 0.996 | 9.957% | |||
| Qb2 | 1.109 | 1.105 | 1.019 | 1.095 | 1.049 | 1 | 1.037 | 1.043 | 1.002 | 1.005 | 1.045 | 10.448% | |||
| Qc1 | 1.070 | 1.066 | 0.983 | 1.056 | 1.012 | 0.965 | 1 | 1.006 | 0.966 | 0.969 | 1.008 | 10.078% | |||
| Qc2 | 1.063 | 1.059 | 0.976 | 1.050 | 1.006 | 0.958 | 0.994 | 1 | 0.960 | 0.963 | 1.001 | 10.014% | |||
| Qc3 | 1.107 | 1.103 | 1.017 | 1.093 | 1.048 | 0.998 | 1.035 | 1.042 | 1 | 1.003 | 1.043 | 10.430% | |||
| Qc4 | 1.104 | 1.100 | 1.014 | 1.090 | 1.044 | 0.995 | 1.032 | 1.038 | 0.997 | 1 | 1.040 | 10.398% |
| Item | Va1 | Va2 | Vb1 | Vb3 | Vc1 | Eigenvector | Weighting Value | Maximum Eigenvalue | CI Value | CR Value |
|---|---|---|---|---|---|---|---|---|---|---|
| Va1 | 1 | 0.929 | 0.961 | 0.965 | 0.974 | 0.965 | 19.304% | 5.000 | 0.000 | 0.000 |
| Va2 | 1.077 | 1 | 1.035 | 1.039 | 1.049 | 1.039 | 20.785% | |||
| Vb1 | 1.040 | 0.966 | 1 | 1.003 | 1.013 | 1.004 | 20.079% | |||
| Vb3 | 1.037 | 0.963 | 0.997 | 1 | 1.010 | 1.001 | 20.011% | |||
| Vc1 | 1.027 | 0.954 | 0.987 | 0.990 | 1 | 0.991 | 19.821% |
| Item | Ta1 | Tb1 | Tc1 | Eigenvector | Weighting Value | Maximum Eigenvalue | CI Value | CR Value |
|---|---|---|---|---|---|---|---|---|
| Ta1 | 1 | 1.034 | 1.042 | 1.025 | 34.168% | 3.000 | 0.000 | 0.000 |
| Tb1 | 0.967 | 1 | 1.007 | 0.991 | 33.036% | |||
| Tc1 | 0.960 | 0.993 | 1 | 0.984 | 32.796% |
| Item | Pa1 | Pa2 | Pb1 | Pb2 | Pc1 | Eigenvector | Weighting Value | Maximum Eigenvalue | CI Value | CR Value |
|---|---|---|---|---|---|---|---|---|---|---|
| Pa1 | 1 | 1.082 | 0.950 | 1.013 | 1.023 | 1.012 | 20.235% | 5.000 | 0.000 | 0.000 |
| Pa2 | 0.924 | 1 | 0.878 | 0.937 | 0.945 | 0.935 | 18.704% | |||
| Pb1 | 1.053 | 1.139 | 1 | 1.067 | 1.077 | 1.065 | 21.308% | |||
| Pb2 | 0.987 | 1.068 | 0.937 | 1 | 1.009 | 0.998 | 19.969% | |||
| Pc1 | 0.978 | 1.058 | 0.928 | 0.991 | 1 | 0.989 | 19.784% |
References
- Pei, Q. Interpretation of the Notice of the General Office of the National Health and Wellness Commission on Strengthening Informatization to Support the Prevention and Control of Pneumonia Infected in Novel Coronavirus. Available online: http://www.gov.cn/zhengce/2020-02/05/content_5474861.htm (accessed on 23 October 2022).
- Notice of the General Office of the State Health and Wellness Commission on doing a good job in Internet diagnosis and treatment consulting services in epidemic prevention and control. Available online: http://www.satcm.gov.cn/xinxifabu/shizhengyaowen/2020-02-08/12903.html (accessed on 23 October 2022).
- Guiding Opinions of the National Health and Health Commission of the National Medical Insurance Bureau on Promoting the “Internet Plus” Medical Insurance Service during the Prevention and Control of COVID-19 Epidemic_Others_China Government Network. Available online: http://www.gov.cn/zhengce/zhengceku/2020-03/03/content_5486256.htm (accessed on 23 October 2022).
- Notice of the Information Office of the Central Committee of the National Development and Reform Commission on Issuing the Implementation Plan for Promoting the Action of “Using Numbers to Empower Wisdom” to Cultivate New Economic Development (No. 552 [2020] of the Development and Reform Commission)-National Development and Reform Commission. Available online: https://www.ndrc.gov.cn/xwdt/ztzl/szhzxhbxd/xdcy/202006/t20200605_1230419.html?code=&state=123 (accessed on 23 October 2022).
- Ding Xiang Yuan—A link in the medical field—Ding Xiang Yuan biomedical science and technology network. Available online: https://portal.dxy.cn/ (accessed on 10 October 2022).
- Webster, P. Virtual Health Care in the Era of COVID-19. Lancet 2020, 395, 1180–1181. [Google Scholar] [CrossRef] [PubMed]
- Bashshur, R.; Doarn, C.R.; Frenk, J.M.; Kvedar, J.C.; Woolliscroft, J.O. Telemedicine and the COVID-19 Pandemic, Lessons for the Future. Telemed. J. E. Health. 2020, 26, 571–573. [Google Scholar] [CrossRef] [PubMed]
- Keesara, S.; Jonas, A.; Schulman, K. COVID-19 and Health Care’s Digital Revolution. N. Engl. J. Med. 2020, 382, e82. [Google Scholar] [CrossRef] [PubMed]
- Rothe, C.; Schunk, M.; Sothmann, P.; Bretzel, G.; Froeschl, G.; Wallrauch, C.; Zimmer, T.; Thiel, V.; Janke, C.; Guggemos, W.; et al. Transmission of 2019-NCoV Infection from an Asymptomatic Contact in Germany. N. Engl. J. Med. 2020, 382, 970–971. [Google Scholar] [CrossRef]
- Singhal, T. A Review of Coronavirus Disease-2019 (COVID-19). Indian J. Pediatr. 2020, 87, 281–286. [Google Scholar] [CrossRef]
- Magee, J.C.; Bigelow, L.; Dehaan, S.; Mustanski, B.S. Sexual Health Information Seeking Online: A Mixed-Methods Study among Lesbian, Gay, Bisexual, and Transgender Young People: A Mixed-Methods Study among Lesbian, Gay, Bisexual, and Transgender Young People. Health Educ. Behav. 2012, 39, 276–289. [Google Scholar] [CrossRef]
- Sullivan Zimmerman, M.; Rodgers, B. Exploring Ways of Knowing: Teaching the Skill of Health Literacy to Refugee and Immigrant Women. J. Educ. Libr. Inf. Sci. Online 2022, 63, 245–259. [Google Scholar] [CrossRef]
- Wong, D.K.-K.; Cheung, M.-K. Online Health Information Seeking and EHealth Literacy among Patients Attending a Primary Care Clinic in Hong Kong: A Cross-Sectional Survey. J. Med. Internet Res. 2019, 21, e10831. [Google Scholar] [CrossRef]
- Haskell, L.; Tavender, E.J.; Wilson, C.L.; O’Brien, S.; Babl, F.E.; Borland, M.L.; Cotterell, E.; Sheridan, N.; Oakley, E.; Dalziel, S.R.; et al. Development of Targeted, Theory-Informed Interventions to Improve Bronchiolitis Management. BMC Health Serv. Res. 2021, 21, 769. [Google Scholar] [CrossRef]
- Lu, W.; Wu, H. How Online Reviews and Services Affect Physician Outpatient Visits: Content Analysis of Evidence from Two Online Health Care Communities. JMIR Med. Inform. 2019, 7, e16185. [Google Scholar] [CrossRef]
- Liu, S.; Wang, H.; Gao, B.; Deng, Z. Doctors’ Provision of Online Health Consultation Service and Patient Review Valence: Evidence from a Quasi-Experiment. Inf. Manag. 2022, 59, 103360. [Google Scholar] [CrossRef]
- Noteborn, G.; Bohle Carbonell, K.; Dailey-Hebert, A.; Gijselaers, W. The Role of Emotions and Task Significance in Virtual Education. Internet High. Educ. 2012, 15, 176–183. [Google Scholar] [CrossRef]
- Fornell, C. A National Customer Satisfaction Barometer: The Swedish Experience. J. Mark. 1992, 56, 6–21. [Google Scholar] [CrossRef]
- Vega-Vazquez, M.; Ángeles Revilla-Camacho, M.; Cossío-Silva, F.J. The Value Co-Creation Process as a Determinant of Customer Satisfaction. Manag. Decis. 2013, 51, 1945–1953. [Google Scholar] [CrossRef]
- Kuo, N.-T.; Chang, K.-C.; Cheng, Y.-S.; Lai, C.-H. How Service Quality Affects Customer Loyalty in the Travel Agency: The Effects of Customer Satisfaction, Service Recovery, and Perceived Value. Asia Pac. J. Tour. Res. 2013, 18, 803–822. [Google Scholar] [CrossRef]
- Li, L.; Deng, Z. A System Dynamics Approach of Users’ Dynamic Behavior for Mobile Services in Academic Library. Libri 2017, 67, 165–177. [Google Scholar] [CrossRef]
- Yoon, H.-Y. User Acceptance of Mobile Library Applications in Academic Libraries: An Application of the Technology Acceptance Model. J. Acad. Libr. 2016, 42, 687–693. [Google Scholar] [CrossRef]
- Kubat, G. The Mobile Future of University Libraries and an Analysis of the Turkish Case. Inf. Learn. Sci. 2017, 118, 120–140. [Google Scholar] [CrossRef]
- Liu, S.; Zhang, M.; Gao, B.; Jiang, G. Physician Voice Characteristics and Patient Satisfaction in Online Health Consultation. Inf. Manag. 2020, 57, 103233. [Google Scholar] [CrossRef]
- Jin, N.; Line, N.D.; Merkebu, J. The Impact of Brand Prestige on Trust, Perceived Risk, Satisfaction, and Loyalty in Upscale Restaurants. J. Hosp. Mark. Manag. 2016, 25, 523–546. [Google Scholar] [CrossRef]
- Wu, H.; Deng, Z.; Evans, R. Building Patients’ Trust in Psychologists in Online Mental Health Communities. Data Sci. Manag. 2022, 5, 21–27. [Google Scholar] [CrossRef]
- Yuan, Z.; Jia, G. Profiling the Digital Divide of the Elderly Based on Internet Big Data: Evidence from China. Data Sci. Manag. 2021, 3, 33–43. [Google Scholar] [CrossRef]
- Sun, K.; Zhao, Y.C.; Tao, X.; Zhou, J.; Liu, Q. Examining Urban-Rural Differences in the Impact of Internet Use on Older Adults’ Depression: Evidence from China. Data Sci. Manag. 2022, 5, 13–20. [Google Scholar] [CrossRef]
- Bundorf, M.K.; Wagner, T.H.; Singer, S.J.; Baker, L.C. Who Searches the Internet for Health Information? Health Serv. Res. 2006, 41 Pt 1, 819–836. [Google Scholar] [CrossRef]
- Chen, W.; Lee, K.-H. More than Search? Informational and Participatory EHealth Behaviors. Comput. Hum. Behav. 2014, 30, 103–109. [Google Scholar] [CrossRef]
- Ogikubo, M.; Schvaneveldt, S.J.; Enkawa, T. An Empirical Study on Antecedents of Aggregate Customer Satisfaction: Cross-Country Findings. Total Qual. Manag. Bus. Excel. 2009, 20, 23–37. [Google Scholar] [CrossRef]
- Hsu, S. Developing an Index for Online Customer Satisfaction: Adaptation of American Customer Satisfaction Index. Expert Syst. Appl. 2008, 34, 3033–3042. [Google Scholar] [CrossRef]
- Strenitzerová, M.; Gaňa, J. Customer Satisfaction and Loyalty as a Part of Customer-Based Corporate Sustainability in the Sector of Mobile Communications Services. Sustainability 2018, 10, 1657. [Google Scholar] [CrossRef]
- Wang, B.; He, B.-S.; Ruan, X.-L.; Zhu, J.; Hu, R.; Wang, J.; Li, Y.; Yang, Y.-H.; Liu, M.-L. An Integrated Microfluidics Platform with High-Throughput Single-Cell Cloning Array and Concentration Gradient Generator for Efficient Cancer Drug Effect Screening. Mil. Med. Res. 2022, 9, 51. [Google Scholar] [CrossRef]
- Mayer, D.M.; Ehrhart, M.G.; Schneider, B. Service Attribute Boundary Conditions of the Service Climate–Customer Satisfaction Link. Acad. Manage. J. 2009, 52, 1034–1050. [Google Scholar] [CrossRef]
- DISCERN—Welcome to DISCERN. Available online: http://www.discern.org.uk (accessed on 23 October 2022).
- Tang, S.L.; Du, J.; Jiao, L. Review on Rating Instruments for Evaluating the Quality of Health Web Sitesand the Framework Development in China. China Health Educ. 2015, 3, 297–315. [Google Scholar]
- Damodharan, P.; Ravichandran, C.S. Applicability Evaluation of Web Mining in Healthcare E-Commerce towards Business Success and a Derived Cournot Model. J. Med. Syst. 2019, 43, 268. [Google Scholar] [CrossRef]
- Guha, J.; Chakrabarti, B. Making E-Government Work: Adopting the Network Approach. Gov. Inf. Q. 2014, 31, 327–336. [Google Scholar] [CrossRef]
- Chumber, S.; Huber, J.; Ghezzi, P. A Methodology to Analyze the Quality of Health Information on the Internet: The Example of Diabetic Neuropathy: The Example of Diabetic Neuropathy. Diabetes Educ. 2015, 41, 95–105. [Google Scholar] [CrossRef]
- Corcelles, R.; Daigle, C.R.; Talamas, H.R.; Brethauer, S.A.; Schauer, P.R. Assessment of the Quality of Internet Information on Sleeve Gastrectomy. Surg. Obes. Relat. Dis. 2015, 11, 539–544. [Google Scholar] [CrossRef]
- Tetteh, E.K.; Combs, T.; Geng, E.H.; McKay, V.R. Public Health Information Seeking, Trust, and COVID-19 Prevention Behaviors: Cross-Sectional Study. J. Med. Internet Res. 2022, 24, e37846. [Google Scholar] [CrossRef]
- Tavare, A.N.; Alsafi, A.; Hamady, M.S. Analysis of the Quality of Information Obtained about Uterine Artery Embolization from the Internet. Cardiovasc. Radiol. 2012, 35, 1355–1362. [Google Scholar] [CrossRef]
- Nahapiet, J. Social Capital, Intellectual Capital, and the Organizational Advantage. In Knowledge and Social Capital; Elsevier: Amsterdam, The Netherlands, 2000; pp. 119–157. [Google Scholar]
- Parasuraman, A.; Zeithaml, V.A.; Malhotra, A. E-S-QUAL: A Multiple -Item Scale for Assessing Electronic Service Quality. J. Serv. Res. 2005, 7, 213–233. [Google Scholar] [CrossRef]
- Sabiote, C.M.; Frías, D.M.; Castañeda, J. E-Service Quality as Antecedent to e-Satisfaction: The Moderating Effect of Culture. Online Inf. Rev. 2012, 36, 157–174. [Google Scholar] [CrossRef]
- Sheng, T.; Liu, C. An Empirical Study on the Effect of E-Services Quality on Online Customer Satisfaction and Loyalty. Nankai Bus. Rev. Int. 2010, 1, 273–283. [Google Scholar] [CrossRef]
- Yoo, B.; Donthu, N. Developing a Scale to Measure the Perceived Quality of an Internet Shopping Site (SITEQUAL). Q. J. Electron. Commer. 2001, 2, 31–47. [Google Scholar]
- Barnes, S.J.; Vidgen, R.T. An Integrative Approach to the Assessment of E-Commerce Quality. J. Electron. Commer. Res. 2002, 3, 114–127. [Google Scholar]
- Barrera, R.B.; Carrión, G.C. Simultaneous Measurement of Quality in Different Online Services. Serv. Ind. J. 2014, 34, 123–144. [Google Scholar] [CrossRef]
- Barrutia, J.M.; Gilsanz, A. Electronic Service Quality and Value: Do Consumer Knowledge-Related Resources Matter? J. Serv. Res. 2012, 16, 231–246. [Google Scholar] [CrossRef]
- Rolland, S.; Freeman, I. A New Measure of E-Services Quality in France. Int. J. Retail Distrib. Manag. 2010, 38, 497–517. [Google Scholar] [CrossRef]
- Xinyao, Z.; Jindan, C.; Pexin, W. Evaluation System Research of Health Information Service Website Satisfaction. J. Intell. 2010, 29, 99–102. [Google Scholar]
- Xiaoqi, X.; Yongsheng, C.; Guoqiang, C. Evaluation Method and Application of RV Modeling Based on AHP Method. J. Mach. Design. 2020, 37, 140–144. [Google Scholar] [CrossRef]
- Bari, L.; Kemeny, L.; Bari, F. A Multilingual Assessment of Melanoma Information Quality on the Internet. J. Cancer Educ. 2014, 29, 284–288. [Google Scholar] [CrossRef]
- Naderzadeh, M.; Arabalibeik, H.; Monazzam, M.R.; Ghasemi, I. Comparative Analysis of AHP-TOPSIS and Fuzzy AHP Models in Selecting Appropriate Nanocomposites for Environmental Noise Barrier Applications. Fluct. Noise Lett. 2017, 16, 1750038. [Google Scholar] [CrossRef]
- Du, L.; Chen, H.; Fang, Y.; Liang, X.; Zhang, Y.; Qiao, Y.; Guo, Z. Research on the Method of Acquiring Customer Individual Demand Based on the Quantitative Kano Model. Comput. Intell. Neurosci. 2022, 11, 5052711. [Google Scholar] [CrossRef]

| Program Level | Problem Description |
|---|---|
| Qa1: Information authority | The health information published on the platform has clear contact information for you |
| Qa2: Information validity | Health information release is effective for your treatment of diseases |
| Qa3: Information Intelligibility | The health information is written in an easy-to-understand way for you |
| Qa4: Design aesthetics | The aesthetics of the platform page design is important to you |
| Qb1: Information professionalism | Health information involves multidisciplinary outcomes for you |
| Qb2: Question responsiveness | Asking a health question can be responded to quickly for you |
| Qc1: Convenience of operation | The ability to open quickly on different types of devices for you |
| Qc2: Information timeliness | How often the platform health information is updated for you |
| Qc3: Information comprehensiveness | The comprehensiveness of the content of the health information is important to you |
| Qc4: Classification clarity | The information directory is clearly categorized for you |
| Va1: Personalization | The platform can meet your individual needs for you |
| Va2: Privacy | The platform can protect your personal privacy for you |
| Vb1: Time and expense cost | The platform can save you time and money costs for you |
| Vb3: Communication cost | The platform can help you to communicate with your doctor for you |
| Vc1: Science | The platform can enrich health knowledge and raise health awareness for you |
| Ta1: Development prospects | Are you optimistic about the future of Dr. Ding Xiang |
| Tb1: Utilization rate | The likelihood that you will increase your usage of Dr. Ding Xiang |
| Tc1: Recommend ability | How likely would you be to recommend Dr. Ding to your friends and family |
| Pa1: Online consultation will | The possibility of you using Dr. Ding’s online consultation service |
| Pa2: Willingness to pay to use | The possibility of you using the paid services of Dr. Ding |
| Pb1: Browse information frequency | Likelihood of you using Dr. Ding to browse health information |
| Pb2: Online appointment willingness | The possibility for you to use the online appointment service of Dr. Ding Xiang |
| Pc1: Interactive discussion willingness | Possibilities for you to participate in interactive health discussions using Dr. Ding |
| Cronbach’s Alpha Coefficient | Standardized Cronbach’s Alpha Coefficient | Number of Items | Number of Samples |
|---|---|---|---|
| 0.978 | 0.978 | 24 | 424 |
| KMO Value | 0.977 | |
| Bartlett’s sphericity test | Approximate cardinality | 10,499.405 |
| df | 276.000 | |
| p | 0.000 *** | |
| Survey Object Attributes | Options | Number of People | Percentage (%) |
|---|---|---|---|
| Gender | Female | 277 | 65.330 |
| Male | 147 | 34.670 | |
| Age | 18–30 | 297 | 70.047 |
| 31–40 | 74 | 17.453 | |
| Under 18 years old | 26 | 6.132 | |
| 41–50 | 23 | 5.425 | |
| 51 or more | 4 | 0.943 | |
| Academic qualifications | University | 254 | 59.906 |
| Graduate students | 105 | 24.764 | |
| High school | 49 | 11.557 | |
| Junior high school and below | 16 | 3.774 | |
| What features of DXY have you used? | Online registration | 144 | 33.962 |
| Online payment | 130 | 30.660 | |
| Teleconsultation | 171 | 40.330 | |
| Inquiry report | 100 | 23.585 | |
| Online drug purchase | 88 | 20.755 | |
| Science and health information | 186 | 43.868 | |
| Other | 60 | 14.151 |
| Item | Q | V | T | P | Eigenvector | Weighting Value | Maximum Eigenvalue | CI Value | CR Value |
|---|---|---|---|---|---|---|---|---|---|
| Q | 1 | 0.954 | 0.973 | 1.039 | 0.991 | 24.766% | 4.000 | 0.000 | 0.000 |
| V | 1.048 | 1 | 1.020 | 1.088 | 1.038 | 25.950% | |||
| T | 1.027 | 0.980 | 1 | 1.067 | 1.018 | 25.442% | |||
| P | 0.963 | 0.919 | 0.937 | 1 | 0.954 | 23.842% |
| Target Layer | Guideline Layer | Weighting Value | Program Level | Weighting Value | Combined Weight w |
|---|---|---|---|---|---|
| Comprehensive weighting of satisfaction evaluation indicators of DXY | Q | 24.766% | Qa1 | 9.423% | 2.334% |
| Qa2 | 9.455% | 2.342% | |||
| Qa3 | 10.256% | 2.540% | |||
| Qa4 | 9.540% | 2.363% | |||
| Qb1 | 9.957% | 2.466% | |||
| Qb2 | 10.448% | 2.588% | |||
| Qc1 | 10.078% | 2.496% | |||
| Qc2 | 10.014% | 2.480% | |||
| Qc3 | 10.430% | 2.583% | |||
| Qc4 | 10.398% | 2.575% | |||
| V | 25.950% | Va1 | 19.304% | 5.009% | |
| Va2 | 20.785% | 5.394% | |||
| Vb1 | 20.079% | 5.211% | |||
| Vb3 | 20.011% | 5.193% | |||
| Vc1 | 19.821% | 5.144% | |||
| T | 25.442% | Ta1 | 34.168% | 8.693% | |
| Tb1 | 33.036% | 8.405% | |||
| Tc1 | 32.796% | 8.344% | |||
| P | 23.842% | Pa1 | 20.235% | 4.824% | |
| Pa2 | 18.704% | 4.459% | |||
| Pb1 | 21.308% | 5.080% | |||
| Pb2 | 19.969% | 4.761% | |||
| Pc1 | 19.784% | 4.717% |
| Indicators | Information Entropy Value e | Information Utility Value d | |
|---|---|---|---|
| Qa1 | 0.9898 | 0.0102 | 5.07% |
| Qa2 | 0.9905 | 0.0095 | 4.70% |
| Qa3 | 0.9923 | 0.0077 | 3.82% |
| Qa4 | 0.9917 | 0.0083 | 4.11% |
| Qb1 | 0.9915 | 0.0085 | 4.20% |
| Qb2 | 0.9916 | 0.0084 | 4.17% |
| Qc1 | 0.9916 | 0.0084 | 4.18% |
| Qc2 | 0.9919 | 0.0081 | 4.01% |
| Qc3 | 0.9930 | 0.0070 | 3.45% |
| Qc4 | 0.9926 | 0.0074 | 3.65% |
| Va1 | 0.9917 | 0.0083 | 4.11% |
| Va2 | 0.9921 | 0.0079 | 3.93% |
| Vb1 | 0.9924 | 0.0076 | 3.77% |
| Vb3 | 0.9920 | 0.0080 | 3.98% |
| Vc1 | 0.9921 | 0.0079 | 3.89% |
| Ta1 | 0.9917 | 0.0083 | 4.09% |
| Tb1 | 0.9908 | 0.0092 | 4.53% |
| Tc1 | 0.9901 | 0.0099 | 4.91% |
| Pa1 | 0.9903 | 0.0097 | 4.80% |
| Pa2 | 0.9865 | 0.0135 | 6.68% |
| Pb1 | 0.9926 | 0.0074 | 3.68% |
| Pb2 | 0.9898 | 0.0102 | 5.05% |
| Pc1 | 0.9894 | 0.0106 | 5.22% |
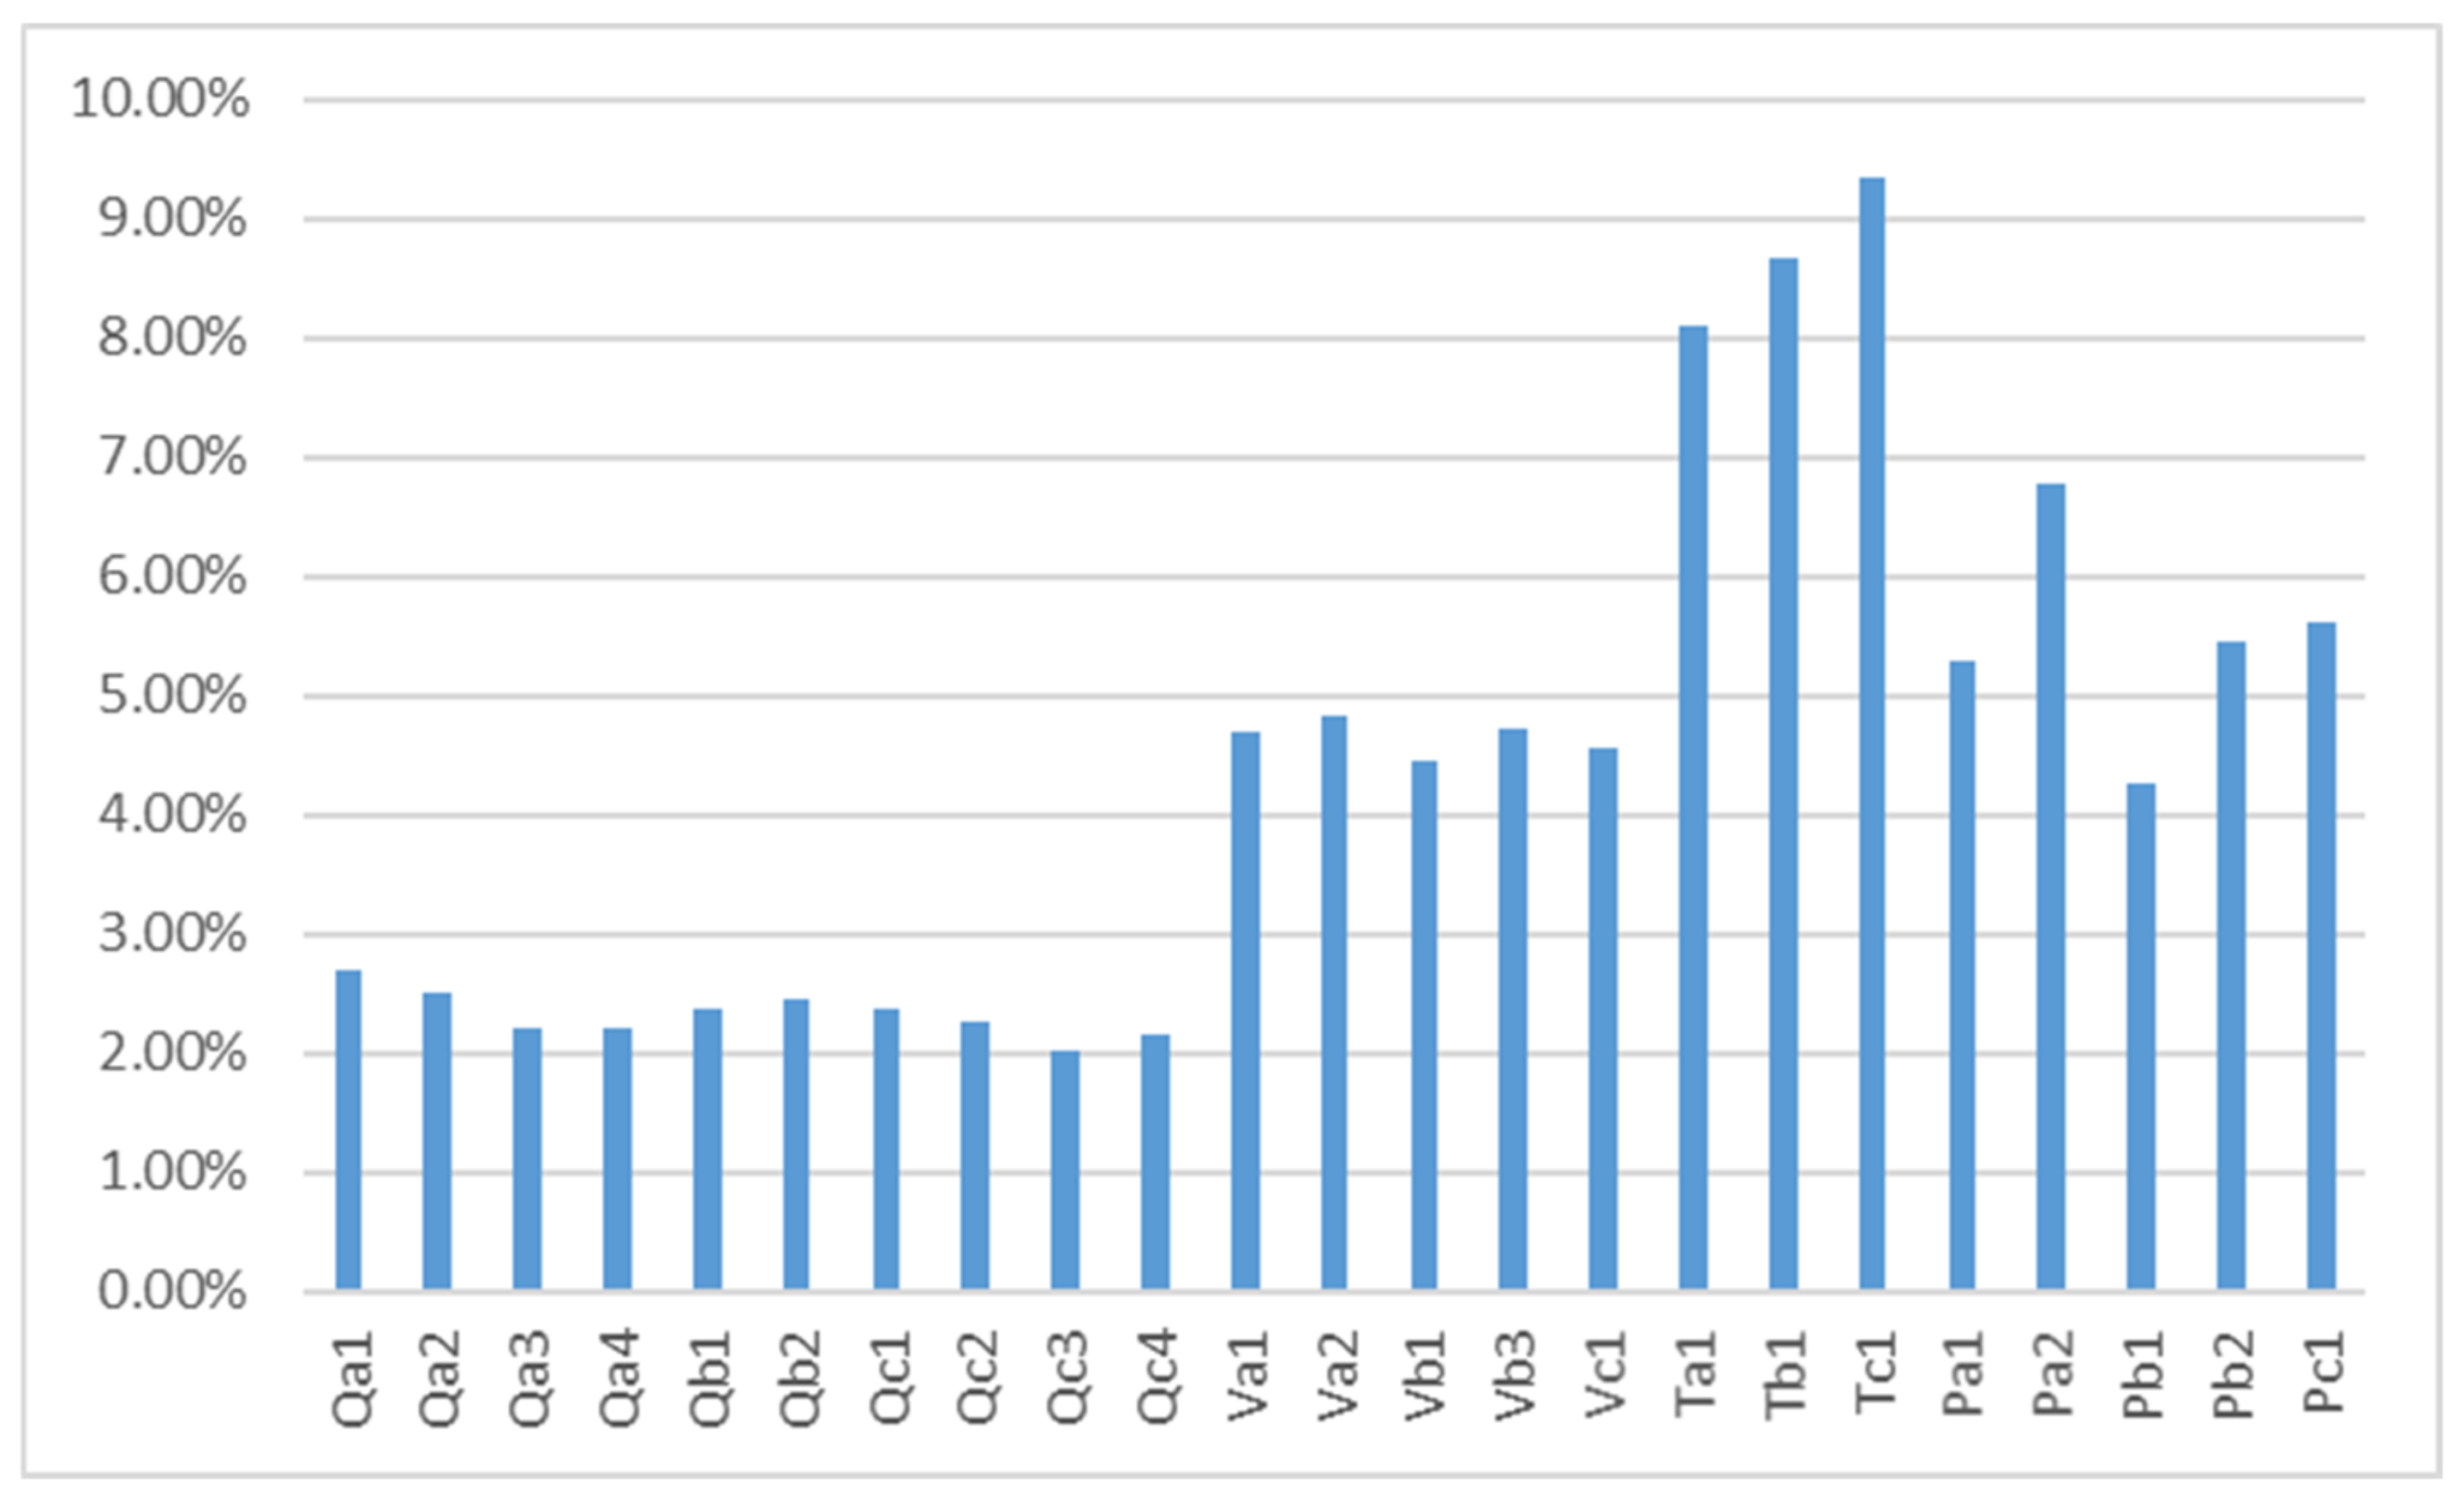
| Indicators | Hierarchical Analysis Method Weight w | ||
|---|---|---|---|
| Qa1 | 2.334% | 5.07% | 2.687% |
| Qa2 | 2.342% | 4.70% | 2.505% |
| Qa3 | 2.540% | 3.82% | 2.209% |
| Qa4 | 2.363% | 4.11% | 2.209% |
| Qb1 | 2.466% | 4.20% | 2.368% |
| Qb2 | 2.588% | 4.17% | 2.460% |
| Qc1 | 2.496% | 4.18% | 2.368% |
| Qc2 | 2.480% | 4.01% | 2.255% |
| Qc3 | 2.583% | 3.45% | 2.027% |
| Qc4 | 2.575% | 3.65% | 2.141% |
| Va1 | 5.009% | 4.11% | 4.691% |
| Va2 | 5.394% | 3.93% | 4.828% |
| Vb1 | 5.211% | 3.77% | 4.464% |
| Vb3 | 5.193% | 3.98% | 4.714% |
| Vc1 | 5.144% | 3.89% | 4.555% |
| Ta1 | 8.693% | 4.09% | 8.107% |
| Tb1 | 8.405% | 4.53% | 8.677% |
| Tc1 | 8.344% | 4.91% | 9.337% |
| Pa1 | 4.824% | 4.80% | 5.284% |
| Pa2 | 4.459% | 6.68% | 6.787% |
| Pb1 | 5.080% | 3.68% | 4.259% |
| Pb2 | 4.761% | 5.05% | 5.466% |
| Pc1 | 4.717% | 5.22% | 5.602% |
Disclaimer/Publisher’s Note: The statements, opinions and data contained in all publications are solely those of the individual author(s) and contributor(s) and not of MDPI and/or the editor(s). MDPI and/or the editor(s) disclaim responsibility for any injury to people or property resulting from any ideas, methods, instructions or products referred to in the content. |
© 2023 by the authors. Licensee MDPI, Basel, Switzerland. This article is an open access article distributed under the terms and conditions of the Creative Commons Attribution (CC BY) license (https://creativecommons.org/licenses/by/4.0/).
Share and Cite
Guo, Y.; Zu, L.; Chen, D.; Zhang, H. Research on Influencing Factors of Satisfaction with the Use of Public Health Internet Platform: Evidence from Ding Xiang Doctor (DXY) Internet Medical Platform. Int. J. Environ. Res. Public Health 2023, 20, 2276. https://doi.org/10.3390/ijerph20032276
Guo Y, Zu L, Chen D, Zhang H. Research on Influencing Factors of Satisfaction with the Use of Public Health Internet Platform: Evidence from Ding Xiang Doctor (DXY) Internet Medical Platform. International Journal of Environmental Research and Public Health. 2023; 20(3):2276. https://doi.org/10.3390/ijerph20032276
Chicago/Turabian StyleGuo, Yanlong, Lan Zu, Denghang Chen, and Han Zhang. 2023. "Research on Influencing Factors of Satisfaction with the Use of Public Health Internet Platform: Evidence from Ding Xiang Doctor (DXY) Internet Medical Platform" International Journal of Environmental Research and Public Health 20, no. 3: 2276. https://doi.org/10.3390/ijerph20032276
APA StyleGuo, Y., Zu, L., Chen, D., & Zhang, H. (2023). Research on Influencing Factors of Satisfaction with the Use of Public Health Internet Platform: Evidence from Ding Xiang Doctor (DXY) Internet Medical Platform. International Journal of Environmental Research and Public Health, 20(3), 2276. https://doi.org/10.3390/ijerph20032276