

Determining Work-Rest Schedules for Visual Tasks That Use Optical Head-Mounted Displays Based on Visual Fatigue and Visually Induced Motion Sickness Recovery


Abstract
1. Introduction
2. Materials and Methods
2.1. Participants
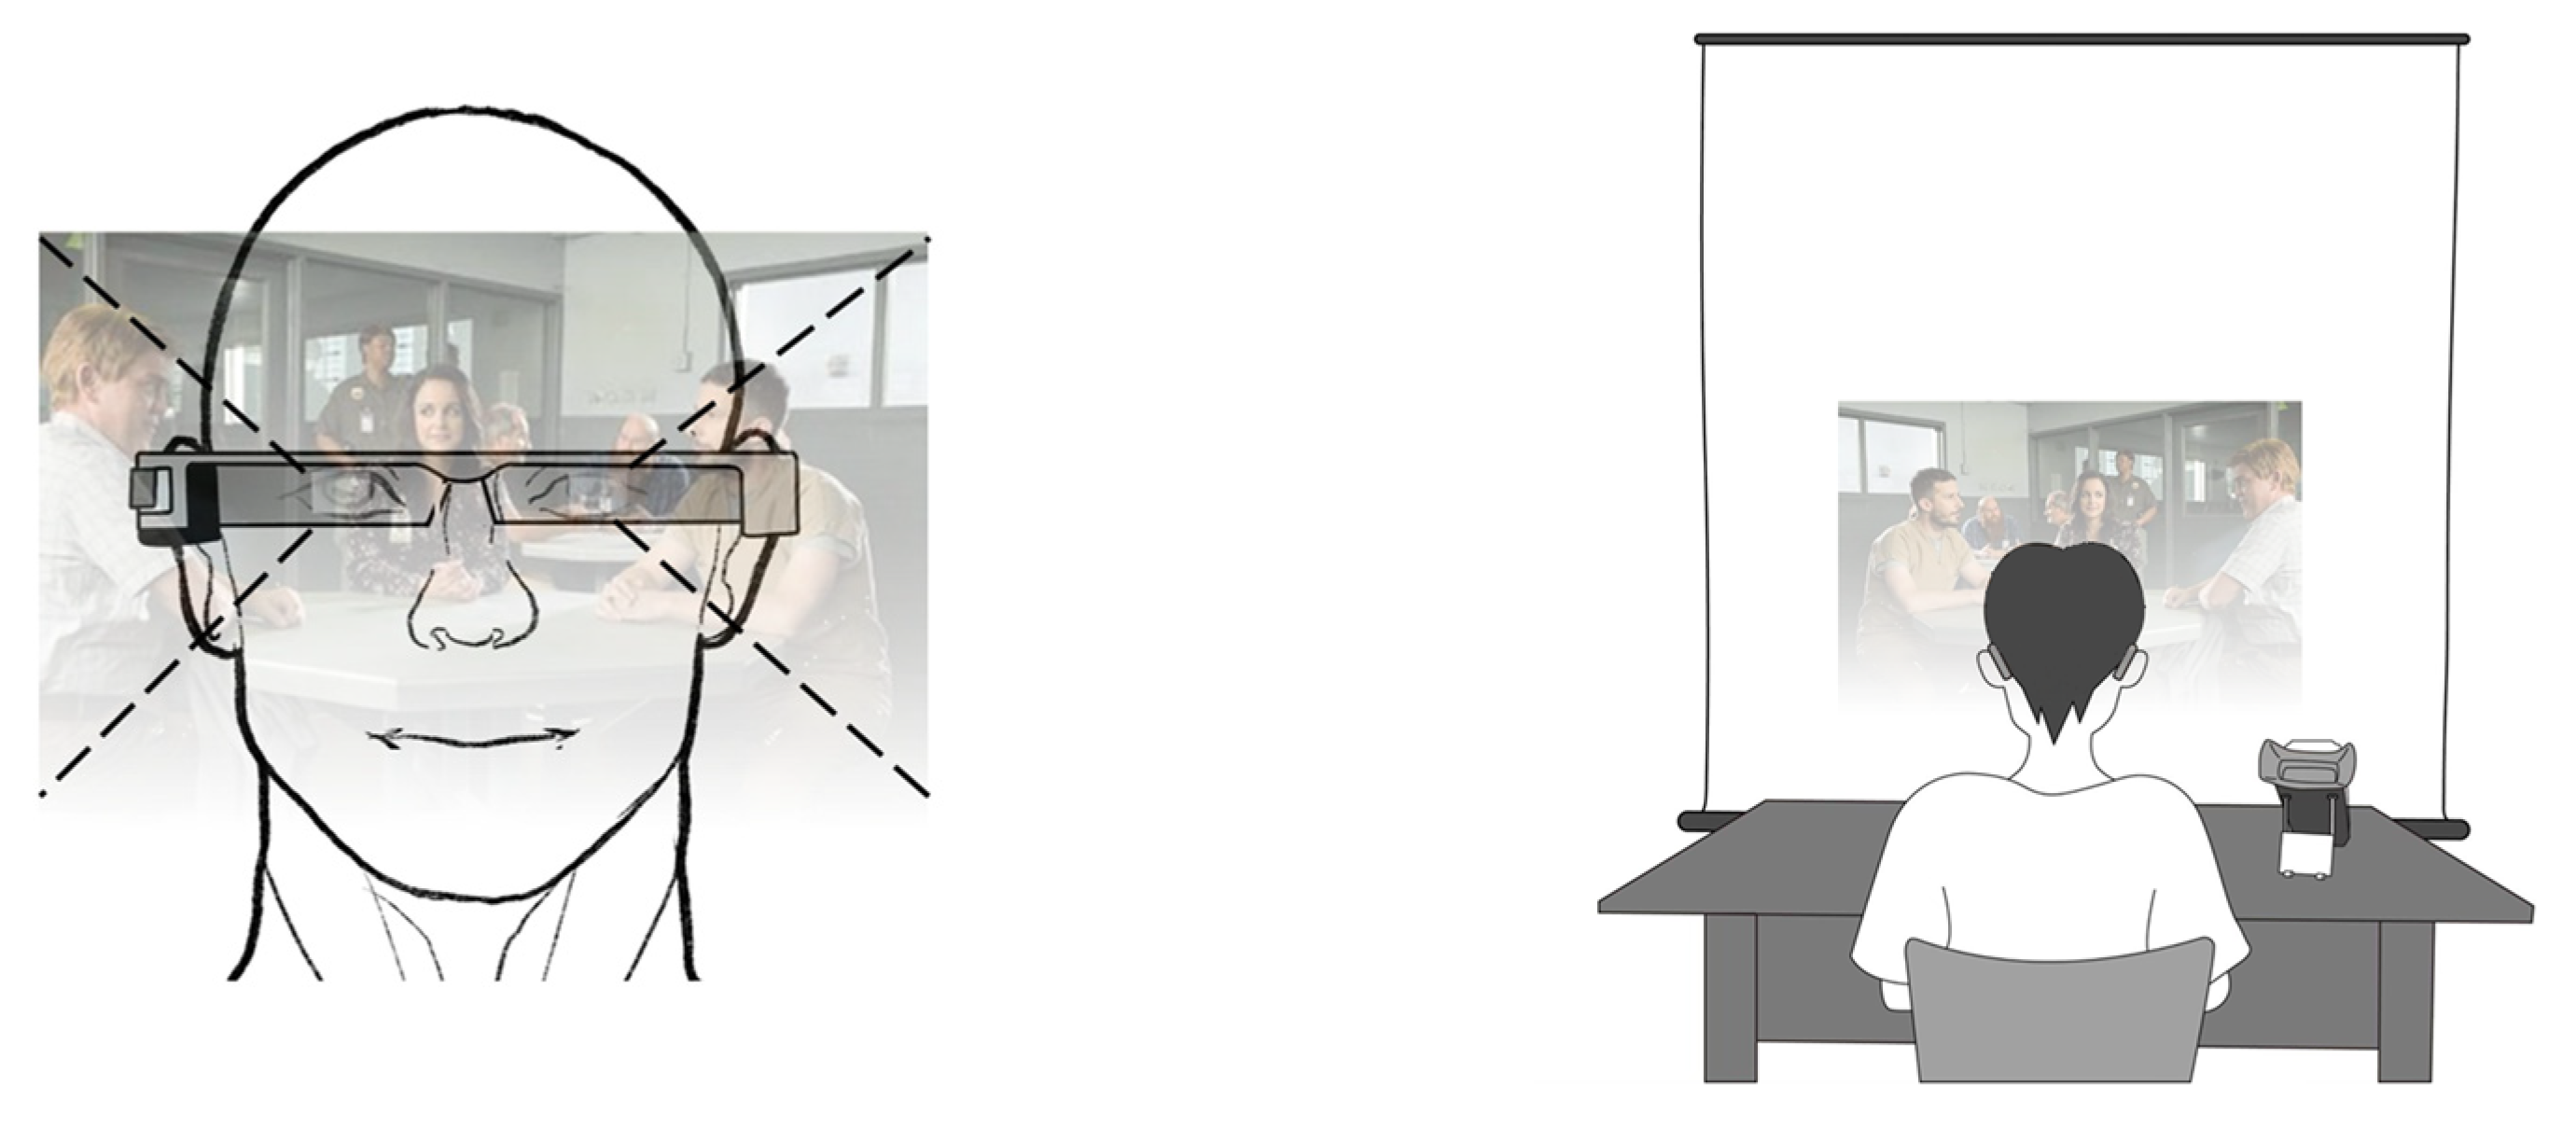
2.2. Apparatus
2.3. Experimental Design
2.3.1. Independent Variables
2.3.2. Dependent Variables
2.4. Experimental Procedure
2.5. Statistical Analysis
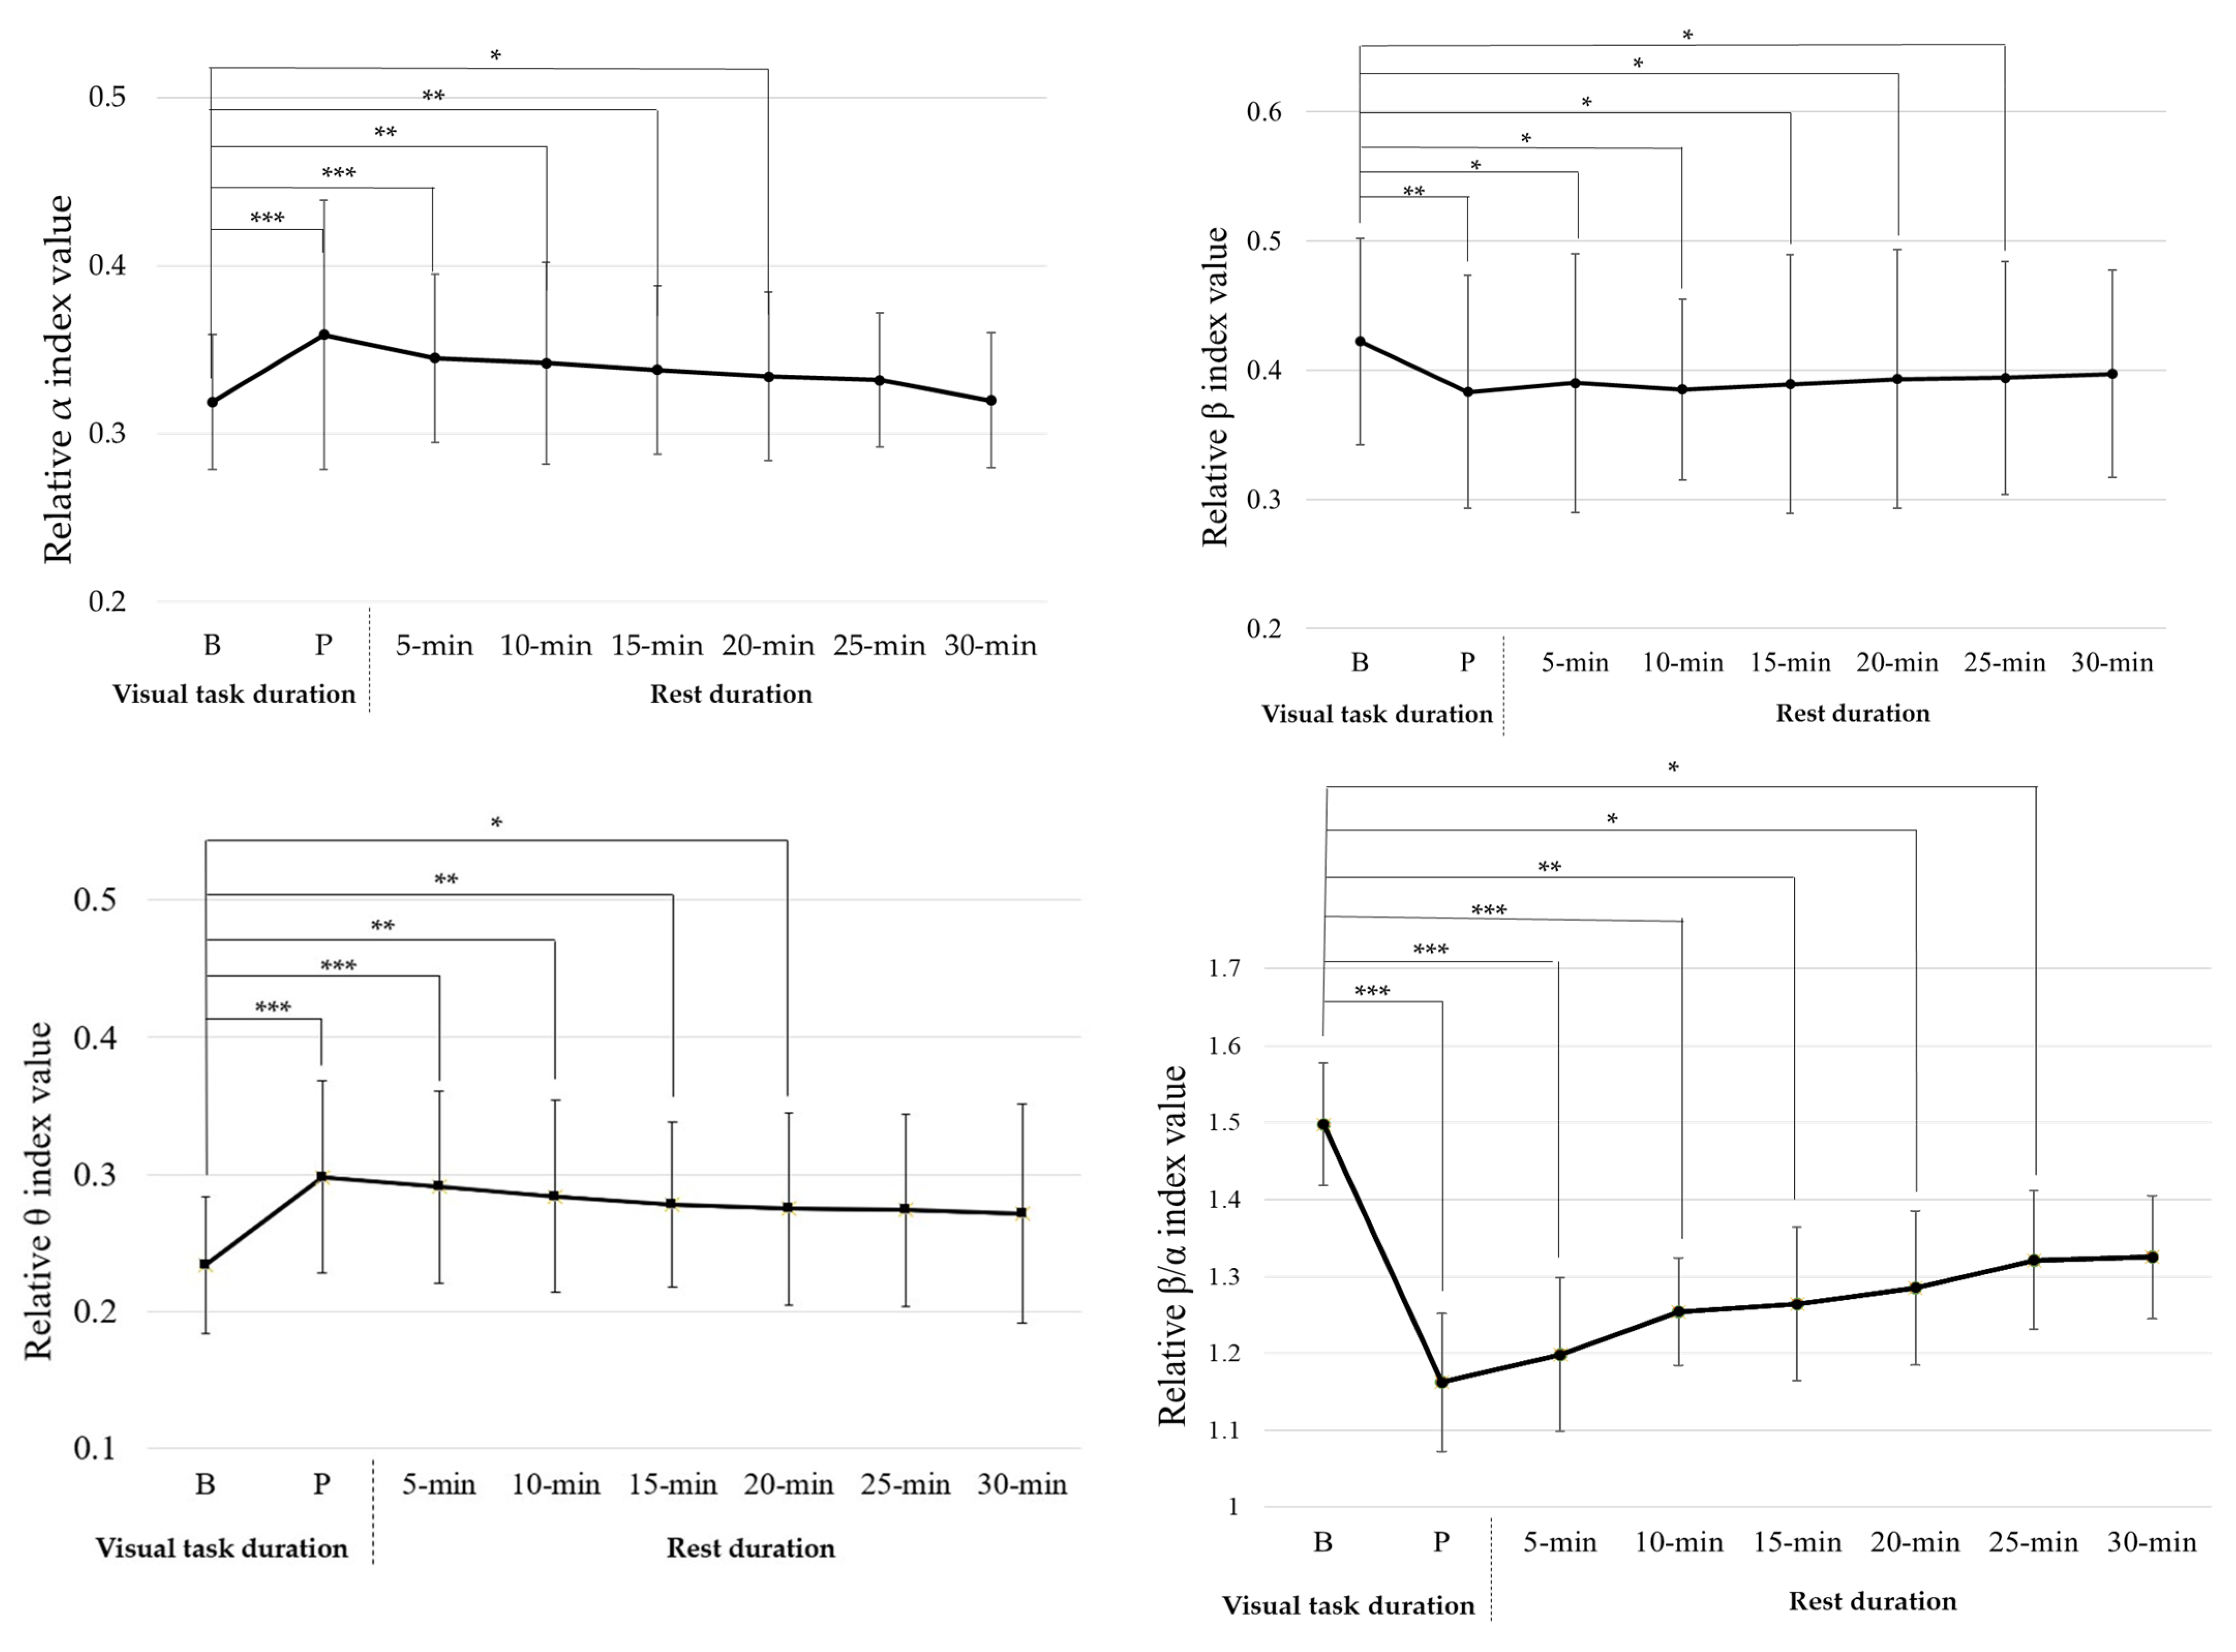
3. Results
4. Discussion
5. Conclusions
Author Contributions
Funding
Institutional Review Board Statement
Informed Consent Statement
Data Availability Statement
Conflicts of Interest
References
- Xu, M.; Hua, H. Ultrathin optical combiner with microstructure mirrors in augmented reality. Digit. Opt. Immersive Disp. 2018, 10676, 257–271. [Google Scholar] [CrossRef]
- Ukai, R.; Kuno, T.; Nakamura, T.; Uchiyama, M.; Ouchi, S. High luminance and high see-through head-mounted displays with beam-splitter-array waveguides. J. Soc. Inf. Disp. 2021, 29, 78–88. [Google Scholar] [CrossRef]
- Dominic, J.; Robb, A. Exploring effects of screen-fixed and world-fixed annotation on navigation in virtual reality. In Proceedings of the 2020 IEEE Conference on Virtual Reality and 3D User Interfaces (VR), Atlanta, GA, USA, 22–26 March 2020. [Google Scholar] [CrossRef]
- Ghasemi, Y.; Singh, A.; Kim, M.; Johnson, A.; Jeong, H. Effects of Head-locked Augmented Reality on User’s Performance and Perceived Workload. Proc. Hum. Factors Ergon. Soc. Annu. Meet. 2021, 65, 1094–1098. [Google Scholar] [CrossRef]
- Gabbard, J.L.; Mehra, D.G.; Swan, J.E. Effects of AR display context switching and focal distance switching on human performance. IEEE Trans. Vis. Comput. Graph. 2018, 25, 2228–2241. [Google Scholar] [CrossRef]
- Hua, H.; Javidi, B. A 3D integral imaging optical see-through head-mounted display. Opt. Express 2014, 22, 13484–13491. [Google Scholar] [CrossRef]
- Kaufeld, M.; Mundt, M.; Forst, S.; Hecht, H. Optical see-through augmented reality can induce severe motion sickness. Displays 2022, 74, 102283. [Google Scholar] [CrossRef]
- Kramida, G. Resolving the vergence-accommodation conflict in head-mounted displays. IEEE Trans. Vis. Comput. Graph. 2015, 22, 1912–1931. [Google Scholar] [CrossRef]
- Erickson, A.; Kim, K.; Bruder, G.; Welch, G.F. A Review of Visual Perception Research in Optical See-Through Augmented Reality. In Proceedings of the ICAT-EGVE 2022—International Conference on Artificial Reality and Telexistence and Eurographics Symposium on Virtual Environments, Virtual Conference, 2–4 December 2020. [Google Scholar] [CrossRef]
- Bharadwaj, S.R.; Candy, T.R. Accommodative and vergence responses to conflicting blur and disparity stimuli during development. J. Vis. 2009, 9, 4. [Google Scholar] [CrossRef]
- Park, S.; Kyung, G.; Choi, D.; Yi, J.; Lee, S.; Choi, B.; Lee, S. Effects of display curvature and task duration on proofreading performance, visual discomfort, visual fatigue, mental workload, and user satisfaction. Appl. Ergon. 2019, 78, 26–36. [Google Scholar] [CrossRef]
- Kang, Y.Y.; Wang, M.J.J.; Lin, R. Usability evaluation of e-books. Displays 2009, 30, 49–52. [Google Scholar] [CrossRef]
- Chi, C.F.; Lin, F.T. A comparison of seven visual fatigue assessment techniques in three data-acquisition VDT tasks. Hum. Factors 1998, 40, 577–590. [Google Scholar] [CrossRef]
- Wu, H.C. Electronic paper display preferred viewing distance and character size for different age groups. Ergonomics 2011, 54, 806–814. [Google Scholar] [CrossRef]
- Hsu, B.W.; Wang, M.J.J. Evaluating the effectiveness of using electroencephalogram power indices to measure visual fatigue. Percept. Mot. Ski. 2013, 116, 235–252. [Google Scholar] [CrossRef]
- Fisch, B.J. Fisch and Spehlmann’s EEG Primer: Basic Principles of Digital and Analog EEG, 3rd ed.; Elsevier: Amsterdam, The Netherlands, 1999. [Google Scholar]
- Zou, B.; Liu, Y.; Guo, M.; Wang, Y. EEG-based assessment of stereoscopic 3D visual fatigue caused by vergence-accommodation conflict. J. Disp. Technol. 2015, 11, 1076–1083. [Google Scholar] [CrossRef]
- Jap, B.T.; Lal, S.; Fischer, P.; Bekiaris, E. Using EEG spectral components to assess algorithms for detecting fatigue. Expert Syst. Appl. 2009, 36, 2352–2359. [Google Scholar] [CrossRef]
- Eoh, H.J.; Chung, M.K.; Kim, S.H. Electroencephalographic study of drowsiness in simulated driving with sleep deprivation. Int. J. Ind. Ergon. 2005, 35, 307–320. [Google Scholar] [CrossRef]
- Ramadan, M.Z.; Alhaag, M.H.; Abidi, M.H. Effects of viewing displays from different distances on human visual system. Appl. Sci. 2017, 7, 1153. [Google Scholar] [CrossRef]
- Caserman, P.; Garcia-Agundez, A.; Gámez Zerban, A.; Göbel, S. Cybersickness in current-generation virtual reality head-mounted displays: Systematic review and outlook. Virtual Real. 2021, 25, 1153–1170. [Google Scholar] [CrossRef]
- Kennedy, R.S.; Lane, N.E.; Berbaum, K.S.; Lilienthal, M.G. Simulator sickness questionnaire: An enhanced method for quantifying simulator sickness. Int. J. Aviat. Psychol. 1993, 3, 203–220. [Google Scholar] [CrossRef]
- Saredakis, D.; Szpak, A.; Birckhead, B.; Keage, H.A.; Rizzo, A.; Loetscher, T. Factors associated with virtual reality sickness in head-mounted displays: A systematic review and meta-analysis. Front. Hum. Neurosci. 2020, 14, 96. [Google Scholar] [CrossRef]
- Reddy, S.C.; Low, C.K.; Lim, Y.P.; Low, L.L.; Mardina, F.; Nursaleha, M.P. Computer vision syndrome: A study of knowledge and practices in university students. Nepal. J. Ophthalmol. 2013, 5, 161–168. [Google Scholar] [CrossRef] [PubMed]
- Keshavarz, B.; Stelzmann, D.; Paillard, A.; Hecht, H. Visually induced motion sickness can be alleviated by pleasant odors. Exp. Brain Res. 2015, 233, 1353–1364. [Google Scholar] [CrossRef]
- Keshavarz, B.; Hecht, H. Pleasant music as a countermeasure against visually induced motion sickness. Appl. Ergon. 2014, 45, 521–527. [Google Scholar] [CrossRef] [PubMed]
- Moss, J.D.; Muth, E.R. Characteristics of head-mounted displays and their effects on simulator sickness. Hum. Factors 2011, 53, 308–319. [Google Scholar] [CrossRef] [PubMed]
- Shieh, K.K.; Chen, M.T. Effects of screen color combination, work-break schedule, and workpace on VDT viewing distance. Int. J. Ind. Ergon. 1997, 20, 11–18. [Google Scholar] [CrossRef]
- Balci, R.; Aghazadeh, F. The effect of work-rest schedules and type of task on the discomfort and performance of VDT users. Ergonomics 2003, 46, 455–465. [Google Scholar] [CrossRef]
- Hayashi, M.; Chikazawa, Y.; Hori, T. Short nap versus short rest: Recuperative effects during VDT work. Ergonomics 2004, 47, 1549–1560. [Google Scholar] [CrossRef]
- Wu, H.C.; Chiu, M.C.; Peng, C.W. Visual fatigue occurrence time when using hand-held intelligent devices. J. Ambient Intell. Humaniz. Comput. 2016, 7, 829–835. [Google Scholar] [CrossRef]
- Hua, H. Enabling focus cues in head-mounted displays. Proc. IEEE 2017, 105, 805–824. [Google Scholar] [CrossRef]
- Gao, Y.; Liu, Y.; Normand, J.M.; Moreau, G.; Gao, X.; Wang, Y. A study on differences in human perception between a real and an AR scene viewed in an OST-HMD. J. Soc. Inf. Disp. 2019, 27, 155–171. [Google Scholar] [CrossRef]
- Epson Moverio BT-200 Smart Glasses Specification. Available online: https://www.epson.com.au/products/projectoraccessories/Moverio_BT-200_Specs.asp (accessed on 16 December 2022).
- Boksem, M.A.S.; Meijman, T.F.; Lorist, M.M. Effects of mental fatigue on attention: An ERP study. Cogn. Brain Res. 2005, 25, 107–116. [Google Scholar] [CrossRef]
- Lal, S.K.; Craig, A. A critical review of the psychophysiology of driver fatigue. Biol. Psychol. 2001, 55, 173–194. [Google Scholar] [CrossRef]
- Iwasaki, T.; Akiya, S. The significance of changes in CFF values during performance on a VDT-based visual task. In Megaw, Towards Human Work: Solutions to Problems in Occupational Health and Safety; Taylor & Francis: London, UK, 1991; pp. 352–357. [Google Scholar]
- Cajochen, C.; Krauchi, K.; Von Arx, M.A.; Mori, D.; Graw, P.; Wirz-Justice, A. Daytime melatonin administration enhances sleepiness and theta/alpha activity in the waking EEG. Neurosci. Lett. 1996, 207, 209–213. [Google Scholar] [CrossRef]
- Drexler, J.M. Identification of System Design Features that Affect Sickness in Virtual Environments. Ph.D. Thesis, University of Central Florida, Orlando, FL, USA, 2006. [Google Scholar]
- Kennedy, R.S.; Drexler, J.; Kennedy, R.C. Research in visually induced motion sickness. Appl. Ergon. 2010, 41, 494–503. [Google Scholar] [CrossRef]
- Liu, R.; Xu, M.; Zhang, Y.; Peli, E.; Hwang, A.D. A Pilot Study on EEG-Based Evaluation of Visually Induced Motion Sickness. J. Imaging Sci. Technol. 2020, 64, 20501-1–20501-10. [Google Scholar] [CrossRef]
- Yoshimura, I.; Tomoda, Y. A study on fatigue estimation by integrated analysis of psychophysiological function Relating to continuous working time and rest pause for VDT work. Jpn. J. Ergon. 1994, 30, 85–97. [Google Scholar] [CrossRef]
- Larese Filon, F.; Drusian, A.; Ronchese, F.; Negro, C. Video display operator complaints: A 10-year follow-up of visual fatigue and refractive disorders. Int. J. Environ. Res. Public Health 2019, 16, 2501. [Google Scholar] [CrossRef]
- Hsiao, C.Y.; Wang, M.J.; Lu, Y.T.; Chang, C.C. Usability evaluation of monocular optical head-mounted displays on reading tasks. J. Ambient Intell. Humaniz. Comput. 2018, 1–10. [Google Scholar] [CrossRef]
- Flanagan, M.B.; May, J.G.; Dobie, T.G. Sex differences in tolerance to visually-induced motion sickness. Aviat. Space Environ. Med. 2005, 76, 642–646. [Google Scholar] [CrossRef]
- Hemmerich, W.A.; Shahal, A.; Hecht, H. Predictors of visually induced motion sickness in women. Displays 2019, 58, 27–32. [Google Scholar] [CrossRef]


| SSQ Items | Nausea | Oculomotor | Disorientation |
|---|---|---|---|
| 1. General discomfort | v | v | |
| 2. Fatigue | v | ||
| 3. Headache | v | ||
| 4. Eyestrain | v | ||
| 5. Difficulty focusing | v | v | |
| 6. Increased salivation | v | ||
| 7. Sweating | v | ||
| 8. Nausea | v | v | |
| 9. Difficulty concentrating | v | v | |
| 10. Fullness of head | v | ||
| 11. Blurred vision | v | v | |
| 12. Dizzy (eyes open) | v | ||
| 13. Dizzy (eyes closed) | v | ||
| 14. Vertigo | v | ||
| 15. Stomach awareness | v | ||
| 16. Burping | v | ||
| Total | (1) | (2) | (3) |
| SSQ scores | |||
| Nausea | (1) × 9.54 | ||
| Oculomotor | (2) × 7.58 | ||
| Disorientation | (3) × 13.92 | ||
| Total | [(1) + (2) + (3)] × 3.74 | ||
| Source | CFF (Unit: Hz) (Mean ± SD) | ||
|---|---|---|---|
| 15 Min Visual Task | 30 Min Visual Task | ||
| Baseline | 35.539 ± 2.964 | 35.600 ± 3.086 | |
| Post-experiment | 34.061 ± 2.801 | 33.583 ± 2.581 | |
| Rest duration | 5 min | 34.712 ± 2.991 | 34.222 ± 2.796 |
| 10 min | 35.334 ± 2.701 | 34.382 ± 2.841 | |
| 15 min | 35.282 ± 3.081 | 35.331 ± 3.201 | |
| 20 min | 35.424 ± 3.130 | 35.402 ± 3.241 | |
| 25 min | 35.491 ± 3.071 | 35.474 ± 3.014 | |
| 30 min | 35.522 ± 3.091 | 35.535 ± 3.122 | |
| Source | 15 Min Visual Task | 30 Min Visual Task | ||
|---|---|---|---|---|
| Mean ± SD | Mean ± SD | |||
| O1 | O2 | O1 | O2 | |
| α | 0.335± 0.065 | 0.336 ± 0.077 | 0.323 ± 0.056 | 0.318 ± 0.058 |
| β | 0.377 ± 0.083 | 0.377 ± 0.082 | 0.394 ± 0.088 | 0.389 ± 0.094 |
| θ | 0.303 ± 0.071 | 0.303 ± 0.074 | 0.268 ± 0.066 | 0.271 ± 0.071 |
| β/α | 1.175 ± 0.355 | 1.178 ± 0.364 | 1.291 ± 0.413 | 1.259 ± 0.407 |
| θ/α | 0.922 ± 0.217 | 0.932 ± 0.244 | 0.867 ± 0.258 | 0.864 ± 0.255 |
| 15 Min Visual Task | SSQ Scores (Mean ± SD) | ||||
|---|---|---|---|---|---|
| Nausea | Oculomotor | Disorientation | Total | ||
| Baseline | 0 | 3.537 ± 5.535 | 3.712 ± 9.625 | 2.618 ± 4.622 | |
| Post-experiment | 5.088 ± 9.284 | 17.686 ± 11.623 | 15.776 ± 21.852 | 20.944 ± 18.881 | |
| Rest duration | 5 min | 4.452 ± 7.816 | 11.117 ± 10.854 | 6.496 ± 10.165 | 14.711 ± 14.060 |
| 10 min | 1.272 ± 3.298 | 9.601 ± 9.532 | 4.640 ± 8.442 | 7.729 ± 8.502 | |
| 15 min | 1.272 ± 3.298 | 3.537 ± 5.535 | 0.928 ± 3.532 | 1.995 ± 3.064 | |
| 20 min | 1.272 ± 3.298 | 3.537 ± 5.535 | 0.928 ± 3.532 | 1.995 ± 3.064 | |
| 25 min | 0 | 3.032 ± 5.487 | 0.928 ± 3.532 | 1.745 ± 3.064 | |
| 30 min | 0 | 3.032 ± 5.487 | 0.928 ± 3.532 | 1.745 ± 3.064 | |
| 15 Min Visual Task | SSQ Scores (Mean ± SD) | ||||
|---|---|---|---|---|---|
| Nausea | Oculomotor | Disorientation | Total | ||
| Baseline | 0.636 ± 2.420 | 5.053 ± 7.269 | 4.640 ± 6.674 | 3.989 ± 5.283 | |
| Post-experiment | 6.864 ± 9.201 | 29.815 ± 17.908 | 38.048 ± 39.529 | 28.673 ± 20.539 | |
| Rest duration | 5.088 ± 5.999 | 24.761 ± 16.765 | 33.408 ± 37.919 | 23.188 ± 19.848 | 14.711 ± 14.060 |
| 7.314 ± 16.747 | 17.181 ± 15.792 | 22.272 ± 29.608 | 17.204 ± 21.102 | 7.729 ± 8.502 | |
| 4.770 ± 6.007 | 16.170 ± 17.323 | 12.992 ± 28.999 | 13.215 ± 17.672 | 1.995 ± 3.064 | |
| 1.908 ± 5.255 | 11.623 ± 13.753 | 6.496 ± 15.394 | 8.228 ± 11.386 | 1.995 ± 3.064 | |
| 0.636 ± 2.420 | 6.569 ± 7.377 | 8.352 ± 19.205 | 5.735 ± 8.083 | 1.745 ± 3.064 | |
| 0.636 ± 2.420 | 5.053 ± 6.081 | 1.856 ± 7.063 | 3.241 ± 4.578 | 1.745 ± 3.064 | |
| 15 Min Visual Task | 30 Min Visual Task | |||
|---|---|---|---|---|
| Visual Task Duration | Rest Duration | Visual Task Duration | Rest Duration | |
| CFF value | −0.302, p = 0.019 | 0.114, p = 0.012 | −0.362, p = 0.254 | 0.106, p = 0.157 |
| α | 0.156, p = 0.234 | −0.156, p = 0.068 | 0.279, p = 0.235 | −0.191, p = 0.074 |
| β | −0.037, p = 0.781 | 0.018, p = 0.809 | −0.266, p = 0.482 | 0.123, p = 0.099 |
| θ | 0.227, p = 0.081 | −0.127, p = 0.090 | 0.214, p = 0.821 | −0.421, p = 0.105 |
| β/α | −0.129, p = 0.326 | −0.086, p = 0.252 | −0.356, p = 0.121 | −0.286, p = 0.152 |
Disclaimer/Publisher’s Note: The statements, opinions and data contained in all publications are solely those of the individual author(s) and contributor(s) and not of MDPI and/or the editor(s). MDPI and/or the editor(s) disclaim responsibility for any injury to people or property resulting from any ideas, methods, instructions or products referred to in the content. |
© 2023 by the authors. Licensee MDPI, Basel, Switzerland. This article is an open access article distributed under the terms and conditions of the Creative Commons Attribution (CC BY) license (https://creativecommons.org/licenses/by/4.0/).
Share and Cite
Hsiao, C.-Y.; Kuo, C.-C.; Liou, Y.-A.; Wang, M.-J. Determining Work-Rest Schedules for Visual Tasks That Use Optical Head-Mounted Displays Based on Visual Fatigue and Visually Induced Motion Sickness Recovery. Int. J. Environ. Res. Public Health 2023, 20, 1880. https://doi.org/10.3390/ijerph20031880
Hsiao C-Y, Kuo C-C, Liou Y-A, Wang M-J. Determining Work-Rest Schedules for Visual Tasks That Use Optical Head-Mounted Displays Based on Visual Fatigue and Visually Induced Motion Sickness Recovery. International Journal of Environmental Research and Public Health. 2023; 20(3):1880. https://doi.org/10.3390/ijerph20031880
Chicago/Turabian StyleHsiao, Chih-Yu, Chia-Chen Kuo, Yi-An Liou, and Mao-Jiun Wang. 2023. "Determining Work-Rest Schedules for Visual Tasks That Use Optical Head-Mounted Displays Based on Visual Fatigue and Visually Induced Motion Sickness Recovery" International Journal of Environmental Research and Public Health 20, no. 3: 1880. https://doi.org/10.3390/ijerph20031880
APA StyleHsiao, C.-Y., Kuo, C.-C., Liou, Y.-A., & Wang, M.-J. (2023). Determining Work-Rest Schedules for Visual Tasks That Use Optical Head-Mounted Displays Based on Visual Fatigue and Visually Induced Motion Sickness Recovery. International Journal of Environmental Research and Public Health, 20(3), 1880. https://doi.org/10.3390/ijerph20031880