1. Introduction
The rapid development in China of urbanization and industrialization has led to severe air pollution, which typically is characterized by a heavy haze [
1]. Haze is mainly derived from excess fine particulate matter (PM
2.5) emitted from anthropogenic sources [
2]. In 2013, in response to increasing air pollution, the Chinese government launched the Action Plan for Prevention and Control of Air Pollution (APPCAP). A target for lower PM
2.5 concentrations in China by 2018 was included, according to a recommendation from the Ministry of Ecology and Environment [
3]. However, this target does not meet WHO requirements [
4], and mild haze still occurs frequently in China. Meanwhile, ozone (O
3) pollution has become a new environmental issue in China. The O
3 concentrations of 377 cities in mainland China were 138 µg/m
3 in 2020, an increase of 12.6% since 2015. This issue has attracted the attention of the Chinese government. The focus of air pollution control in China has shifted, and coordinated control of PM
2.5 and O
3 is urgently needed following the successful implementation of APPCAP [
5].
The control of O
3 is more difficult than that of PM
2.5 because its formation process is more complex, and it is less likely to be understood by the public compared with PM
2.5, which is usually associated with conducive meteorological factors which lead to severe haze affecting atmospheric visibility [
6,
7]. Effective air quality management must be based on a solid public understanding of air pollution problems and solutions [
8]. Although the public sometimes lacks information on environmental pollution and disasters, their basic concept of risk is heightened compared to that of experts [
9]. Thus, an effective understanding of public awareness can affect the government’s decision making and facilitate the promulgation and implementation of a series of measures and policies.
Max Weber, a famous German sociologist, put forward the theory of the relationship between perception and action. He believed that social action could be described in this way; it is related to the behavior of others, and the process of action is oriented according to the actors or the intention of the actors [
10]. This study aimed to carry out quantitative research into public behavior and public perceptions of atmospheric environmental management. Compared with traditional questionnaire surveys, the application of internet-based big data approaches allows some defects to be overcome, such as the limitation of the amount of information used and the quality of answers. This is conducive to the study of social perception and action theory from a more scientific and quantitative perspective. Public concern is an important factor affecting the public perception of environmental policies. As a kind of public good, the environment needs social attention to reflect its value and attract the attention of the government. Only by proposing stricter environmental protection policies can we encourage more research and development of air pollution prevention technology and protect the health of the public.
Public concern is an important factor affecting the public perception of environmental policies. From the 1960s to the 1970s, recognition grew that assessing the general public for their level of understanding regarding air pollution was necessary if air pollution was eventually to be eliminated [
11,
12,
13]. Some studies have also found obvious associations between specific air pollutants and public concern about air quality [
14,
15,
16]. In addition, some studies have been devoted to the public’s willingness to pay for pollution mitigation [
17,
18]. The methods for these studies have been mainly based on questionnaire surveys. The advent of big data has provided novel research methods for studies based on public perspectives. For instance, some studies have used big data to investigate the correlations between air pollutants and public concern [
18,
19]. In addition, some scholars have focused on the relationship between air quality and public concern about environmental protection using social-media-based perspectives [
20,
21,
22]. At present, China is one of the largest countries affected by air pollution, and an effective understanding of air quality from the perspective of public concern will help to enhance environmental management.
Search engine technology is an important component of big data approaches, and search indices based on search engine data can reflect urban public concerns and perception of air pollution issues to a certain degree. In China, Baidu is the most popular Web search engine; it dominates over 80% of China’s search market [
23], and has been applied in different research fields [
18,
24,
25,
26,
27]. In a previous study, we also used a search index to reveal the important relationships between air quality monitoring data and public concern based on a case study of haze in China during the implementation of APPCAP [
19]. However, with the coordinated control of PM
2.5 and O
3 in the era following APPCAP, we need to consider public concern about PM
2.5 and O
3 from a collaborative governance perspective.
As the search results for “haze” and “ozone” from the Baidu index platform are not commercialized, they can be considered to have higher credibility for indicating the public’s concerns about air quality. We use the Baidu search index of “ozone” and “haze” to analyze the variation in public concern about ozone and haze in the last decade, and to uncover different correlations in different stages between air quality and public concern. Then, we identified regions requiring public attention and present suggestions to improve public attention. Research on public concern about air pollutants will provide a reference for scientists studying air quality and enhance the government’s ability to respond proactively to environmental crises.
2. Materials and Methods
2.1. Data
The Baidu search index is the weighted sum of search frequency for a keyword in Baidu Web, which is based on the search volume of netizens on Baidu and takes keywords as the statistical object. The data began in January 2010 with three time scales: hourly value (24 h), daily mean value, and the average value of a user-defined time scale (more than one day); and three spatial scales: city, province, and country. We chose “haze” and “ozone” in Chinese as the search keywords because they are popular words used by the Chinese public to describe air quality. The search index values of “haze” were calculated via the following steps: typing the word “haze” in the Baidu index engine, then selecting the region names and setting the time parameters. Other keywords were investigated similarly.
Most haze is caused by excess fine particulates, i.e., PM
2.5, emitted by anthropogenic sources [
17]. Studies have proven that the PM
2.5 concentrations are clearly higher in haze-conducive weather, and haze pollution can be reduced consistently with reductions in PM
2.5 emissions [
28,
29]. Therefore, haze is characterized by the PM
2.5 concentration. PM
2.5 and ozone concentrations were taken from urban air quality monitoring data released by the China National Environmental Monitoring Centre, which have been available since 2013. In this paper, we used the daily mean value and monthly mean value of the PM
2.5 concentration and the daily maximum 8 h average ozone concentration data. In addition, the population data were taken from the statistical yearbook of each province in mainland China.
2.2. Methods
2.2.1. Public Concern Index for PM2.5 and Ozone
In this study, the public concern index (PI) is defined to represent the proportion of people concerned in one region, taking the air quality of this region as its weight. The PI of haze was calculated using Equation (1):
where
refers to the haze search index of a region in 2020, obtained from the Baidu index platform, and P refers to the population in the region. f() is the normalized function.
refers to the annual level of PM
2.5 concentration allowed by the national air quality standard, which is 35 µg/m
3.
refers to the annual average concentration of PM
2.5 in this region in 2020. The larger the
is, the higher the public’s concern about haze and the higher their participation in the prevention and control of haze pollution and atmospheric environmental management.
Similarly, the PI of ozone was calculated using Equation (2):
where
refers to the ozone search index in 2020.
refers to the annual level of ozone allowed by the national air quality standard, which is 100 µg/m
3.
refers to the annual average concentration of ozone in the region in 2020. Similarly, the larger the
is, the higher the public’s concern about ozone.
PI, a comprehensive public concern index for PM
2.5 and ozone, was defined to represent the proportion of people concerned about haze and ozone, and the influence of air quality was considered.
The larger the PI, the higher the public’s concern about haze and ozone and the higher their participation in environmental protection and atmospheric environment management.
2.2.2. Statistical Analysis
Correlation analysis is one of the main research methods used in this study. It is a statistical method used to research linear relationships between two variables and has been widely used in air pollution research [
30,
31]. The Pearson correlation coefficient has become the most used correlation coefficient to characterize the correlations of fixed-distance variables [
32]. In this study, the Pearson correlation coefficient was applied to explore the relationships between air quality (PM
2.5 and ozone concentration) and public concern about haze and ozone (search indices of haze and ozone). Its formula can be found in a previous study [
19].
Lag correlation analysis is used to study the lag time and the correlations between the peaks of time series [
33,
34,
35,
36]. A time lag between haze or ozone pollution outbreaks and public concerns about haze or ozone may exist. Therefore, we examined whether there was such a lag phenomenon in the public response to serious haze or ozone pollution. According to the peak/end rule [
37,
38], we selected the typical peak periods in 2011–2020 for the daily lag correlation analysis. In addition, a cross-correlation function was applied to assess the lag time between PM
2.5 or ozone concentration and the search index of haze or ozone, and the peak of cross-correlation was employed to show the lag time between the two data time series. More details can be found in a previous study [
19].
3. Results
3.1. Temporal Analysis of Haze and Ozone and Public Concern about Them in China
The daily concentrations of PM
2.5 and ozone fluctuate seasonally in opposite directions (
Figure 1a). In autumn and winter, haze occurs frequently because the PM
2.5 concentration often exceeds the standard value; however, the ozone concentration is often relatively lower in these two seasons. In contrast, ozone pollution occurs frequently in summer, but the concentration of PM
2.5 is lower. According to the average daily search indices of “haze” and “ozone” (times/day) from the Baidu search engine (
Figure 1b,c) over the studied years, the public in China has paid increasing attention to these two environmental issues since 2011. Specifically, the haze search index increased rapidly in the first several years. Before January 2013, the haze search index was not high. It averaged 1262 searches per day in June 2012, which was the highest value in 2011 and 2012. In January 2013, the search index suddenly increased to 10,527 searches per day. This is because of the widespread haze in north China, which led to more than 7000 premature deaths and attracted extensive attention at home and abroad [
39,
40]. In December 2013, the index reached 33,432 searches per day, the highest value ever recorded. Moreover, there were two typical search index peaks associated with haze periods in 2015–2017, December in 2015 and December in 2016 [
41,
42]. Since then, with the effective resolution of the haze problem in most regions of China, the haze search index has decreased significantly. To some extent, this index shows that haze, as visible atmospheric pollution, is more concerning to the public; with the emergence of haze pollution, public attention increased; as the haze problem was gradually solved, the public paid less attention to it.
In contrast to the rapid variation trend of the haze search index, the ozone search index increased slowly with seasonal fluctuation. Generally, there were search peaks in autumn and winter from October to December and again in spring and summer from April to May. There were search troughs in the summer from July to August and early spring in February. However, the peak ozone search has appeared from May to September since 2016. China’s atmospheric pollution is dominated by particulate matter in winter and ozone in summer. In the process of coordinated collaborative governance of ozone and PM2.5, the focus is on ozone in summer and PM2.5 in winter.
Therefore, four typical peak periods of haze pollution, representing the four times at which the average concentrations of PM
2.5 in cities of mainland China were the highest in the last 10 years, were selected for daily analysis (see
Table 1). The results showed that the search index of haze increased progressively with increased PM
2.5 concentration with a time lag of one day. In the first peak period (December 2013–January 2014), the maximum cross-correlation coefficient (CC) between the daily PM
2.5 concentration and the haze search index was not significant, and the lag time was 3 days; however, the CC of the later peaks increased, and the lag time became shorter. By the fourth peak (December 2016), the CC reached a high correlation (CCmax = 0.893; Std. Error = 0.000), and the lag time was 1 day. Moreover, in the last two peak periods, the lag correlation coefficients for several consecutive days were significant, indicating that the public paid attention to haze for a longer time. The lag correlation analysis revealed that the public is likely to become increasingly sensitive to haze events as public environmental awareness improves.
Similarly to haze pollution, four typical peak periods of ozone pollution, which were the four times when the average concentrations of ozone in cities of mainland China were the highest in the last 10 years, were selected for daily analysis (see
Table 2). Public attention to ozone is becoming increasingly immediate. Compared with the ozone pollution peak, the lag time of the public search peak of ozone in the first peak period (May 2016~June 2016) was 6 days; while in the last peak period (May 2019~June 2019), the lag time was 1 day. That means, compared with the ozone pollution peak, the lag time of the public search peak of ozone was shortened from 6 days from the first peak period to 1 day from the last one (see the red part in
Table 2). When compared with
Table 1,
Table 2 shows that it is more difficult for the public to participate in the formulation of ozone pollution control policies and health protection strategies due to the invisibility of ozone. Therefore, decision makers need to strengthen publicity around ozone prediction, ozone pollution health protection, and public participation.
3.2. Spatial Analysis of Public Concern about Haze and Ozone and Zoning
The average daily search indices for haze and ozone in Chinese cities and the PI values of haze and ozone in 2020 are illustrated in
Figure 2, which shows that the eastern and southern cities with more population had higher search indices (
Figure 2a,c). Beijing, Shanghai, Xi’an, and Chengdu had higher haze search indices of more than 100 times/day. Beijing, Shanghai, Chengdu, Guangzhou, Shenzhen, Hangzhou, and Wuhan had ozone search indices higher than 150 times/day. The search indices for the two pollutants in less populated and economically underdeveloped areas in western China were smaller. Some cities in Tibet and Qinghai had a search index of 0. The Beijing–Tianjin–Hebei region and its surrounding areas in north China are the most frequently haze-polluted regions. Its surrounding areas, i.e., the junction region of Jiangsu–Anhui–Shandong–Henan in east China and the Fen-Wei Plains region and cities in Xinjiang in northwest China, are also haze-polluted regions. The average annual PM
2.5 concentration in 49 cities, including Shijiazhuang, was above 50 µg/m
3 in 2020. In addition, the Beijing–Tianjin–Hebei region and its surrounding areas in north China and the Yangtze River Delta region in east China are the most frequently ozone-polluted regions. The average annual ozone concentration in 64 cities, including Zibo, Tianjin, and Anyang, was above 160 µg/m
3 in 2020. Although some cities suffered from serious haze and ozone pollution, the PI
haze according to Formula (1) and PIozone according to Formula (2) were not high (
Figure 2b,d), indicating that the public paid little attention to the haze and ozone problem and may not participate enough in health and environmental protection. This situation was most obvious in Hebei and Shandong.
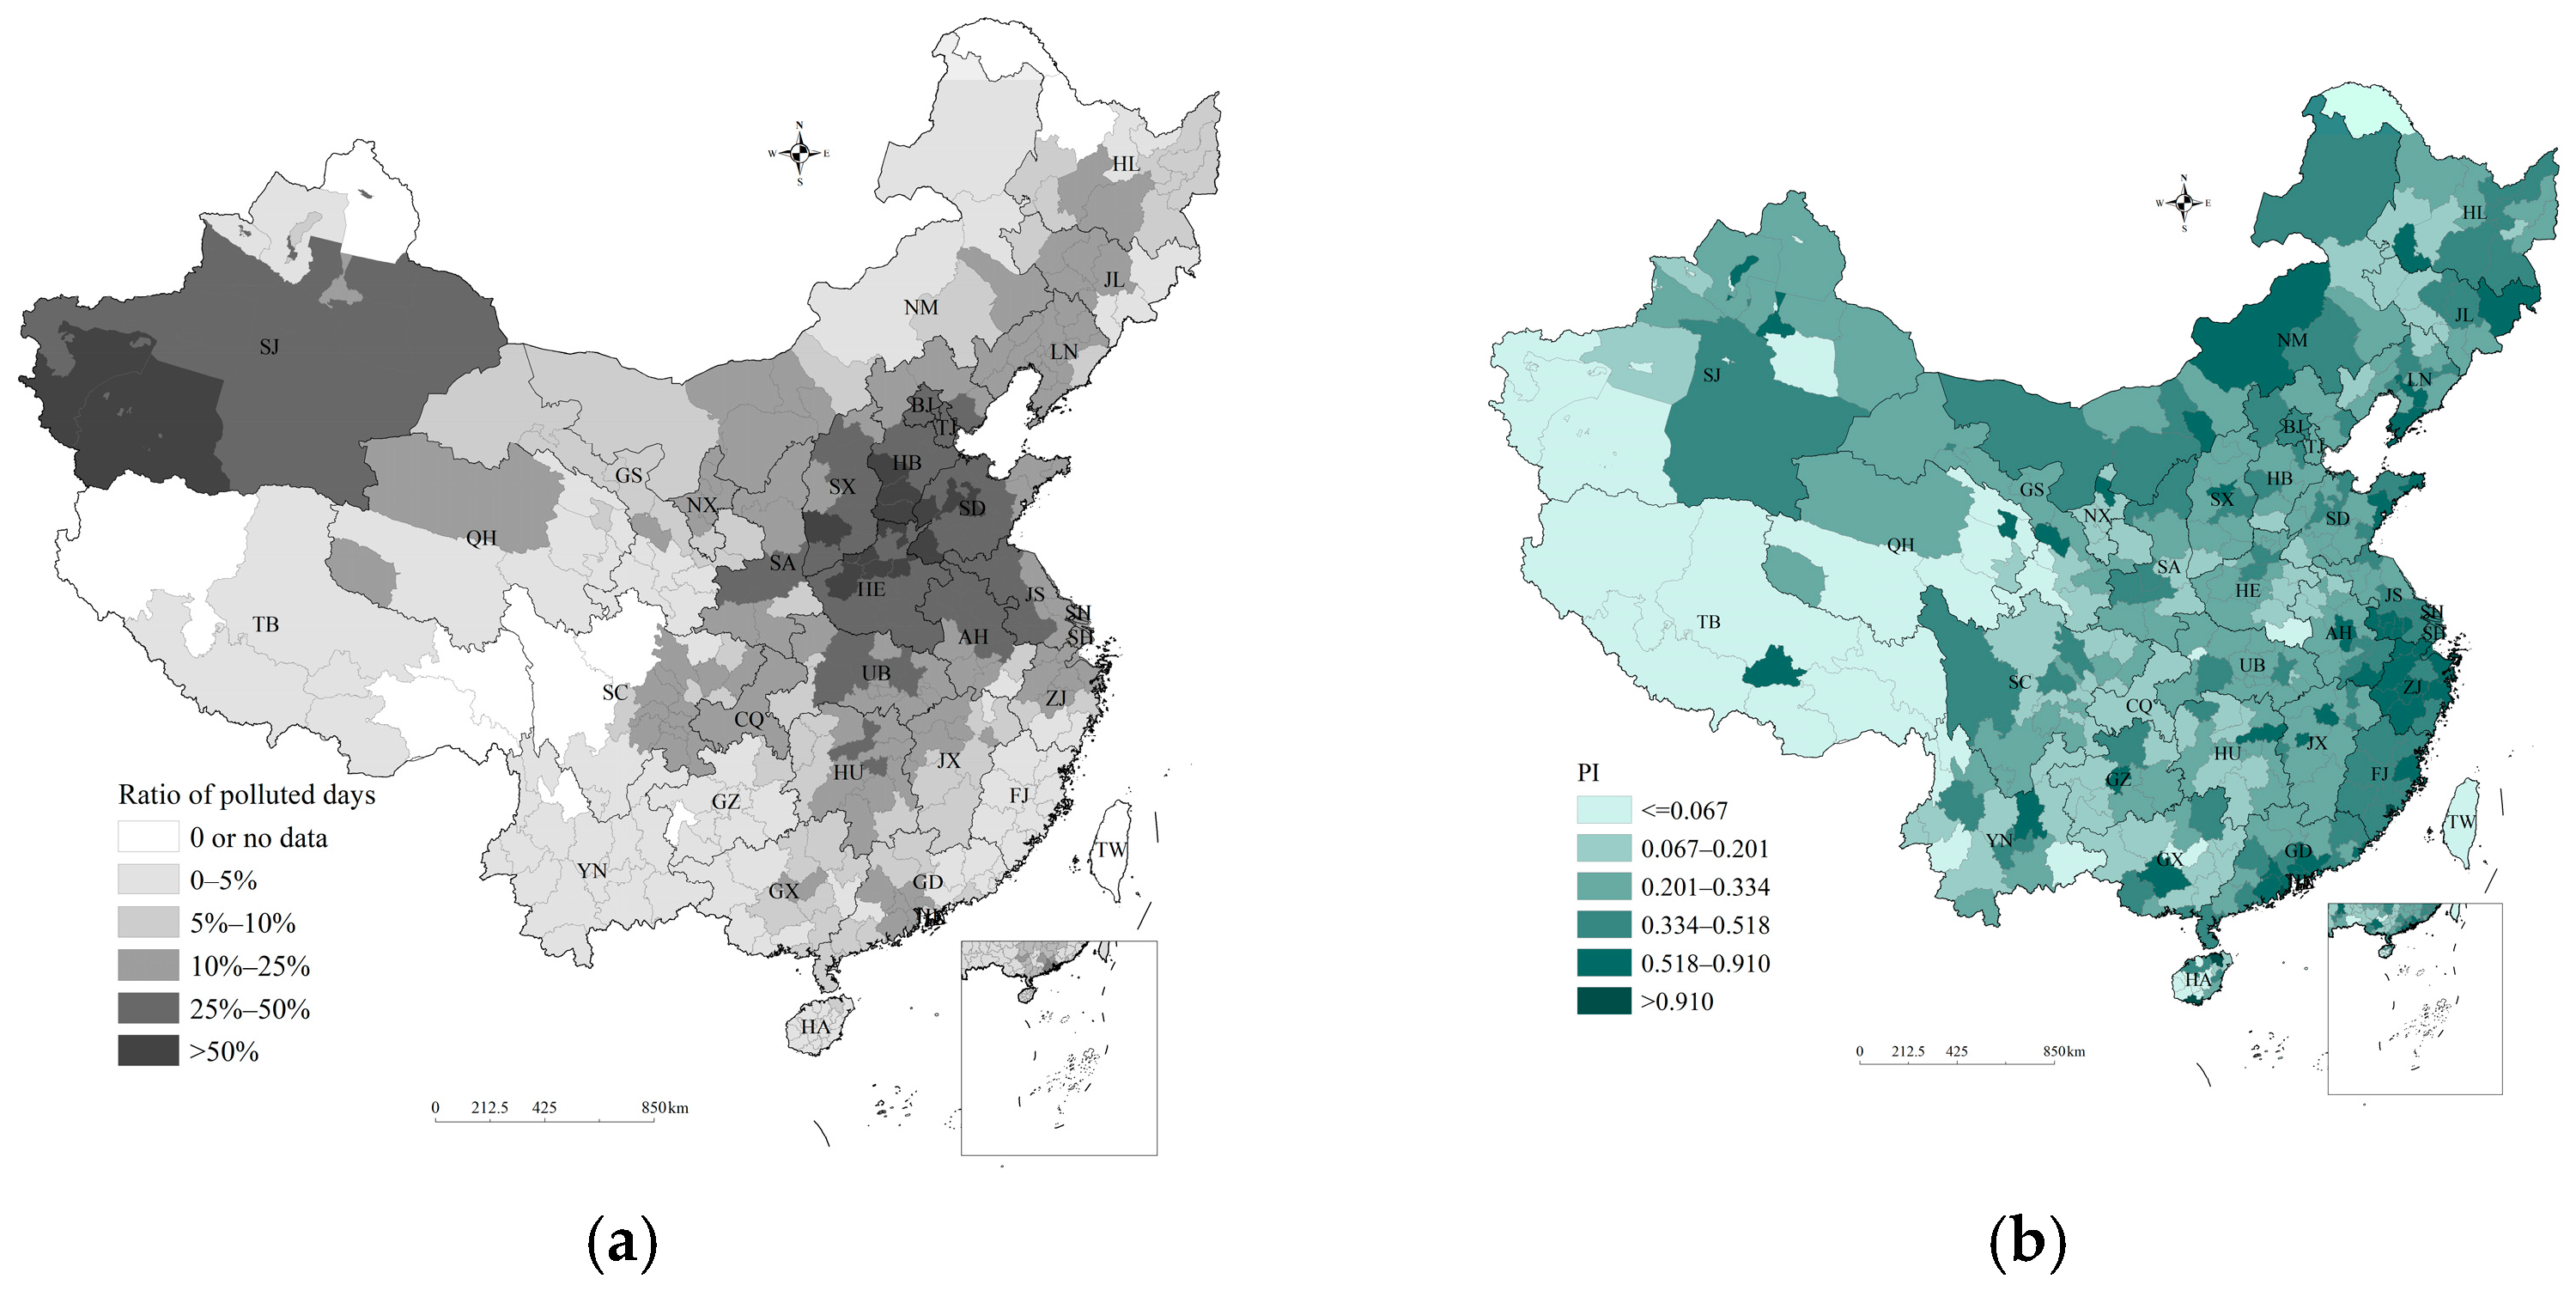
Figure 3a shows the proportion of polluted days in every city in 2020. Beijing–Tianjin–Hebei and its surrounding areas in north China were the regions that most frequently exceeded the standard. Its surrounding areas, i.e., the Junction region of Jiangsu–Anhui–Shandong–Henan in east China and the Fen-Wei Plains region in northwest China, also often experience polluted weather. The air quality in Anyang, Jiaozuo, Handan, Shijiazhuang, Linfen, Xingtai, Liaocheng, Luoyang, Zhengzhou, Kaifeng, Zibo, Heze, and Jinan exceeded the national standard on more than 50 percent of all days in 2020. Monitoring data showed that PM
2.5 and ozone were the main pollutants exceeding the standard in these regions. In addition, the air quality in some cities of Xinjiang was seriously below the standard due to sandstorms, which frequently increase PM
10. The air quality of cities in southwest China was generally good, and there was seldom weather conducive to pollution. In theory, regions with a higher proportion of days exceeding the national standard should have a higher pollution search index. However, their distribution patterns were not completely consistent. This lack of consistency was most obvious in southern Hebei, western Shandong, and some cities in Xinjiang, which had lower PI but a higher ratio of polluted days (
Figure 3b).
To identify regions with more serious pollution but less public concern, all the cities were classified according to the following principles, as shown in
Table 3. The classification results are shown in
Figure 4. The cities in Group IV were the target cities. For PI
haze and haze pollution, there were 78 cities in Group IV, i.e., Tangshan, Handan, Xingtai, Cangzhou, and so on. For PI
ozone and ozone pollution, there were 21 cities in Group IV, i.e., Tianjin, Handan, Cangzhou, Hengshui, and so on. For the comprehensive PI and proportion of polluted days, there were 78 cities in Group IV, i.e., Handan, Xingtai, Cangzhou, Hengshui, and so on.
All of the cities in group IV were integrated for public concern zoning against the background of PM
2.5 and ozone joint prevention and control. All the cities in this group have high pollution but little attention and should be identified as target cities for further research; meanwhile, the cities in the other groups have good air quality or enough public concern, or both. The colored areas in
Figure 5 indicate regions in which the public needs to pay more attention to haze or ozone. We have labeled them the “public concern region” for short. There were 96 cities defined as “public concern regions”, which were divided into four categories. Tangshan, Xingtai, Suzhou, Jinzhou, and 55 other cities were zoned to Region Ⅰ. Members of the public in this region need to pay more attention to haze pollution. Tianjin and Yangquan were zoned to Region Ⅱ, where the public needs to pay more attention to ozone pollution. Nineteen cities belonged to Region III, where the public needs to pay more attention to both haze and ozone. Sixteen cities belonged to Region IV, where the region is potentially polluted but has insufficient public attention. According to this zoning, the public can be targeted to promote environmental health knowledge and encourage participation in the formulation of environmental protection policies.
4. Conclusions
Since 2011, due to frequent occurrences of haze, the US embassy, some communities, and NGOs have purchased their own PM
2.5 monitors and have begun releasing unofficial data to citizens [
43]. This has drawn growing public concern about haze in China. The Chinese public has begun to understand urban air quality and pollutants, and this under-standing promotes public participation processes. With the implementation of the air pollution prevention and control action plan and other measures, the focus of air pollution prevention and control in China has changed, and the public’s attention to air pollution also has new characteristics. Internet big data provides novel data sources for research on public views for environmental management. The main conclusions based on the big data used in this study are as follows:
(1) The search index of haze was relatively low before 2013, but after the large-scale haze event in China in January 2013, public concern about haze showed explosive growth. This is due to contributions from both severe air pollution events and growing public awareness. However, since 2017, due to the significant reduction in haze, the public’s concern about it has decreased significantly. The maximum value of the haze search index was 203,020 on 20 December 2016.
(2) Unlike the significant increase and rapid decrease in public concern about haze, the search index of ozone showed a slow rise. The maximum value of the ozone search index was 10,534 on 19 May 2017. In the past two years, searches for ozone have sometimes exceeded those of haze, although they have not increased explosively. Even at its highest, the maximum value of ozone searches was only 5% of that of haze searches. The invisibility of ozone makes it difficult for the public to participate in the formulation of ozone pollution control policies and health protection.
(3) Four typical peak periods of haze pollution and ozone pollution, representing the four times when the average concentrations of PM2.5 or ozone in mainland China were the highest in the last 10 years, were selected for daily analysis. According to daily data analysis, the lag times of public concern about haze and ozone have become shorter. Along with the improvement of public environmental awareness and environmental information disclosure, the public in China has become more sensitive to serious haze with a one-day lag.
(4) Multiple “public concern regions” were identified. Data from the Baidu platform showed that the eastern and southern cities with higher populations had higher search indices. The search indices in less populated and economically underdeveloped areas in western China were lower. The PI index is defined to represent the proportion of people concerned about haze or ozone in a region. It was obvious that in southern Hebei, western Shandong, and some cities in Xinjiang, PI was low, but the ratio of polluted days was high. To identify regions with more serious pollution but less public concern, we classified all the cities in China according to the same classification principles. The results showed that there were 96 cities classified as “public concern regions”, which can be targeted to promote environmental health knowledge, and in which the public can be encouraged to acquire air pollution protection knowledge and participate in the formulation of environmental protection policies.
Based on the above conclusions, suggestions for improving public participation in atmospheric environmental management are put forward:
Air quality is an important factor affecting public attention and search behavior related to relevant keywords on the search platform. The higher the concentration of air pollutants, the greater the number of searches. While air pollution is the basis of public concern, the media and others can also play a role. Active publicity by the media is required to improve the public’s participation in air pollution prevention and health protection. Another study [
44] also suggests engaging citizens in the decision-making process to improve their political trust and publicizing knowledge of haze pollution to help the public acquire objective and scientific knowledge.
Moreover, due to the convenience of big data in atmospheric environment management, it is important to improve the application of big data in accurate atmospheric environmental management decision making. Therefore, in the process of environmental management, modern information tools should be used to obtain public suggestions. This will help the government to develop environmental indicators and policy measures that are more easily understood by the public. As a result, misalignment between public perception and the government on environmental governance can be largely mitigated.
5. Discussion
Damage to human health from haze has been proven by research [
16]. Some researchers also suggest that short-term ozone exposure might increase the risk of ischaemic events, especially in individuals with severe vascular risk factors. They propose that an inflammatory reaction induced by ozone might be responsible for cardiac and cerebral ischaemic events [
45,
46]. How to raise the public’s awareness of invisible ozone pollution and maintain sufficient public attention to low haze pollution is an issue that needs further research. In addition to serious air pollution, other factors can also lead to an increase in public concern. Long-term public concern may be affected by other social factors (e.g., media campaigns, the improvement of environmental awareness, and the expansion of people’s use of search engines). On the one hand, the government can make efforts to publicize the harms of air pollution; meanwhile a more effective emergency plan can be developed to better understand the lag phenomenon of public concern about air quality to dispatch emergency teams more efficiently.
This study has the following points of significance. Firstly, analyzing the changes in public concern about haze and ozone and identifying the regions that need public attention are conducive to formulating corresponding measures to improve public concern and participation in atmospheric environmental policies. Secondly, the reasonable utilization of big data and search engines has several benefits for the study of public concern about air quality. For instance, the application of big data can measure the public concern about air pollution quantitatively, which can help the government to develop a better understanding of the environmental problems concerning the public (i.e., top-down approach). Therefore, the government can effectively formulate environmental policy and indicator measures that are more easily accepted and understood by the public. These actions will help the public to proactively participate in the related policy-making decisions about environmental problems (i.e., bottom-up approach). In addition, compared with traditional monitoring systems, search engines have certain advantages due to their convenience and high level of efficiency. With the rapid development of scientific technologies, more statistical approaches can be used to collect valuable information from big data.
There are some limitations and uncertainties in this study that need to be addressed. First, the search engine data have certain weaknesses associated with various factors, such as commercial interference and politics. Fortunately, “haze” and “ozone” are topics that can be freely discussed in China and receive little interference from the government, and they are also neutral words involving minimal commercial interest. Second, according to the State Statistical Bureau, there were 989 million internet users in China in 2020, accounting for 70.6% of the national population. In the future, research could attempt to combine big data with traditional questionnaire surveys to include people who do not use the internet. In China, Baidu is the largest search engine, accounting for more than 80% of China’s internet search market. This meant that this study excluded less than 20% of internet search behavior. Future research should consider those people who use other search engines. This can further advance the rigor of research methods and accuracy of results.
Author Contributions
Conceptualization, M.S. and H.J.; methodology, Y.L. (Yaling Lu); software, Y.L. (Yaling Lu) and Y.W.; formal analysis, Y.L. (Yaling Lu); data curation, Y.L. (Yujie Liao), J.W., Y.L. (Yaling Lu); writing—original draft preparation, Y.L. (Yaling Lu) and Y.W.; writing—review and editing, Y.L. (Yaling Lu) and M.S.; funding acquisition, H.J. and Y.W. All authors have read and agreed to the published version of the manuscript.
Funding
This research was funded by the National Key Research and Development Program of China, grant number 2021YFC1809000; the National Natural Science Foundation of China, grant number 91846301.
Institutional Review Board Statement
Not applicable.
Informed Consent Statement
Not applicable.
Data Availability Statement
The data are not publicly available, and any inquiries may be addressed by the first author.
Conflicts of Interest
The authors declare no conflict of interest.
References
- Yue, H.B.; He, C.Y.; Huang, Q.X.; Yin, D.; Bryan, B.A. Stronger policy required to substantially reduce deaths from PM2.5 pollution in China. Nat. Commun. 2020, 11, 1462. [Google Scholar] [CrossRef]
- Sun, Y.L.; Zhuang, G.S.; Tang, A.H.; Wang, Y.; An, Z.S. Chemical characteristics of PM2.5 and PM10 in haze-fog episodes in Beijing. Environ. Sci. Technol. 2006, 40, 3148–3155. [Google Scholar] [CrossRef] [PubMed]
- Ministry of Ecology and Environment of China. Final Assessment of the Implementation of Air Pollution Prevention and Control Action Plan. 2017. Available online: http://www.mee.gov.cn/xxgk2018/xxgk/xxgk15/201806/t20180601_630217.html (accessed on 15 August 2022).
- Gong, K.J.; Li, L.; Li, J.Y.; Qin, M.M.; Wang, X.Y.; Ying, Q.; Liao, H.; Guo, S.; Hu, M.; Zhang, Y.H.; et al. Quantifying the impacts of inter-city transport on air quality in the Yangtze River Delta urban agglomeration, China: Implications for regional cooperative controls of PM2.5 and O3. Sci. Total Environ. 2021, 779, 146619. [Google Scholar] [CrossRef]
- Zhao, H.; Chen, K.Y.; Liu, Z.; Zhang, Y.X.; Shao, T.; Zhang, H.L. Coordinated control of PM2.5 and O3 is urgently needed in China after implementation of the “Air Pollution Prevention and Control Action Plan”. Chemosphere 2020, 270, 129441. [Google Scholar] [CrossRef] [PubMed]
- Fu, Y.; Liao, H.; Yang, Y. Interannual and decadal changes in tropospheric ozone in China and the associated chemistry-climate interactions: A review. Adv. Atmos. Sci. 2019, 36, 975–993. [Google Scholar] [CrossRef]
- Liu, Z.Y.; Qi, Z.L.; Ni, X.F.; Dong, M.T.; Ma, M.Y.; Xue, W.B.; Zhang, Q.Y.; Wang, J.N. How to apply O3 and PM2.5 collaborative control to practical management in China: A study based on meta-analysis and machine learning. Sci. Total Environ. 2021, 772, 145392. [Google Scholar] [CrossRef]
- Brunt, H.; Barnes, J.; Longhurst, J.W.S.; Scally, G.; Hayes, E.T. Local air quality management policy and practice in the UK: The case for greater public health integration and engagement. Environ. Sci. Policy 2016, 58, 52–60. [Google Scholar] [CrossRef]
- Slovic, P. Perception of risk. Science 1987, 236, 280–285. [Google Scholar] [CrossRef] [PubMed]
- Weber, M. Economy and Society; The Commercial Press: Beijing, China, 2004; p. 40. [Google Scholar]
- Smith, W.S.; Schueneman, J.J.; Zeidberg, L.D. Public Reaction to air pollution in Nashville, Tennessee. J. Air Pollut. Control Assoc. 1964, 14, 418–423. [Google Scholar] [CrossRef]
- Schusky, J. Public awareness and concern with air pollution in the St. Louis metropolitan area. J. Air Pollut. Control Assoc. 1966, 16, 72–76. [Google Scholar] [CrossRef]
- Tognacci, L.N.; Weigel, R.H.; Wideen, M.F.; Vernon, D.T.A. Environmental quality: How universal is public concern? Environ. Behav. 1972, 4, 73–86. [Google Scholar] [CrossRef]
- Atari, D.O.; Luginaah, I.N.; Fung, K. The relationship between odour annoyance scores and modelled ambient air pollution in Sarnia, ‘Chemical Valley’, Ontario. Int. J. Environ. Res. Public Health 2009, 6, 2655–2675. [Google Scholar] [CrossRef] [PubMed]
- Cao, J.W.; Chen, J. The impact of an authoritarian personality on pro-environmental behaviour for air pollution mitigation through interactions with social norms. Int. J. Environ. Res. Public Health 2021, 18, 9301. [Google Scholar] [CrossRef] [PubMed]
- Zhang, Q.; Jiang, X.J.; Tong, D.; Davis, S.J.; Zhao, H.Y.; Geng, G.N.; Feng, T.; Zheng, B.; Lu, Z.F.; Streets, D.G.; et al. Transboundary health impacts of transported global air pollution and international trade. Nature 2017, 543, 705–709. [Google Scholar] [CrossRef]
- Sun, C.W.; Yuan, X.; Yao, X. Social acceptance towards the air pollution in China: Evidence from public’s willingness to pay for smog mitigation. Energy Policy 2016, 92, 313–324. [Google Scholar] [CrossRef]
- Li, W.L.; Yang, G.F.; Li, X.M. Correlation between PM2.5 pollution and its public concern in China: Evidence from Baidu Index. J. Clean. Prod. 2021, 293, 126091. [Google Scholar] [CrossRef]
- Lu, Y.L.; Wang, Y.; Zuo, J.; Jiang, H.Q.; Huang, D.C.; Rameezdeen, R. Characteristics of public concern on haze in China and its relationship with air quality in urban areas. Sci. Total Environ. 2018, 637, 1597–1606. [Google Scholar] [CrossRef]
- Kay, S.; Zhao, B.; Sui, D. Can social media clear the air? A case study of the air pollution problem in Chinese cities. Prof. Geogr. 2015, 67, 351–363. [Google Scholar] [CrossRef]
- Pretto, L.D.; Acreman, S.; Ashfold, M.J.; Mohankumar, S.K.; Campos-Arceiz, A. The link between knowledge, attitudes and practices in relation to atmospheric haze pollution in Peninsular Malaysia. PLoS ONE 2015, 10, e0143655. [Google Scholar] [CrossRef]
- Tse, R.; Xiao, Y.B.; Pau, G.; Fdida, S.; Roccetti, M.; Marfia, G. Sensing pollution on online social networks: A transportation perspective. Mobile Netw. Appl. 2016, 21, 688–707. [Google Scholar] [CrossRef]
- Yuan, Q.Y.; Nsoesie, E.O.; Lv, B.F.; Peng, G.; Chunara, R.; Brownstein, J.S. Monitoring influenza epidemics in China with search query from Baidu. PLoS ONE 2013, 8, e64323. [Google Scholar] [CrossRef]
- Huang, D.C.; Wang, J.F. Monitoring hand, foot and mouth disease by combining search engine query data and meteorological factors. Sci. Total Environ. 2017, 612, 1293–1299. [Google Scholar] [CrossRef]
- Liu, K.K.; Wang, T.; Yang, Z.C.; Huang, X.D.; Milinovich, G.J.; Lu, Y.; Jing, Q.L.; Xia, Y.; Zhao, Z.Y.; Yang, Y.; et al. Using baidu search index to predict Dengue outbreak in China. Sci. Rep. 2016, 6, 38040. [Google Scholar] [CrossRef] [PubMed]
- Yang, H.X.; Li, S.; Sun, L.; Zhang, X.Y. Effects of the ambient fine particulate matter on public awareness of lung cancer risk in China: Evidence from the internet-based big data platform. JMIR Public Health Sur. 2017, 3, e8078. [Google Scholar] [CrossRef] [PubMed]
- Yang, J.; Zhang, Y.T.; Xiao, Y.X.; Shen, S.Q.; Su, M.; Bai, Y.Q.; Zhou, J.B.; Gong, P. Using internet search queries to assess public awareness of the healthy cities approach: A case study in Shenzhen, China. Int. J. Environ. Res. Public Health 2021, 18, 4264. [Google Scholar] [CrossRef]
- Kang, C.M.; Lee, H.S.; Kang, B.W.; Lee, S.K.; Sunwoo, Y. Chemical characteristics of acidic gas pollutants and PM2.5 species during hazy episodes in Seoul, South Korea. Atmos. Environ. 2004, 38, 4749–4760. [Google Scholar] [CrossRef]
- Schichtel, B.A.; Husar, R.B.; Falke, S.R.; Wilson, W.E. Haze trends over the United States, 1980–1995. Atmos. Environ. 2001, 35, 5205–5210. [Google Scholar] [CrossRef]
- Oh, H.J.; Nam, I.S.; Yun, H.; Kim, J.; Yang, J.; Sohn, J.R. Characterization of indoor air quality and efficiency of air purifier in childcare centers, Korea. Build. Environ. 2014, 82, 203–214. [Google Scholar] [CrossRef]
- Shaheen, M.A.; El-Nakhlawy, F.S.; Almehmadi, F.M.; Ihsan MZ AI-Shareef, A.R. Assessment of seasonal variation for air pollutant accumulation by Zizyphus tree under washing treatment. Environ. Monit. Assess. 2016, 188, 343. [Google Scholar] [CrossRef]
- Pearson, K.H. Mathematical contributions to the theory of evolution. XI. on the influence of natural selection on the variability and correlation of organs. Prot. Restor. Environ. 1903, 62, 413–417. [Google Scholar]
- Menéndez, R.; Megías, A.G.; Hill, J.K.; Braschler, B.; Willis, S.G.; Collingham, Y.; Fox, R.; Roy, D.B.; Thomas, C.D. Species richness changes lag behind climate change. Proc. R. Soc. B Biol. Sci. 2006, 273, 1465–1470. [Google Scholar] [CrossRef] [PubMed]
- Wu, D.H.; Zhao, X.; Liang, S.L.; Zhou, T.; Huang, K.C.; Tang, B.J.; Zhao, W.Q. Time-lag effects of global vegetation responses to climate change. Glob. Chang. Biol. 2015, 21, 3520–3531. [Google Scholar] [CrossRef] [PubMed]
- Lin, H.L.; Liu, T.; Xiao, J.P.; Zeng, W.L.; Guo, L.C.; Li, X.; Xu, Y.J.; Zhang, Y.H.; Chang, J.J.; Waughn, M.G.; et al. Hourly peak PM2.5 concentration associated with increased cardiovascular mortality in Guangzhou, China. J. Exposure Sci. Environ. Epidemiol. 2016, 27, 333–338. [Google Scholar] [CrossRef]
- Han, X.; Liu, Y.Q.; Gao, H.; Ma, J.M.; Mao, X.X.; Wang, Y.T.; Ma, X.D. Forecasting PM2.5 induced male lung cancer morbidity in China using satellite retrieved PM2.5 and spatial analysis. Sci. Total Environ. 2017, 607, 1009–1017. [Google Scholar] [CrossRef]
- Kahneman, D. Maps of bounded rationality: Psychology for behavioral economics. Am. Econ. Rev. 2003, 93, 1449–1475. [Google Scholar] [CrossRef]
- Nie, S.Z.; Wang, Z.; Pujia, W.; Nie, Y.; Lu, P. Big data prediction of durations for online collective actions based on peak’s timing. Phys. A 2017, 492, 138–154. [Google Scholar] [CrossRef]
- Andersson, A.; Deng, J.; Du, K.; Zheng, M.; Yan, C.; Sköld, M.; Gustafsson, O. Regionally-varying combustion sources of the January 2013 severe haze events over Eastern China. Environ. Sci. Technol. 2015, 49, 2038–2043. [Google Scholar] [CrossRef]
- Gao, M.; Saide, P.E.; Xin, J.; Wang, Y.; Liu, Z.; Wang, Y.; Wang, Z.; Pagowski, M.; Guttikunda, S.K.; Carmichael, G.R. Estimates of health impacts and radiative forcing in winter haze in Eastern China through constraints of surface PM2.5 predictions. Environ. Sci. Technol. 2017, 51, 2178–2185. [Google Scholar] [CrossRef]
- Cai, Z. Study on Causes of the Temporal and Spatial Variations of PM2.5 Pollution in Key Regions of China in Recent Years. Master’s Thesis, Nanjing University, Nanjing, China, 2018. [Google Scholar]
- Xiao, Y. Spatiotemporal Pattern of Air Quality and Its Influencing Factors in China. Master’s Thesis, Southwest University, Chongqing, China, 2018. [Google Scholar]
- Liu, L.X.; He, P.; Zhang, B.; Bi, J. Red and green: Public perception and air quality information in urban China. Environ. Sci. Policy 2012, 54, 44–49. [Google Scholar] [CrossRef]
- Zhou, L.Y.; Dai, Y.X. The influencing factors of haze tolerance in China. Int. J. Environ. Res. Public Health 2019, 16, 287. [Google Scholar] [CrossRef]
- Higgs, R. Public health: Ozone pollution-a link with cardiac and cerebral ischemic events? Nat. Rev. Cardiol. 2011, 8, 66. [Google Scholar] [CrossRef] [PubMed]
- Balajee, K.; Babu, S.; Suliankatchi, R.A.; Sehgal, M. Characteristics of the ozone pollution and its health effects in India. Int. J. Med. Public Health 2017, 7, 56–60. [Google Scholar]
| Disclaimer/Publisher’s Note: The statements, opinions and data contained in all publications are solely those of the individual author(s) and contributor(s) and not of MDPI and/or the editor(s). MDPI and/or the editor(s) disclaim responsibility for any injury to people or property resulting from any ideas, methods, instructions or products referred to in the content. |
© 2023 by the authors. Licensee MDPI, Basel, Switzerland. This article is an open access article distributed under the terms and conditions of the Creative Commons Attribution (CC BY) license (https://creativecommons.org/licenses/by/4.0/).


