

Modelling Impact of High-Rise, High-Density Built Environment on COVID-19 Risks: Empirical Results from a Case Study of Two Chinese Cities


Abstract
1. Introduction
2. Methods
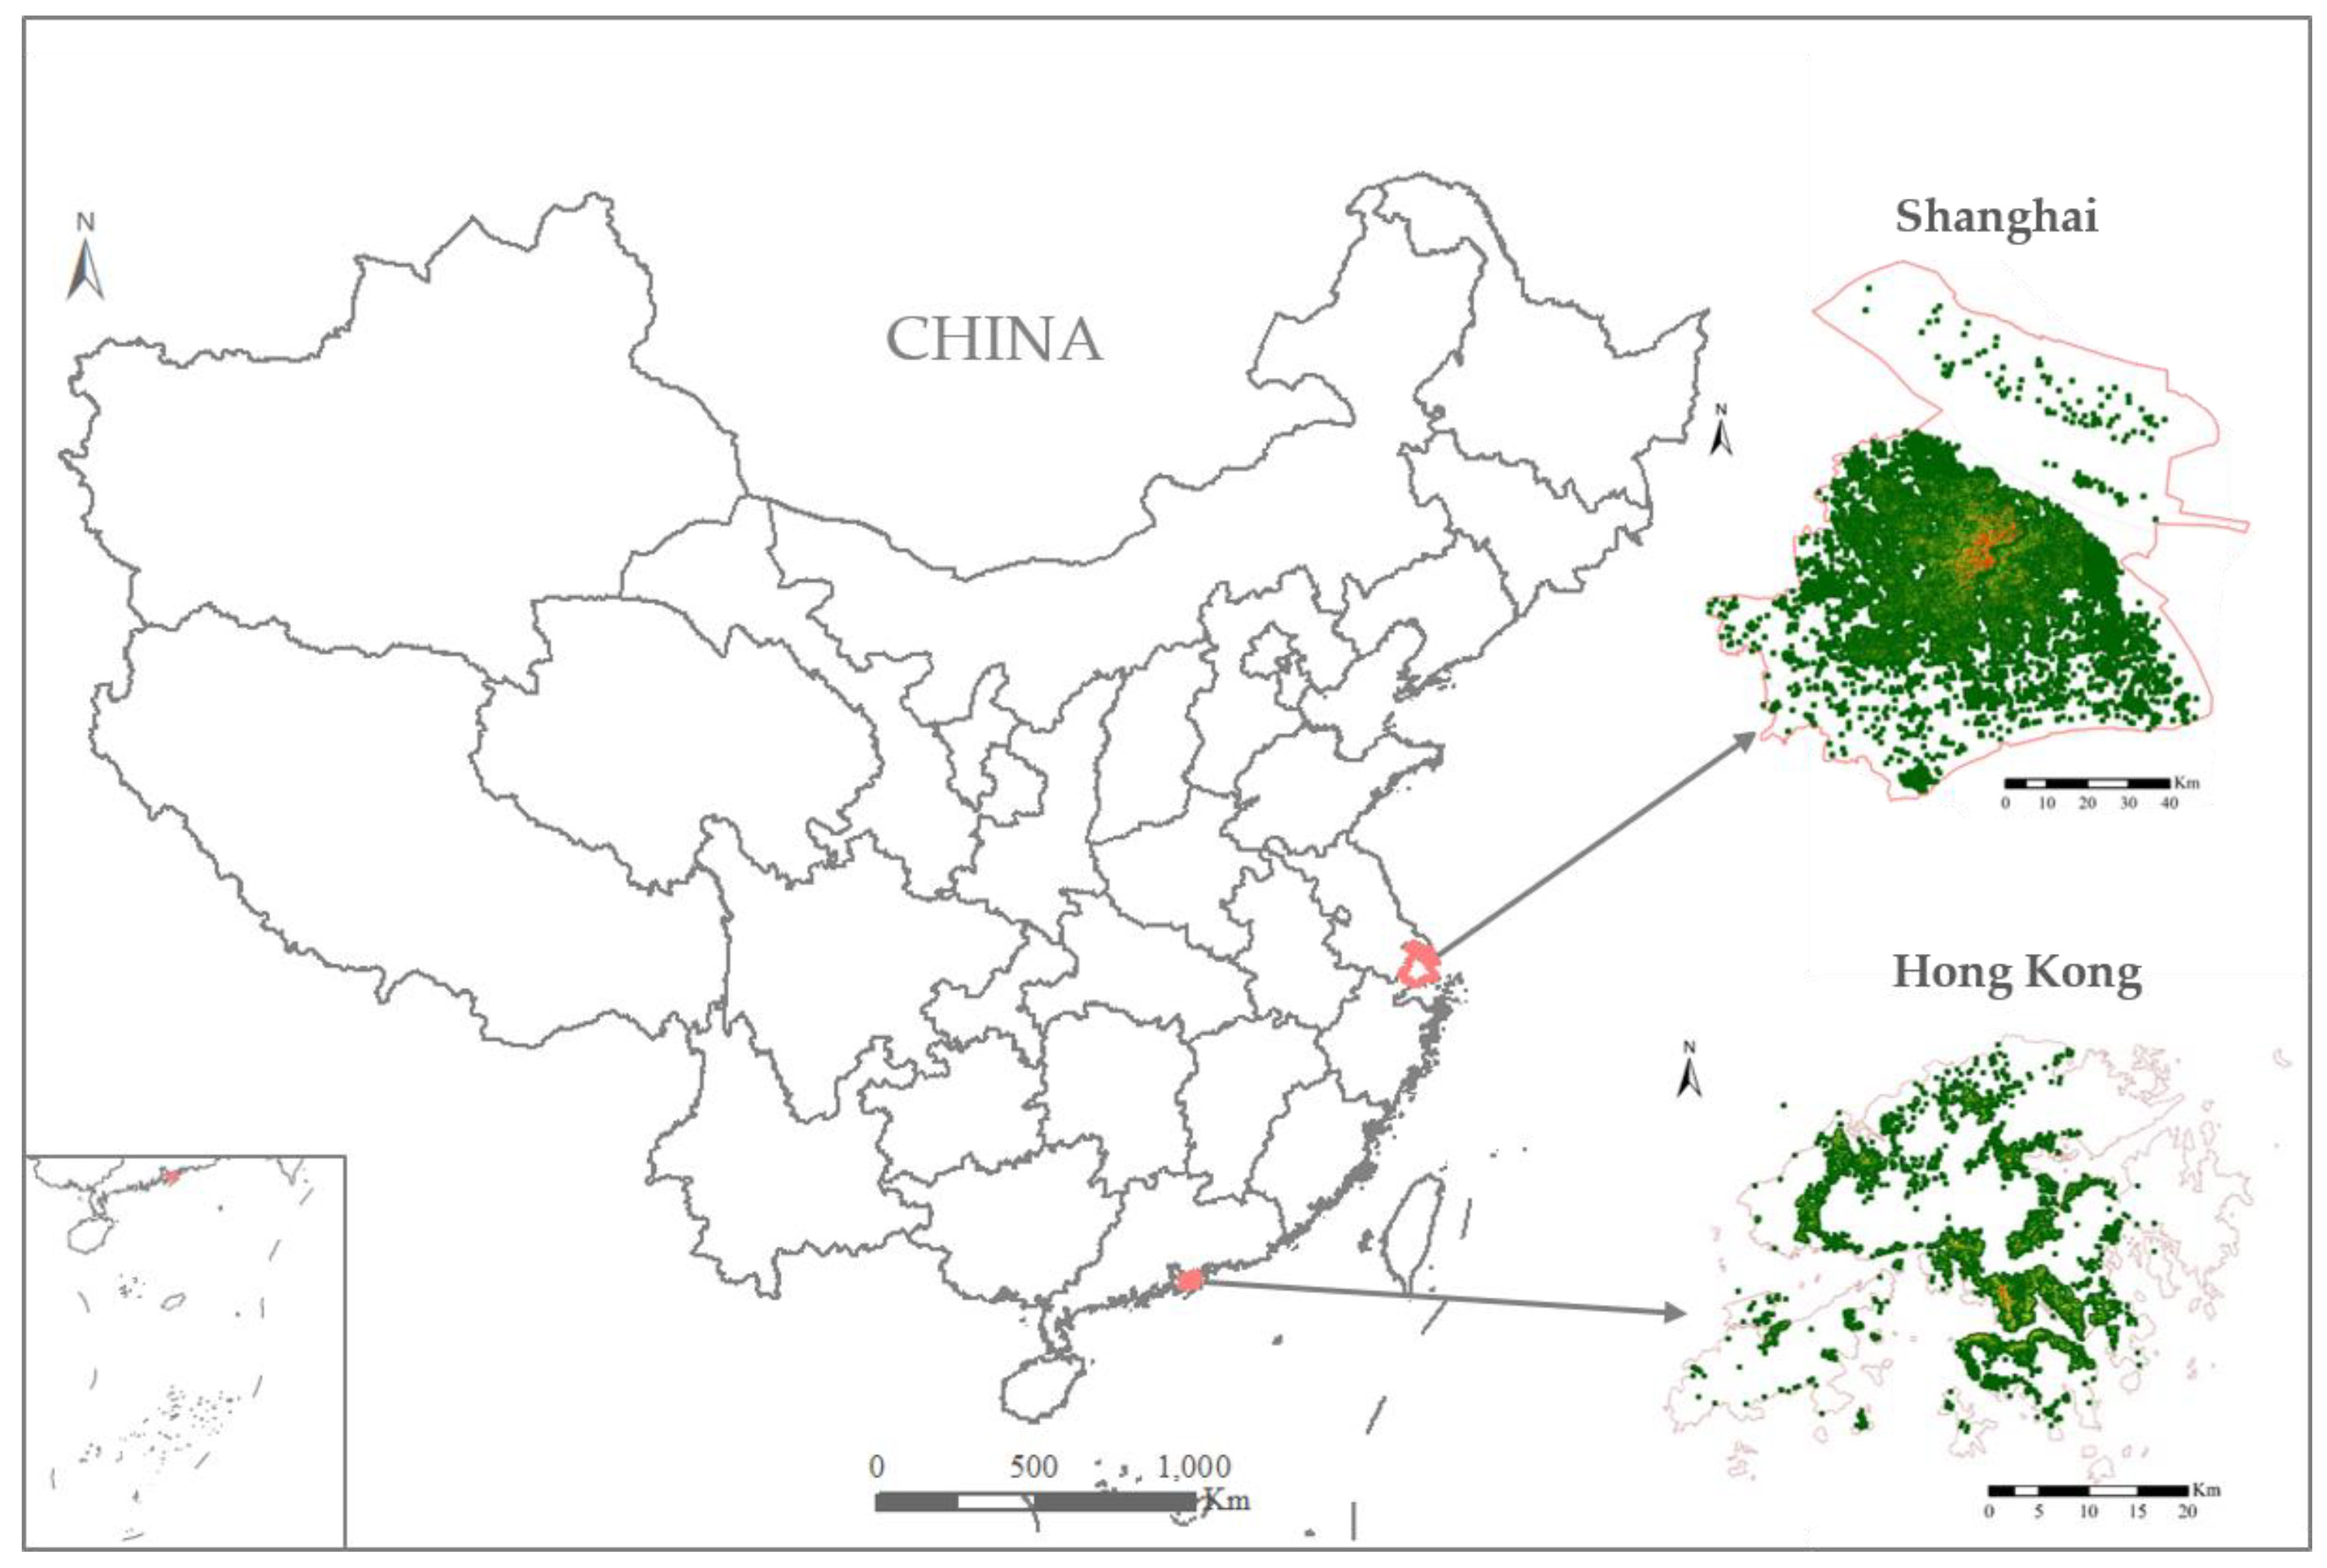
2.1. Study Area
2.2. Datasets
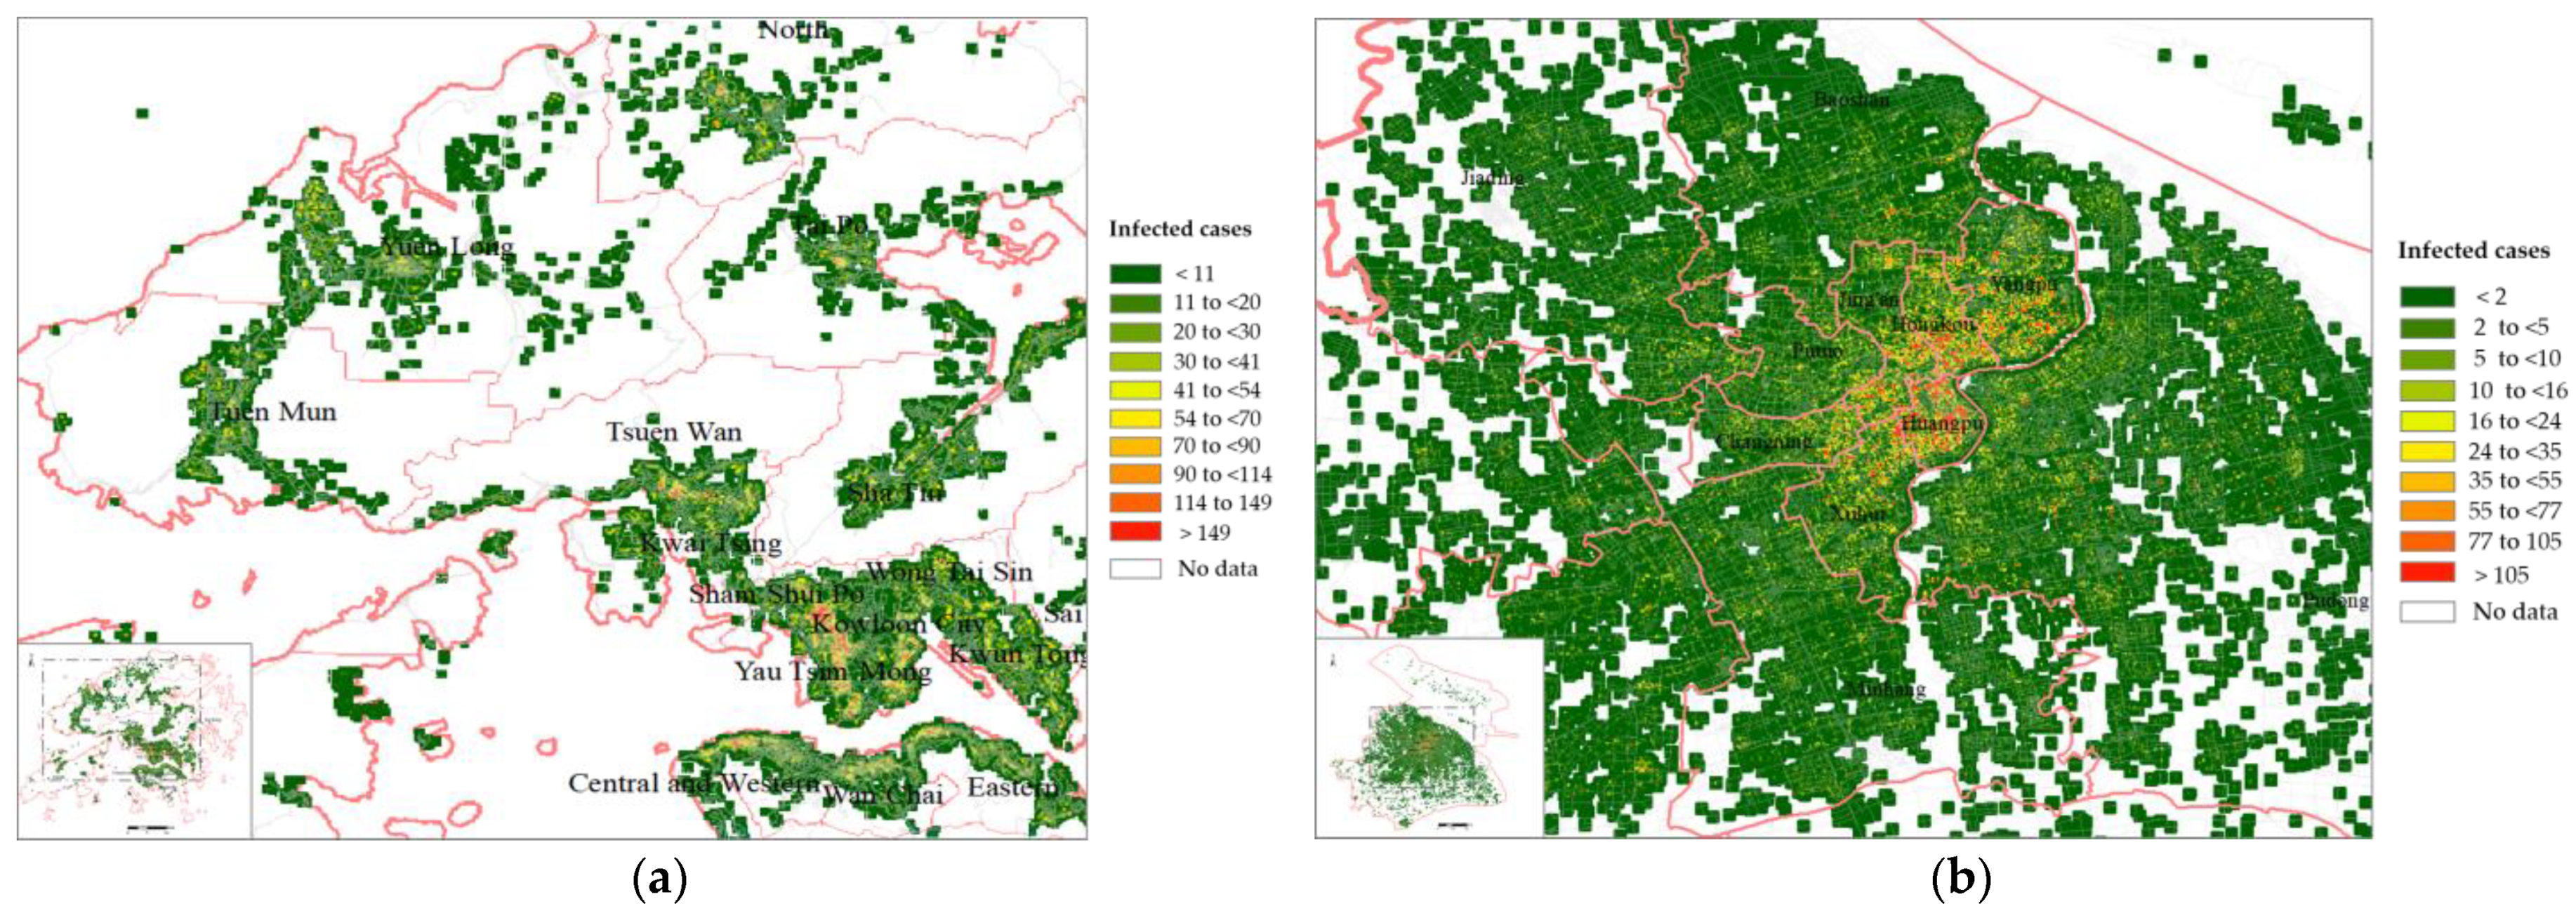
2.2.1. Infection Data
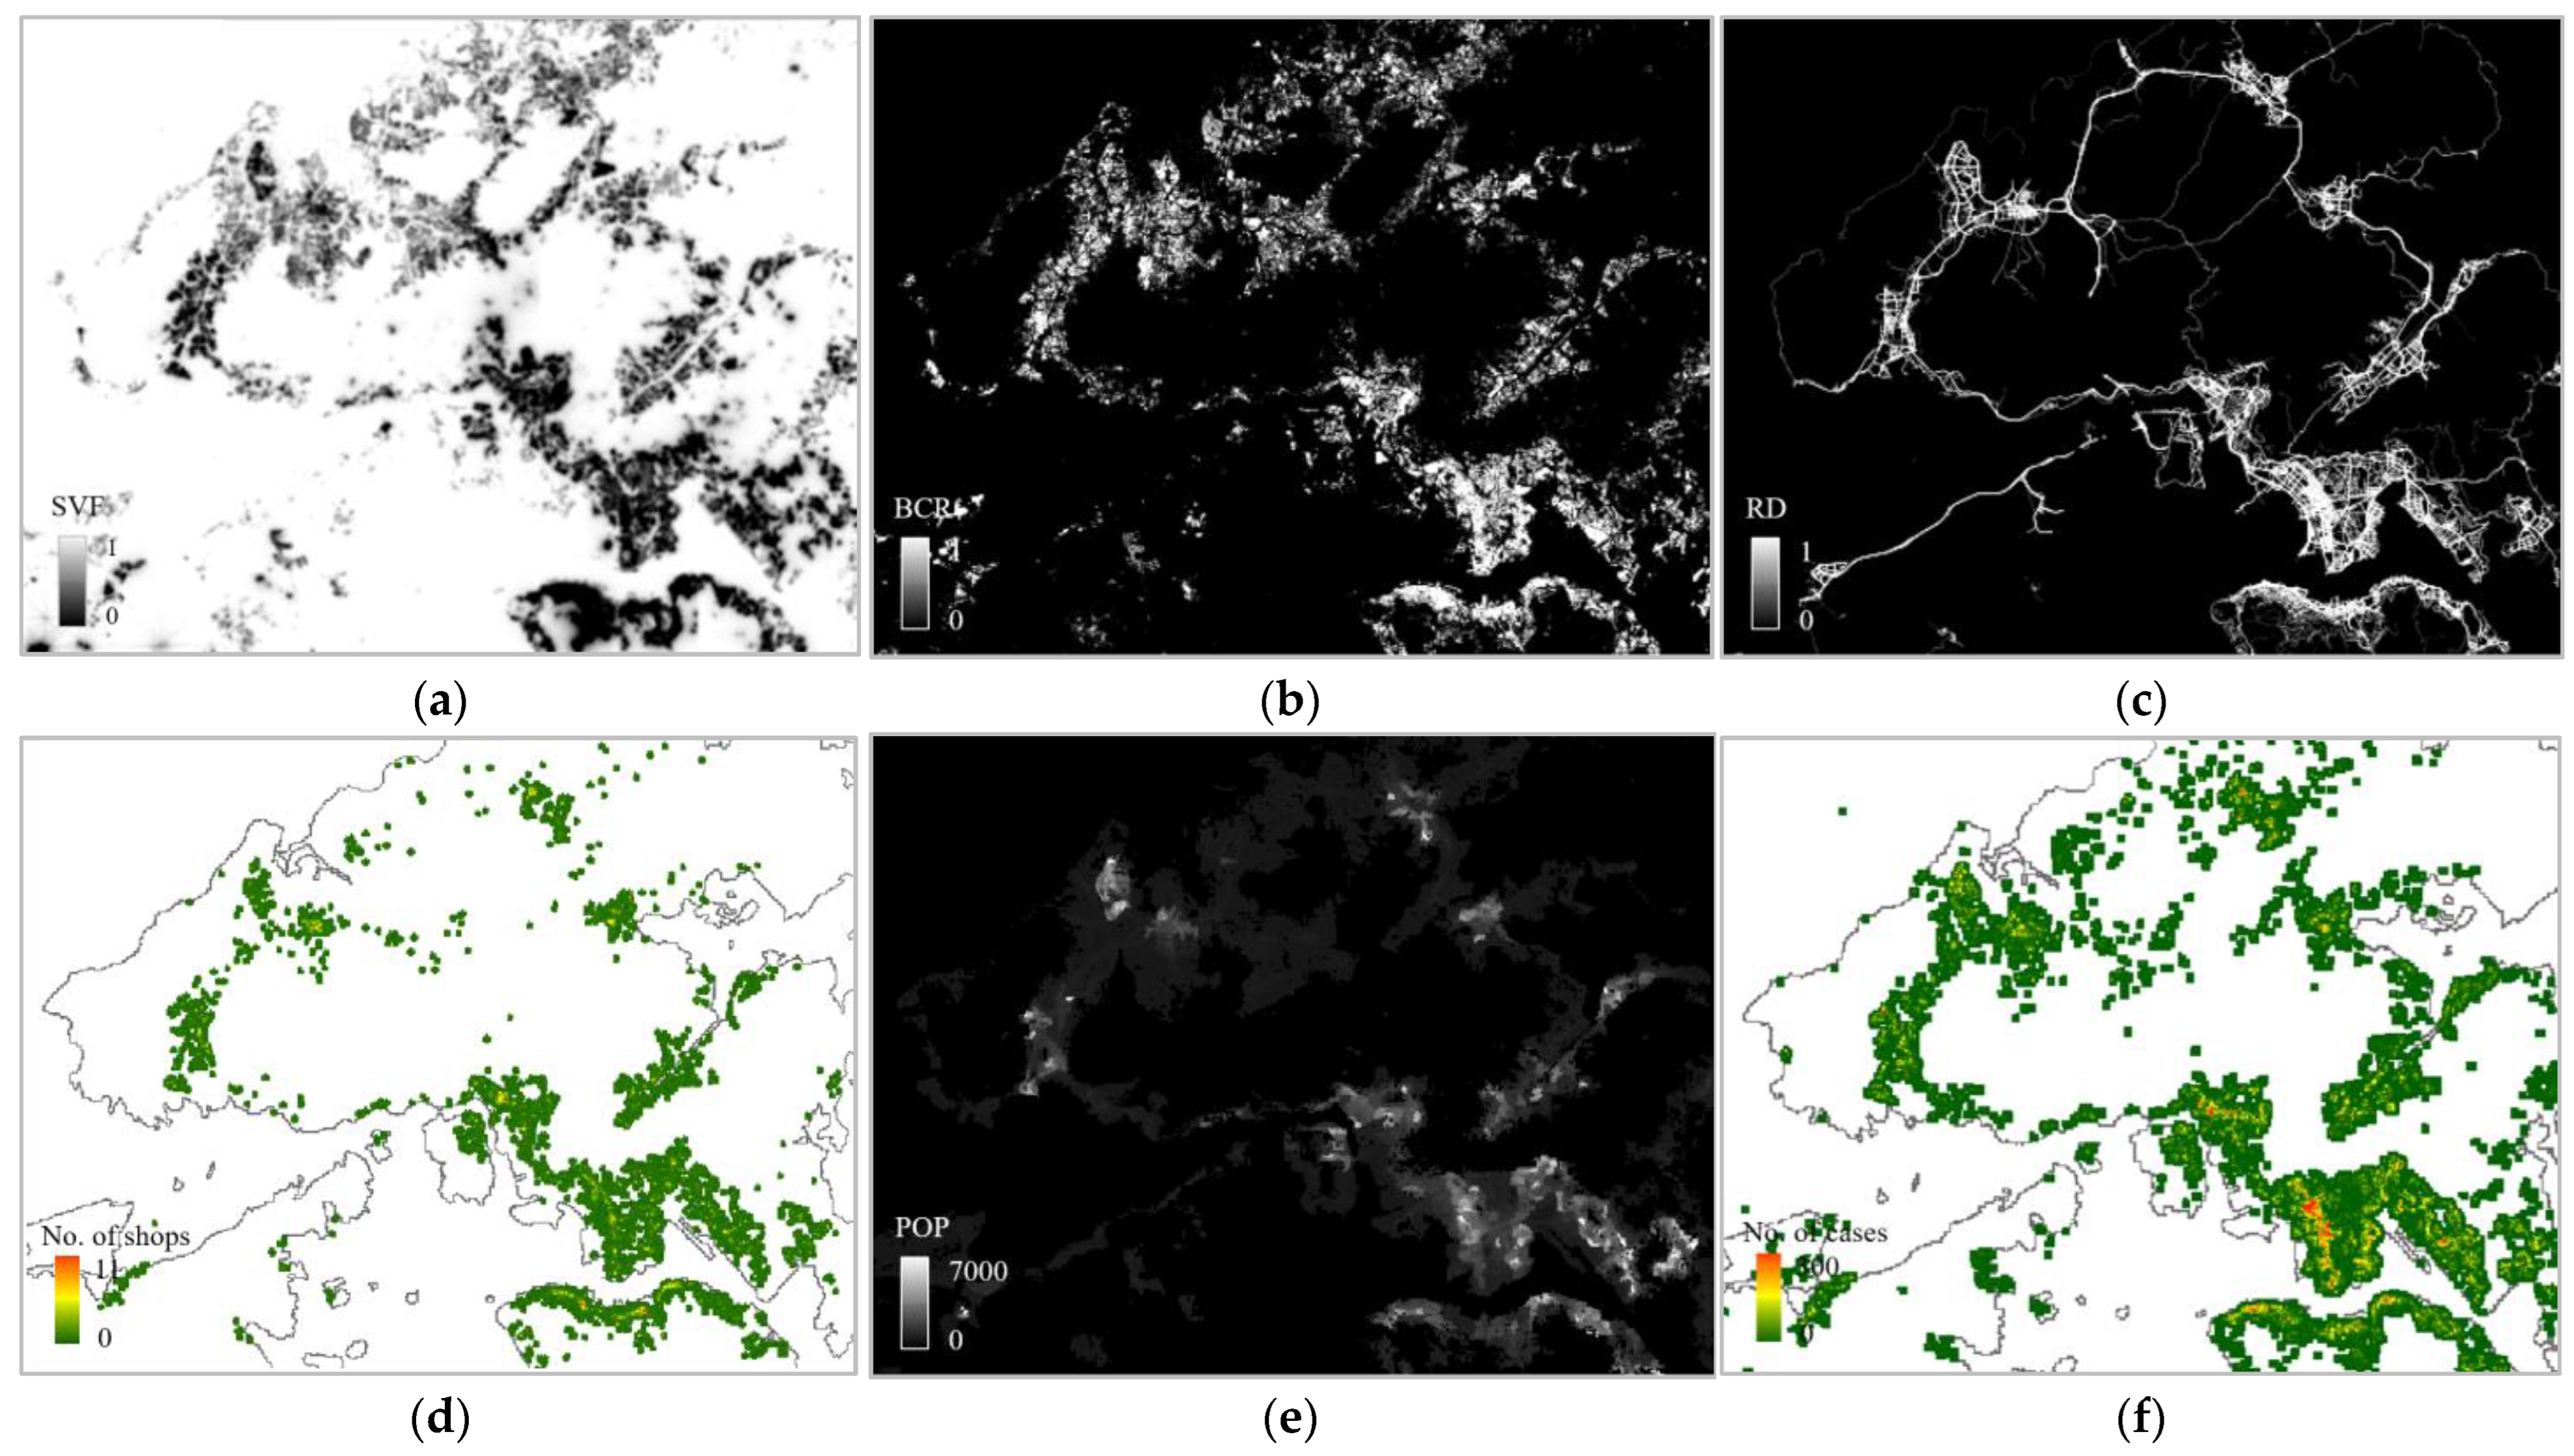
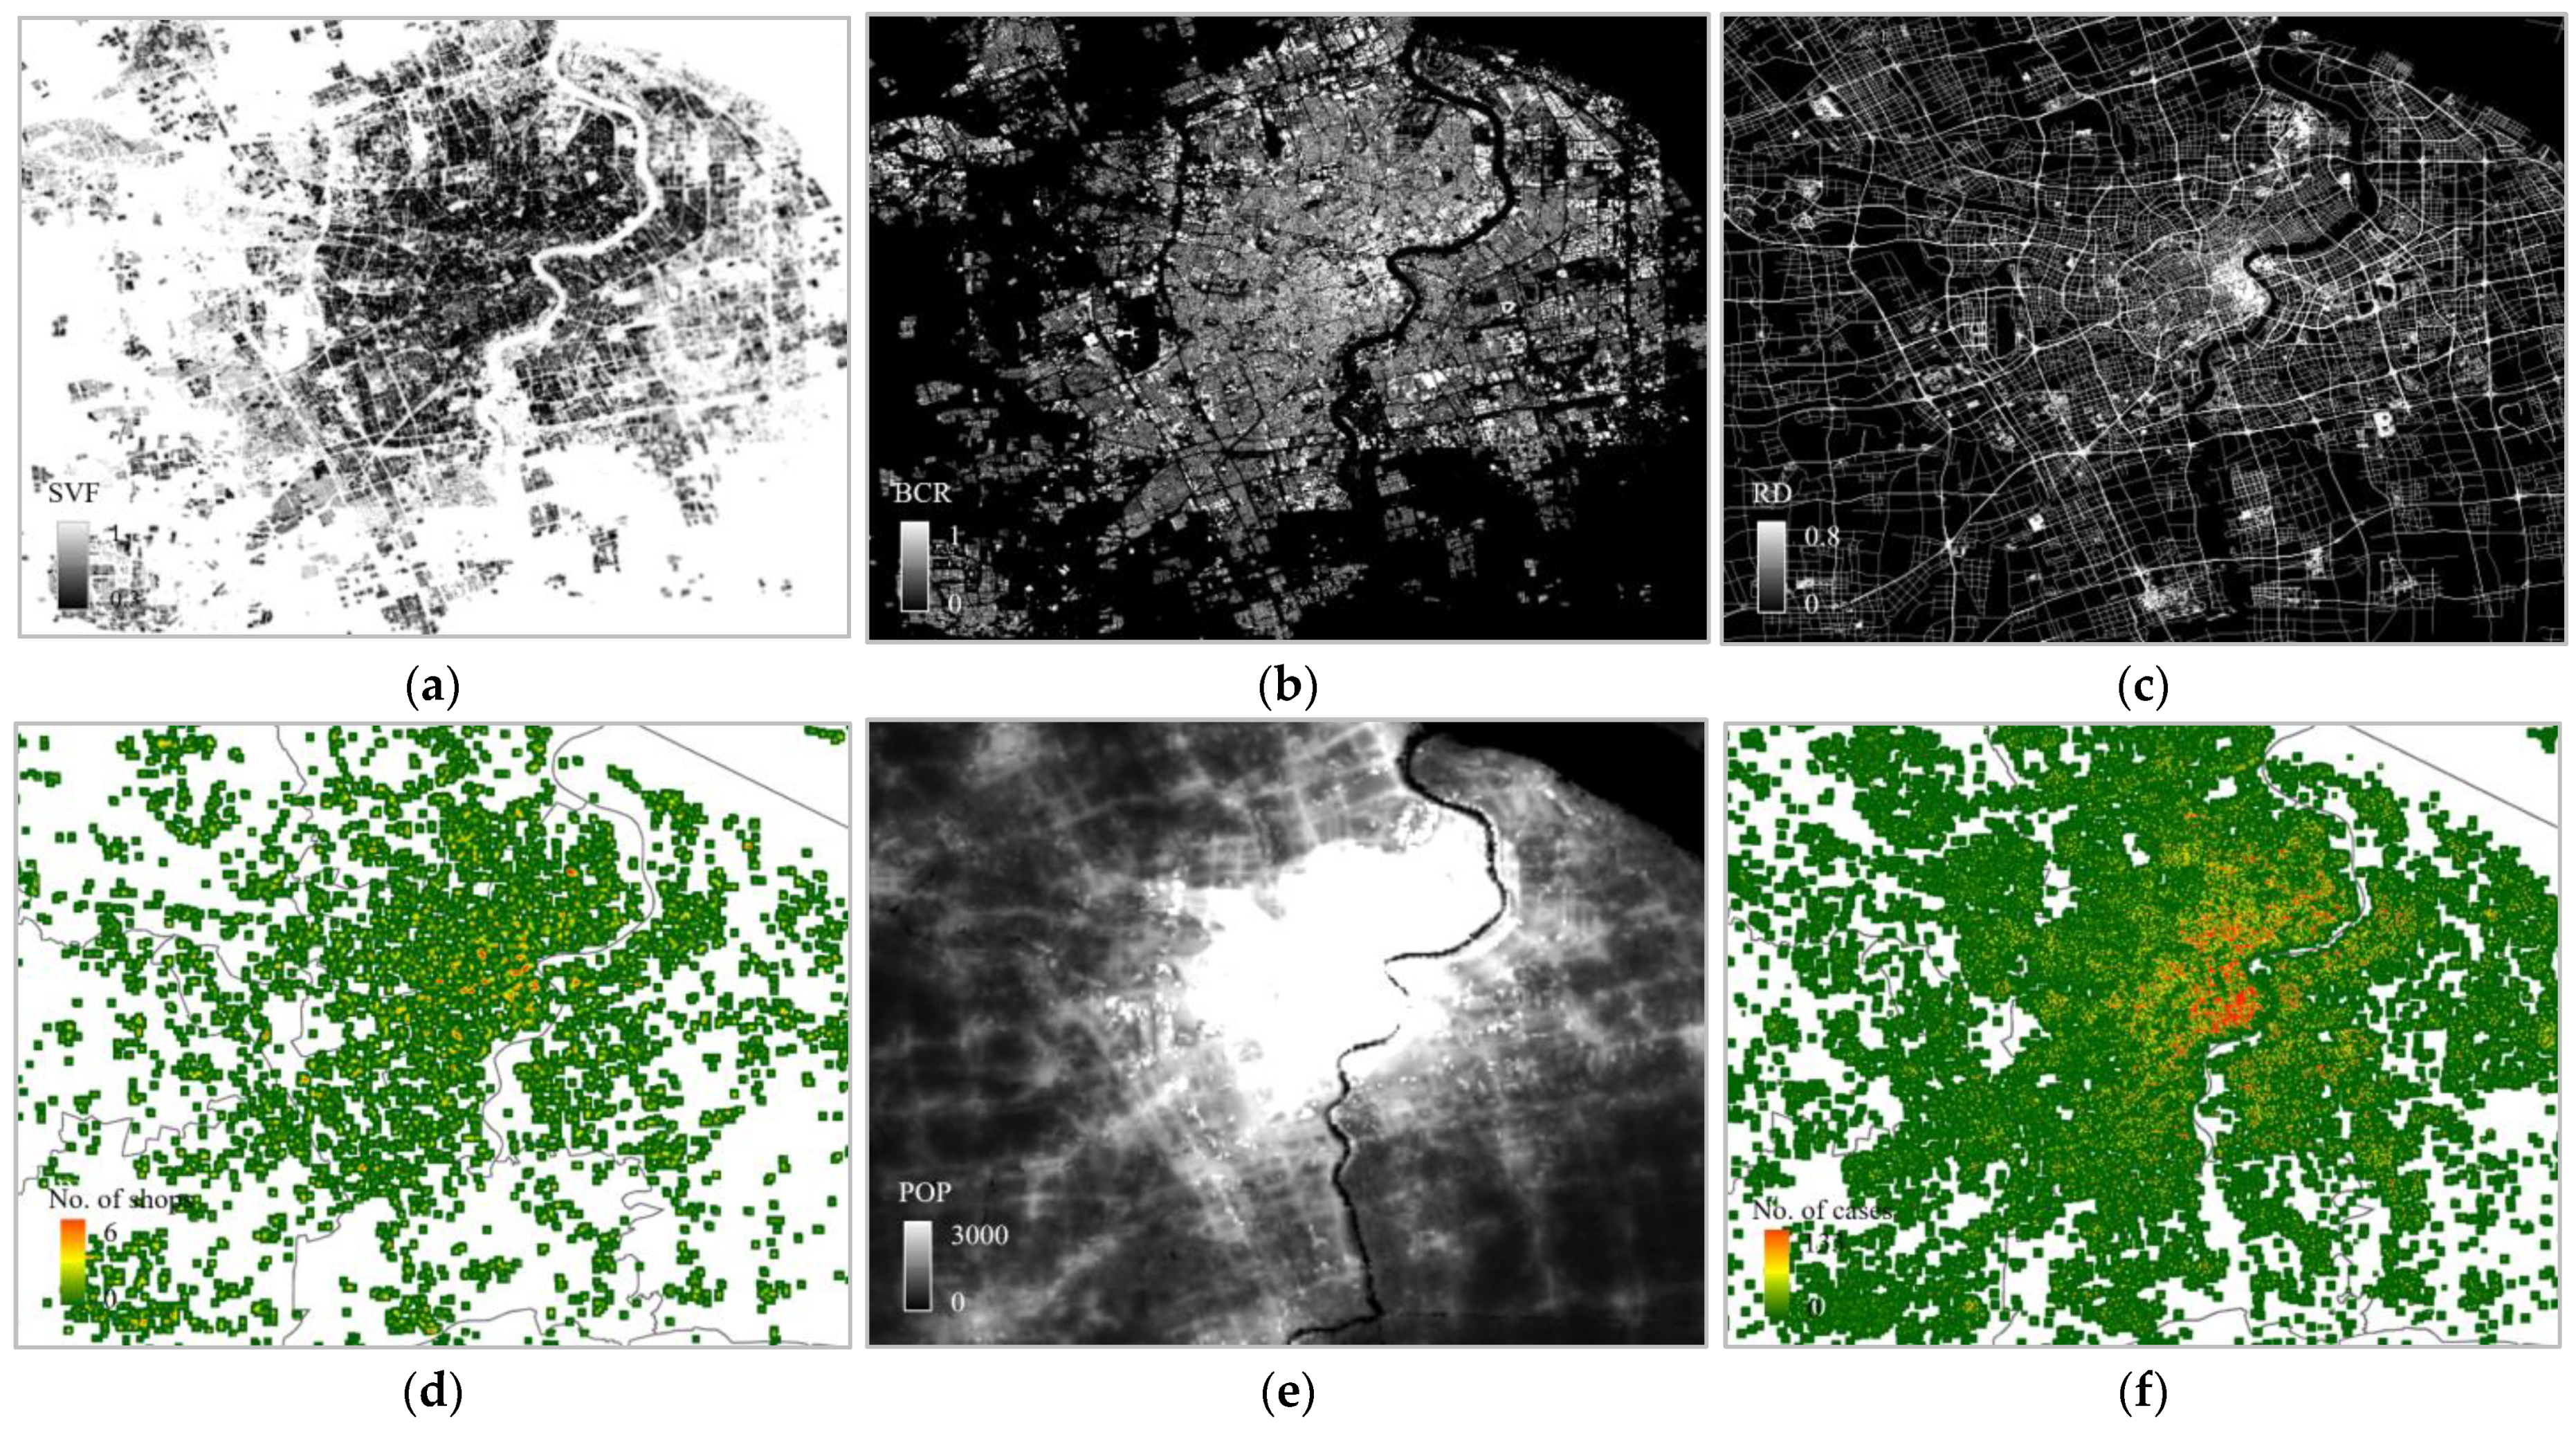
2.2.2. Built-Environment Factors
2.3. Identification of Key Attibutes for Modelling COVID-19 Risk
3. Results
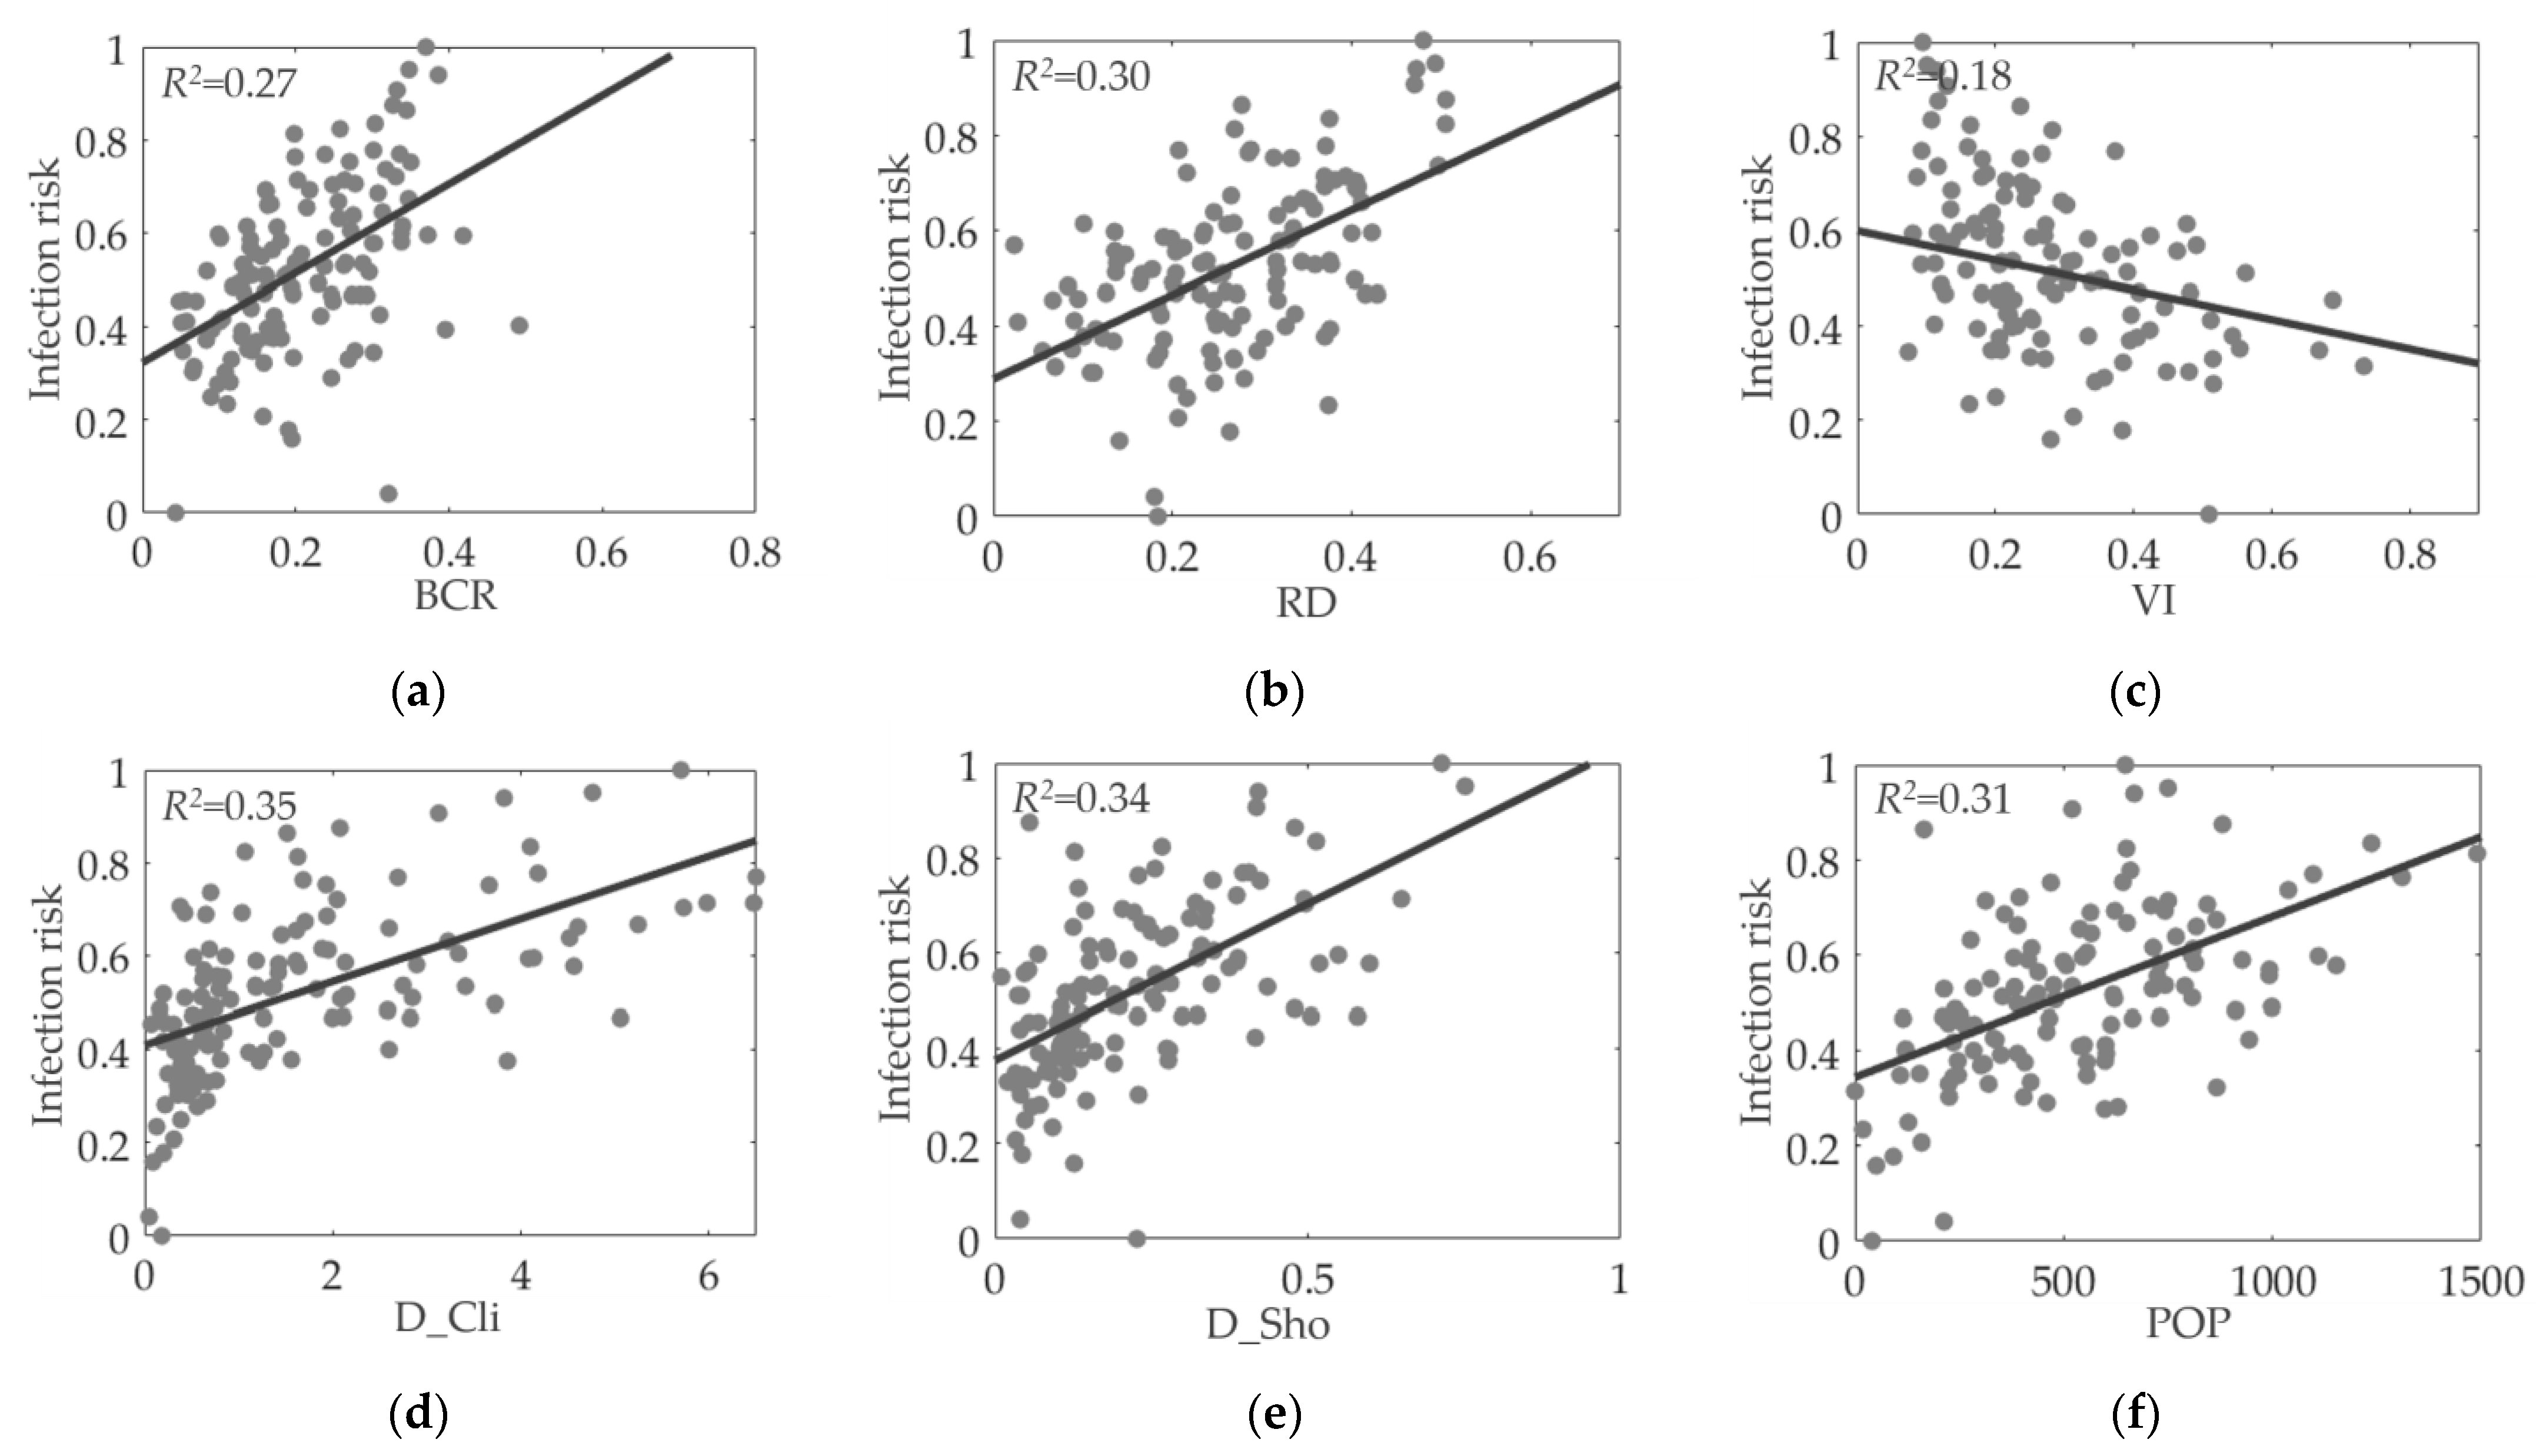
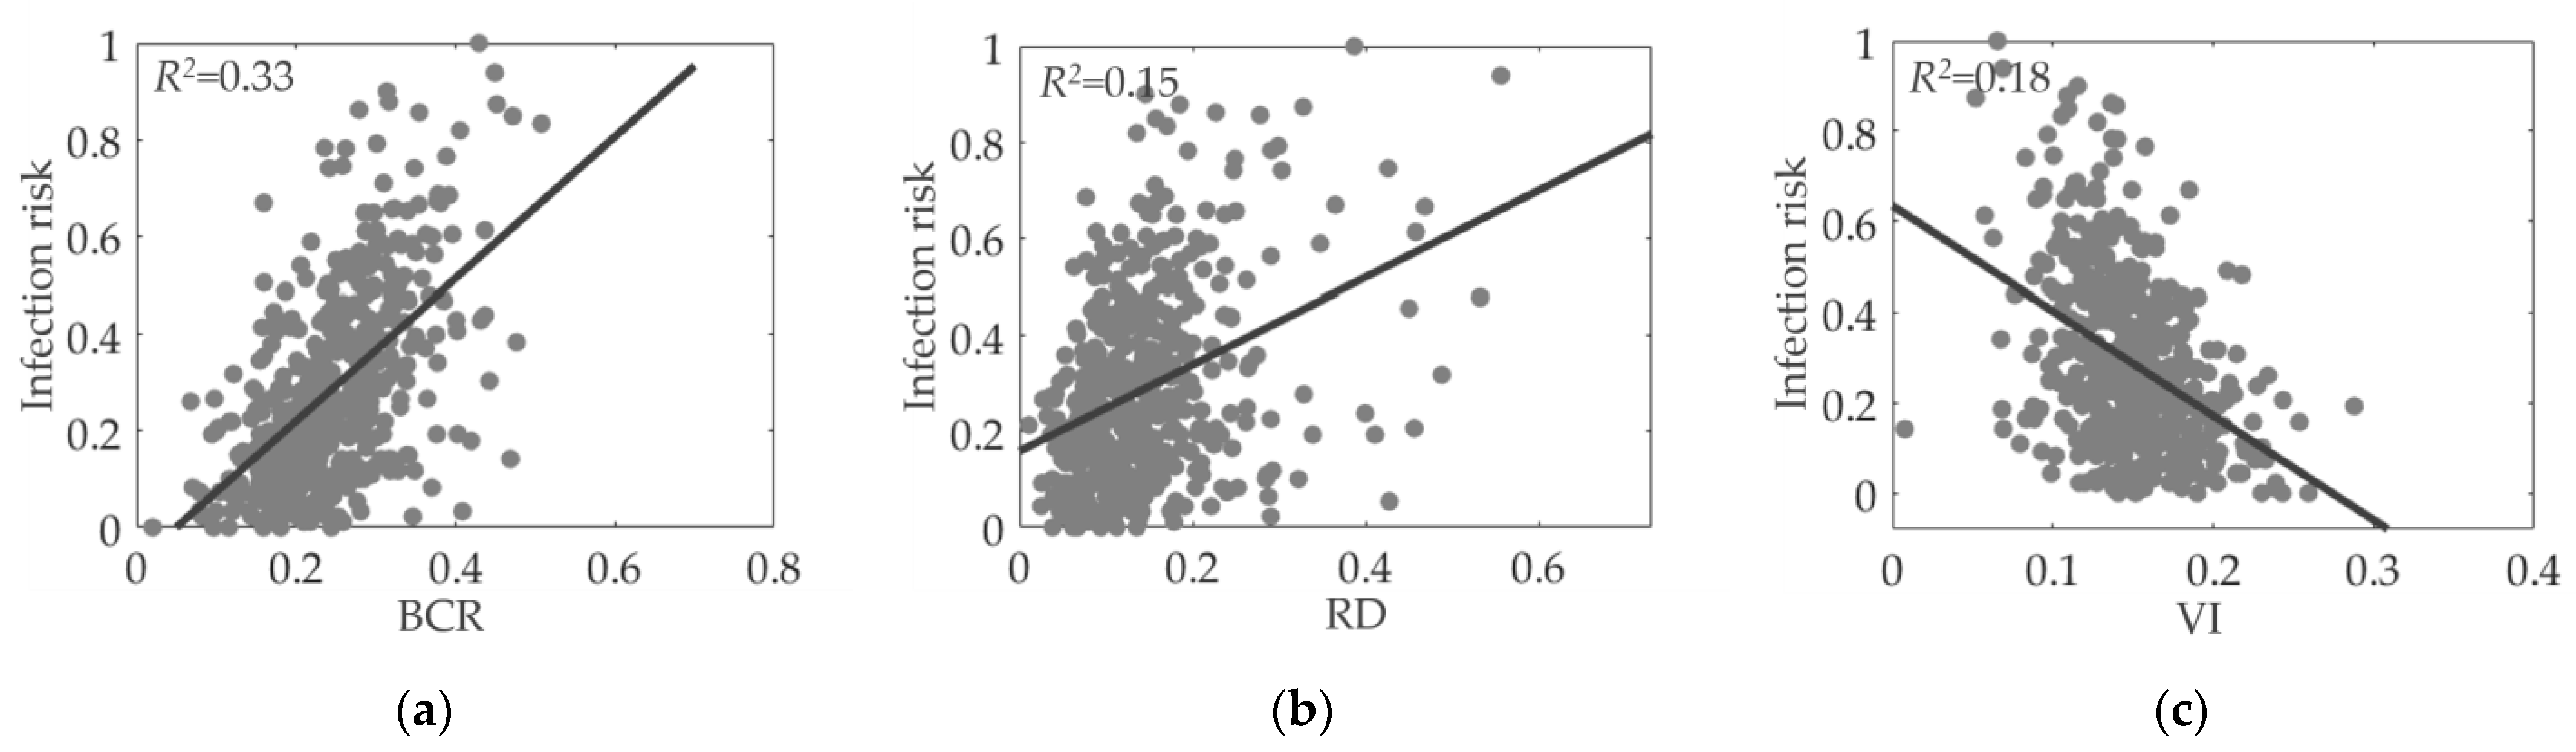
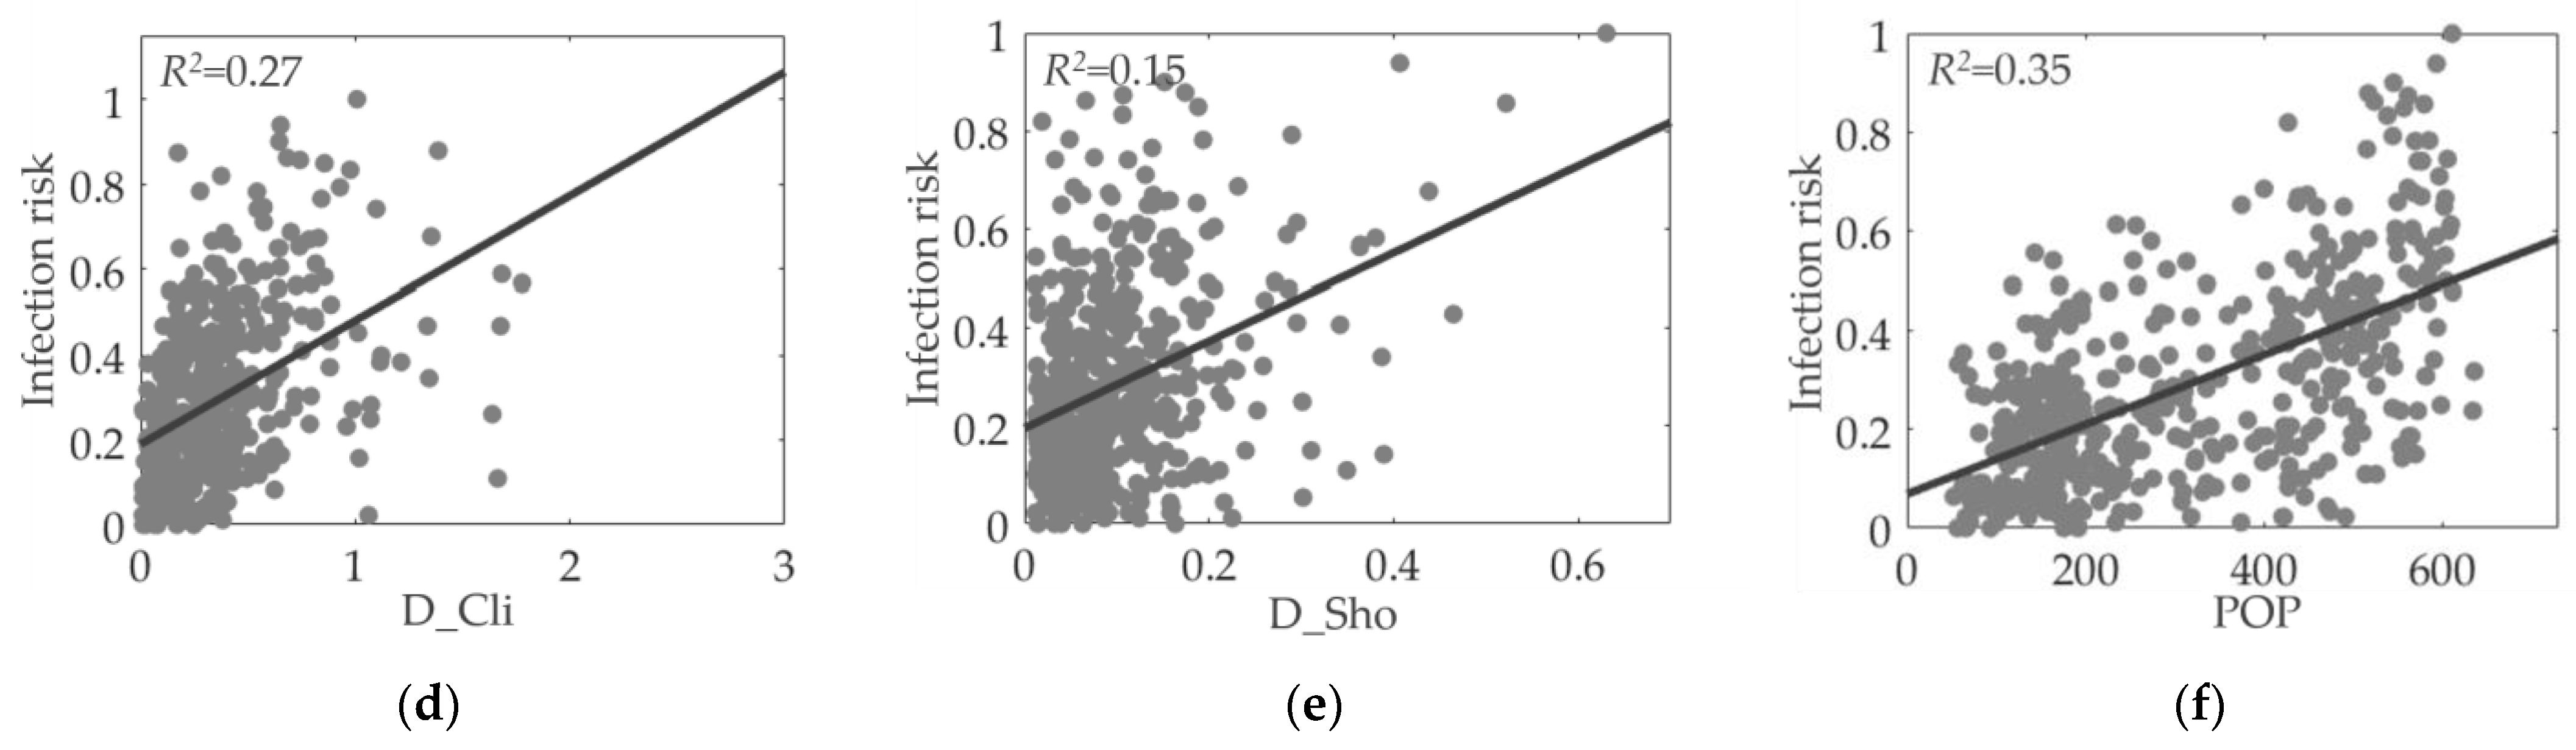
3.1. Association Analysis for Variable Selection
3.2. Regression for Model Construction
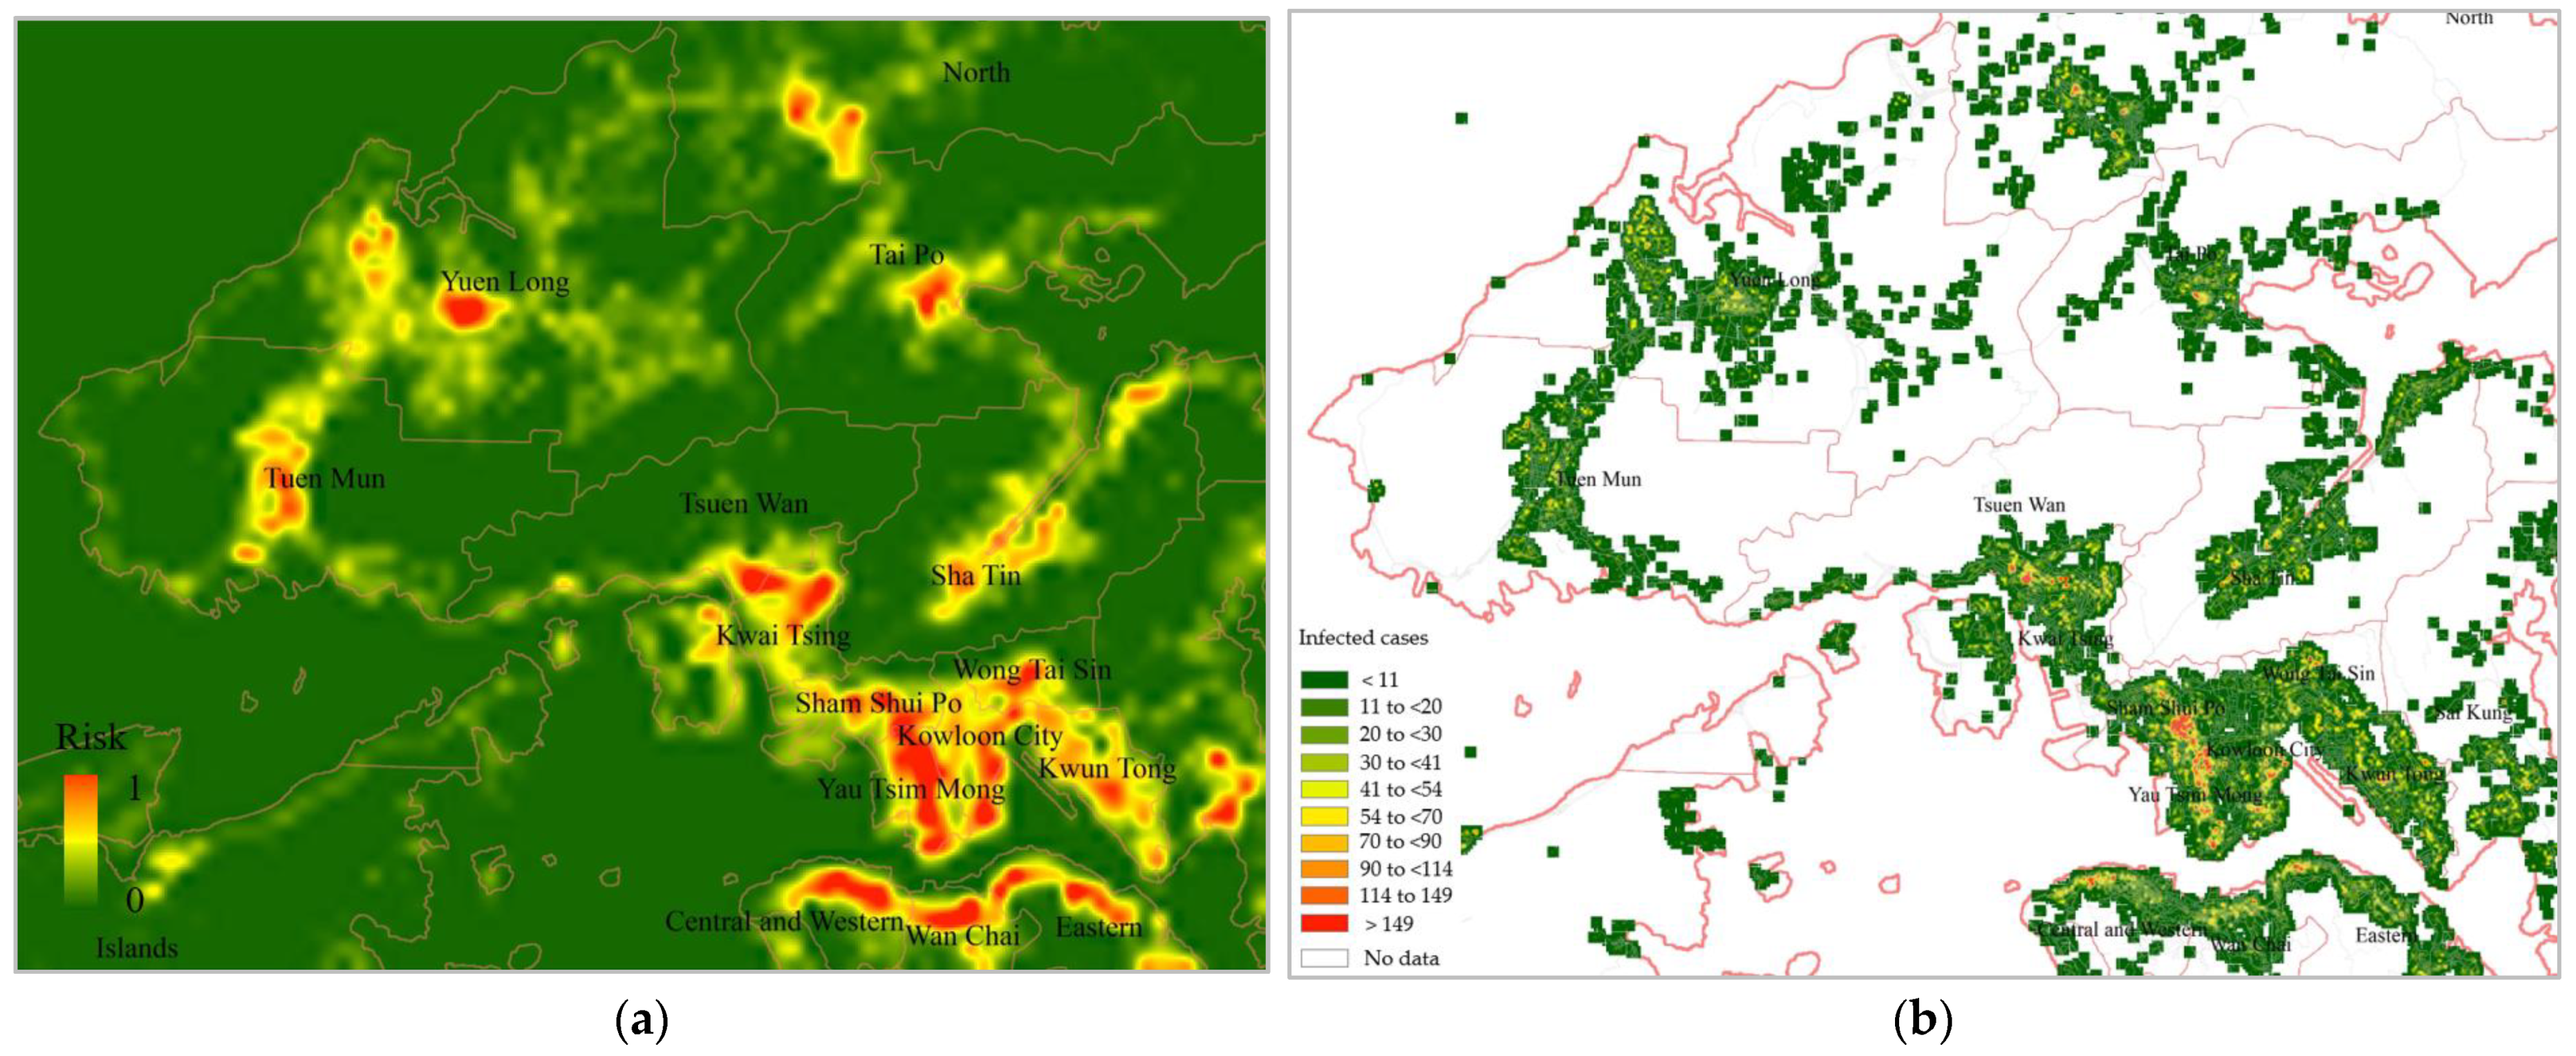
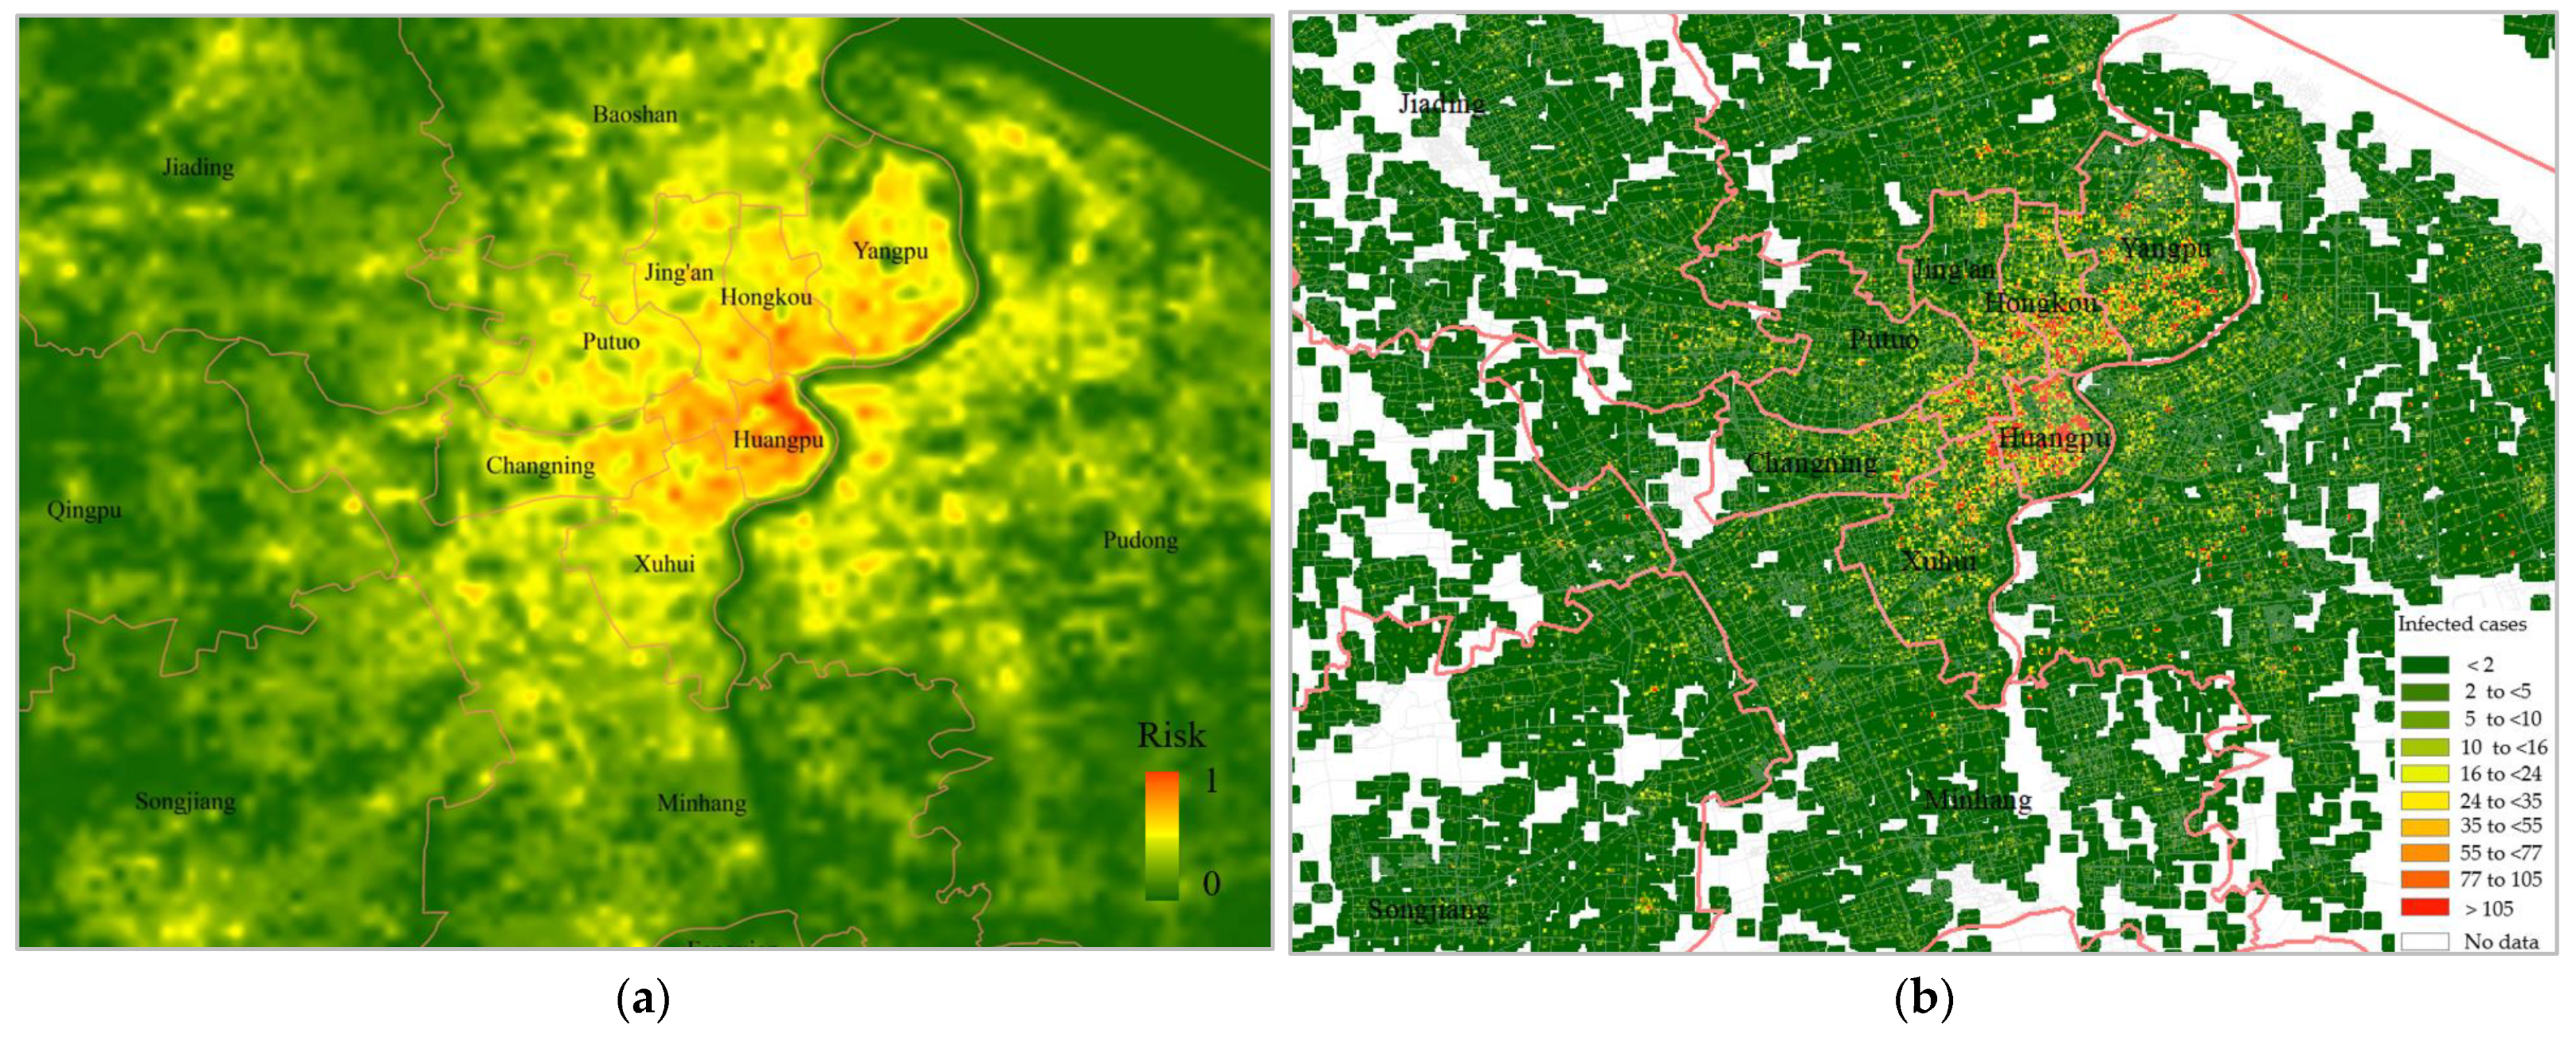
3.3. COVID-19 Risk Mapping
4. Discussion
4.1. Performance of Different Factors
4.2. Scale Effect
4.3. Implications
5. Conclusions
Author Contributions
Funding
Institutional Review Board Statement
Informed Consent Statement
Data Availability Statement
Conflicts of Interest
References
- Petrosillo, N.; Viceconte, G.; Ergonul, O.; Ippolito, G.; Petersen, E. COVID-19, SARS and MERS: Are they closely related? Clin. Microbiol. Infect. 2020, 26, 729–734. [Google Scholar] [CrossRef] [PubMed]
- Chakraborty, I.; Maity, P. COVID-19 outbreak: Migration, effects on society, global environment and prevention. Sci. Total Environ. 2020, 728, 138882. [Google Scholar] [CrossRef] [PubMed]
- Holmes, E.A.; O’Connor, R.C.; Perry, V.H.; Tracey, I.; Wessely, S.; Arseneault, L.; Ballard, C.; Christensen, H.; Cohen Silver, R.; Everall, I.; et al. Multidisciplinary research priorities for the COVID-19 pandemic: A call for action for mental health science. Lancet Psychiatry 2020, 7, 547–560. [Google Scholar] [CrossRef] [PubMed]
- Jayaweera, M.; Perera, H.; Gunawardana, B.; Manatunge, J. Transmission of COVID-19 virus by droplets and aerosols: A critical review on the unresolved dichotomy. Environ. Res. 2020, 188, 109819. [Google Scholar] [CrossRef] [PubMed]
- Lai, S.; Bogoch, I.; Ruktanonchai, N.; Watts, A.; Lu, X.; Yang, W.; Yu, H.; Khan, K.; Tatem, A.J. Assessing spread risk of COVID-19 within and beyond China in early 2020. Data Sci. Manag. 2022, 5, 212–218. [Google Scholar] [CrossRef]
- Klompmaker, J.O.; Hart, J.E.; Holland, I.; Sabath, M.B.; Wu, X.; Laden, F.; Dominici, F.; James, P. County-level exposures to greenness and associations with COVID-19 incidence and mortality in the United States. Environ. Res. 2021, 199, 111331. [Google Scholar] [CrossRef]
- Liu, C.; Liu, Z.; Guan, C. The impacts of the built environment on the incidence rate of COVID-19: A case study of King County, Washington. Sustain. Cities Soc. 2021, 74, 103144. [Google Scholar] [CrossRef] [PubMed]
- Guan, C.; Tan, J.; Hall, B.; Liu, C.; Li, Y.; Cai, Z. The Effect of the Built Environment on the COVID-19 Pandemic at the Initial Stage: A County-Level Study of the USA. Sustainability 2022, 14, 3417. [Google Scholar] [CrossRef]
- Kan, Z.; Kwan, M.P.; Wong, M.S.; Huang, J.; Liu, D. Identifying the space-time patterns of COVID-19 risk and their associations with different built environment features in Hong Kong. Sci. Total Environ. 2021, 772, 145379. [Google Scholar] [CrossRef]
- Bryan, M.S.; Sun, J.; Jagai, J.; Horton, D.E.; Montgomery, A.; Sargis, R.; Argos, M. Coronavirus disease 2019 (COVID-19) mortality and neighborhood characteristics in Chicago. Ann. Epidemiol. 2021, 56, 47–54. [Google Scholar] [CrossRef]
- You, Y.; Pan, S. Urban vegetation slows down the spread of coronavirus disease (COVID-19) in the United States. Geophys. Res. Lett. 2020, 47, e2020GL089286. [Google Scholar] [CrossRef]
- Johnson, T.F.; Hordley, L.A.; Greenwell, M.P.; Evans, L.C. Associations between COVID-19 transmission rates, park use, and landscape structure. Sci. Total Environ. 2021, 789, 148123. [Google Scholar] [CrossRef] [PubMed]
- Coccia, M. Factors determining the diffusion of COVID-19 and suggested strategy to prevent future accelerated viral infectivity similar to COVID. Sci. Total Environ. 2020, 729, 138474. [Google Scholar] [CrossRef] [PubMed]
- Sobral, M.F.F.; Duarte, G.B.; da Penha Sobral, A.I.G.; Marinho, M.L.M.; de Souza Melo, A. Association between climate variables and global transmission of SARS-CoV-2. Sci. Total Environ. 2020, 729, 138997. [Google Scholar] [CrossRef]
- Yip, T.L.; Huang, Y.; Liang, C. Built environment and the metropolitan pandemic: Analysis of the COVID-19 spread in Hong Kong. Build. Environ. 2021, 188, 107471. [Google Scholar] [CrossRef]
- Alidadi, M.; Sharifi, A. Effects of the built environment and human factors on the spread of COVID-19: A systematic literature review. Sci. Total Environ. 2022, 850, 158056. [Google Scholar] [CrossRef]
- Wang, J.; Wu, X.; Wang, R.; He, D.; Li, D.; Yang, L.; Yang, Y.; Lu, Y. Review of associations between built environment characteristics and severe acute respiratory syndrome coronavirus 2 infection risk. Int. J. Environ. Res. Public Health 2021, 18, 7561. [Google Scholar] [CrossRef]
- Tong, H.; Li, M.; Kang, J. Relationships between building attributes and COVID-19 infection in London. Build. Environ. 2022, 225, 109581. [Google Scholar] [CrossRef]
- Hamidi, S.; Sabouri, S.; Ewing, R. Does density aggravate the COVID-19 pandemic? Early findings and lessons for planners. J. Am. Plan. Assoc. 2020, 86, 495–509. [Google Scholar] [CrossRef]
- Hu, T.; Yue, H.; Wang, C.; She, B.; Ye, X.; Liu, R.; Zhu, X.; Guan, W.W.; Bao, S. Racial segregation, testing site access, and COVID-19 incidence rate in Massachusetts, USA. Int. J. Environ. Res. Public Health 2020, 17, 9528. [Google Scholar] [CrossRef]
- Raifman, M.A.; Raifman, J.R. Disparities in the population at risk of severe illness from COVID-19 by race/ethnicity and income. Am. J. Prev. Med. 2020, 59, 137–139. [Google Scholar] [CrossRef] [PubMed]
- Kwok, C.Y.T.; Wong, M.S.; Chan, K.L.; Kwan, M.P.; Nichol, J.E.; Liu, C.H.; Wong, J.Y.H.; Wai, A.K.C.; Chan, L.W.C.; Xu, Y.; et al. Spatial analysis of the impact of urban geometry and socio-demographic characteristics on COVID-19, a study in Hong Kong. Sci. Total Environ. 2021, 764, 144455. [Google Scholar] [CrossRef]
- Nasiri, R.; Akbarpour, S.; Zali, A.R.; Khodakarami, N.; Boochani, M.H.; Noory, A.R.; Soori, H. Spatio-temporal analysis of COVID-19 incidence rate using GIS: A case study—Tehran metropolitan, Iran. GeoJournal 2022, 87, 3291–3305. [Google Scholar] [CrossRef]
- Bashir, M.F.; Ma, B.; Komal, B.; Bashir, M.A.; Tan, D.; Bashir, M. Correlation between climate indicators and COVID-19 pandemic in New York, USA. Sci. Total Environ. 2020, 728, 138835. [Google Scholar] [CrossRef] [PubMed]
- Wang, J.; Tang, K.; Feng, K.; Lin, X.; Lv, W.; Chen, K.; Wang, F. Impact of temperature and relative humidity on the transmission of COVID-19: A modelling study in China and the United States. BMJ Open 2021, 11, e043863. [Google Scholar] [CrossRef] [PubMed]
- Spotswood, E.N.; Benjamin, M.; Stoneburner, L.; Wheeler, M.M.; Beller, E.E.; Balk, D.; McPhearson, T.; Kuo, M.; McDonald, R.I. Nature inequity and higher COVID-19 case rates in less-green neighbourhoods in the United States. Nat. Sustain. 2021, 4, 1092–1098. [Google Scholar] [CrossRef]
- Bhadra, A.; Mukherjee, A.; Sarkar, K. Impact of population density on COVID-19 infected and mortality rate in India. Model. Earth Syst. Environ. 2021, 7, 623–629. [Google Scholar] [CrossRef]
- Huang, J.; Kwan, M.P.; Kan, Z.; Wong, M.S.; Kwok, C.Y.T.; Yu, X. Investigating the relationship between the built environment and relative risk of COVID-19 in Hong Kong. ISPRS Int. J. Geo-Inf. 2020, 9, 624. [Google Scholar] [CrossRef]
- Niu, Q.; Wu, W.; Shen, J.; Huang, J.; Zhou, Q. Relationship between Built Environment and COVID-19 Dispersal Based on Age Stratification: A Case Study of Wuhan. Int. J. Environ. Res. Public Health 2021, 18, 7563. [Google Scholar] [CrossRef]
- Huang, J.; Jones, P.; Zhang, A.; Hou, S.S.; Hang, J.; Spengler, J.D. Outdoor airborne transmission of coronavirus among apartments in high-density cities. Front. Built Environ. 2021, 7, 48. [Google Scholar] [CrossRef]
- Burridge, H.C.; Bhagat, R.K.; Stettler, M.E.; Kumar, P.; De Mel, I.; Demis, P.; Hart, A.; Johnson-Llambias, Y.; King, M.-F.; Klymenko, O.; et al. The ventilation of buildings and other mitigating measures for COVID-19: A focus on wintertime. Proc. R. Soc. A 2021, 477, 20200855. [Google Scholar] [CrossRef] [PubMed]
- Ng, E.; Yuan, C.; Chen, L.; Ren, C.; Fung, J.C. Improving the wind environment in high-density cities by understanding urban morphology and surface roughness: A study in Hong Kong. Landsc. Urban Plan. 2011, 101, 59–74. [Google Scholar] [CrossRef] [PubMed]
- Chan, A.T.; So, E.S.; Samad, S.C. Strategic guidelines for street canyon geometry to achieve sustainable street air quality. Atmos. Environ. 2001, 35, 4089–4098. [Google Scholar] [CrossRef]
- Li, C.; Wang, Z.; Li, B.; Peng, Z.R.; Fu, Q. Investigating the relationship between air pollution variation and urban form. Build. Environ. 2019, 147, 559–568. [Google Scholar] [CrossRef]
- Terahara, F.; Nishiura, H. Fluoroquinolone consumption and Escherichia coli resistance in Japan: An ecological study. BMC Public Health 2019, 19, 426. [Google Scholar] [CrossRef]
- Sharifi, A.; Khavarian-Garmsir, A.R. The COVID-19 pandemic: Impacts on cities and major lessons for urban planning, design, and management. Sci. Total Environ. 2020, 749, 142391. [Google Scholar] [CrossRef] [PubMed]
- Uddin, S.; Lu, H.; Khan, A.; Karim, S.; Zhou, F. Comparing the Impact of Road Networks on COVID-19 Severity between Delta and Omicron Variants: A Study Based on Greater Sydney (Australia) Suburbs. Int. J. Environ. Res. Public Health 2022, 19, 6551. [Google Scholar] [CrossRef] [PubMed]


| Variable | Median (IQR) | |
|---|---|---|
| Hong Kong | Shanghai | |
| Amount of sky that can be seen from the ground (SVF) | 0.54 (0.43–0.65) | 0.68 (0.61–0.75) |
| Ratio of a building’s floor area to the site area (in which the building is located) (FAR) | 10.20 (7.52–14.90) | 4.65 (3.42–5.82) |
| Density of a building’s frontal area to the site area (FAD) | 0.36 (0.26–0.49) | 0.17 (0.11–0.23) |
| Ratio of the average building height to the width of the street abutting the building (HW) | 3.52 (2.58–4.79 | 1.57 (1.23–1.89) |
| Ratio of the building coverage area to the site area (BCR) | 0.20 (0.14–0.28) | 0.24 (0.19–0.29) |
| Ratio of the road area to the site area (RD) | 0.26 (0.19–0.35) | 0.13 (0.09–0.17) |
| Number of restaurants in a site area (D_Res) | 1.23 (0.59–2.49) | 1.05 (0.53–1.73) |
| Number of bus stations in a site area (D_Bus) | 0.62 (0.37–0.84) | 0.72 (0.39–1.40) |
| Number of clinics in a site area (D_Cli) | 1.14 (0.52–2.14) | 0.25 (0.12–0.43) |
| Number of shops in a site area (D_Sho) | 0.19 (0.10–0.32) | 0.09 (0.05–0.13) |
| Ratio of the vegetation area to the site area (VI) | 0.23 (0.16–0.34) | 0.15 (0.13–0.17) |
| Nightlight intensity in a site area (NL) | 72.27 (52.17–87.05) | 37.08 (31.66–43.97) |
| Population of a site area (POP) | 502.9 (301.8–724.4) | 268.1 (161.6–470.7) |
| Variable | Hong Kong | Shanghai | ||
|---|---|---|---|---|
| Kendall’s Tau-b | Spearman | Kendall’s Tau-b | Spearman | |
| Sky view (SVF) | −0.38 ** | −0.54 ** | −0.45 ** | −0.64 ** |
| Floor area (FAR) | 0.30 ** | 0.42 ** | 0.42 ** | 0.59 ** |
| Frontal area (FAD) | 0.37 ** | 0.52 ** | 0.43 ** | 0.60 ** |
| Height to width (HW) | 0.03 | 0.05 | 0.22 ** | 0.32 ** |
| Building coverage (BCR) | 0.37 ** | 0.53 ** | 0.49 ** | 0.67 ** |
| Road (RD) | 0.36 ** | 0.52 ** | 0.22 ** | 0.31 ** |
| Restaurant (D_Res) | 0.47 ** | 0.54 ** | 0.35 ** | 0.49 ** |
| Bus (D_Bus) | 0.36 ** | 0.52 ** | 0.36 ** | 0.51 ** |
| Clinic (D_Cli) | 0.48 ** | 0.65 ** | 0.43 ** | 0.60 ** |
| Shop (D_Sho) | 0.44 ** | 0.61 ** | 0.25 ** | 0.36 ** |
| Green space (VI) | −0.26 ** | −0.37 ** | −0.32 ** | −0.44 ** |
| Nightlight (NL) | 0.14 * | 0.23 * | 0.22 ** | 0.31 ** |
| Population (POP) | 0.41 ** | 0.57 ** | 0.46 ** | 0.64 ** |
| Factor | Hong Kong | Shanghai | ||||
|---|---|---|---|---|---|---|
| Unstandardized | Standardized | p-Value | Unstandardized | Standardized | p-Value | |
| Constant | 0.31 | 0.00 | −0.02 | 0.43 | ||
| BCR | 0.86 | 0.27 | 0.00 | |||
| RD | 0.67 | 0.29 | 0.00 | 0.30 | 0.10 | 0.00 |
| D_Cli | 0.03 | 0.18 | 0.04 | 0.13 | 0.18 | 0.00 |
| D_Sho | 0.31 | 0.20 | 0.02 | 0.29 | 0.09 | 0.01 |
| POP | 0.003 | 0.40 | 0.00 | 0.001 | 0.30 | 0.00 |
| Variable | Standardized Coefficients | |||||
|---|---|---|---|---|---|---|
| Hong Kong | Shanghai | |||||
| 200 m × 200 m | 400 m × 400 m | 600 m × 600 m | 300 m × 300 m | 600 m × 600 m | 900 m × 900 m | |
| SVF | −0.28 ** | - | - | −0.56 ** | - | - |
| FAR | −0.18 ** | - | - | −0.50 ** | - | - |
| FAD | - | - | - | 0.30 ** | - | - |
| HW | - | - | - | −0.16 ** | −0.09 * | - |
| BCR | - | 0.21 ** | 0.30 ** | 0.30 ** | 0.23 ** | |
| RD | 0.18 ** | 0.26 ** | - | 0.15 ** | 0.10 ** | - |
| D_Res | - | - | - | 0.10 ** | - | - |
| D_Bus | - | - | - | - | - | - |
| D_Cli | 0.23 ** | - | - | 0.06 * | 0.23 ** | 0.35 ** |
| D_Sho | 0.13 ** | 0.29 ** | 0.39 ** | - | - | - |
| VI | - | - | - | −0.08 ** | - | - |
| NL | 0.08 * | - | - | - | - | - |
| POP | 0.19 ** | 0.32 ** | 0.35 ** | 0.24 ** | 0.36 ** | 0.39 ** |
| R2 = 0.31 | R2 = 0.51 | R2 = 0.65 | R2 = 0.43 | R2 = 0.58 | R2 = 0.69 | |
Disclaimer/Publisher’s Note: The statements, opinions and data contained in all publications are solely those of the individual author(s) and contributor(s) and not of MDPI and/or the editor(s). MDPI and/or the editor(s) disclaim responsibility for any injury to people or property resulting from any ideas, methods, instructions or products referred to in the content. |
© 2023 by the authors. Licensee MDPI, Basel, Switzerland. This article is an open access article distributed under the terms and conditions of the Creative Commons Attribution (CC BY) license (https://creativecommons.org/licenses/by/4.0/).
Share and Cite
Xu, Y.; Guo, C.; Yang, J.; Yuan, Z.; Ho, H.C. Modelling Impact of High-Rise, High-Density Built Environment on COVID-19 Risks: Empirical Results from a Case Study of Two Chinese Cities. Int. J. Environ. Res. Public Health 2023, 20, 1422. https://doi.org/10.3390/ijerph20021422
Xu Y, Guo C, Yang J, Yuan Z, Ho HC. Modelling Impact of High-Rise, High-Density Built Environment on COVID-19 Risks: Empirical Results from a Case Study of Two Chinese Cities. International Journal of Environmental Research and Public Health. 2023; 20(2):1422. https://doi.org/10.3390/ijerph20021422
Chicago/Turabian StyleXu, Yong, Chunlan Guo, Jinxin Yang, Zhenjie Yuan, and Hung Chak Ho. 2023. "Modelling Impact of High-Rise, High-Density Built Environment on COVID-19 Risks: Empirical Results from a Case Study of Two Chinese Cities" International Journal of Environmental Research and Public Health 20, no. 2: 1422. https://doi.org/10.3390/ijerph20021422
APA StyleXu, Y., Guo, C., Yang, J., Yuan, Z., & Ho, H. C. (2023). Modelling Impact of High-Rise, High-Density Built Environment on COVID-19 Risks: Empirical Results from a Case Study of Two Chinese Cities. International Journal of Environmental Research and Public Health, 20(2), 1422. https://doi.org/10.3390/ijerph20021422