

Breast and Colorectal Cancer Screening Utilization after Hurricane María and the COVID-19 Pandemic in Puerto Rico
 , , ,
, , ,
Abstract
:1. Introduction
2. Materials and Methods
2.1. Data Source and Population
2.2. Data Analysis
3. Results
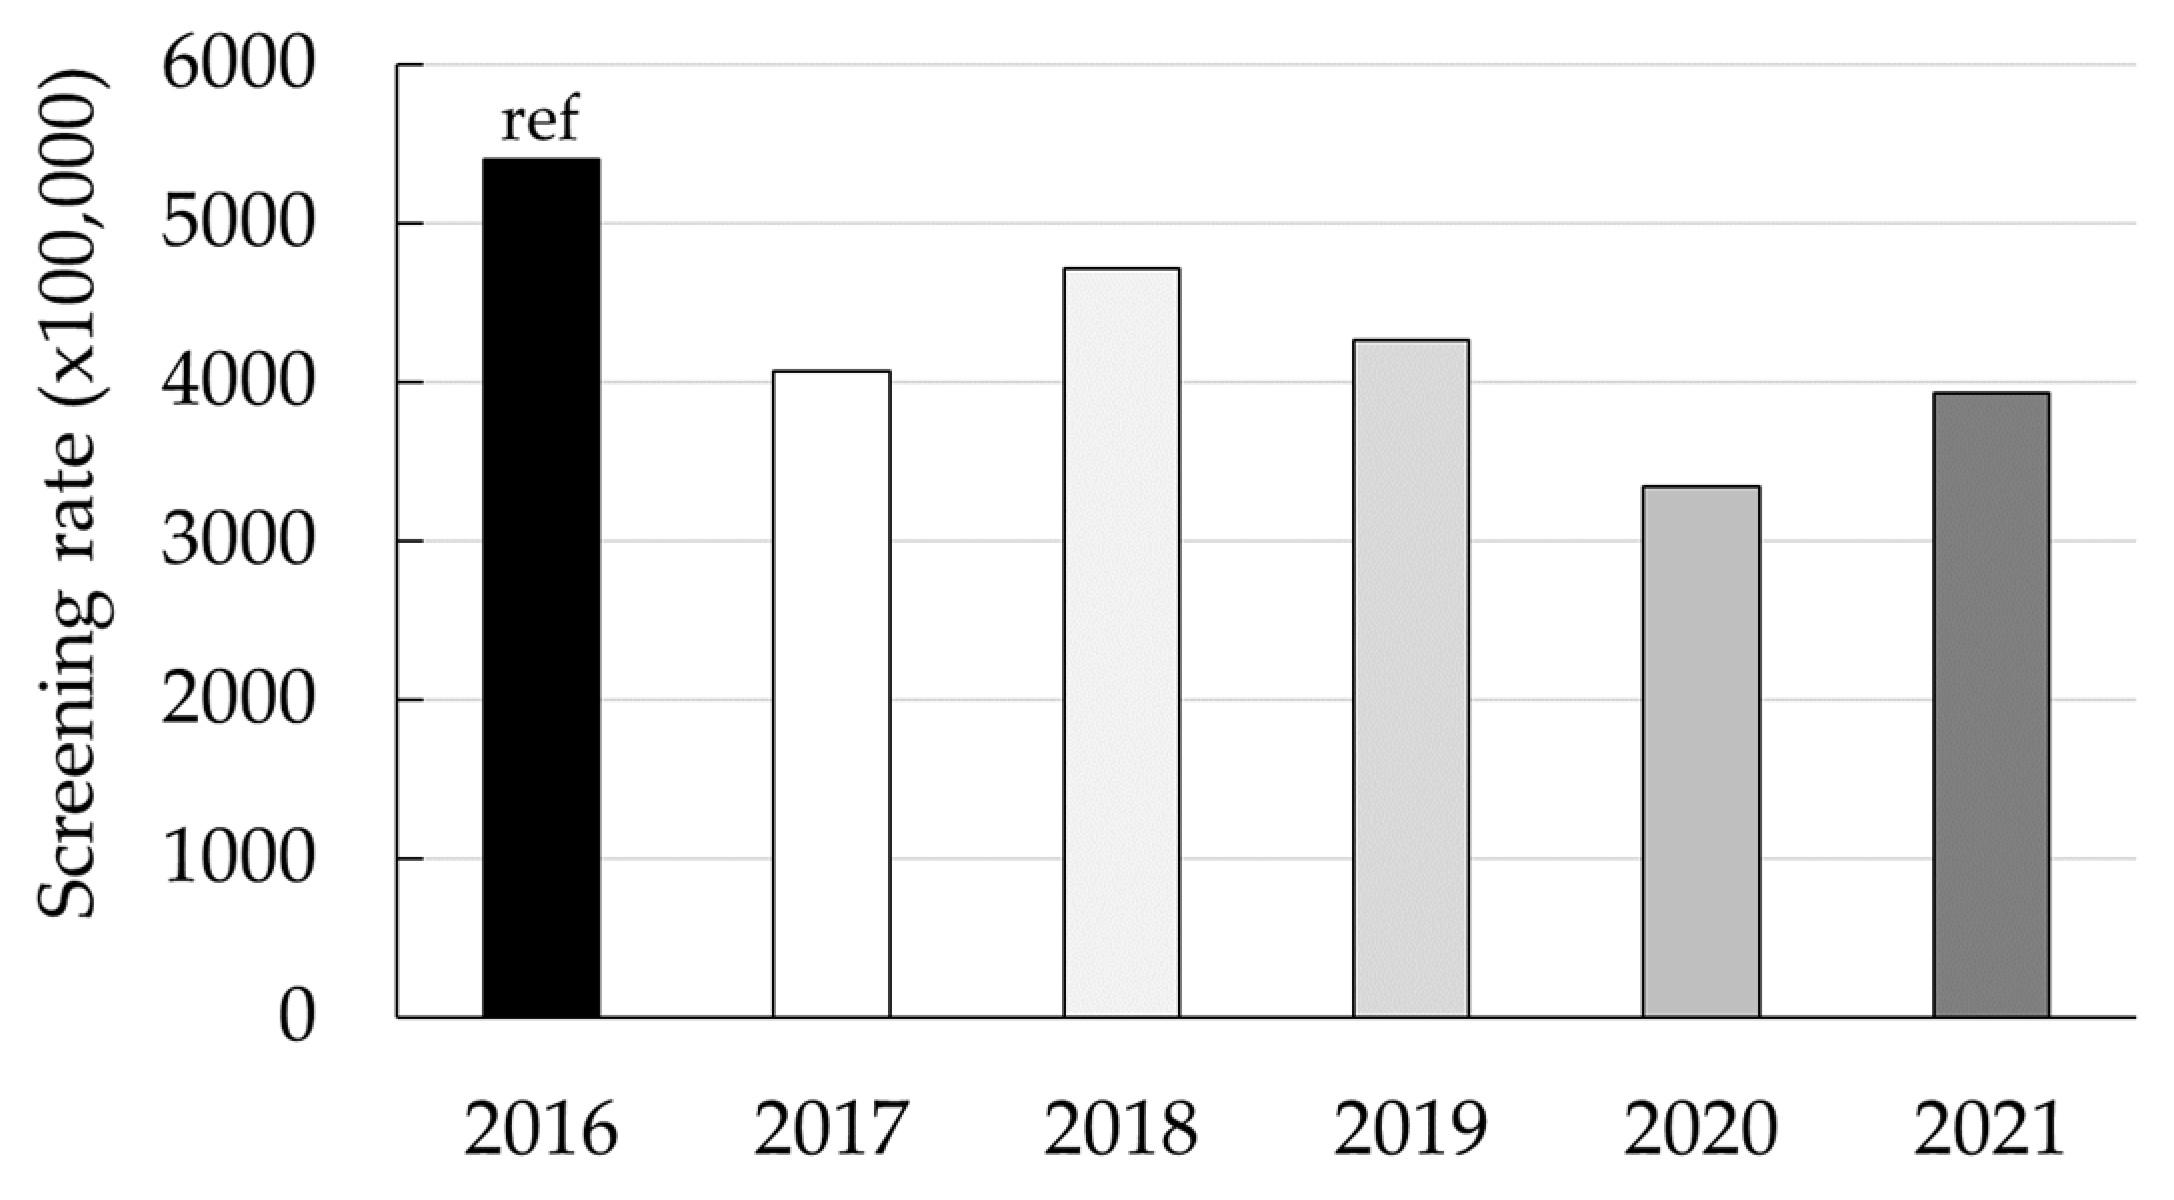
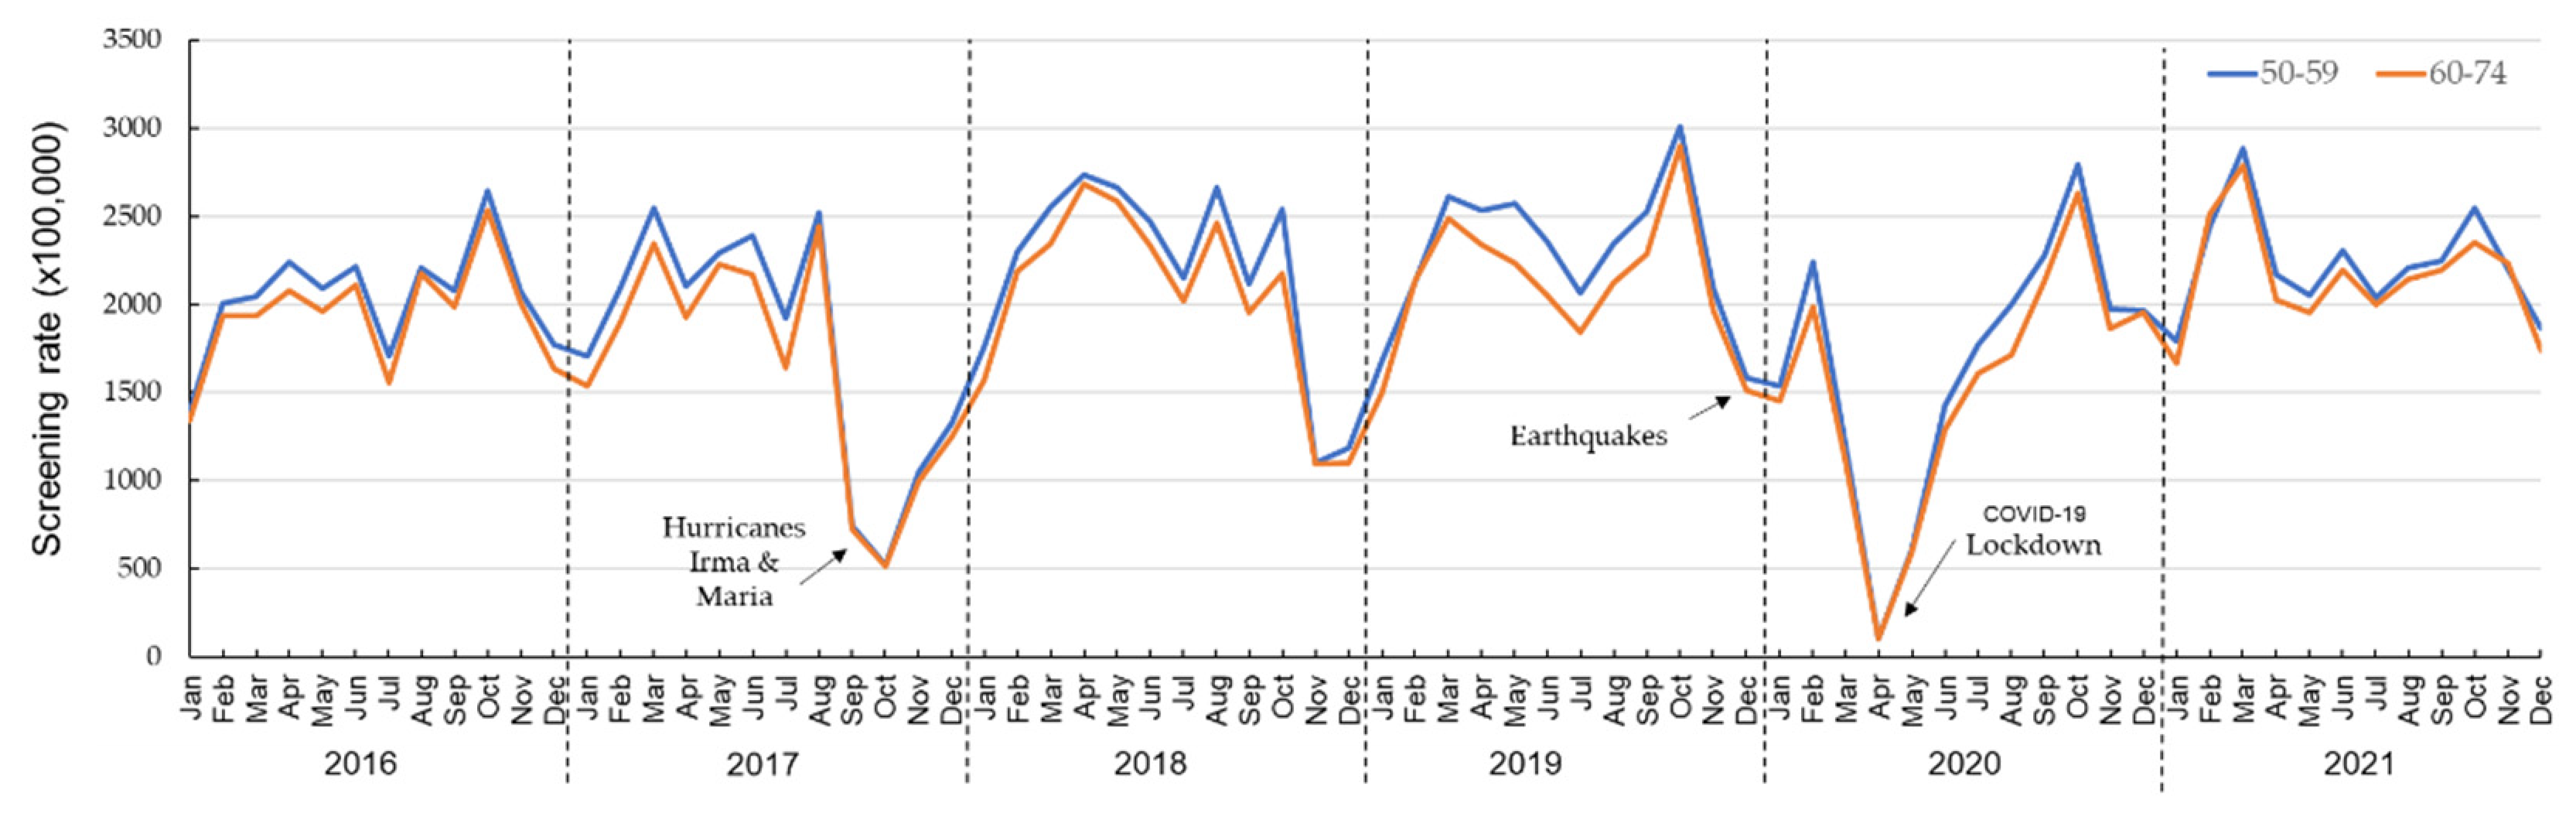
3.1. Trends and the Impact of Hurricanes and COVID-19 on Colorectal Screening in the Medicaid Population of PR from 2016 to 2021
3.2. Absolute Deficit in Colorectal Cancer Screening
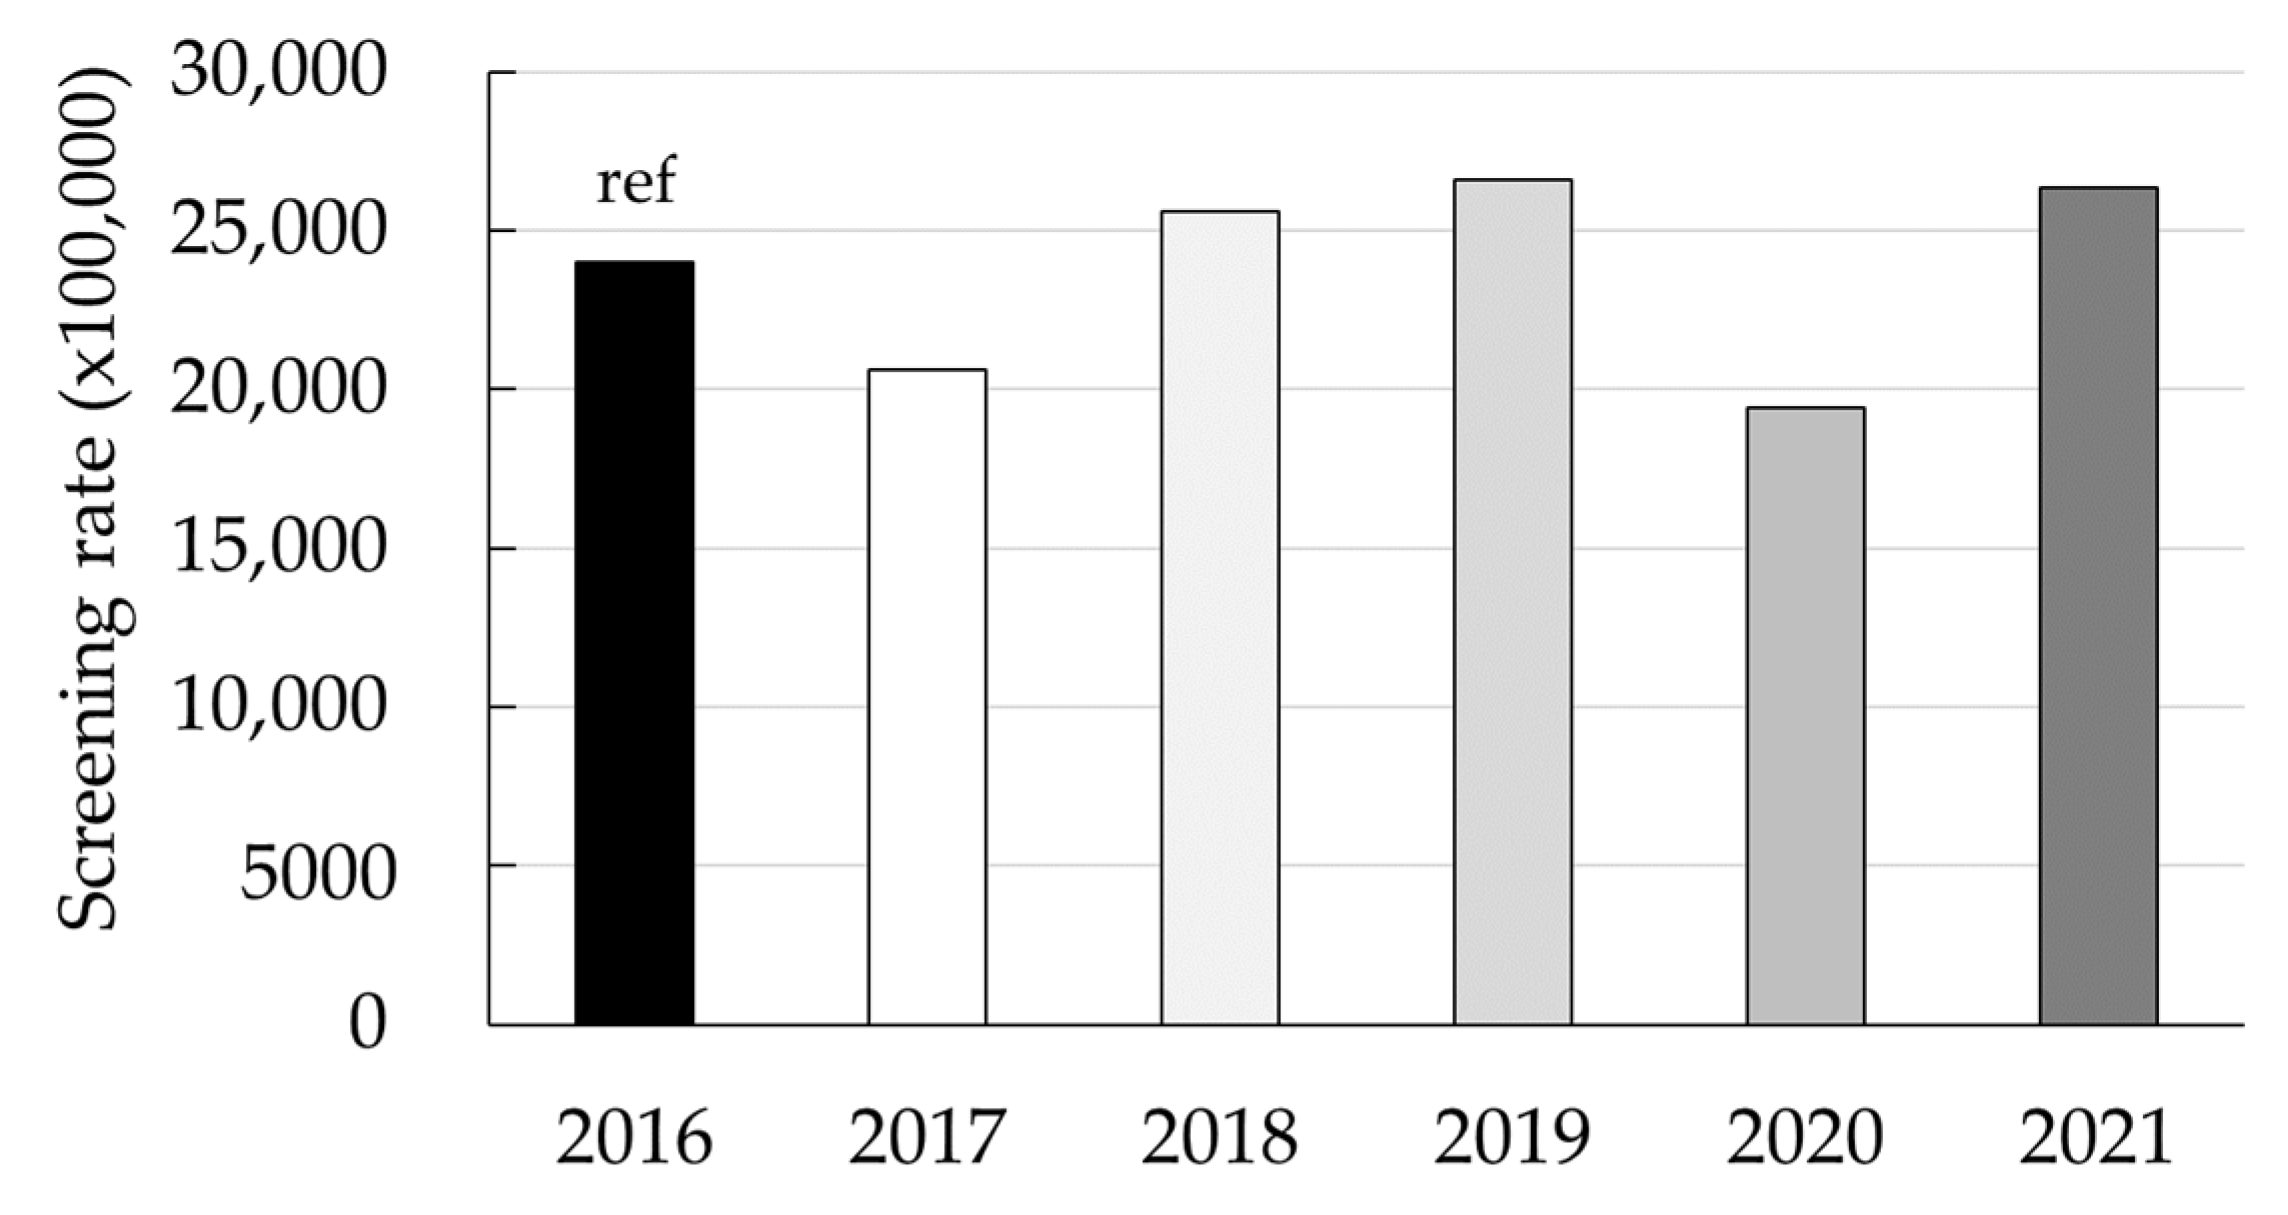
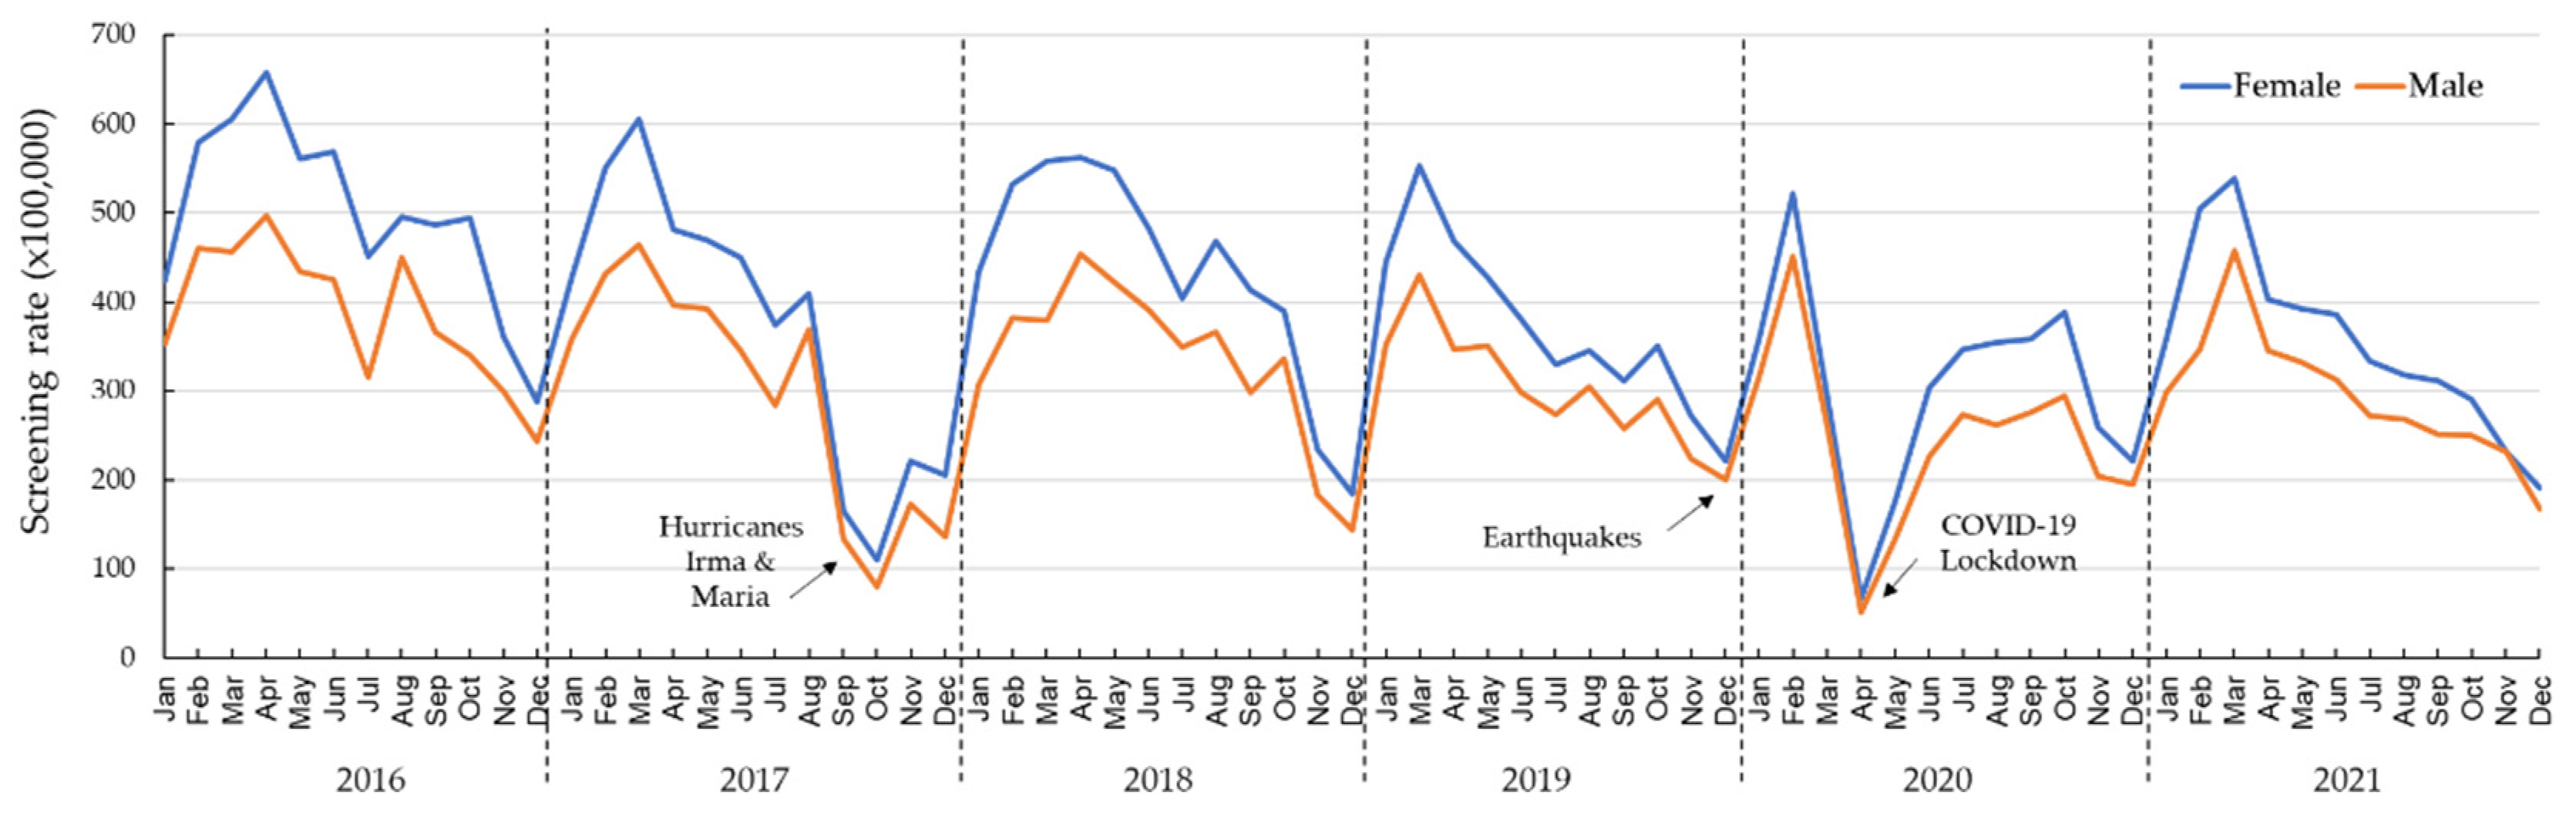
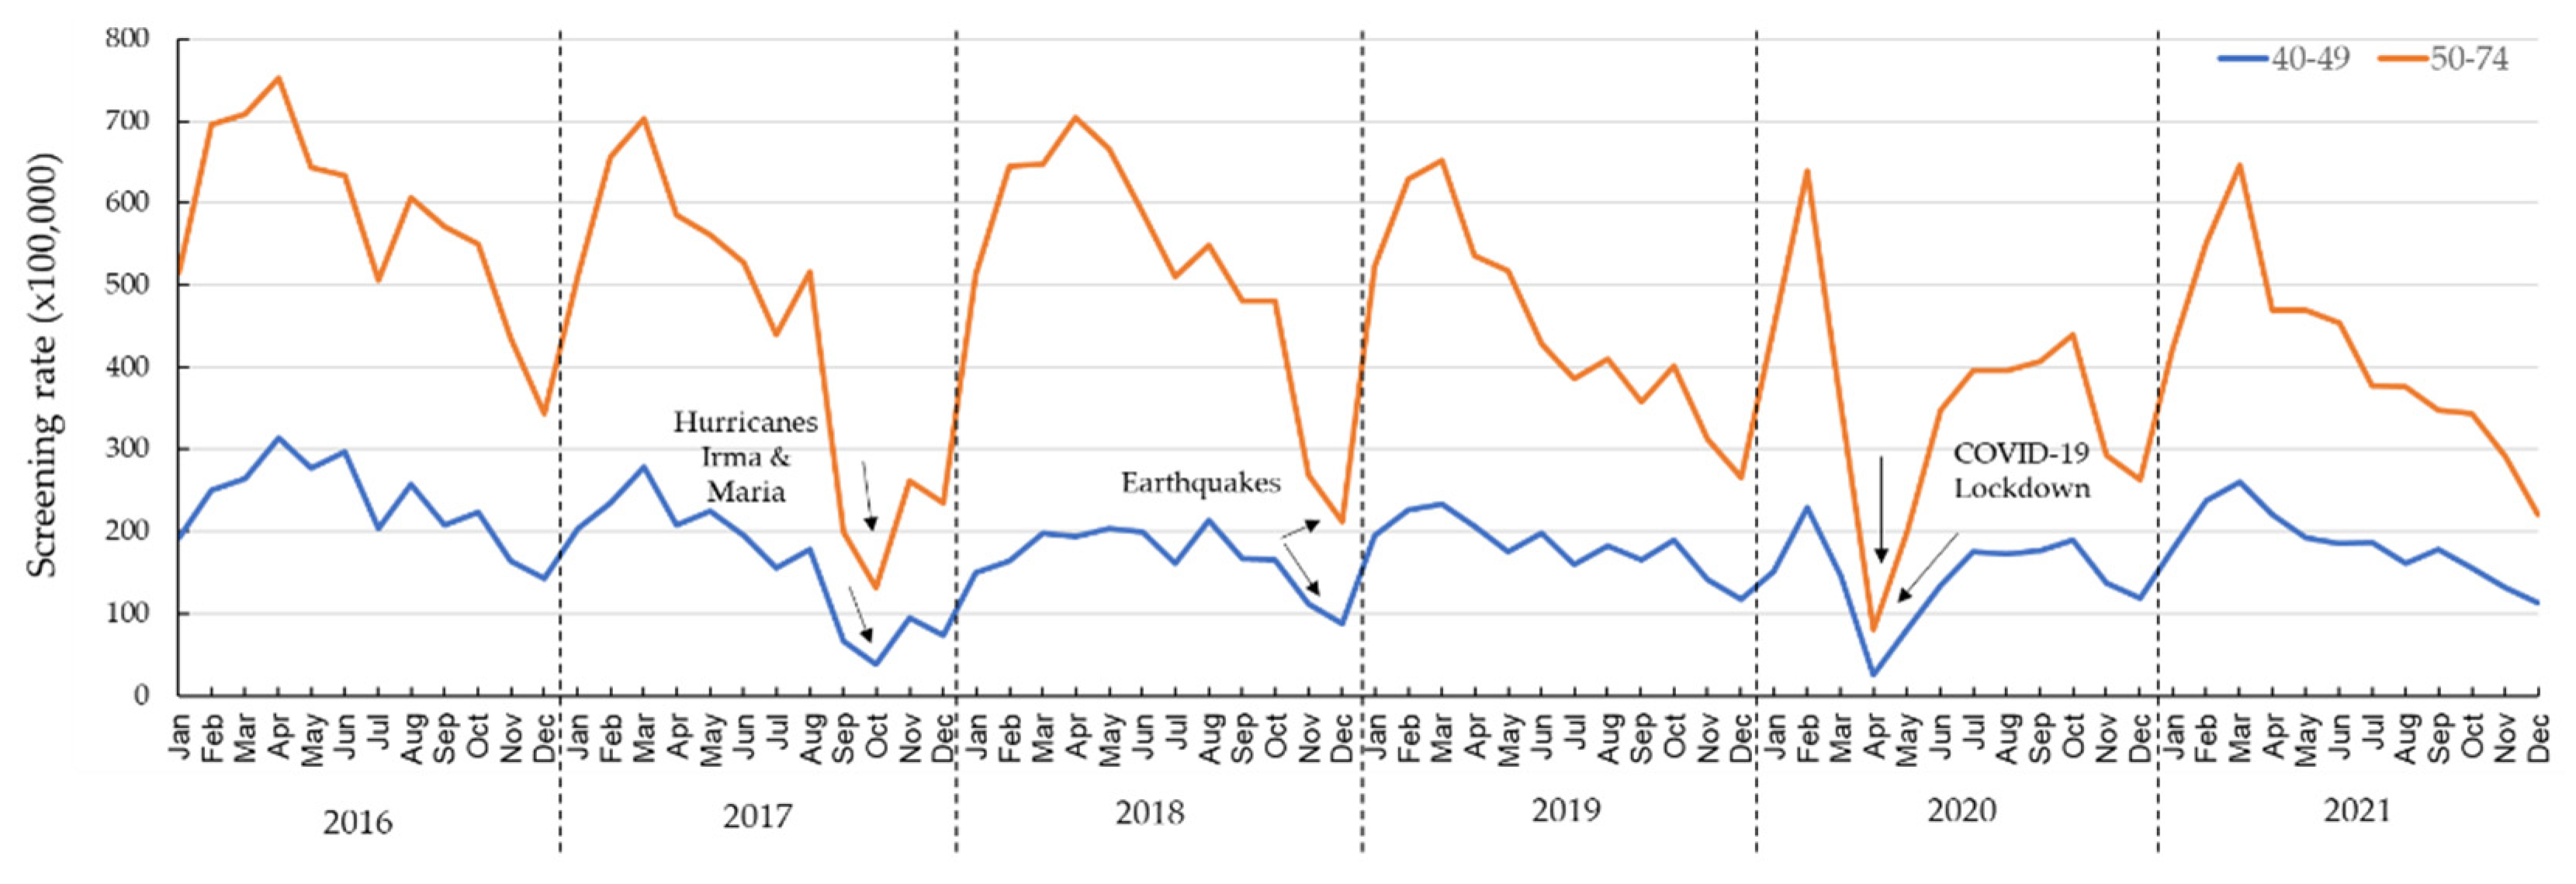
3.3. Trends and the Impact of Hurricanes and COVID-19 on Breast Cancer Screening in the Medicaid Population of Puerto Rico from 2016 through 2021
3.4. Absolute Deficit in Breast Cancer Screening
4. Discussion
5. Limitations
6. Conclusions
Supplementary Materials
Author Contributions
Funding
Institutional Review Board Statement
Informed Consent Statement
Data Availability Statement
Acknowledgments
Conflicts of Interest
References
- Lu, D.; Alcantara, C. “Puerto Rico’s Recovery after the Hurricane”. The Washington Post. 2017. Available online: https://www.washingtonpost.com/graphics/2017/national/puerto-rico-hurricane-recovery/ (accessed on 31 August 2023).
- Man, R.X.; Lack, D.A.; Wyatt, C.E.; Murray, V. The Effect of Natural Disasters on Cancer Care: A Systematic Review. Lancet Oncol. 2018, 19, e482–e499. [Google Scholar] [CrossRef] [PubMed]
- Alkatout, I.; Biebl, M.; Momenimovahed, Z.; Giovannucci, E.; Hadavandsiri, F.; Salehiniya, H.; Allahqoli, L. Has COVID-19 affected cancer screening programs? A systematic review. Front. Oncol. 2021, 11, 675038:1–675038:11. [Google Scholar] [CrossRef]
- Wentzensen, N.; Clarke, M.A.; Perkins, R.B. Impact of COVID-19 on cervical cancer screening: Challenges and opportunities to improving resilience and reduce disparities. Prev. Med. 2021, 151, 106596:1–106596:8. [Google Scholar] [CrossRef] [PubMed]
- Mazidimoradi, A.; Tiznobaik, A.; Salehiniya, H. Impact of the COVID-19 Pandemic on Colorectal Cancer Screening: A Systematic Review. J. Gastrointest. Cancer 2022, 53, 730–744. [Google Scholar] [CrossRef] [PubMed]
- D’Ovidio, V.; Lucidi, C.; Bruno, G.; Lisi, D.; Miglioresi, L.; Bazuro, M.E. Impact of COVID-19 Pandemic on Colorectal Cancer Screening Program. Clin. Colorect. Cancer 2021, 20, e5–e11. [Google Scholar] [CrossRef] [PubMed]
- Epic Health Research Network. Preventive Cancer Screenings during COVID-19 Pandemic. 2020. Available online: https://epicresearchblob.blob.core.windows.net/cms-uploads/pdfs/Preventive-Cancer-Screenings-during-COVID-19-Pandemic.pdf (accessed on 3 March 2023).
- Chen, R.C.; Haynes, K.; Du, S.; Barron, J.; Katz, A.J. Association of Cancer Screening Deficit in the United States with the COVID-19 Pandemic. JAMA Oncol. 2021, 7, 878–884. [Google Scholar] [CrossRef] [PubMed]
- Puerto Rico Department of Health. Perfil Epidemiológico de la Mortalidad en Puerto Rico: Años 2015–2022 [Epidemiological Profile of Mortality in Puerto Rico: Years 2015–2022]. 2023. Available online: https://www.salud.gov.pr/CMS/DOWNLOAD/7323 (accessed on 12 May 2023).
- Puerto Rico Department of Health. Informe Anual de Estadísticas Vitales: Defunciones, años 2017 al 2020). Secretaría de Planificación y Desarrollo. (Secretaría Auxiliar de Planificación y Desarrollo, División de Estadísticas). 2023. Available online: https://estadisticas.pr/files/Inventario/publicaciones/Informe%20de%20Estadisticas%20Vitales_Defunciones%202017-2020.pdf (accessed on 3 July 2023).
- Pruitt, S.L.; Harzke, A.J.; Davidson, N.O.; Schootman, M. Do diagnostic and treatment delays for colorectal cancer increase risk of death? Cancer Causes Control 2013, 24, 961–977. [Google Scholar] [CrossRef] [PubMed]
- Ortiz-Ortiz, K.J.; Ramírez-García, R.; Cruz-Correa, M.; Ríos-González, M.Y.; Ortiz, A.P. Effects of type of health insurance coverage on colorectal cancer survival in Puerto Rico: A population-based study. PLoS ONE 2014, 9, e96746. [Google Scholar] [CrossRef] [PubMed]
- Statistics Institute of Puerto Rico. Available online: https://estadisticas.pr (accessed on 7 July 2023).
- Health Insurance Administration of Puerto Rico. Available online: https://www.asespr.org/proveedores-2/estadisticas/ (accessed on 5 May 2023).
- Siu, A.L.; US Preventive Services Task Force. Screening for Breast Cancer: U.S. Preventive Services Task Force Recommendation Statement. Ann. Intern. Med. 2016, 164, 279–296. [Google Scholar] [CrossRef] [PubMed]
- US Preventive Services Task Force; Bibbins-Domingo, K.; Grossman, D.C.; Curry, S.J.; Davidson, K.W.; Epling, J.W., Jr.; García, F.A.R.; Gillman, M.W.; Harper, D.M.; Kemper, A.R.; et al. Screening for Colorectal Cancer: US Preventive Services Task Force Recommendation Statement. JAMA 2016, 315, 2564–2575. [Google Scholar] [CrossRef] [PubMed]
- Puerto Rico Department of Health. Executive Order 334. 2015. Available online: https://www.salud.gov.pr/CMS/DOWNLOAD/3481 (accessed on 5 May 2023).
- Soto-Salgado, M.; Suárez, E.; Calo, W.; Cruz-Correa, M.; Figueroa-Vallés, N.R.; Ortiz, A.P. Incidence and mortality rates for colorectal cancer in Puerto Rico and among Hispanics, non-Hispanic whites, and non-Hispanic blacks in the United States, 1998–2002. Cancer 2009, 115, 3016–3023. [Google Scholar] [CrossRef] [PubMed]
- Suárez, E.; Pérez, C.; Rivera, R.; Martínez, M. Poisson Regression Models for Cohort Studies. In Applications of Regression Models in Epidemiology; John Wiley & Sons, Inc.: Hoboken, NJ, USA, 2017; pp. 141–164. [Google Scholar]
- Mast, C.; Deckert, J.; del Río, A.M. Troubling Cancer Screening Rates Still Seen Nearly Two Years into the Pandemic. 2022. Available online: https://epicresearchblob.blob.core.windows.net/cms-uploads/pdfs/troubling-cancer-screening-rates-still-seen-nearly-two-years-into-the-pandemic.pdf (accessed on 12 August 2023).
- Colón-López, V.; Valencia-Torres, I.M.; Ríos, E.I.; Llavona, J.; Vélez-Álamo, C.; Fernández, M.E. Knowledge, attitudes, and beliefs about colorectal cancer screening in Puerto Rico. J. Cancer Educ. 2023, 38, 552–561. [Google Scholar] [CrossRef] [PubMed]
- Centers for Medicare & Medicaid Services. NCD-Fecal Occult Blood Test (190.34). 2020. Available online: https://www.cms.gov/medicare-coverage-database/view/ncd.aspx?ncdid=167&ncdver=1 (accessed on 20 May 2023).


| Year | Number of Beneficiaries (≥1 Screening) | Total Medicaid Enrollment | Rate (×100,000) | RRcrude (95% CI) | RRadj # (95% CI) |
|---|---|---|---|---|---|
| Month: Cumulative | |||||
| 2016 | 22,046 | 408,396 | 5398 | 1.00 | 1.00 |
| 2017 | 16,483 | 404,681 | 4073 | 0.75 (0.74, 0.77) | 0.75 (0.74, 0.77) * |
| 2018 | 19,582 | 415,247 | 4716 | 0.87 (0.86, 0.89) | 0.87 (0.85, 0.89) * |
| 2019 | 16,731 | 392,204 | 4266 | 0.79 (0.77, 0.81) | 0.78 (0.77, 0.80) * |
| 2020 | 13,289 | 397,698 | 3341 | 0.62 (0.61, 0.63) | 0.61 (0.60, 0.63) * |
| 2021 | 17,044 | 433,272 | 3934 | 0.73 (0.71, 0.74) | 0.73 (0.71, 0.74) * |
| Month: January | |||||
| 2016 | 1638 | 415,928 | 394 | 1.00 | 1.00 |
| 2017 | 1605 | 403,358 | 398 | 1.01 (0.94, 1.08) | 1.00 (0.94, 1.07) |
| 2018 | 1558 | 410,884 | 379 | 0.98 (0.95, 1.02) | 0.98 (0.94, 1.01) |
| 2019 | 1624 | 401,217 | 405 | 1.01 (0.99, 1.03) | 1.00 (0.98, 1.03) |
| 2020 | 1315 | 384,998 | 346 | 0.97 (0.95, 0.98) | 0.96 (0.94, 0.98) * |
| 2021 | 1376 | 414,296 | 332 | 0.97 (0.95, 0.98) | 0.96 (0.95, 0.98) * |
| Month: February | |||||
| 2016 | 2141 | 405,284 | 528 | 1.00 | 1.00 |
| 2017 | 2008 | 401,943 | 500 | 0.95 (0.89, 1.01) | 0.94 (0.89, 1.00) |
| 2018 | 1936 | 414,570 | 467 | 0.94 (0.91, 0.97) | 0.94 (0.91, 0.97) * |
| 2019 | 1925 | 399,360 | 482 | 0.97 (0.05, 0.99) | 0.97 (0.95, 0.99) * |
| 2020 | 1890 | 384,527 | 492 | 0.98 (0.97, 1.00) | 0.98 (0.96, 0.99) * |
| 2021 | 1857 | 426,150 | 436 | 0.96 (0.95, 0.97) | 0.96 (0.95, 0.97) * |
| Month: March | |||||
| 2016 | 2188 | 404,046 | 542 | 1.00 | 1.00 |
| 2017 | 2219 | 406,981 | 545 | 1.01 (0.95, 1.07) | 1.00 (0.95, 1.06) |
| 2018 | 2012 | 418,261 | 481 | 0.94 (0.91, 0.97) | 0.94 (0.91, 0.97) * |
| 2019 | 1968 | 393,551 | 500 | 0.97 (0.95, 0.99) | 0.97 (0.95, 0.99) * |
| 2020 | 1078 | 387,514 | 278 | 0.85 (0.83, 0.86) | 0.84 (0.83, 0.86) * |
| 2021 | 2161 | 429,172 | 504 | 0.99 (0.97, 1.00) | 0.98 (0.97, 1.00)* |
| Month: April | |||||
| 2016 | 2397 | 407,430 | 588 | 1.00 | 1.00 |
| 2017 | 1806 | 405,527 | 445 | 0.76 (0.71, 0.8) | 0.75 (0.71, 0.80) * |
| 2018 | 2170 | 421,401 | 515 | 0.94 (0.91, 0.96) | 0.93 (0.91, 0.96) * |
| 2019 | 1669 | 401,605 | 416 | 0.89 (0.87, 0.91) | 0.89 (0.87, 0.91) * |
| 2020 | 234 | 387,408 | 60 | 0.57 (0.55, 0.59) | 0.56 (0.55, 0.58) * |
| 2021 | 1631 | 432,009 | 378 | 0.92 (0.90, 0.93) | 0.91 (0.90, 0.93) * |
| Month: May | |||||
| 2016 | 2070 | 408,775 | 506 | 1.00 | 1.00 |
| 2017 | 1765 | 404,000 | 437 | 0.86 (0.81, 0.92) | 0.86 (0.81, 0.92) * |
| 2018 | 2109 | 426,763 | 494 | 0.99 (0.96, 1.02) | 0.99 (0.96, 1.02) |
| 2019 | 1585 | 402,089 | 394 | 0.92 (0.90, 0.94) | 0.92 (0.89, 0.94) * |
| 2020 | 610 | 391,011 | 156 | 0.75 (0.73, 0.76) | 0.74 (0.73, 0.76) * |
| 2021 | 1591 | 434,186 | 366 | 0.94 (0.93, 0.95) | 0.94 (0.92, 0.95) * |
| Month: June | |||||
| 2016 | 2069 | 407,796 | 507 | 1.00 | 1.00 |
| 2017 | 1629 | 402,434 | 405 | 0.80 (0.75, 0.85) | 0.79 (0.74, 0.85) * |
| 2018 | 1885 | 425,514 | 443 | 0.93 (0.91, 0.96) | 0.93 (0.91, 0.96) * |
| 2019 | 1349 | 390,228 | 346 | 0.88 (0.86, 0.90) | 0.88 (0.86, 0.90) * |
| 2020 | 1068 | 395,432 | 270 | 0.85 (0.84, 0.87) | 0.85 (0.84, 0.87) * |
| 2021 | 1534 | 433,522 | 354 | 0.93 (0.92, 0.94) | 0.93 (0.92, 0.94) * |
| Month: July | |||||
| 2016 | 1599 | 406,758 | 393 | 1.00 | 1.00 |
| 2017 | 1327 | 395,051 | 336 | 0.85 (0.79, 0.92) | 0.85 (0.79, 0.91) * |
| 2018 | 1598 | 419,900 | 381 | 0.98 (0.95, 1.02) | 0.94 (0.91, 0.97) |
| 2019 | 1187 | 388,458 | 306 | 0.92 (0.90, 0.94) | 0.92 (0.89, 0.94) * |
| 2020 | 1257 | 398,514 | 315 | 0.95 (0.93, 0.96) | 0.94 (0.93, 0.96) * |
| 2021 | 1336 | 435,245 | 307 | 0.95 (0.94, 0.97) | 0.95 (0.94, 0.97) * |
| Month: August | |||||
| 2016 | 1942 | 407,927 | 476 | 1.00 | 1.00 |
| 2017 | 1563 | 398,350 | 392 | 0.82 (0.77, 0.88) | 0.82 (0.77, 0.88) * |
| 2018 | 1781 | 419,900 | 424 | 0.94 (0.91, 0.97) | 0.91 (0.88, 0.95) * |
| 2019 | 1264 | 385,079 | 328 | 0.88 (0.86, 0.90) | 0.88 (0.86, 0.90) * |
| 2020 | 1263 | 401,752 | 314 | 0.90 (0.89, 0.92) | 0.90 (0.88, 0.92) * |
| 2021 | 1289 | 435,598 | 296 | 0.91 (0.90, 0.92) | 0.91 (0.90, 0.92) * |
| Month: September | |||||
| 2016 | 1775 | 407,794 | 435 | 1.00 | 1.00 |
| 2017 | 607 | 401,069 | 151 | 0.35 (0.32, 0.38) | 0.35 (0.31, 0.38) * |
| 2018 | 1495 | 410,872 | 364 | 0.91 (0.88, 0.95) | 0.92 (0.89, 0.95) * |
| 2019 | 1113 | 385,933 | 288 | 0.87 (0.85, 0.89) | 0.87 (0.85, 0.89) * |
| 2020 | 1309 | 405,826 | 323 | 0.93 (0.91, 0.94) | 0.93 (0.91, 0.94) * |
| 2021 | 1248 | 437,901 | 285 | 0.92 (0.91, 0.93) | 0.92 (0.91, 0.93) * |
| Month: October | |||||
| 2016 | 1755 | 409,855 | 428 | 1.00 | 1.00 |
| 2017 | 390 | 401,069 | 97 | 0.23 (0.20, 0.25) | 0.23 (0.20, 0.25) * |
| 2018 | 1515 | 413,153 | 367 | 0.93 (0.89, 0.96) | 0.79 (0.76, 0.83) * |
| 2019 | 1258 | 387,035 | 325 | 0.91 (0.89, 0.93) | 0.91 (0.89, 0.93) * |
| 2020 | 1423 | 409,073 | 348 | 0.95 (0.93, 0.97) | 0.95 (0.93, 0.96) * |
| 2021 | 1201 | 439,472 | 273 | 0.91 (0.90, 0.93) | 0.91 (0.90, 0.93) * |
| Month: November | |||||
| 2016 | 1371 | 409,581 | 335 | 1.00 | 1.00 |
| 2017 | 792 | 395,051 | 200 | 0.60 (0.55, 0.65) | 0.60 (0.55, 0.65) * |
| 2018 | 859 | 404,876 | 212 | 0.80 (0.76, 0.83) | 0.79 (0.76, 0.83) * |
| 2019 | 969 | 385,797 | 251 | 0.91 (0.88, 0.93) | 0.91 (0.88, 0.93) * |
| 2020 | 970 | 412,034 | 235 | 0.92 (0.90, 0.93) | 0.91 (0.90, 0.93) * |
| 2021 | 1022 | 440,377 | 232 | 0.93 (0.91, 0.94) | 0.93 (0.91, 0.94) * |
| Month: December | |||||
| 2016 | 1101 | 409,581 | 269 | 1.00 | 1.00 |
| 2017 | 772 | 441,340 | 175 | 0.65 (0.59, 0.71) | 0.65 (0.59, 0.71) * |
| 2018 | 664 | 396,867 | 167 | 0.79 (0.75, 0.83) | 0.78 (0.75, 0.82) * |
| 2019 | 820 | 386,100 | 212 | 0.92 (0.90, 0.95) | 0.92 (0.89, 0.95) * |
| 2020 | 872 | 414,283 | 210 | 0.94 (0.92, 0.96) | 0.94 (0.92, 0.96) * |
| 2021 | 798 | 441,340 | 181 | 0.92 (0.91, 0.94) | 0.92 (0.91, 0.94) * |
| Year | Number of Beneficiaries Observed (≥1 Screening Claim) | Total Medicaid Enrollment | Number of Beneficiaries Expected (≥1 Screening Claim) * | Annual Deficit (95% CI) |
|---|---|---|---|---|
| 2016 | 22,046 | 408,396 | - | - |
| 2017 | 16,483 | 404,681 | 21,845 | −5360 (−5650, −5074) |
| 2018 | 19,582 | 415,247 | 22,416 | −2835 (−3129, −2537) |
| 2019 | 16,731 | 392,204 | 21,172 | −4440 (−4720, −4161) |
| 2020 | 13,289 | 397,698 | 21,468 | −8180 (−8462, −7896) |
| 2021 | 17,044 | 433,272 | 23,389 | −6345 (−6653, −6036) |
| Year | Number of Beneficiaries (≥1 Screening) | Total Medicaid Enrollment | Rate (×100,000) | RRcrude (95% CI) | RRadj # (95% CI) |
|---|---|---|---|---|---|
| Month: Cumulative | |||||
| 2016 | 34,914 | 145,541 | 23,989 | 1.00 | 1.00 |
| 2017 | 29,903 | 145,234 | 20,590 | 0.86 (0.85, 0.87) | 0.86 (0.85, 0.87) |
| 2018 | 37,948 | 148,332 | 25,583 | 1.07 (1.05, 1.08) | 1.07 (1.05, 1.08) |
| 2019 | 37,916 | 142,582 | 26,592 | 1.11 (1.09, 1.12) | 1.11 (1.10, 1.13) |
| 2020 | 27,781 | 143,251 | 19,393 | 0.81 (0.80, 0.82) | 0.81 (0.80, 0.82) |
| 2021 | 40,310 | 152,893 | 26,365 | 1.10 (1.08, 1.10) | 1.10 (1.09, 1.12) |
| Month: January | |||||
| 2016 | 2017 | 147,013 | 1372 | 1.00 | 1.00 |
| 2017 | 2370 | 144,587 | 1639 | 1.19 (1.13, 1.27) | 1.20 (1.13, 1.27) * |
| 2018 | 2471 | 146,947 | 1682 | 1.11 (1.08, 1.14) | 1.11 (1.08, 1.14) * |
| 2019 | 2338 | 145,619 | 1606 | 1.05 (1.03, 1.07) | 1.06 (1.03, 1.08) * |
| 2020 | 2106 | 140,161 | 1503 | 1.02 (1.01, 1.04) | 1.02 (1.01, 1.04) * |
| 2021 | 2571 | 147,739 | 1742 | 1.05 (1.04, 1.06) | 1.05 (1.04, 1.06) * |
| Month: February | |||||
| 2016 | 2859 | 144,366 | 1980 | 1.00 | 1.00 |
| 2017 | 2911 | 144,111 | 2020 | 1.02 (0.97, 1.07) | 1.02 (0.97, 1.07) |
| 2018 | 3332 | 147,877 | 2253 | 1.07 (1.04, 1.09) | 1.07 (1.04, 1.09) * |
| 2019 | 3086 | 144,633 | 2134 | 1.03 (1.01, 1.04) | 1.03 (1.01, 1.04) * |
| 2020 | 2982 | 139,864 | 2132 | 1.02 (1.01, 1.03) | 1.02 (1.01, 1.03) * |
| 2021 | 3752 | 151,589 | 2475 | 1.05 (1.04, 1.06) | 1.05 (1.04, 1.06) * |
| Month: March | |||||
| 2016 | 2883 | 144,025 | 2002 | 1.00 | 1.00 |
| 2017 | 3597 | 145,799 | 2467 | 1.23 (1.17, 1.29) | 1.23 (1.17, 1.30) * |
| 2018 | 3672 | 148,920 | 2466 | 1.11 (1.08, 1.14) | 1.11 (1.08, 1.14) * |
| 2019 | 3642 | 142,302 | 2559 | 1.09 (1.07, 1.10) | 1.09 (1.07, 1.10) * |
| 2020 | 1651 | 140,651 | 1174 | 0.88 (0.86, 0.89) | 0.88 (0.86, 0.89) * |
| 2021 | 4336 | 152,488 | 2844 | 1.07 (1.06, 1.08) | 1.07 (1.06, 1.08) * |
| Month: April | |||||
| 2016 | 3160 | 145,287 | 2175 | 1.00 | 1.00 |
| 2017 | 2961 | 145,477 | 2035 | 0.94 (0.89, 0.98) | 0.94 (0.89, 0.98) * |
| 2018 | 4070 | 149,846 | 2716 | 1.12 (1.09, 1.14) | 1.12 (1.09, 1.14) * |
| 2019 | 3544 | 144,700 | 2449 | 1.04 (1.02, 1.06) | 1.04 (1.03, 1.06) * |
| 2020 | 152 | 140,516 | 108 | 0.47 (0.45, 0.49) | 0.47 (0.45, 0.49) * |
| 2021 | 3224 | 152,896 | 2108 | 0.99 (0.98, 1.00) | 0.99 (0.98, 1.00) |
| Month: May | |||||
| 2016 | 2974 | 145,886 | 2039 | 1.00 | 1.00 |
| 2017 | 3288 | 145,084 | 2266 | 1.11 (1.06, 1.17) | 1.11 (1.06, 1.17) * |
| 2018 | 3984 | 151,411 | 2631 | 1.14 (1.11, 1.16) | 1.14 (1.11, 1.16) * |
| 2019 | 3538 | 145,890 | 2425 | 1.06 (1.04, 1.08) | 1.06 (1.05, 1.08) * |
| 2020 | 852 | 141,509 | 602 | 0.74 (0.72, 0.75) | 0.74 (0.72, 0.75) * |
| 2021 | 3085 | 153,396 | 2011 | 1.00 (0.99, 1.01) | 1.00 (0.99, 1.01) |
| Month: June | |||||
| 2016 | 3155 | 145,202 | 2173 | 1.00 | 1.00 |
| 2017 | 3326 | 144,560 | 2301 | 1.06 (1.01, 1.11) | 1.06 (1.01, 1.11) * |
| 2018 | 3621 | 150,206 | 2412 | 1.05 (0.03, 1.08) | 1.05 (1.03, 1.08) * |
| 2019 | 3173 | 142,527 | 2226 | 1.01 (0.99, 1.02) | 1.01 (0.99, 1.03) |
| 2020 | 1950 | 142,643 | 1367 | 0.89 (0.88, 0.90) | 0.89 (0.88, 0.90) * |
| 2021 | 3451 | 152,808 | 2258 | 1.01 (1.00, 1.02) | 1.01 (1.00, 1.02) |
| Month: July | |||||
| 2016 | 2391 | 145,030 | 1649 | 1.00 | 1.00 |
| 2017 | 2577 | 142,575 | 1807 | 1.10 (1.04, 1.16) | 1.10 (1.04, 1.16) * |
| 2018 | 3123 | 148,888 | 2098 | 1.13 (1.10, 1.16) | 1.13 (1.10, 1.16) * |
| 2019 | 2801 | 142,176 | 1970 | 1.06 (1.04, 1.08) | 1.06 (1.04, 1.08) * |
| 2020 | 2442 | 143,339 | 1704 | 1.01 (0.99, 1.02) | 1.01 (1.00, 1.02) |
| 2021 | 3101 | 153,277 | 2023 | 1.04 (1.03, 1.05) | 1.04 (1.03, 1.05) * |
| Month: August | |||||
| 2016 | 3195 | 145,477 | 2196 | 1.00 | 1.00 |
| 2017 | 3578 | 143,861 | 2487 | 1.13 (1.08, 1.19) | 1.13 (1.08, 1.19) * |
| 2018 | 3845 | 148,888 | 2582 | 1.08 (1.06, 1.11) | 1.08 (1.06, 1.11) * |
| 2019 | 3162 | 140,523 | 2250 | 1.01 (0.99, 1.02) | 1.01 (0.99, 1.03) |
| 2020 | 2709 | 144,128 | 1880 | 0.96 (0.95, 0.97) | 0.96 (0.95, 0.98) * |
| 2021 | 3345 | 153,315 | 2182 | 1.00 (0.99, 1.01) | 1.00 (0.99, 1.01) |
| Month: September | |||||
| 2016 | 2972 | 145,500 | 2043 | 1.00 | 1.00 |
| 2017 | 1069 | 144,837 | 738 | 0.36 (0.34, 0.39) | 0.36 (0.34, 0.39) * |
| 2018 | 3001 | 146,218 | 2052 | 1.00 (0.98, 1.03) | 1.00 (0.98, 1.03) |
| 2019 | 3410 | 140,621 | 2425 | 1.06 (1.04, 1.08) | 1.06 (1.04, 1.08) * |
| 2020 | 3222 | 145,262 | 2218 | 1.02 (1.01, 1.03) | 1.02 (1.01, 1.03) * |
| 2021 | 3428 | 153,943 | 2227 | 1.02 (1.01, 1.03) | 1.02 (1.01, 1.03) * |
| Month: October | |||||
| 2016 | 3800 | 146,162 | 2599 | 1.00 | 1.00 |
| 2017 | 754 | 144,837 | 521 | 0.20 (0.19, 0.22) | 0.20 (0.19, 0.22) * |
| 2018 | 3551 | 148,924 | 2384 | 0.96 (0.94, 0.98) | 0.96 (0.94, 0.98) * |
| 2019 | 4170 | 140,881 | 2960 | 1.04 (1.03, 1.06) | 1.05 (1.03, 1.06) * |
| 2020 | 3978 | 146,124 | 2722 | 1.01 (1.00, 1.02) | 1.01 (1.00, 1.02) * |
| 2021 | 3800 | 154,344 | 2462 | 0.99 (0.98, 1.00) | 0.99 (0.98, 1.00) * |
| Month: November | |||||
| 2016 | 2993 | 146,269 | 2046 | 1.00 | 1.00 |
| 2017 | 1468 | 142,575 | 1029 | 0.50 (0.47, 0.54) | 0.50 (0.47, 0.54) * |
| 2018 | 1611 | 146,815 | 1097 | 0.73 (0.71, 0.75) | 0.73 (0.71, 0.76) * |
| 2019 | 2863 | 140,373 | 2040 | 1.00 (0.98, 1.02) | 1.00 (0.98, 1.02) |
| 2020 | 2836 | 147,085 | 1928 | 0.99 (0.97, 1.00) | 0.99 (0.97, 1.00) * |
| 2021 | 3418 | 154,422 | 2213 | 1.02 (1.01, 1.03) | 1.02 (1.01, 1.03) * |
| Month: December | |||||
| 2016 | 2515 | 146,269 | 1719 | 1.00 | 1.00 |
| 2017 | 2004 | 154,499 | 1297 | 0.75 (0.71, 0.80) | 0.76 (0.71, 0.80) * |
| 2018 | 1667 | 145,045 | 1149 | 0.82 (0.79, 0.84) | 0.82 (0.79, 0.85) * |
| 2019 | 2189 | 140,743 | 1555 | 0.97 (0.95, 0.99) | 0.97 (0.95, 0.99) * |
| 2020 | 2901 | 147,733 | 1964 | 1.03 (1.02, 1.05) | 1.03 (1.02, 1.05) * |
| 2021 | 2799 | 154,499 | 1812 | 1.01 (1.00, 1.02) | 1.01 (1.00, 1.02) * |
| Year | Number of Beneficiaries Observed (≥1 screening) | Total Medicaid Enrollment | Number of Beneficiaries Expected (≥1 Screening) * | Annual Deficit (95% CI) |
|---|---|---|---|---|
| 2016 | 34,914 | 145,541 | - | - |
| 2017 | 29,903 | 145,234 | 34,840 | −4937 (−5303, −4572) |
| 2018 | 37,948 | 148,332 | 35,584 | 2364 (1991, 2738) |
| 2019 | 37,916 | 142,582 | 34,204 | 3712 (3353, 4070) |
| 2020 | 27,781 | 143,251 | 34,365 | −6584 (−6944, −6223) |
| 2021 | 40,310 | 152,893 | 36,678 | 3632 (3248, 4017) |
Disclaimer/Publisher’s Note: The statements, opinions and data contained in all publications are solely those of the individual author(s) and contributor(s) and not of MDPI and/or the editor(s). MDPI and/or the editor(s) disclaim responsibility for any injury to people or property resulting from any ideas, methods, instructions or products referred to in the content. |
© 2023 by the authors. Licensee MDPI, Basel, Switzerland. This article is an open access article distributed under the terms and conditions of the Creative Commons Attribution (CC BY) license (https://creativecommons.org/licenses/by/4.0/).
Share and Cite
Colón-López, V.; Contreras-Mora, H.M.; Pérez, C.M.; Berríos-Ortiz, H.; Sánchez-Díaz, C.T.; Disdier, O.M.; Ríos-Morales, N.; Suárez-Pérez, E.L. Breast and Colorectal Cancer Screening Utilization after Hurricane María and the COVID-19 Pandemic in Puerto Rico. Int. J. Environ. Res. Public Health 2023, 20, 6870. https://doi.org/10.3390/ijerph20196870
Colón-López V, Contreras-Mora HM, Pérez CM, Berríos-Ortiz H, Sánchez-Díaz CT, Disdier OM, Ríos-Morales N, Suárez-Pérez EL. Breast and Colorectal Cancer Screening Utilization after Hurricane María and the COVID-19 Pandemic in Puerto Rico. International Journal of Environmental Research and Public Health. 2023; 20(19):6870. https://doi.org/10.3390/ijerph20196870
Chicago/Turabian StyleColón-López, Vivian, Héctor M. Contreras-Mora, Cynthia M. Pérez, Hérmilis Berríos-Ortiz, Carola T. Sánchez-Díaz, Orville M. Disdier, Nilda Ríos-Morales, and Erick L. Suárez-Pérez. 2023. "Breast and Colorectal Cancer Screening Utilization after Hurricane María and the COVID-19 Pandemic in Puerto Rico" International Journal of Environmental Research and Public Health 20, no. 19: 6870. https://doi.org/10.3390/ijerph20196870
APA StyleColón-López, V., Contreras-Mora, H. M., Pérez, C. M., Berríos-Ortiz, H., Sánchez-Díaz, C. T., Disdier, O. M., Ríos-Morales, N., & Suárez-Pérez, E. L. (2023). Breast and Colorectal Cancer Screening Utilization after Hurricane María and the COVID-19 Pandemic in Puerto Rico. International Journal of Environmental Research and Public Health, 20(19), 6870. https://doi.org/10.3390/ijerph20196870