


Measuring Māori Health, Wellbeing, and Disability in Aotearoa Using a Web-Based Survey Methodology

 ,
,  ,
,  , and
, and
Abstract
:1. Introduction
2. Methodology
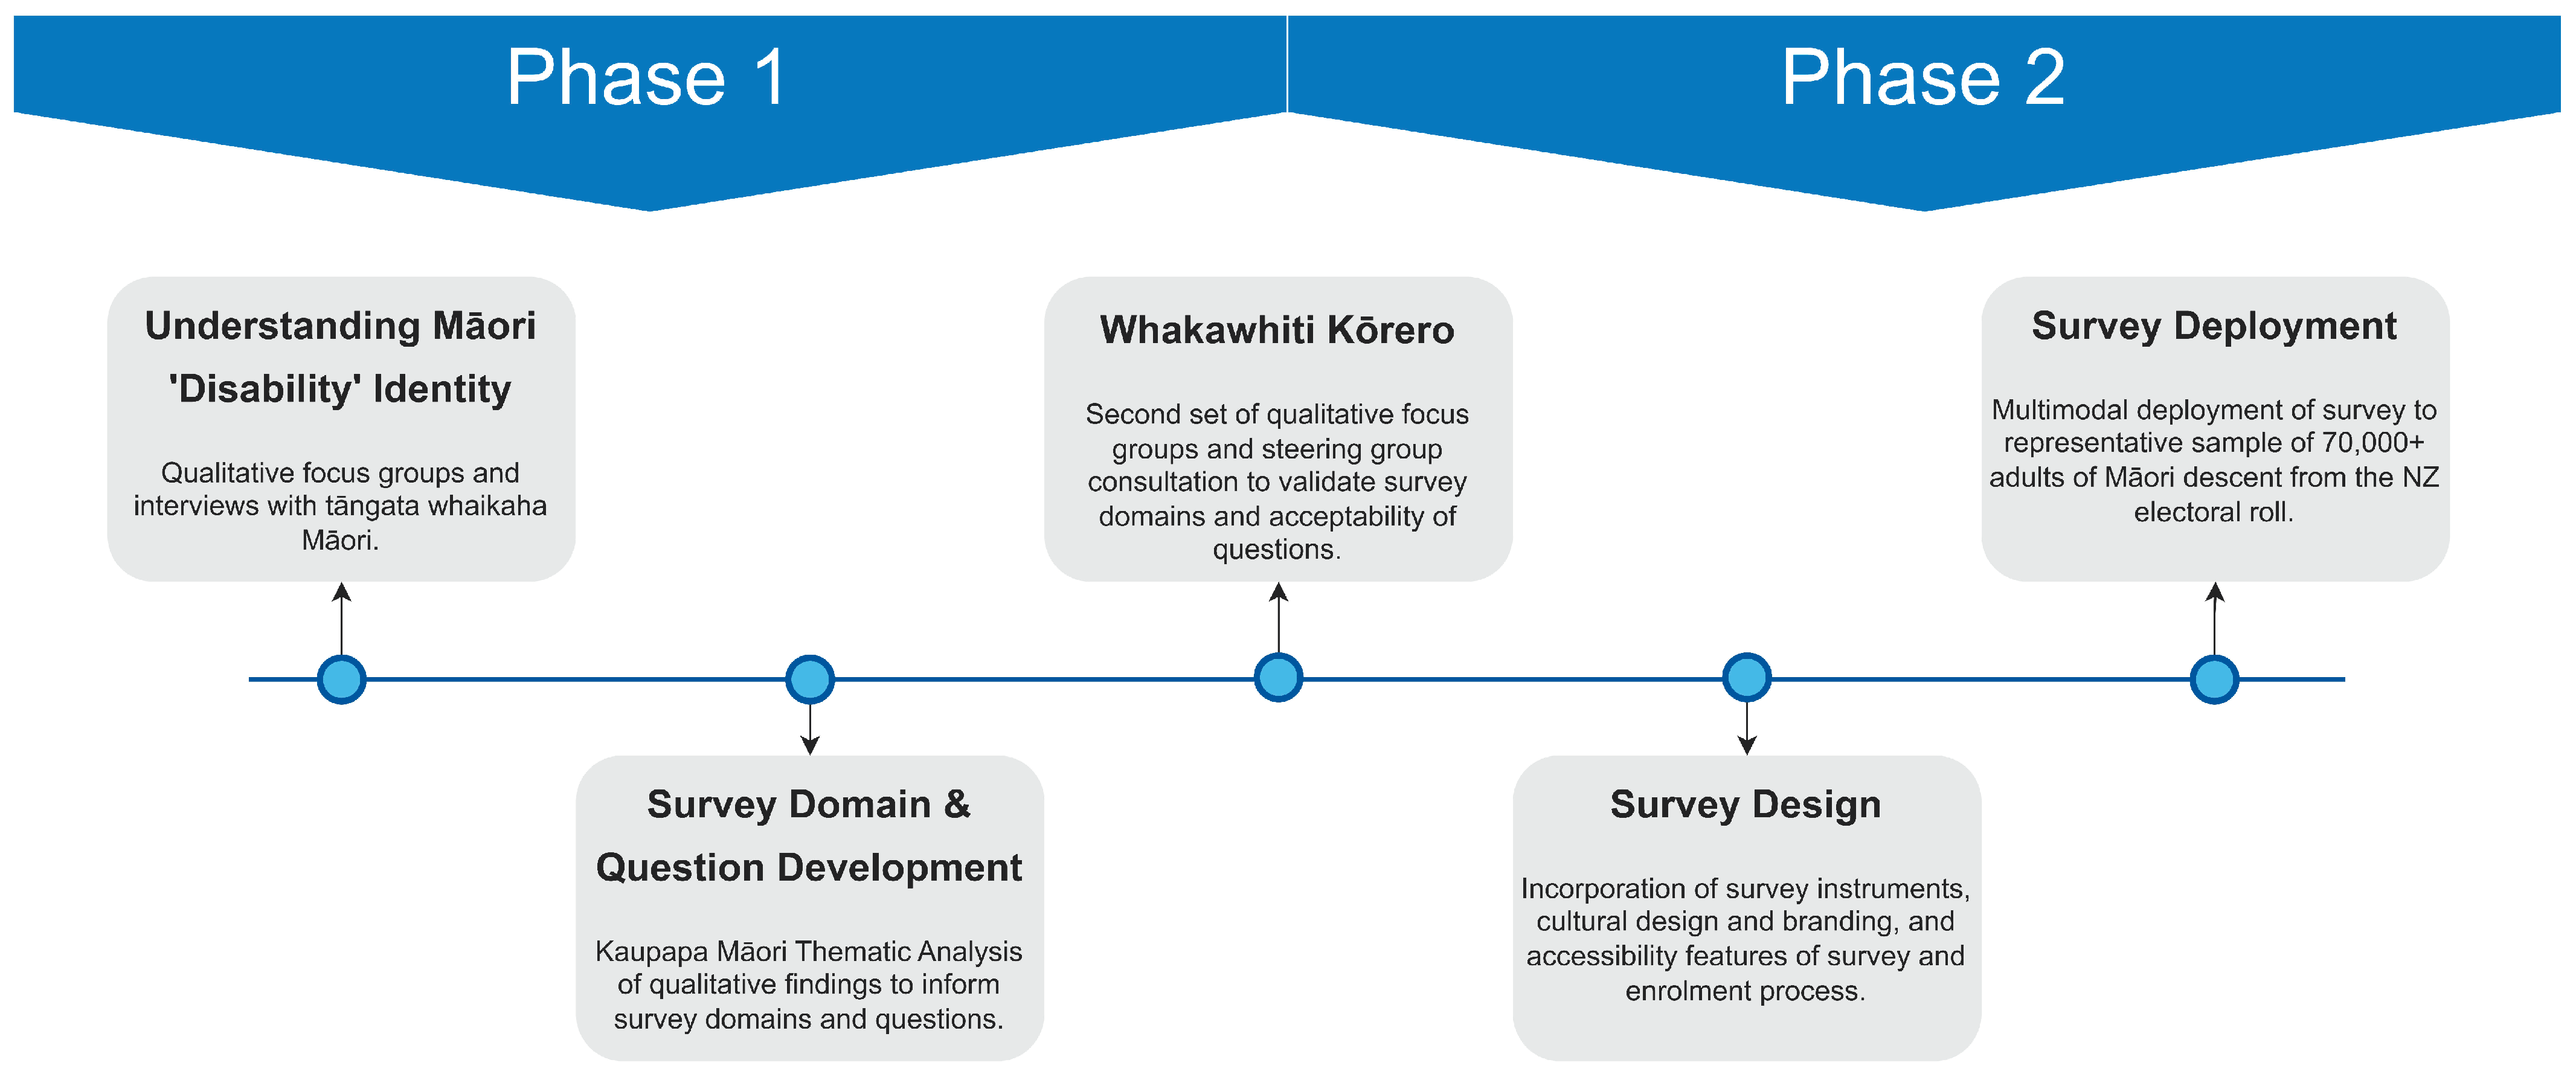
2.1. Development and Testing
2.1.1. Identification of Questionnaire Domains and Priorities
2.1.2. Survey Question Development and Compilation
2.1.3. Sector Consultation and Review
2.1.4. Survey Design and Formatting
2.1.5. Cultural Compatibility
2.1.6. Accessibility and Language
2.2. Sampling Framework and Sample Size
2.3. Recruitment Process
2.4. Survey Administration
2.4.1. Survey Enrolment and Consent Process
2.4.2. Confirmation of Consent
2.5. Survey Format
2.6. Survey Validation
2.6.1. Pilot Testing
2.6.2. Data Protection
2.7. Analysis
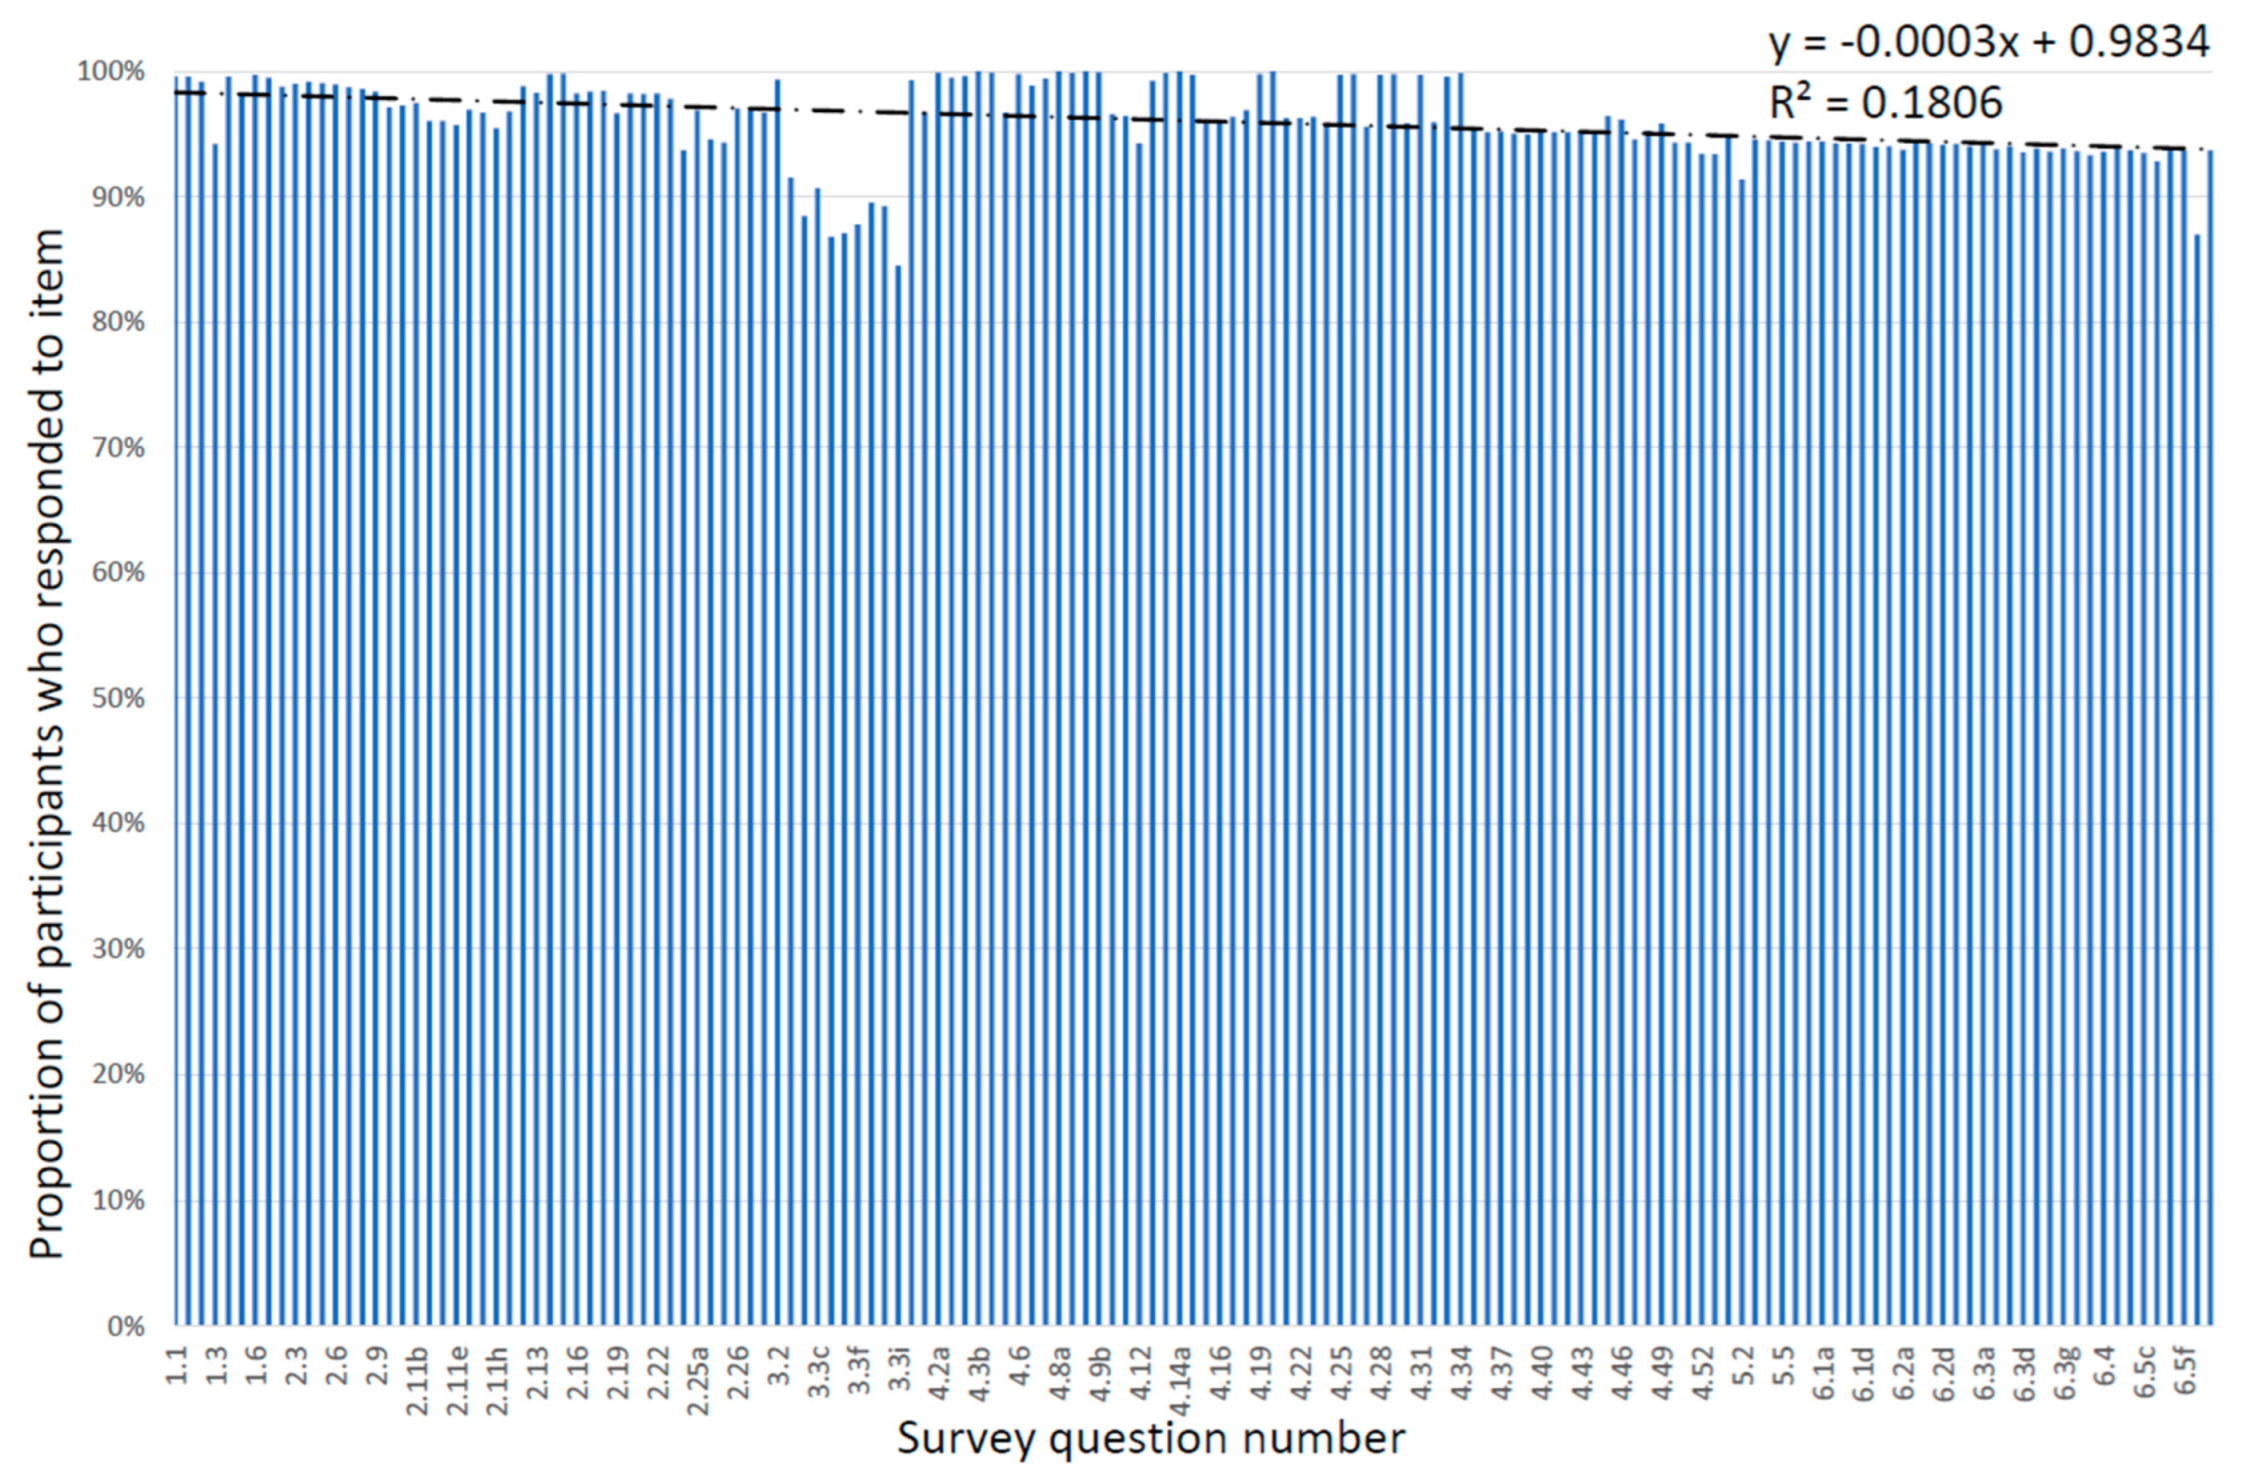
2.7.1. Missing Data
2.7.2. Māori Iwi and Rohe Data
2.7.3. Statistical Correction—Weighting
3. Results
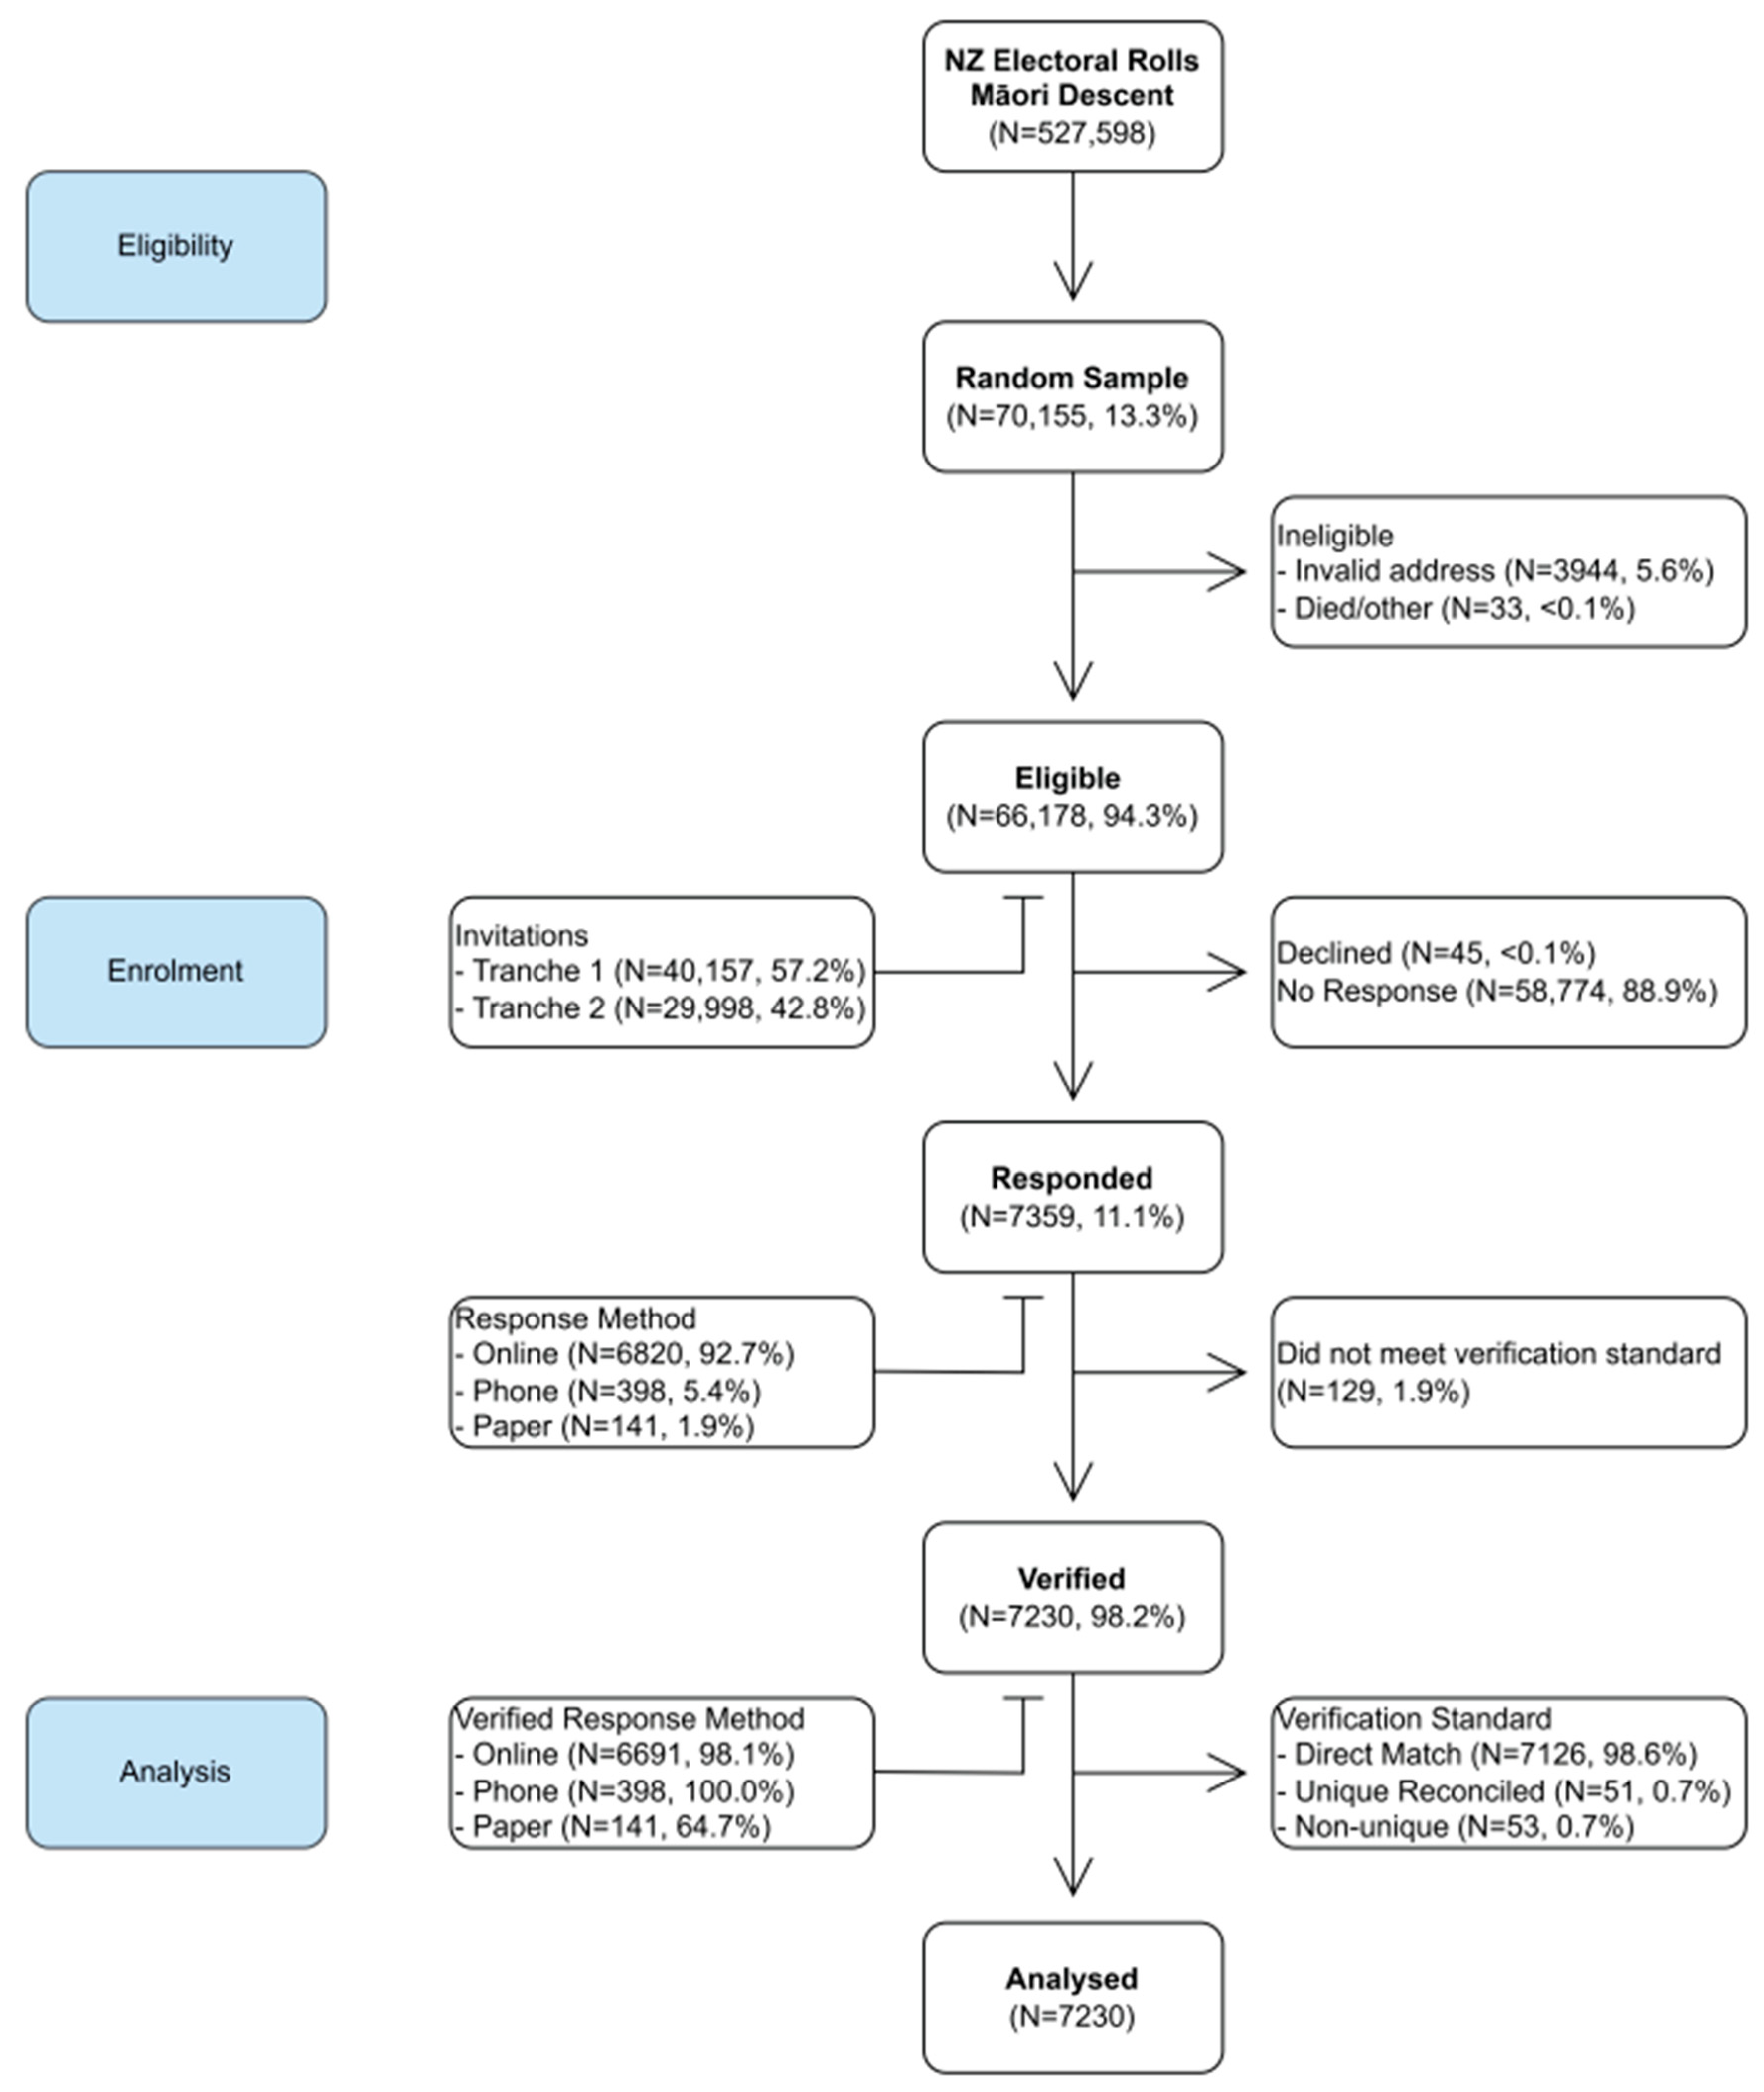
3.1. Sample Size and Eligible Participants
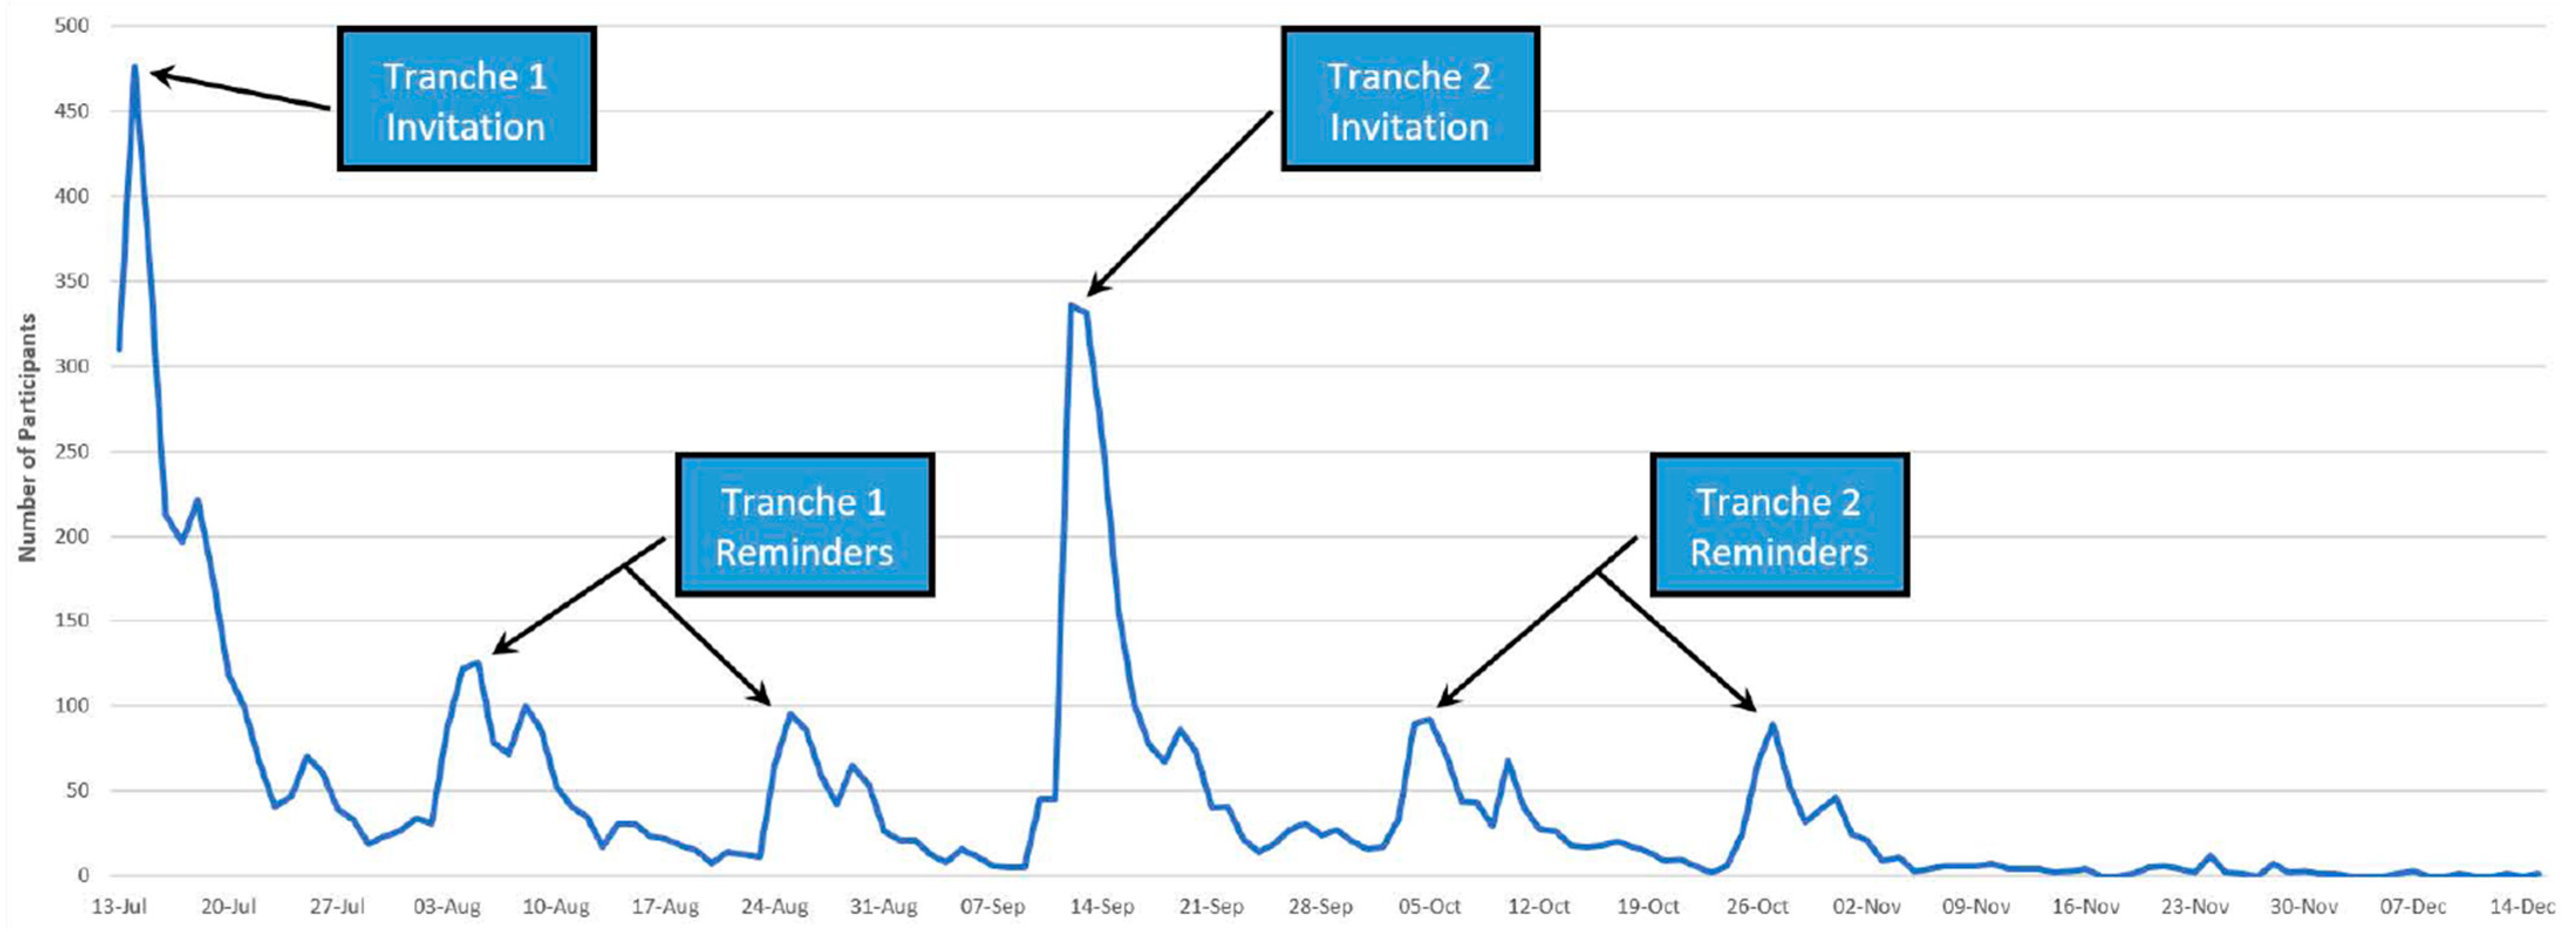
3.2. Participation Rate
3.3. Estimation of Sampling Error
3.4. Completion Rate
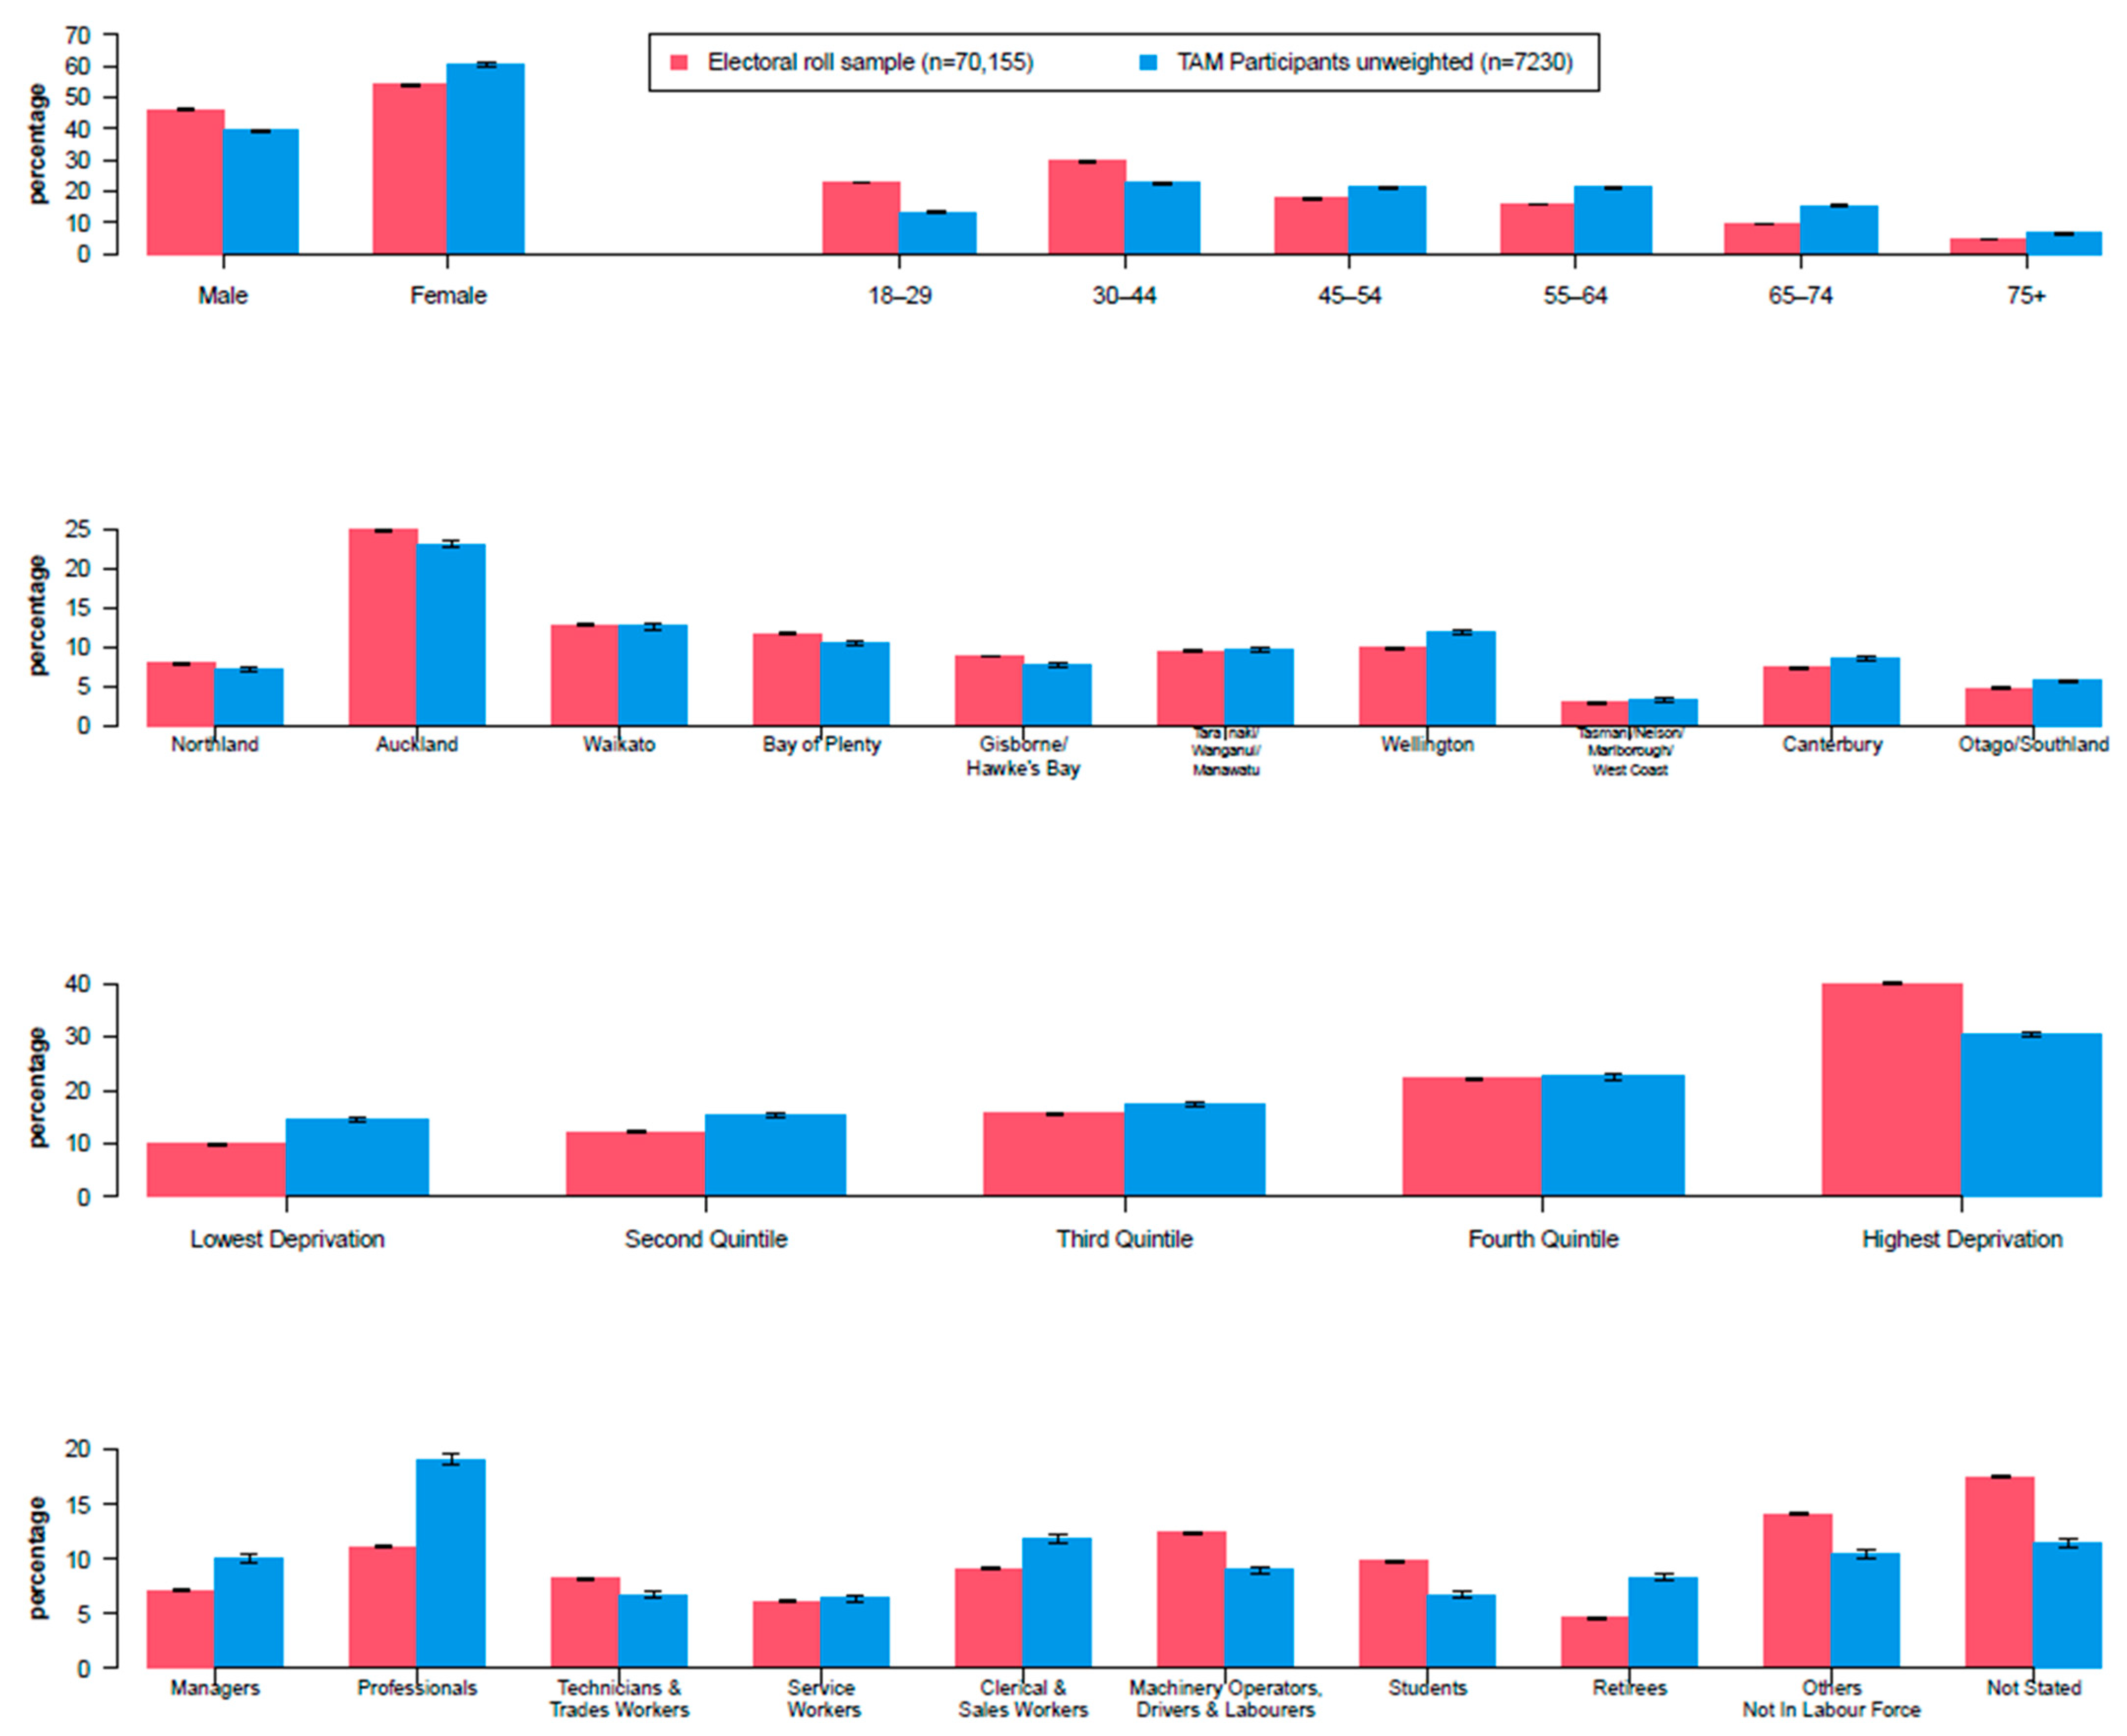
3.5. Sample Representativeness & Statistical Weighting
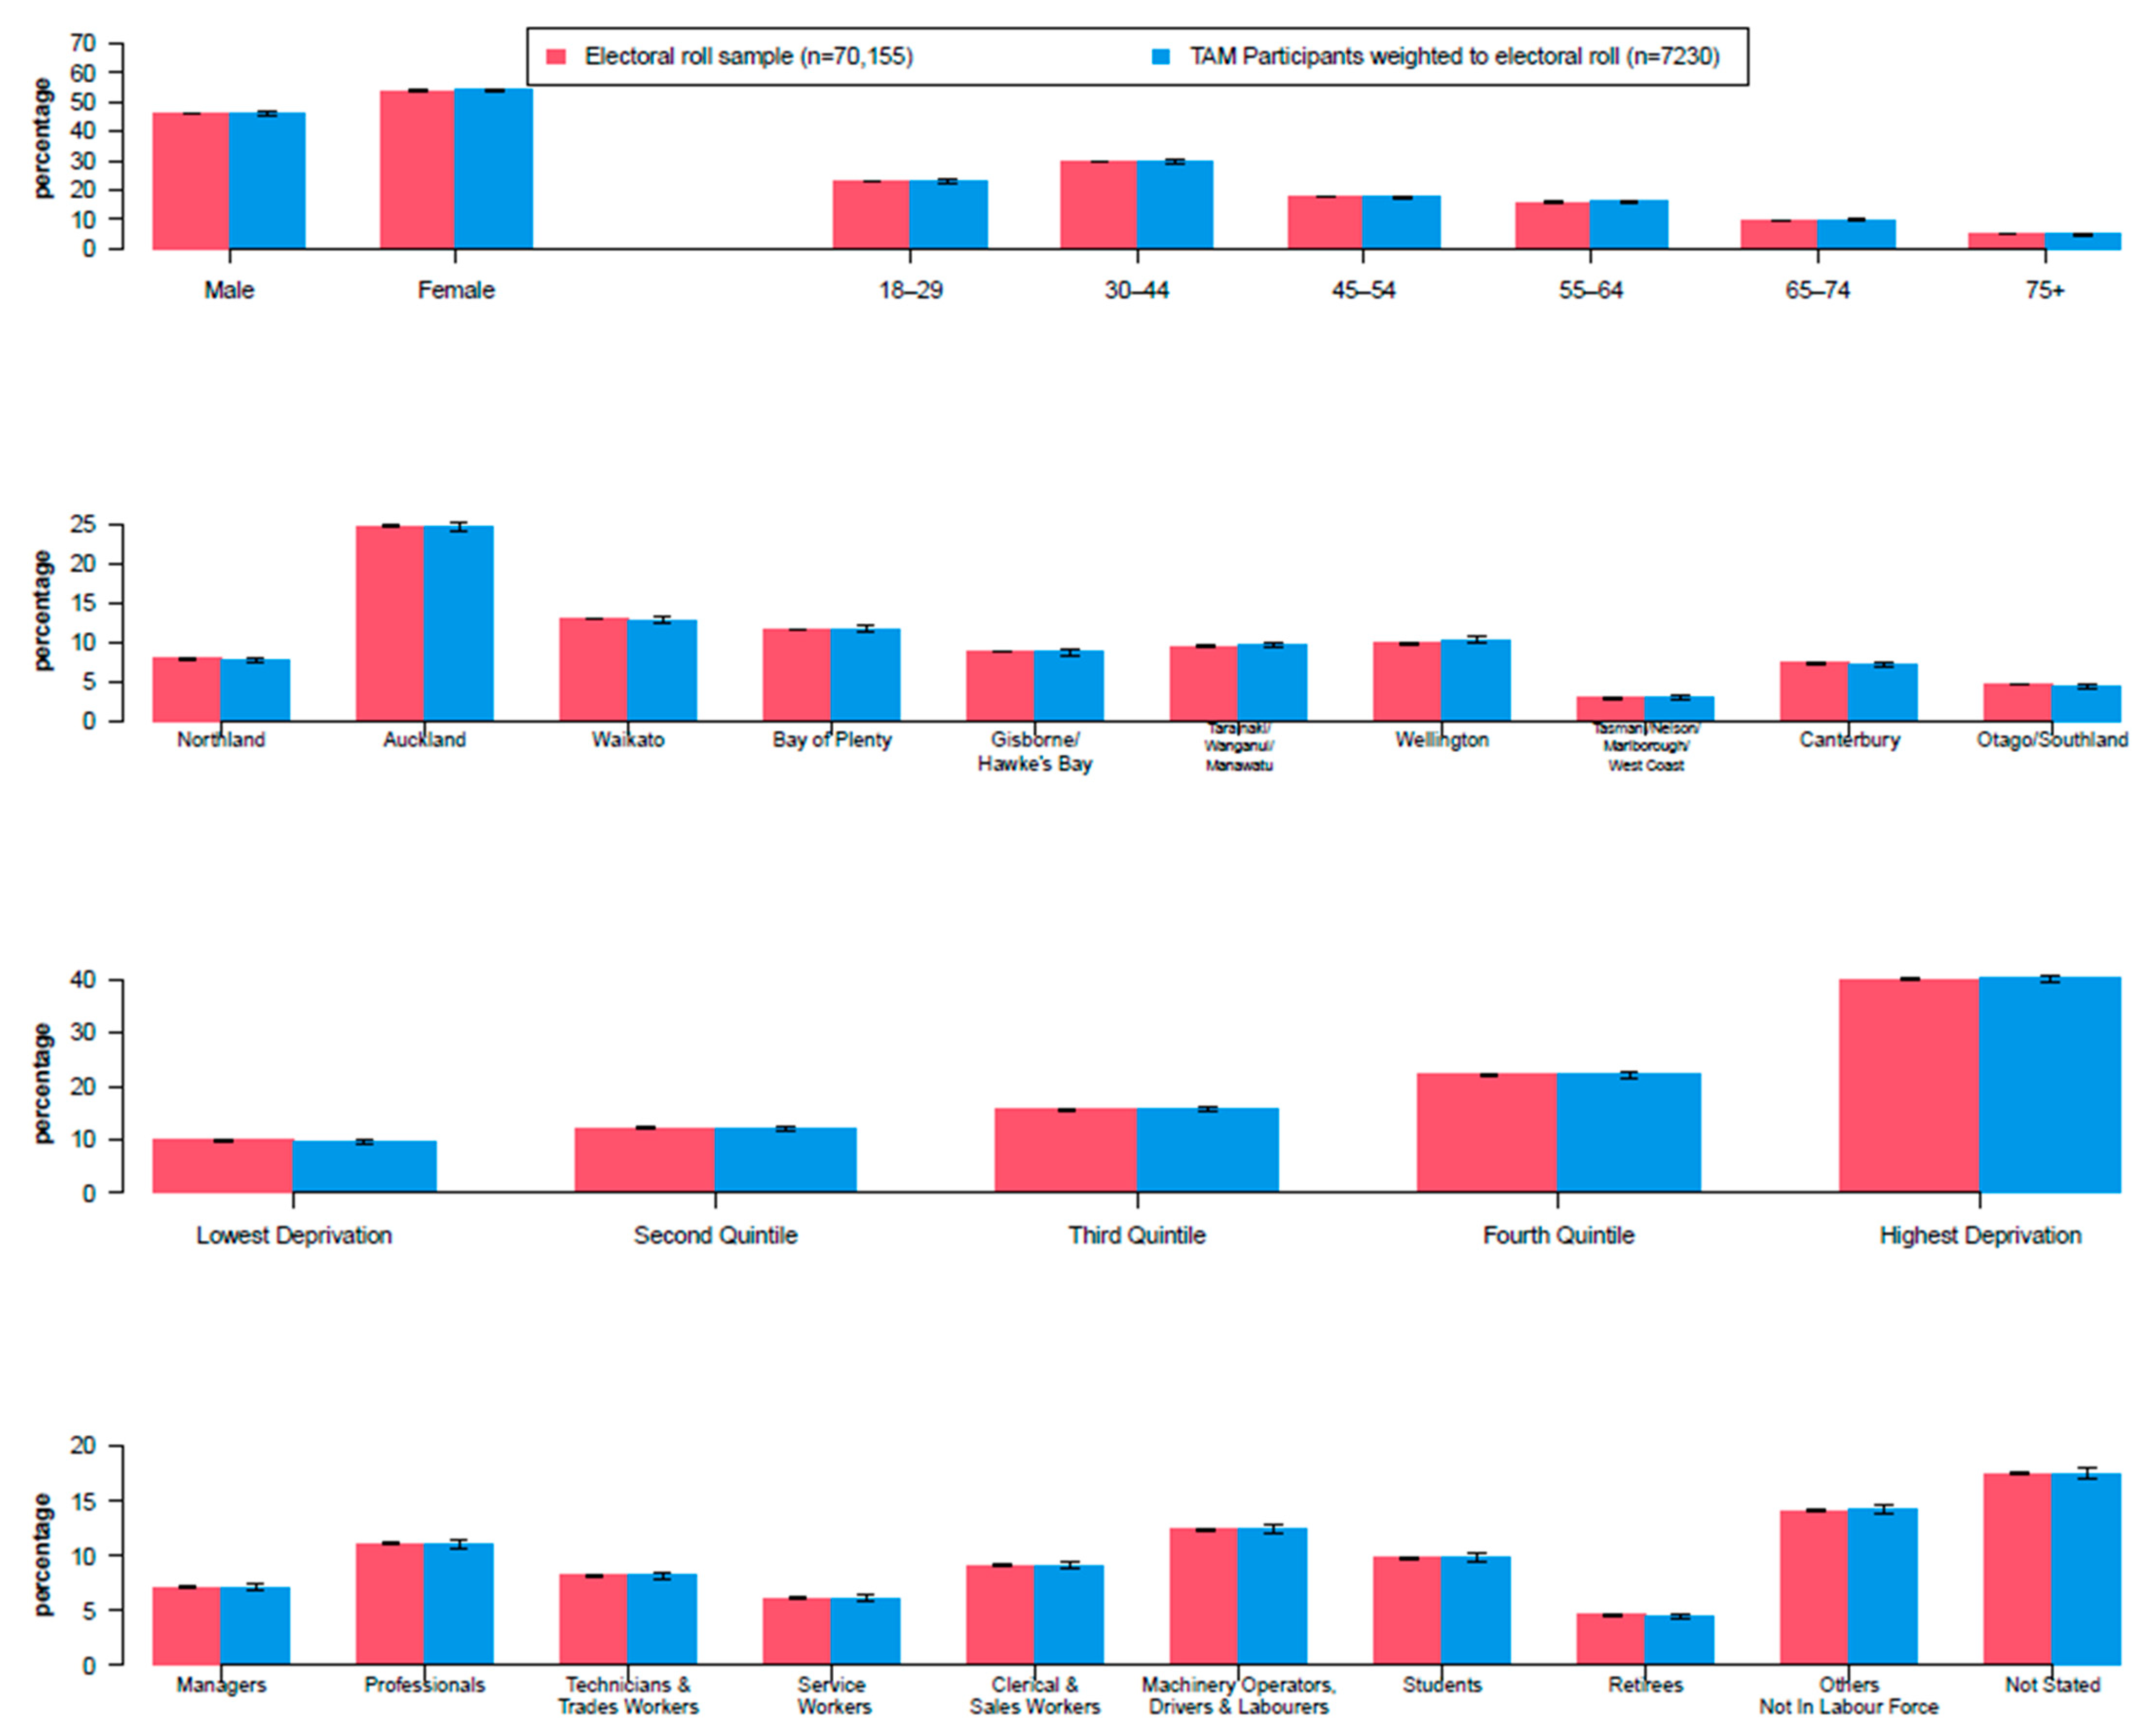
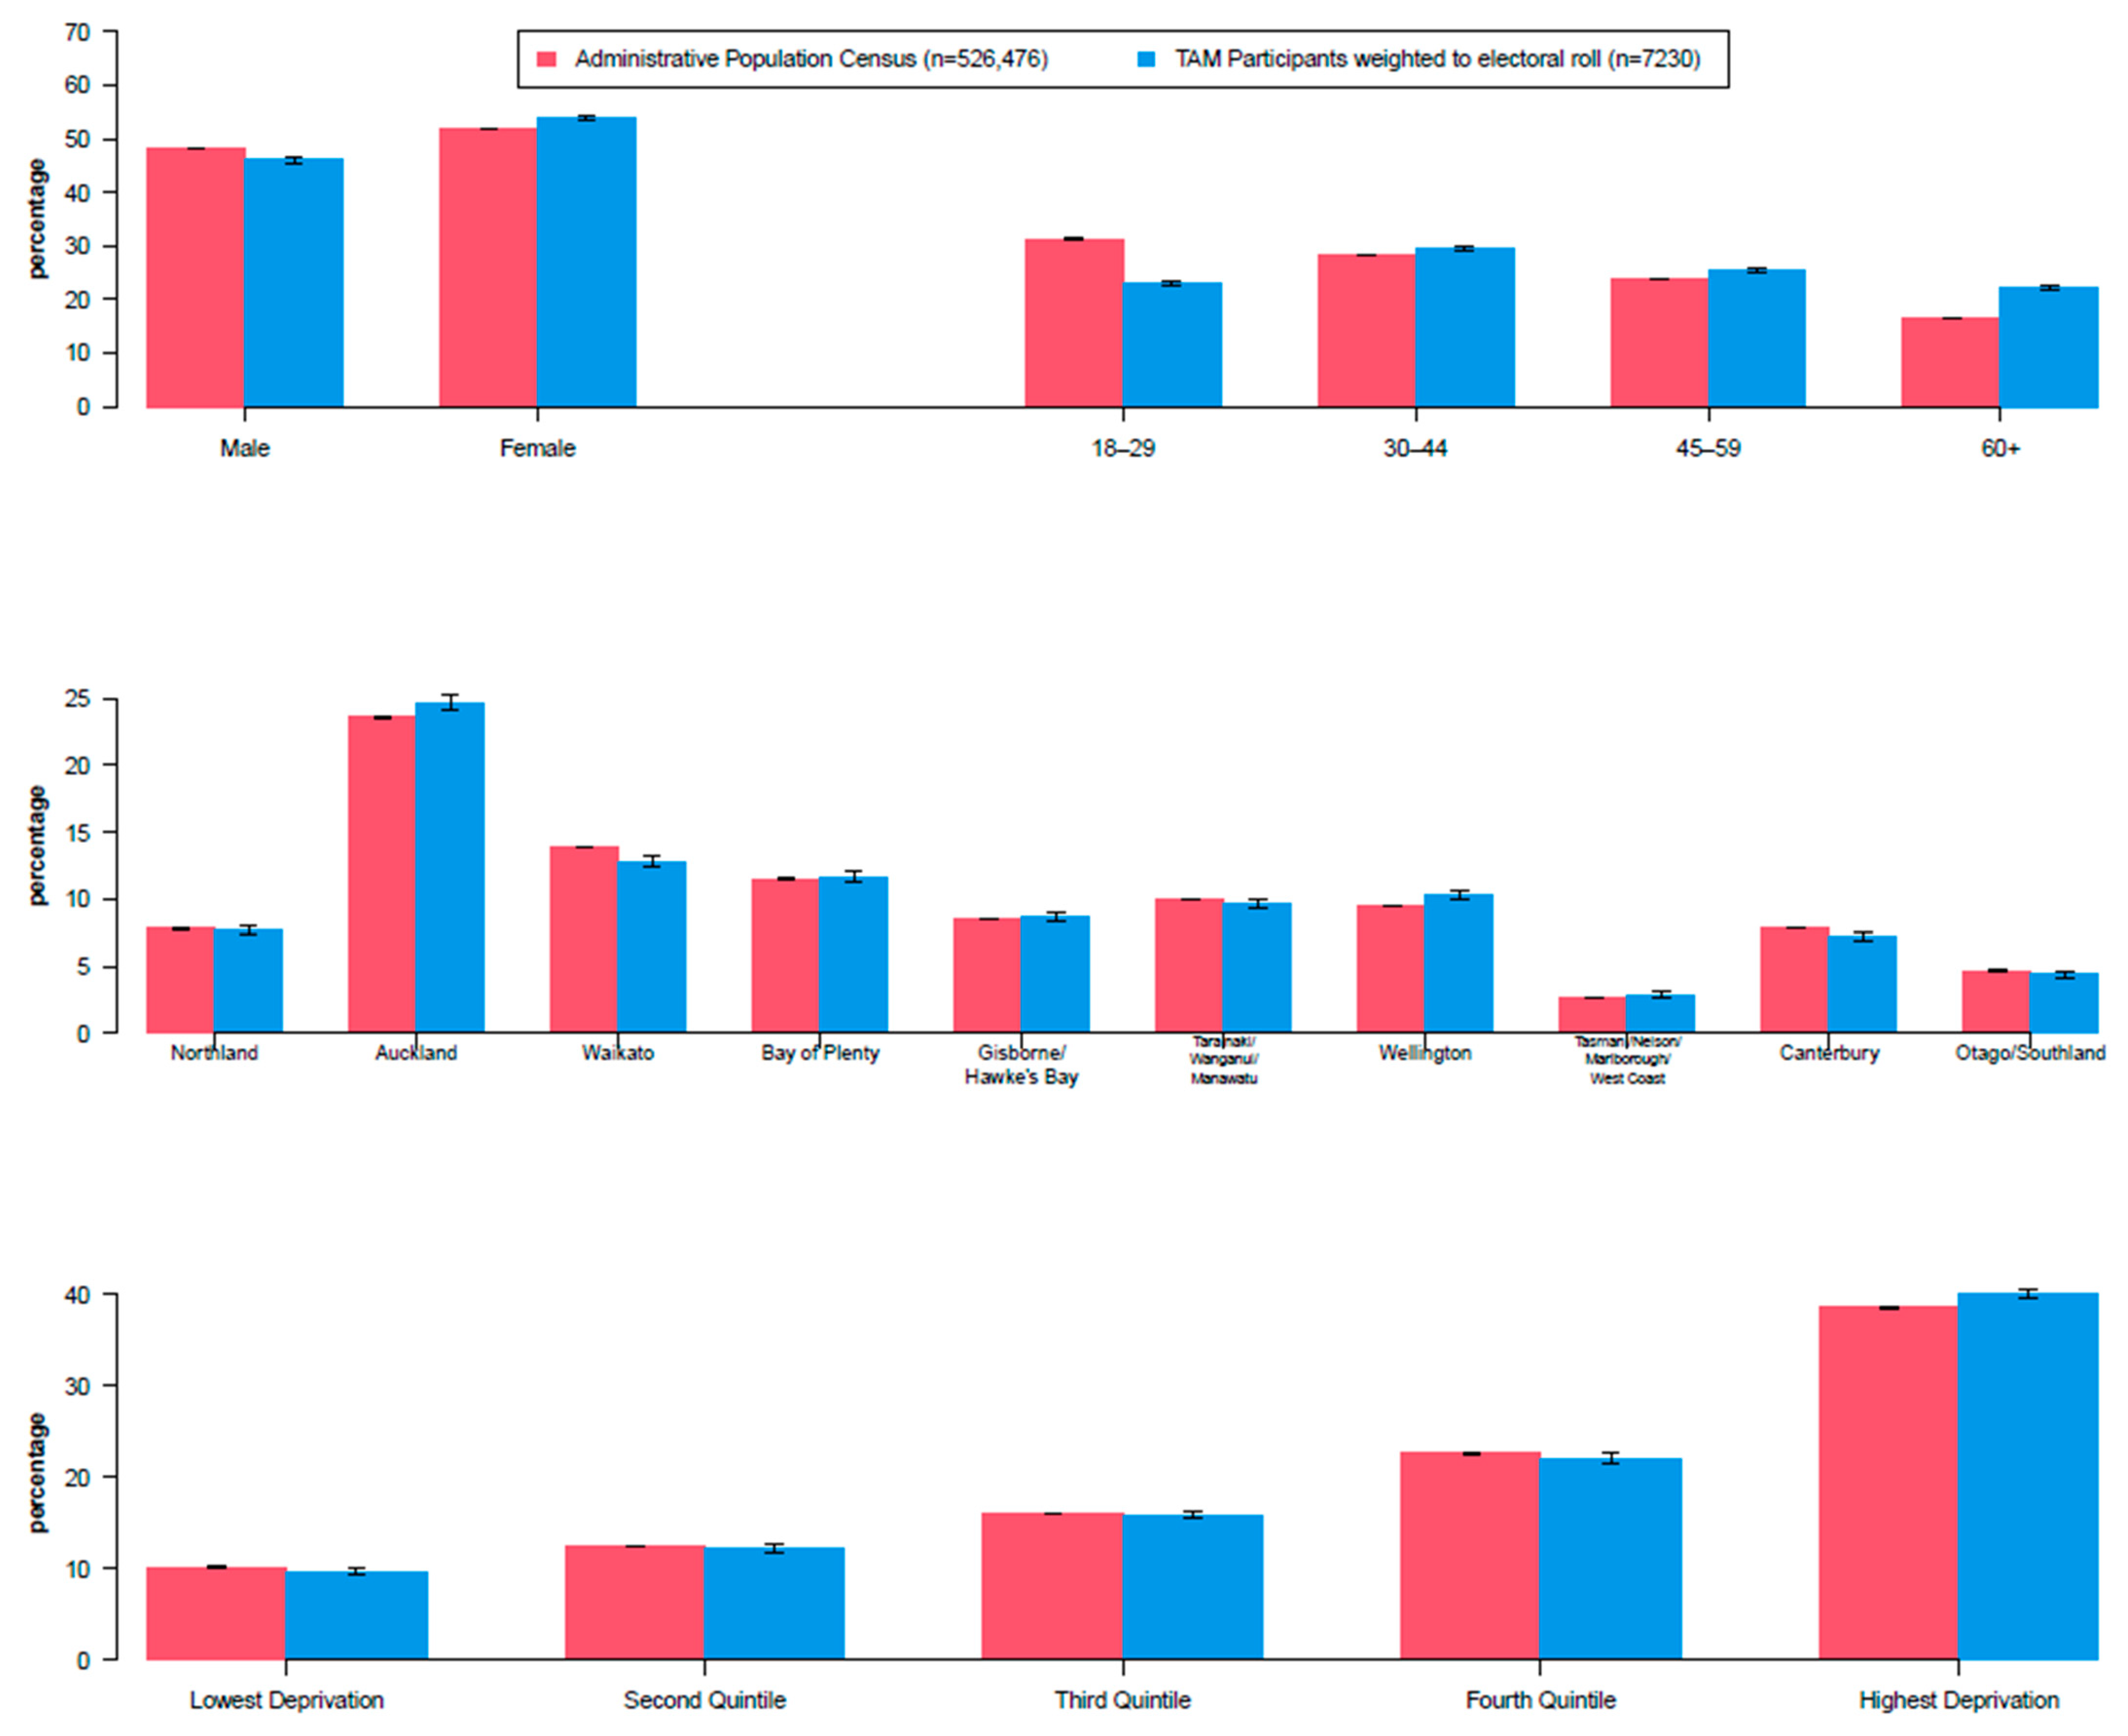
3.6. Weighting to Electoral Roll
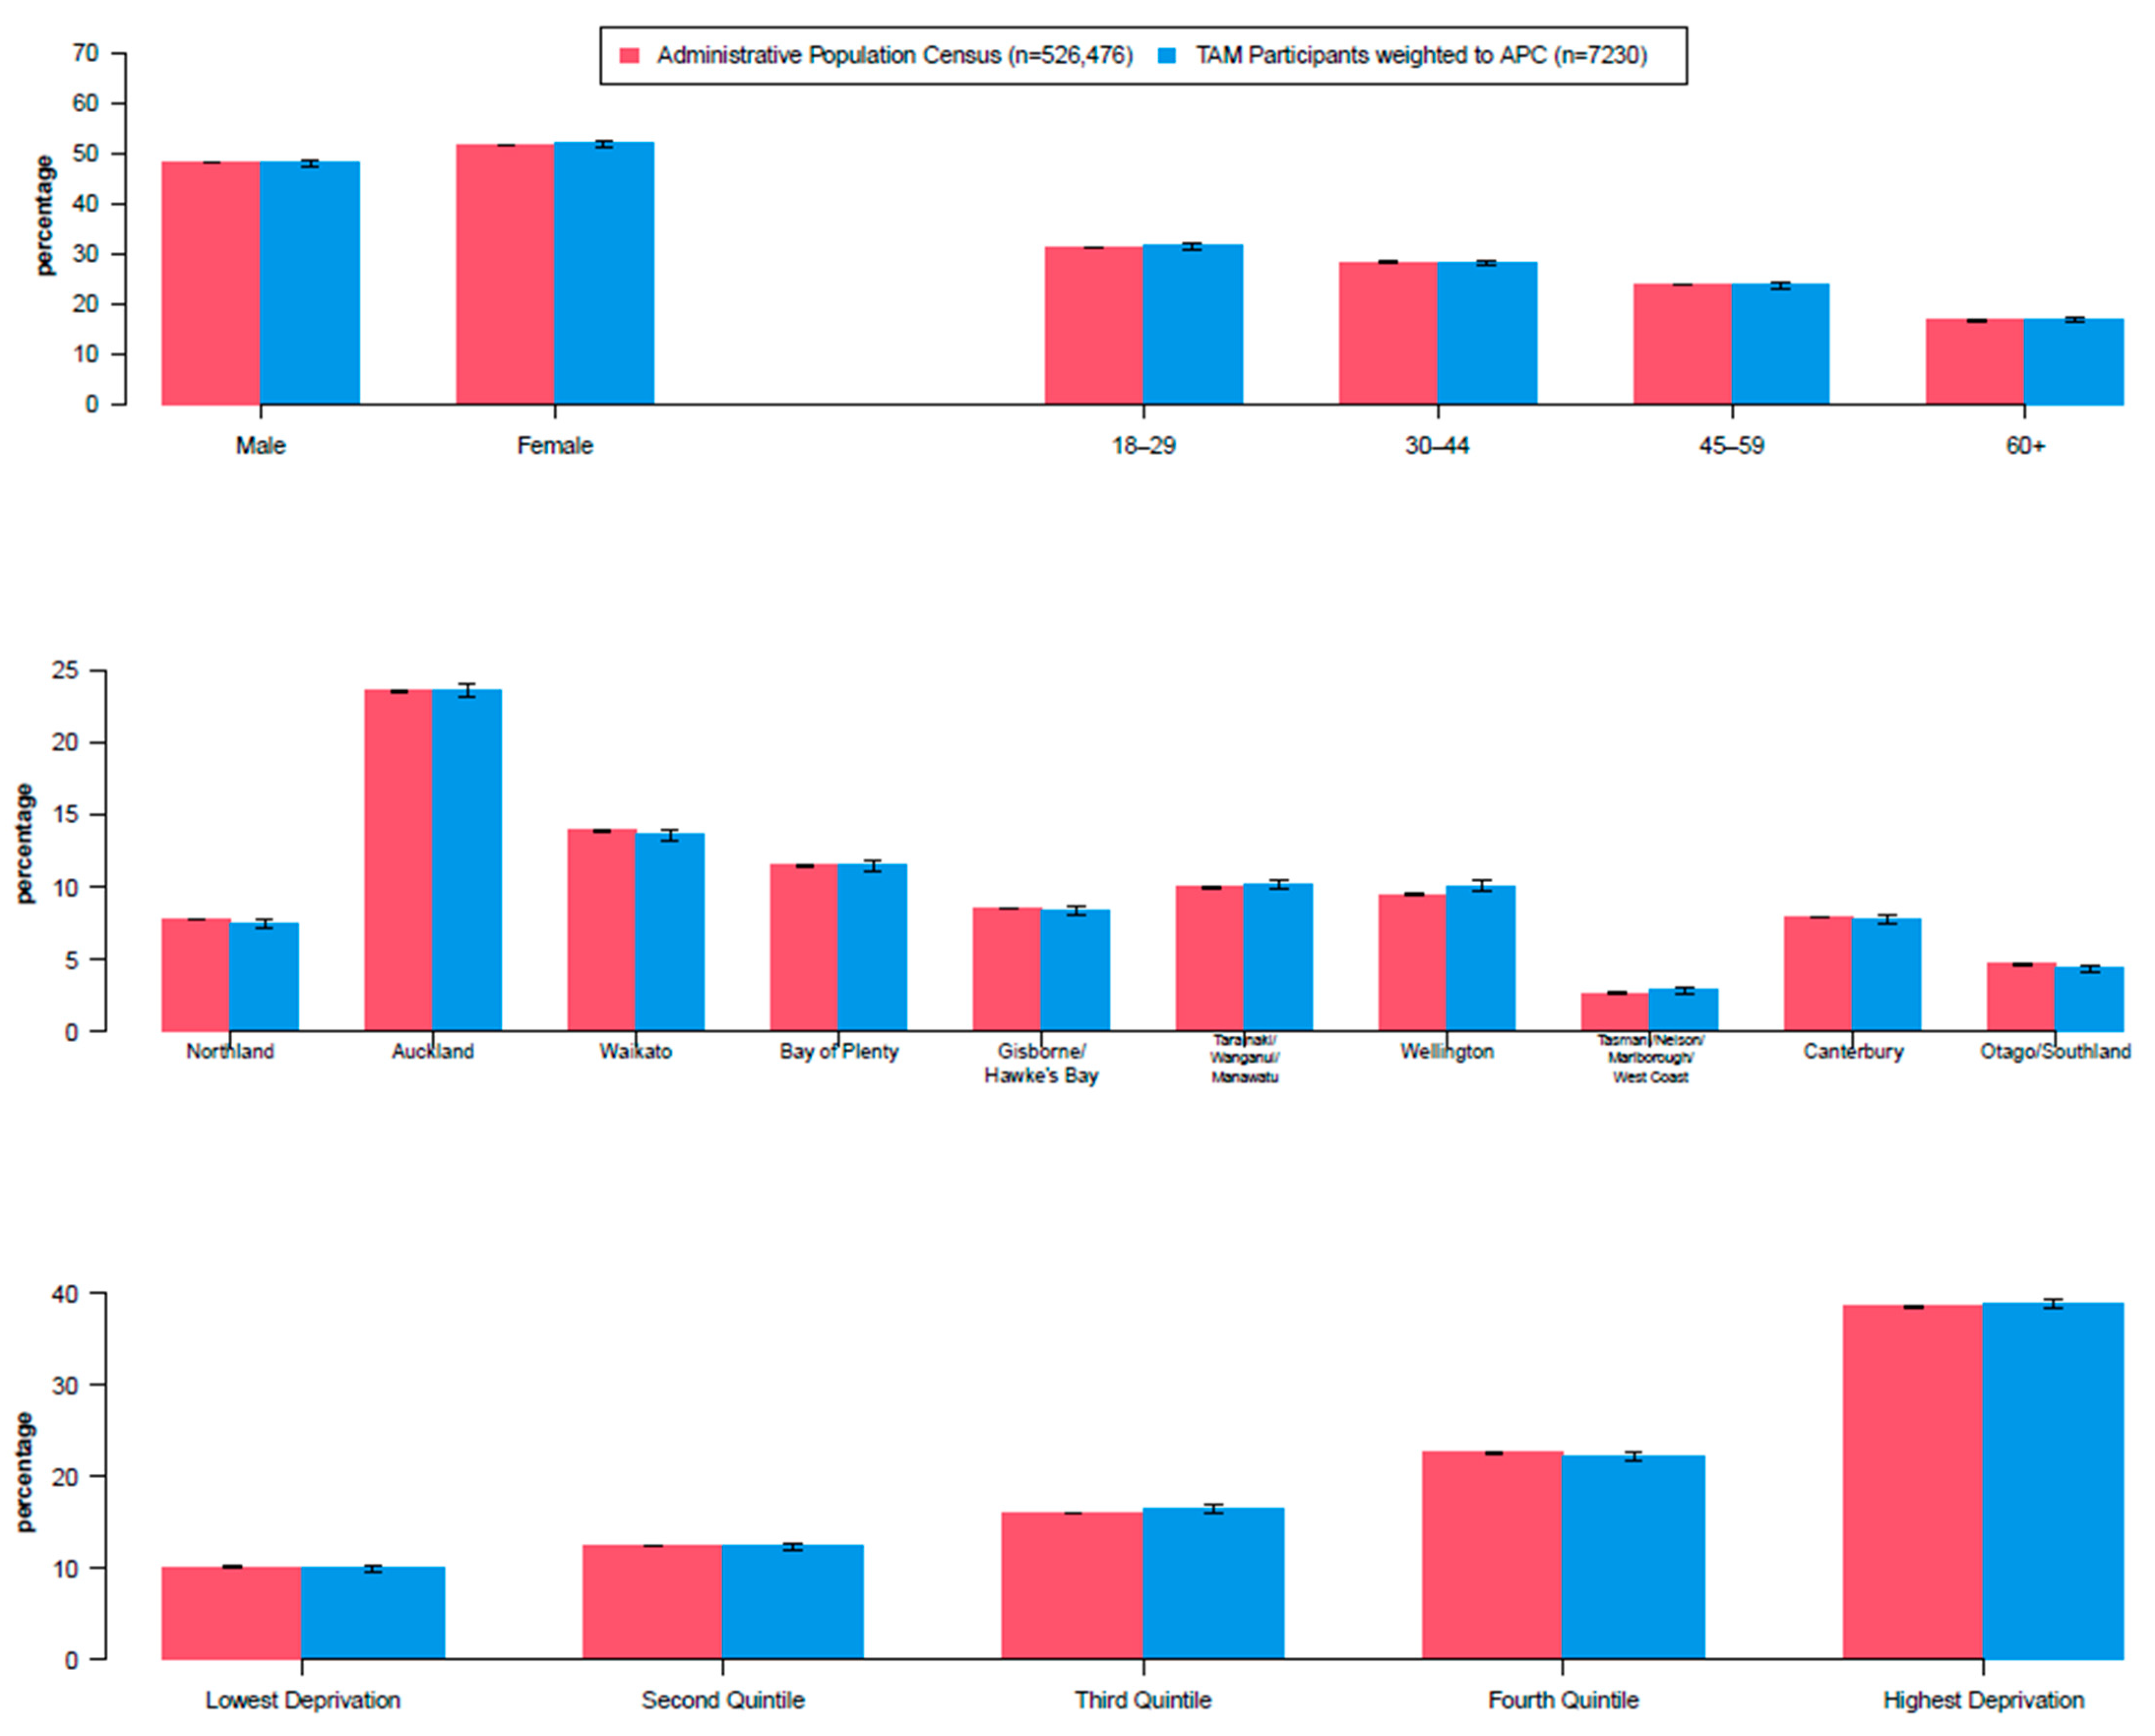
3.7. Weighting to the Administrative Population Census
4. Discussion
4.1. Sample Framework
4.2. Maximising Response Rate
4.3. Flexibility: Survey Modes and Formats
4.4. Weighting and Generalisability
5. Conclusions
Author Contributions
Funding
Institutional Review Board Statement
Informed Consent Statement
Data Availability Statement
Acknowledgments
Conflicts of Interest
Appendix A

| Kupu Māori or Term | Explanation or Meaning |
|---|---|
| Aotearoa | The Māori name for the nation state currently known as New Zealand. |
| Iwi | Extended kinship group, tribe, nation, people, nationality, race—often refers to a large group of people descended from a common ancestor and associated with a distinct territory. |
| Hauora | To be fit, well, healthy, vigorous, in good spirits. A Māori holistic conceptualisation of health that encompasses physical, mental/emotional, social and spiritual wellbeing. |
| Kaupapa | Topic, policy, matter for discussion, plan, purpose, scheme, proposal, agenda, subject or programme of work. |
| Kaupapa Māori Research | A holistic research methodology that is by Māori, for Māori and privileges te ao Māori |
| Karanga rua, karanga maha | Two identities, or multiple identities or (literally) callings |
| Kupu | Word, vocabulary, saying, talk, message, statement, utterance, lyric. |
| Māori | The indigenous people of Aotearoa, New Zealand. |
| Rohe | Boundary, district, region, territory, area, border (of land). |
| Rōpū | Group, party of people, company, gang, association, entourage, committee, organisation, category |
| Taonga | Treasure, anything prized |
| Te ao Māori | The Māori worldview |
| Te ao Mārama | The world of enlightenment. Pertains to the Māori creation story regarding the separation of Ranginui (sky father) and Papatūānuku (earth mother) to create, and thereby illuminate, the realm of the living. |
| Te Reo Māori | The indigenous language of Aotearoa, New Zealand. |
| Te Tiriti o Waitangi | Aotearoa New Zealand’s founding document, a partnership agreement between Māori and the British Crown, signed in 1840. |
| Tāngata whaikaha Māori | An umbrella Māori term for Māori with lived experience of disability; literally translated as ‘people in the pursuit of empowerment’. |
| Tāniko | Weaving pattern, border for cloaks, etc. made by finger weaving |
| Te Kupenga | Net, fishing net. The name of the Māori social survey. |
| Tikanga Māori | Māori customary values, customs, procedures and practices. |
| Wairua(tanga) | Spirituality |
| Wānanga | Gathering for a discussion or deliberation |
| Whakataukī | Māori proverb |
| Whakawhiti kōrero | A traditional process of discussion and negotiation |
| Whakawhanaungatanga | The process of establishing connection, building relationship, and relating well to others. |
| Whānau | Extended family, family group |
| Survey Section | Domain | Question Set Provenance |
|---|---|---|
| Section 1: Demographics | Ethnicity Iwi Age (year of birth) Region Gender Self-reported disability | Census 2018 Census 2018 Census 2018 Census 2018 What About Me 2021 Stats NZ 1 (planned for Census 2023) |
| Section 2: Māori identity | Whānau identity Whānau connectedness Te Reo Māori use Māori cultural participation Marae access Tūrangawaewae Harvesting (harakeke/kai) | Te Kupenga 2018 Te Kupenga 2018 Te Kupenga 2018 Te Kupenga 2018 Te Kupenga 2018 Te Kupenga 2018 Te Kupenga 2018 |
| Section 3: Inclusion and discrimination | Inclusion Structural discrimination Experienced discrimination Basis of discrimination Context of discrimination | Custom Custom Te Kupenga 2018 Te Kupenga 2018 Te Kupenga 2018 |
| Section 4: Health and wellbeing | Functional impairments: | |
| Washington Group Extended Set (WG-ES) Washington Group Extended Set (WG-ES) Washington Group Extended Set (WG-ES) Washington Group Extended Set (WG-ES) Washington Group Extended Set (WG-ES) Washington Group Extended Set (WG-ES) Washington Group Extended Set (WG-ES) Washington Group Extended Set (WG-ES) Washington Group Extended Set (WG-ES) Washington Group Extended Set (WG-ES) | |
| General health | NZ 1 Health Survey Adult Questionnaire 2019–2020 | |
| Access to te ao Māori | ||
Health and disability identity terms Preferred identity term | Custom Custom Custom Custom Custom Custom Custom Custom Custom Custom Custom Custom | |
| Section 5: Access to health services | Usual GP 2 clinic GP 2 access Unmet health need Dental care access Psychological care access | NZ 1 Health Survey Adult Questionnaire 2019–2020 NZ 1 Health Survey Adult Questionnaire 2019–2020 NZ 1 Health Survey Adult Questionnaire 2019–2020 NZ 1 Health Survey Adult Questionnaire 2019–2020 NZ 1 Health Survey Adult Questionnaire 2019–2020 |
| Section 6: Economics | Material wellbeing | NZ v Household Economic Survey (HES) 2019–2020 |

| Participants n (%) | Sampling Error (95% CI) | Electoral Roll Sample n (%) | Participant Over-/Under-Representation | |
|---|---|---|---|---|
| Gender | ||||
| Male | 2843 (39.3%) | (38.2–40.4%) | 32,318 (46.1%) | ↓ |
| Female | 4387 (60.7%) | (59.6–61.8%) | 37,837 (53.9%) | ↑ |
| Age group | ||||
| 18–29 | 948 (13.1%) | (12.3–13.9%) | 15,976 (22.8%) | ↓ |
| 30–44 | 1634 (22.6%) | (21.6–23.6%) | 20,727 (29.5%) | - |
| 45–54 | 1531 (21.2%) | (20.3–22.1%) | 12,355 (17.6%) | ↑ |
| 55–64 | 1531 (21.2%) | (20.3–22.1%) | 11,031 (15.7%) | ↑ |
| 65–74 | 1110 (15.4%) | (14.6–16.2%) | 6724 (9.6%) | ↑ |
| 75–84 | 405 (5.6%) | (5.1–6.1%) | 2679 (3.8%) | ↑ |
| 85+ | 69 (1.0%) | (0.8–1.2%) | 663 (0.9%) | - |
| Missing | 2 (<0.1%) | N/A | 0 (0.0%) | N/A |
| Region | ||||
| Northland | 518 (7.2%) | (6.6–7.8%) | 5555 (7.9%) | ↓ |
| Auckland | 1677 (23.2%) | (22.2–24.2%) | 17,374 (24.8%) | ↓ |
| Waikato | 912 (12.6%) | (11.8–13.4%) | 9105 (13.0%) | - |
| Bay of Plenty | 760 (10.5%) | (9.8–11.2%) | 8135 (11.6%) | ↓ |
| Gisborne | 177 (2.4%) | (2.0–2.8%) | 2214 (3.2%) | ↓ |
| Hawke’s Bay | 379 (5.2%) | (4.7–5.7%) | 3927 (5.6%) | - |
| Taranaki | 209 (2.9%) | (2.5–3.3%) | 1994 (2.8%) | - |
| Manawatū-Whanganui | 484 (6.7%) | (6.1–7.3%) | 4650 (6.6%) | - |
| Wellington | 862 (11.9%) | (11.2–12.6%) | 6908 (9.8%) | ↑ |
| Tasman | 63 (0.9%) | (0.7–1.1%) | 468 (0.7%) | - |
| Nelson | 57 (0.8%) | (0.6–1.0%) | 509 (0.7%) | - |
| Marlborough | 65 (0.9%) | (0.7–1.1%) | 576 (0.8%) | - |
| West Coast | 45 (0.6%) | (0.4–0.8%) | 381 (0.5%) | - |
| Canterbury | 616 (8.5%) | (7.9–9.1%) | 5112 (7.3%) | ↑ |
| Otago | 261 (3.6%) | (3.2–4.0%) | 1962 (2.8%) | ↑ |
| Southland | 145 (2.0%) | (1.7–2.3%) | 1285 (1.8%) | N/A |
| NZDep2018 | ||||
| Lowest deprivation | 1046 (14.5%) | (13.7–15.3%) | 6944 (9.9%) | ↑ |
| Second quintile | 1108 (15.4%) | (14.6–16.2%) | 8589 (12.2%) | ↑ |
| Third quintile | 1234 (17.1%) | (16.2–18.0%) | 10,942 (15.6%) | ↑ |
| Fourth quintile | 1621 (22.5%) | (21.5–23.5%) | 15,607 (22.2%) | - |
| Highest deprivation | 2190 (30.4%) | (29.3–31.5%) | 28,073 (40.0%) | ↓ |
| Missing | 31 (0.4%) | N/A | 0 (0.0%) | N/A |
| Urbanicity | ||||
| Major urban | 4283 (59.5%) | (58.3–60.5%) | 42,413 (60.5%) | - |
| Minor urban | 1606 (22.3%) | (21.3–23.3%) | 15,438 (22.0%) | - |
| Rural | 1310 (18.2%) | (17.3–19.1%) | 12,304 (17.5%) | - |
| Missing | 31 (0.4%) | N/A | 0 (0.0%) | N/A |
| Occupation | ||||
| Managers | 723 (10.1%) | (9.4–10.8%) | 5016 (7.1%) | ↑ |
| Professionals | 1371 (19.1%) | (18.2–20.0%) | 7790 (11.1%) | ↑ |
| Technicians and trades workers | 480 (6.7%) | (6.1–7.3%) | 5764 (8.2%) | ↓ |
| Community and personal service workers | 461 (6.4%) | (5.8–7.0%) | 4314 (6.1%) | - |
| Clerical and administrative workers | 645 (9.0%) | (8.3–9.7%) | 4294 (6.1%) | ↑ |
| Sales workers | 208 (2.9%) | (2.5–3.3%) | 2072 (3.0%) | - |
| Machinery operators and drivers | 233 (3.2%) | (2.8–3.6%) | 2961 (4.2%) | ↓ |
| Labourers | 417 (5.8%) | (5.3–6.3%) | 5715 (8.1%) | ↓ |
| Students | 478 (6.7%) | (6.1–7.3%) | 6853 (9.8%) | ↓ |
| Retirees | 599 (8.3%) | (7.7–8.9%) | 3241 (4.6%) | ↑ |
| Others not in labour Force | 745 (10.4%) | (9.7–11.1%) | 9869 (14.1%) | ↓ |
| Not stated | 817 (11.4%) | (10.7–12.1%) | 12,266 (17.5%) | ↓ |
| Missing | 53 (0.7%) | N/A | 0 (0.0%) | N/A |
| Total | 7230 (100%) | 70,155 (100%) |
| Interaction | Significance |
|---|---|
| Gender × age group | p < 0.001 |
| Gender × region | p = 0.678 |
| Gender × NZDep2018 | p = 0.032 |
| Gender × occupation | p = 0.001 |
| Age group × region | p = 0.469 |
| Age group × NZDep2018 | p = 0.207 |
| Age group × occupation | p <0.001 |
| Region × NZDep2018 | p = 0.018 |
| Region × occupation | p = 0.217 |
| NZDep2018 × occupation | p = 0.136 |
| Model Parameter | Odds Ratio (95% Confidence Interval) |
|---|---|
| Gender | |
| Male | Reference |
| Female | 1.526 (1.210–1.925) |
| Age group | |
| 18–29 years | Reference |
| 30–44 years | 1.217 (0.978–1.514) |
| 45–54 years | 1.933 (1.495–2.499) |
| 55–64 years | 2.460 (1.872–3.233) |
| 65–74 years | 3.125 (2.227–4.384) |
| 75+ years | 1.056 (0.477–2.337) |
| Region | |
| Northland | Reference |
| Auckland | 1.484 (0.865–2.546) |
| Waikato | 1.752 (0.991–3.100) |
| Bay of Plenty | 1.452 (0.813–2.591) |
| Hawke’s Bay/Gisborne | 1.738 (0.946–3.191) |
| Taranaki/Manawatū-Whanganui | 1.825 (1.008–3.307) |
| Wellington | 2.048 (1.186–3.537) |
| Tasman/Nelson/Marlborough/West Coast | 2.013 (1.073–3.776) |
| Canterbury | 1.691 (0.971–2.943) |
| Otago/Southland | 1.661 (0.935–2.950) |
| NZDep2018 quintile | |
| Q1—Low | Reference |
| Q2 | 0.975 (0.509–1.867) |
| Q3 | 1.244 (0.686–2.254) |
| Q4 | 1.068 (0.604–1.890) |
| Q5—High | 0.824 (0.477–1.424) |
| Occupation | |
| Not Stated | Reference |
| Managers | 1.602 (1.043–2.459) |
| Professionals | 1.974 (1.460–2.669) |
| Technicians and trades workers | 0.669 (0.453–0.986) |
| Community and personal service workers | 1.368 (0.949–1.972) |
| Clerical and sales workers | 1.525 (1.120–2.075) |
| Machinery operators, drivers, and labourers | 0.974 (0.710–1.337) |
| Students | 1.337 (1.054–1.696) |
| Retirees | – |
| Others not in labour force | 0.721 (0.494–1.054) |
| Gender × Age Group | |
| Male × 18–29 years | Reference |
| Female × 30–44 years | 1.028 (0.847–1.247) |
| Female × 45–54 years | 0.957 (0.779–1.174) |
| Female × 55–64 years | 0.721 (0.587–0.885) |
| Female × 65–74 years | 0.623 (0.495–0.784) |
| Female × 75+ years | 0.574 (0.417–0.788) |
| Gender × NZDep2018 | |
| Male × lowest deprivation | Reference |
| Female × second quintile | 1.082 (0.897–1.306) |
| Female × third quintile | 1.051 (0.875–1.262) |
| Female × fourth quintile | 1.181 (0.992–1.407) |
| Female × highest deprivation | 1.254 (1.060–1.484) |
| Gender × Occupation | |
| Male × not stated | Reference |
| Females × managers | 0.864 (0.687–1.088) |
| Females × professionals | 0.840 (0.686–1.029) |
| Females × technicians and trades workers | 1.137 (0.874–1.480) |
| Females × community and personal service workers | 0.785 (0.601–1.026) |
| Females × clerical and sales workers | 0.848 (0.676–1.064) |
| Females × machinery operators, drivers, and labourers | 0.994 (0.789–1.253) |
| Females × students | 0.866 (0.672–1.116) |
| Females × retirees | 0.981 (0.731–1.315) |
| Females × others not in labour force | 0.901 (0.706–1.149) |
| Age Group × Occupation | |
| 18–29 × not stated | Reference |
| 30–44 × managers | 0.884 (0.555–1.407) |
| 30–44 × professionals | 1.302 (0.950–1.785) |
| 30–44 × technicians and trades workers | 1.272 (0.814–1.988) |
| 30–44 × community and personal service workers | 1.003 (0.676–1.487) |
| 30–44 × clerical and sales workers | 1.286 (0.933–1.772) |
| 30–44 × machinery operators, drivers, and labourers | 0.900 (0.620–1.309) |
| 30–44 × students | 0.889 (0.671–1.177) |
| 30–44 × retirees | – |
| 30–44 × others not in labour force | 1.237 (0.839–1.823) |
| 45–54 × managers | 1.153 (0.721–1.843) |
| 45–54 × professionals | 1.092 (0.774–1.541) |
| 45–54 × technicians and trades workers | 1.875 (1.185–2.966) |
| 45–54 × community and personal service workers | 1.198 (0.793–1.811) |
| 45–54 × clerical and sales workers | 1.186 (0.836–1.683) |
| 45–54 × machinery operators, drivers, and labourers | 1.005 (0.682–1.482) |
| 45–54 × students | 0.704 (0.436–1.139) |
| 45–54 × retirees | – |
| 45–54 × others not in labour force | 1.306 (0.866–1.969) |
| 55–64 × managers | 1.146 (0.709–1.854) |
| 55–64 × professionals | 1.265 (0.883–1.814) |
| 55–64 × technicians and trades workers | 1.958 (1.225–3.129) |
| 55–64 × community and personal service workers | 1.206 (0.791–1.839) |
| 55–64 × clerical and sales workers | 1.183 (0.821–1.705) |
| 55–64 × machinery operators, drivers, and Labourers | 1.182 (0.801–1.745) |
| 55–64 × students | 1.128 (0.650–1.958) |
| 55–64 × retirees | – |
| 55–64 × others not in labour force | 1.506 (0.989–2.293) |
| 65–74 × managers | 1.228 (0.717–2.103) |
| 65–74 × professionals | 1.240 (0.811–1.896) |
| 65–74 × technicians and trades workers | 1.990 (1.171–3.383) |
| 65–74 × community and personal service workers | 1.052 (0.639–1.732) |
| 65–74 × clerical and sales workers | 1.178 (0.759–1.830) |
| 65–74 × machinery operators, drivers, and labourers | 1.123 (0.714–1.766) |
| 65–74 × students | 0.899 (0.333–2.431) |
| 65–74 × retirees | – |
| 65–74 × others not in labour force | 1.513 (0.937–2.445) |
| 75+ × managers | 3.880 (1.492–10.090) |
| 75+ × professionals | 2.503 (1.013–6.186) |
| 75+ × technicians and trades workers | 6.087 (2.240–16.538) |
| 75+ × community and personal service workers | 2.803 (0.977–8.038) |
| 75+ × clerical and sales workers | 3.098 (1.183–8.112) |
| 75+ × machinery operators, drivers, and labourers | 2.199 (0.838–5.771) |
| 75+ × students | 4.023 (0.404–40.029) |
| 75+ × retirees | – |
| 75+ × others not in labour force | 3.847 (1.600–9.247) |
| Region × NZDep2018 quintile | |
| Northland × lowest deprivation | Reference |
| Auckland × second quintile | 0.871 (0.448–1.695) |
| Auckland × third quintile | 0.679 (0.368–1.250) |
| Auckland × fourth quintile | 0.660 (0.366–1.187) |
| Auckland × highest deprivation | 0.606 (0.346–1.063) |
| Waikato × second quintile | 0.780 (0.384–1.583) |
| Waikato × third quintile | 0.578 (0.301–1.109) |
| Waikato × fourth quintile | 0.592 (0.318–1.100) |
| Waikato × highest deprivation | 0.567 (0.313–1.028) |
| Bay of Plenty × second quintile | 1.081 (0.526–2.224) |
| Bay of Plenty × third quintile | 0.595 (0.306–1.158) |
| Bay of Plenty × fourth quintile | 0.669 (0.356–1.260) |
| Bay of Plenty × highest deprivation | 0.599 (0.327–1.096) |
| Hawke’s Bay/Gisborne × second quintile | 0.761 (0.353–1.643) |
| Hawke’s Bay/Gisborne × third quintile | 0.472 (0.232–0.961) |
| Hawke’s Bay/Gisborne × fourth quintile | 0.625 (0.322–1.216) |
| Hawke’s Bay/Gisborne × highest deprivation | 0.509 (0.270–0.959) |
| Taranaki/Manawatū-Whanganui × second quintile | 0.795 (0.379–1.667) |
| Taranaki/Manawatū-Whanganui × third quintile | 0.574 (0.292–1.127) |
| Taranaki/Manawatū-Whanganui × fourth quintile | 0.490 (0.256–0.938) |
| Taranaki/Manawatū-Whanganui × highest deprivation | 0.646 (0.347–1.200) |
| Wellington × second quintile | 0.720 (0.364–1.424) |
| Wellington × third quintile | 0.569 (0.303–1.066) |
| Wellington × fourth quintile | 0.654 (0.358–1.197) |
| Wellington × highest deprivation | 0.523 (0.292–0.937) |
| Tasman/Nelson/Marlborough/West Coast × second quintile | 0.836 (0.377–1.856) |
| Tasman/Nelson/Marlborough/West Coast × third quintile | 0.542 (0.260–1.130) |
| Tasman/Nelson/Marlborough/West Coast × fourth quintile | 0.539 (0.264–1.099) |
| Tasman/Nelson/Marlborough/West Coast × highest deprivation | 0.360 (0.165–0.785) |
| Canterbury × second quintile | 0.934 (0.468–1.864) |
| Canterbury × third quintile | 0.540 (0.283–1.031) |
| Canterbury × fourth quintile | 0.586 (0.315–1.093) |
| Canterbury × fifth quintile | 0.969 (0.531–1.770) |
| Otago/Southland × second quintile | 1.043 (0.505–2.156) |
| Otago/Southland × third quintile | 0.773 (0.394–1.517) |
| Otago/Southland × fourth quintile | 0.741 (0.388–1.413) |
| Otago/Southland × highest deprivation | 0.779 (0.411–1.480) |


References
- World Health Organization. World Health Organization Global Report on Health Equity for Persons with Disabilities; World Health Organization: Geneva, Switzerland, 2022.
- Stienstra, D.; Nyerere, L. Race, ethnicity and disability: Charting complex and inter-sectional terrains. In Disability in the Global South: The Critical Handbook; Grech, S., Soldatic, K., Eds.; Springer: Cham, Switzerland, 2016; pp. 255–268. [Google Scholar]
- Statistics New Zealand. He hauā Māori: Findings from the 2013 Disability Survey; Statistics New Zealand: Wellington, New Zealand, 2015.
- Hollinsworth, D. Decolonizing Indigenous disability in Australia. Disabil. Soc. 2013, 28, 601–615. [Google Scholar] [CrossRef]
- Ingham, T.R.; Jones, B.; Perry, M.; King, P.T.; Baker, G.; Hickey, H.; Pouwhare, R.; Nikora, L.W. The Multidimensional Impacts of Inequities for Tangata Whaikaha Māori (Indigenous Māori with Lived Experience of Disability) in Aotearoa, New Zealand. Int. J. Environ. Res. Public Health 2022, 19, 13558. [Google Scholar] [CrossRef] [PubMed]
- Groce, N.E.; United Nations; Department of Economic and Social Affairs. Disability and the Millennium Development Goals: A Review of the MDG Process and Strategies for Inclusion of Disability Issues in Millennium Development Goal Efforts; United Nations: New York, NY, USA, 2011; p. 1. Available online: https://www.un.org/disabilities/documents/review_of_disability_and_the_mdgs.pdf (accessed on 10 May 2023).
- Kukutai, T.; Campbell-Kamariera, K.; Mead, A.; Mikaere, K.; Moses, C.; Whitehead, J.; Cormack, D. Māori Data Governance Model; Te Kāhui Raraunga: Rotorua, New Zealand, 2023. [Google Scholar]
- Wright, A.; Thurber, K.A.; Yap, M.; Du, W.; Banks, E.; Walker, J.; Irwin, F.; Sanders, W.; Lovett, R. Who responds? An examination of response rates to a national postal survey of Aboriginal and Torres Strait Islander adults, 2018–2019. BMC Med. Res. Methodol. 2020, 20, 149. [Google Scholar]
- Eysenbach, G. Improving the quality of Web surveys: The Checklist for Reporting Results of Internet E-Surveys (CHERRIES). J. Med. Internet Res. 2004, 6, e34. [Google Scholar] [CrossRef]
- Smith, L.T. Decolonising Methodologies: Research and Indigenous Peoples; Zed Books: London, UK, 1999. [Google Scholar]
- Smith, G.H. Kaupapa Māori: Theory and Praxis. Unpublished. Ph.D. Thesis, The University of Auckland, Auckland, New Zealand, 1997. [Google Scholar]
- Pihama, L.; Cram, F.; Walker, S.A. Creating Methodological Space: A Literature Review of Kaupapa Maori Research. Can. J. Nativ. Educ. 2002, 26, 30–43. [Google Scholar]
- Smith, G.H. Research Issues Related to Māori Education; The University of Auckland: Auckland, New Zealand, 1992. [Google Scholar]
- Jones, B.; Ingham, T.; Davies, C.; Cram, F. Whānau Tuatahi: Māori community partnership research using a Kaupapa Māori methodology. Mai Rev. 2010, 3, 1–14. [Google Scholar]
- Ingham, T.; Jones, B.; King, P.T.; Smiler, K.; Tuteao, H.; Baker, G.; Hickey, H. Decolonising Disability: Indigenous Māori Perspectives of Disability Research in the Modern Era. In Handbook of Disability; Rioux, M.H., Viera, J., Buettgen, A., Zubrow, E., Eds.; Springer: Singapore, 2022; pp. 1–22. [Google Scholar]
- Meade, H.M. Tikanga Māori: Living by Māori Values; Huia Publishers: Wellington, New Zealand, 2003. [Google Scholar]
- Hudson, M.; Milne, M.; Reynolds, P.; Russell, K.; Smith, B. Te Ara Tika: Guidelines for Māori Research Ethics: A Framework for Researchers and Ethics Committee Members; Health Research Council of New Zealand: Auckland, New Zealand, 2010.
- Jones, B.; King, P.T.; Baker, G.; Nikora, L.W.; Hickey, H.; Perry, M.; Pouwhare, R.T.; Ingham, T.R. Karanga rua, karanga maha: Māori with lived experience of disability self-determining their own identities. Kōtuitui N. Z. J. Soc. Sci. Online 2023. [Google Scholar] [CrossRef]
- Bowen, M.L.; Tillman, A.S. Developing Culturally Responsive Surveys. Am. J. Eval. 2014, 36, 25–41. [Google Scholar] [CrossRef]
- 20. Electoral Commission NZ. Enrolment by Māori Electorate; Electoral Commission: Wellington, New Zealand, 2023.
- Stats NZ Disability Survey: 2013. Available online: https://www.stats.govt.nz/information-releases/disability-survey-2013 (accessed on 10 May 2023).
- Accessibility Guidelines Working Group Web Content Accessibility Guidelines (WCAG) 2.1. Available online: https://www.w3.org/TR/WCAG21/ (accessed on 10 May 2023).
- New Zealand eScience Infrastructure (NeSI) NeSI Data Services. Available online: https://www.nesi.org.nz/about-us (accessed on 4 May 2023).
- Stats NZ Iwi and Iwi-Related Groups Statistical Classification V1.0.0. Available online: https://aria.stats.govt.nz/aria/#ClassificationView:uri=http://stats.govt.nz/cms/ClassificationVersion/QjykuWT5BTJrGdVs (accessed on 10 May 2023).
- Stats NZ. Experimental Administrative Population Census: Data Sources, Methods, and Quality (Second Iteration); Stats NZ: Wellington, New Zealand, 2022.
- Atkinson, J.; Salmond, C.; Crampton, P. NZDep2018 Index of Deprivation; University of Otago: Wellington, New Zealand, 2019. [Google Scholar]
- Australian Bureau of Statistics ANZSCO—Australian and New Zealand Standard Classification of Occupations. Available online: https://www.abs.gov.au/statistics/classifications/anzsco-australian-and-new-zealand-standard-classification-occupations/latest-release#cite-window1 (accessed on 11 May 2023).
- Bycroft, C.; Reid, G.; McNally, J.; Gleisner, F. Identifying Māori Populations Using Administrative Data: A Comparison with the Census; Statistics New Zealand: Wellington, New Zealand, 2016; pp. 1–29.
- Howell, S.C.; Quine, S.; Talley, N.J. Ethics review and use of reminder letters in postal surveys: Are current practices compromising an evidence-based approach? Med. J. Aust. 2003, 178, 43, discussion 43. [Google Scholar] [CrossRef]
- Qualtrics Your Guide to Margin of Error. Available online: https://www.qualtrics.com/au/experience-management/research/margin-of-error/ (accessed on 4 May 2023).
- Ministry of Health. Ministry of Health Methodology Report 2021/22: New Zealand Health Survey; Ministry of Health: Wellington, New Zealand, 2022; pp. 1–45.
- Stats NZ Te Kupenga. Available online: https://www.stats.govt.nz/information-releases/te-kupenga-2018-final-english (accessed on 4 May 2023).
- Greaves, L.M.; Lindsay Latimer, C.; Muriwai, E.; Moore, C.; Li, E.; Sporle, A.; Clark, T.C.; Milne, B.J. Māori and the Integrated Data Infrastructure: An assessment of the data system and suggestions to realise Māori data aspirations [Te Māori me te Integrated Data Infrastructure: He aromatawai i te pūnaha raraunga me ngā marohitanga e poipoia ai ngā wawata raraunga Māori]. J. R. Soc. N. Z. 2023, 1–17. [Google Scholar] [CrossRef]
- Greaves, L.M.; Hayward, J.; Barnett, D.; Crengle, S.; Clark, T.C. The predictors of Māori electoral roll choice and knowledge: Rangatahi Māori voter enrolment in a representative New Zealand youth survey. Kōtuitui N. Z. J. Soc. Sci. Online 2023, 18, 290–309. [Google Scholar] [CrossRef]
- Thabrew, H.; Aljawahiri, N.; Kumar, H.; Bowden, N.; Milne, B.; Prictor, M.; Jordan, V.; Breedvelt, J.; Shepherd, T.; Hetrick, S. ‘As long as it’s used for beneficial things’: An investigation of non-Māori, Māori and young people’s perceptions regarding the research use of the Aotearoa New Zealand Integrated Data Infrastructure (IDI). J. Empir. Res. Hum. Res. Ethics 2022, 17, 471–482. [Google Scholar] [CrossRef] [PubMed]
- Aljawahiri, N.; Thabrew, H. Ethical Implications of Using the IDI Database for Health Research; The University of Auckland: Auckland, New Zealand, 2019. [Google Scholar]
- Jamieson, L.; Hedges, J.; Peres, M.A.; Guarnizo-Herreno, C.C.; Bastos, J.L. Challenges in identifying indigenous peoples in population oral health surveys: A commentary. BMC Oral Health 2021, 21, 216. [Google Scholar] [CrossRef] [PubMed]
- De Leeuw, E.; de Heer, W. Trends in Household Survey Nonresponse: A Longitudinal and International Comparison. Surv. Nonresponse 2002, 41, 41–54. [Google Scholar]
- Houkamau, C.; Chris Sibley, C.; Henare, M. Te Rangahau o Te Tuakiri Māori Me Ngā Waiaro Ā-Pūtea: The Māori Identity and Financial Attitudes Study (MIFS). Mai J. 2019, 8, 142–158. [Google Scholar]
- Greaves, L.M.; Oldfield, L.D.; Von Randow, M.; Sibley, C.G.; Milne, B.J. How low can we go? Declining survey response rates to New Zealand electoral roll mail surveys over three decades. Political Sci. 2021, 72, 228–244. [Google Scholar]
- D’Souza, S.; von Randow, M.; Milne, B. Methods and Procedures for International Social Survey Programme (ISSP) 2021: Health & Healthcare II New Zealand. Available online: https://www.auckland.ac.nz/en/arts/our-research/research-institutes-centres-groups/compass/surveys/international-social-survey-programme.html (accessed on 10 May 2023).
- Singh, S.; Sagar, R. A critical look at online survey or questionnaire-based research studies during COVID-19. Asian J. Psychiatry 2021, 65, 102850. [Google Scholar] [CrossRef]
- Kelfve, S.; Kivi, M.; Johansson, B.; Lindwall, M. Going web or staying paper? The use of web-surveys among older people. BMC Med. Res. Methodol. 2020, 20, 252. [Google Scholar]
- Digital Government Digital Inclusion and Wellbeing in New Zealand. Available online: https://www.digital.govt.nz/digital-government/about-digital-government/ (accessed on 19 May 2023).
- Menon, V.; Muraleedharan, A. Internet-based surveys: Relevance, methodological considerations and troubleshooting strategies. Gen. Psychiatry 2020, 33, e100264. [Google Scholar] [CrossRef]
- Jäckle, A.; Roberts, C.; Lynn, P. Assessing the effect of data collection mode on measurement. Int. Stat. Rev. 2010, 78, 3–20. [Google Scholar] [CrossRef]
- De Leeuw, E.D. To mix or not to mix data collection modes in surveys. J. Off. Stat. 2005, 21, 233–255. [Google Scholar]
- Electoral Commission. Access 2020: Electoral Commission Disability Strategy; Electoral Commission: Wellington, New Zealand, 2020.
- Berg, N. Non-Response Bias. In Encyclopedia of Social Measurement; 2005; 2, pp. 865–873. Available online: https://ssrn.com/abstract=1691967 (accessed on 10 May 2023).
- Stats NZ. Assessment of Potential Bias in the Te Kupenga Sample Frame: 2018; Stats NZ: Wellington, New Zealand, 2020.

| Invitation Tranche | Date | Number (Crude Response Rate %) |
|---|---|---|
| First sample invitation letters | 12 July 2022 | 40,157 |
| First sample reminder postcard 1 | 2 August 2022 | 36,664 |
| First sample reminder postcard 2 | 23 August 2022 | 35,065 |
| First sample paper questionnaires | Various, as requested | 98 |
| First sample total responses | By 16 December 2022 | 4311 (10.7%) |
| Second sample invitation letters | 8 September 2022 | 29,998 |
| Second sample reminder postcard 1 | 29 September 2022 | 27,269 |
| Second sample reminder postcard 2 | 20 October 2022 | 24,222 |
| Second sample paper questionnaires | Various, as requested | 119 |
| Second sample total responses | By 16 December 2022 | 2866 (9.6%) |
| Online Responses (% of Responses) | Phone Responses (% of Responses) | Paper Responses (% of Responses) | All Alternate Modes n (% Total) | |
|---|---|---|---|---|
| Gender | ||||
| Male | 2589 (38.7%) | 185 (46.5%) | 69 (48.9%) | 254 (8.9%) |
| Female | 4102 (61.3%) | 213 (53.5%) | 72 (51.1%) | 285 (6.5%) |
| Age group | ||||
| 18–29 | 941 (14.1%) | 7 (1.8%) | - | 7 (0.7%) |
| 30–44 | 1610 (24.1%) | 21 (5.3%) | 3 (2.1%) | 24 (1.5%) |
| 45–54 | 1489 (22.3%) | 39 (9.8%) | 3 (2.1%) | 42 (2.7%) |
| 55–64 | 1399 (20.9%) | 107 (26.9%) | 25 (17.7%) | 132 (8.6%) |
| 65–74 | 931 (13.9%) | 130 (32.7%) | 49 (34.8%) | 179 (16.1%) |
| 75+ | 319 (4.8%) | 94 (23.6%) | 61 (43.3%) | 155 (32.7%) |
| Region | ||||
| Northland | 477 (7.1%) | 28 (7.0%) | 13 (9.2%) | 41 (7.9%) |
| Auckland | 1557 (23.3%) | 88 (22.1%) | 32 (22.7%) | 120 (7.2%) |
| Waikato | 843 (12.6%) | 50 (12.6%) | 19 (13.5%) | 69 (7.6%) |
| Bay of Plenty | 696 (10.4%) | 52 (13.1%) | 12 (8.5%) | 64 (8.4%) |
| Gisborne | 157 (2.3%) | 15 (3.8%) | 5 (3.5%) | 20 (11.3%) |
| Hawke’s Bay | 347 (5.2%) | 23 (5.8%) | 9 (6.4%) | 32 (8.4%) |
| Taranaki | 190 (2.8%) | 16 (4.0%) | 3 (2.1%) | 19 (9.1%) |
| Manawatū-Whanganui | 442 (6.6%) | 29 (7.3%) | 13 (9.2%) | 42 (8.7%) |
| Wellington | 813 (12.2%) | 37 (9.3%) | 12 (8.5%) | 49 (5.7%) |
| Tasman | 60 (0.9%) | 2 (0.5%) | 1 (0.7%) | 3 (4.8%) |
| Nelson | 56 (0.8%) | 1 (0.3%) | - | 1 (1.8%) |
| Marlborough | 58 (0.9%) | 6 (1.5%) | 1 (0.7%) | 7 (10.8%) |
| West Coast | 41 (0.6%) | 2 (0.5%) | 2 (1.4%) | 4 (8.9%) |
| Canterbury | 577 (8.6%) | 29 (7.3%) | 10 (7.1%) | 39 (6.3%) |
| Otago | 244 (3.6%) | 12 (3.0%) | 5 (3.5%) | 17 (6.5%) |
| Southland | 133 (2.0%) | 8 (2.0%) | 4 (2.8%) | 12 (8.3%) |
| Urbanicity | ||||
| Major urban | 3989 (59.8%) | 224 (57.1%) | 70 (49.6%) | 294 (6.9%) |
| Minor urban | 1468 (22.0%) | 104 (26.5%) | 34 (24.1%) | 138 (8.6%) |
| Rural | 1209 (18.1%) | 64 (16.3%) | 37 (26.2%) | 101 (7.7%) |
| NZDep2018 | ||||
| Lowest deprivation | 1010 (15.2%) | 23 (5.9%) | 13 (9.2%) | 36 (3.4%) |
| Second quintile | 1053 (15.8%) | 39 (9.9%) | 16 (11.3%) | 55 (5.0%) |
| Third quintile | 1164 (17.5%) | 45 (11.5%) | 25 (17.7%) | 70 (5.7%) |
| Fourth quintile | 1492 (22.4%) | 93 (23.7%) | 36 (25.5%) | 129 (8.0%) |
| Highest deprivation | 1947 (29.2%) | 192 (49.0%) | 51 (36.2%) | 243 (11.1%) |
| Occupation | ||||
| Managers | 700 (10.5%) | 18 (4.6%) | 5 (3.5%) | 23 (3.2%) |
| Professionals | 1334 (20.1%) | 30 (7.7%) | 7 (5.0%) | 37 (2.7%) |
| Technicians and trades workers | 448 (6.7%) | 20 (5.1%) | 12 (8.5%) | 32 (6.7%) |
| Community and personal service workers | 425 (6.4%) | 30 (7.7%) | 6 (4.3%) | 36 (7.8%) |
| Clerical workers | 626 (9.4%) | 16 (4.1%) | 3 (2.1%) | 19 (2.9%) |
| Sales workers | 204 (3.1%) | 3 (0.8%) | 1 (0.7%) | 4 (1.9%) |
| Machinery operators and drivers | 212 (3.2%) | 16 (4.1%) | 5 (3.5%) | 21 (9.0%) |
| Labourers | 384 (5.8%) | 24 (6.2%) | 9 (6.4%) | 33 (7.9%) |
| Students | 469 (7.1%) | 7 (1.8%) | 2 (1.4%) | 9 (1.9%) |
| Retirees | 442 (6.7%) | 101 (25.9%) | 56 (39.7%) | 157 (26.2%) |
| Others Not in labour force | 617 (9.3%) | 101 (25.9%) | 27 (19.1%) | 128 (17.2%) |
| Not stated | 785 (11.8%) | 24 (6.2%) | 8 (5.7%) | 32 (3.9%) |
| Self-identified disability | ||||
| Yes | 1281 (19.2%) | 206 (52.0%) | 59 (44.0%) | 265 (17.1%) |
| No | 5399 (80.8%) | 190 (48.0%) | 75 (56.0%) | 265 (4.7%) |
Disclaimer/Publisher’s Note: The statements, opinions and data contained in all publications are solely those of the individual author(s) and contributor(s) and not of MDPI and/or the editor(s). MDPI and/or the editor(s) disclaim responsibility for any injury to people or property resulting from any ideas, methods, instructions or products referred to in the content. |
© 2023 by the authors. Licensee MDPI, Basel, Switzerland. This article is an open access article distributed under the terms and conditions of the Creative Commons Attribution (CC BY) license (https://creativecommons.org/licenses/by/4.0/).
Share and Cite
Ingham, T.R.; Jones, B.; Perry, M.; von Randow, M.; Milne, B.; King, P.T.; Nikora, L.W.; Sporle, A.; Te Ao Mārama Study Group. Measuring Māori Health, Wellbeing, and Disability in Aotearoa Using a Web-Based Survey Methodology. Int. J. Environ. Res. Public Health 2023, 20, 6797. https://doi.org/10.3390/ijerph20186797
Ingham TR, Jones B, Perry M, von Randow M, Milne B, King PT, Nikora LW, Sporle A, Te Ao Mārama Study Group. Measuring Māori Health, Wellbeing, and Disability in Aotearoa Using a Web-Based Survey Methodology. International Journal of Environmental Research and Public Health. 2023; 20(18):6797. https://doi.org/10.3390/ijerph20186797
Chicago/Turabian StyleIngham, Tristram R., Bernadette Jones, Meredith Perry, Martin von Randow, Barry Milne, Paula T. King, Linda W. Nikora, Andrew Sporle, and Te Ao Mārama Study Group. 2023. "Measuring Māori Health, Wellbeing, and Disability in Aotearoa Using a Web-Based Survey Methodology" International Journal of Environmental Research and Public Health 20, no. 18: 6797. https://doi.org/10.3390/ijerph20186797
APA StyleIngham, T. R., Jones, B., Perry, M., von Randow, M., Milne, B., King, P. T., Nikora, L. W., Sporle, A., & Te Ao Mārama Study Group. (2023). Measuring Māori Health, Wellbeing, and Disability in Aotearoa Using a Web-Based Survey Methodology. International Journal of Environmental Research and Public Health, 20(18), 6797. https://doi.org/10.3390/ijerph20186797