1. Introduction
With the growing interest in climate change and extreme weather, researchers have explored the response and adaptation to climate change, with particular emphasis on vulnerable areas. With global warming increasing, heatwaves have also been intensifying, causing many heat-related illnesses and deaths. From 1973 to 2019, the daily maximum temperature and number of heatwave days (daily maximum temperature > 33 °C, definition of heat wave by the Korea Meteorological Administration by 2020) increased by 1.5 °C and 6.9 days, respectively. In 2018, when heatwaves were designated as natural disasters, 31.5 heatwave days were recorded, three times greater than the yearly average (10.5) from 1986 to 2017 [
1]. Specifically, the average numbers of heatwave-induced illnesses and deaths per year between 2011 and 2017 were 1132 and 11, respectively, and by 2018 these values had considerably increased to 4526 and 48, respectively [
2]. Climate change is expected to further exacerbate the severity of heatwaves, as it is expected that the global average temperature will increase by 1.9–5.2 °C by the end of the 21st century [
3], with the annual frequency of heatwaves increasing two- to seven-fold by 2050 [
4]. Such an increase in heatwave frequency and intensity will cause inevitable damage to society, including the loss of human lives and health, and economic losses. For example, human casualties caused by heatwaves and droughts accounted for 91.6% of weather-related disasters from the late 1980s to 2003 in the US, and an estimated 35,000 deaths and over USD 13 billion in damage occurred in Europe in 2003 during severe heatwaves [
5]. In particular, when the daily maximum temperatures exceed 33 °C, the mortality rate tends to sharply increase [
6]. Heatwaves cause heat-related illnesses, such as allergies, asthma, exhaustion, fainting, and dehydration [
6]; they also increase the incidence of various diseases by weakening the body’s thermoregulatory function [
7]. Numerous studies have related heatwave damage to vulnerable populations; for example, in an Australian study, it was reported that a considerable number of elderly persons died as a result of heatwaves compared with other age groups [
8]. Further, because there are differences in the incidence of heat-related illnesses between rural and urban areas, it has also been shown that heatwave damages differ by global region [
9]. From a regional perspective, heatwave-related damage occurs disproportionately, even in regions belonging to a single administrative space [
10]. To achieve more effective adaptation and response to heatwaves, comprehensive approaches considering regional characteristics in various fields are required [
11].
In Dhaka, the capital of Bangladesh, a study was conducted to analyze the mitigation of urban heat island effects and the maintenance of thermal comfort using the heat vulnerability index, along with the spatial distribution of urban heat island risk [
12]. In recent studies of heatwave vulnerability (exposure, sensitivity, and adaptive capacity), the focus has been on heatwave exposure and adaptive capacity components; however, heatwave vulnerability has a complex relationship with geographic and climatic factors, spatial and temporal factors, and socioeconomic factors [
13].
In particular, heatwave mortalities occur more frequently among persons aged ≥65 years or in vulnerable classes who lack the economic capability to respond [
6]. Regionally, each location is associated with distinct damage risks, even in the same administrative district, due to the large difference in radiant temperature in summer [
14]; therefore, a spatial analysis of damage risks is required. According to the Fifth Report of the Intergovernmental Panel on Climate Change (IPCC), heatwave “risk” refers to the degree of impact caused by the interaction among hazard, exposure, and vulnerability, on which the heatwave risk index is based. As the spatial resolution of the index is limited to cities, counties, and districts, identifying the detailed characteristics of regions where patients with heat-related illnesses actually occur, and directly reflecting them in metrics recognized by local governments, remains challenging. For example, Choi et al. [
15] constructed statistical data on the degree of exposure, sensitivity, and adaptive capacity to climate change of administrative neighborhoods in Seoul, while analyzing the spatial distribution of heatwave vulnerability. The authors found that the vulnerability index of each administrative neighborhood can serve as important data for establishing heatwave adaptation policies. However, such data are not available for all districts in South Korea, unlike Seoul, which has well-constructed statistical data and excellent administrative power, and no analyses have been conducted on regions smaller than districts. Bae et al. [
14] created a heatwave map for census output areas in Cheongju City and analyzed the spatial relationship between heatwave exposure risk levels and the inhabitability of neighborhoods in which vulnerable populations reside, ultimately revealing high vulnerability in the old city center. Spatial analyses at the level of census output areas can produce a detailed map of heatwave risk factors and potential correlated damages, and contribute to establishing practical policies to reduce the heatwave risk. However, owing to limitations in data collection, variables for factors related to more chronic disease in vulnerable persons were omitted.
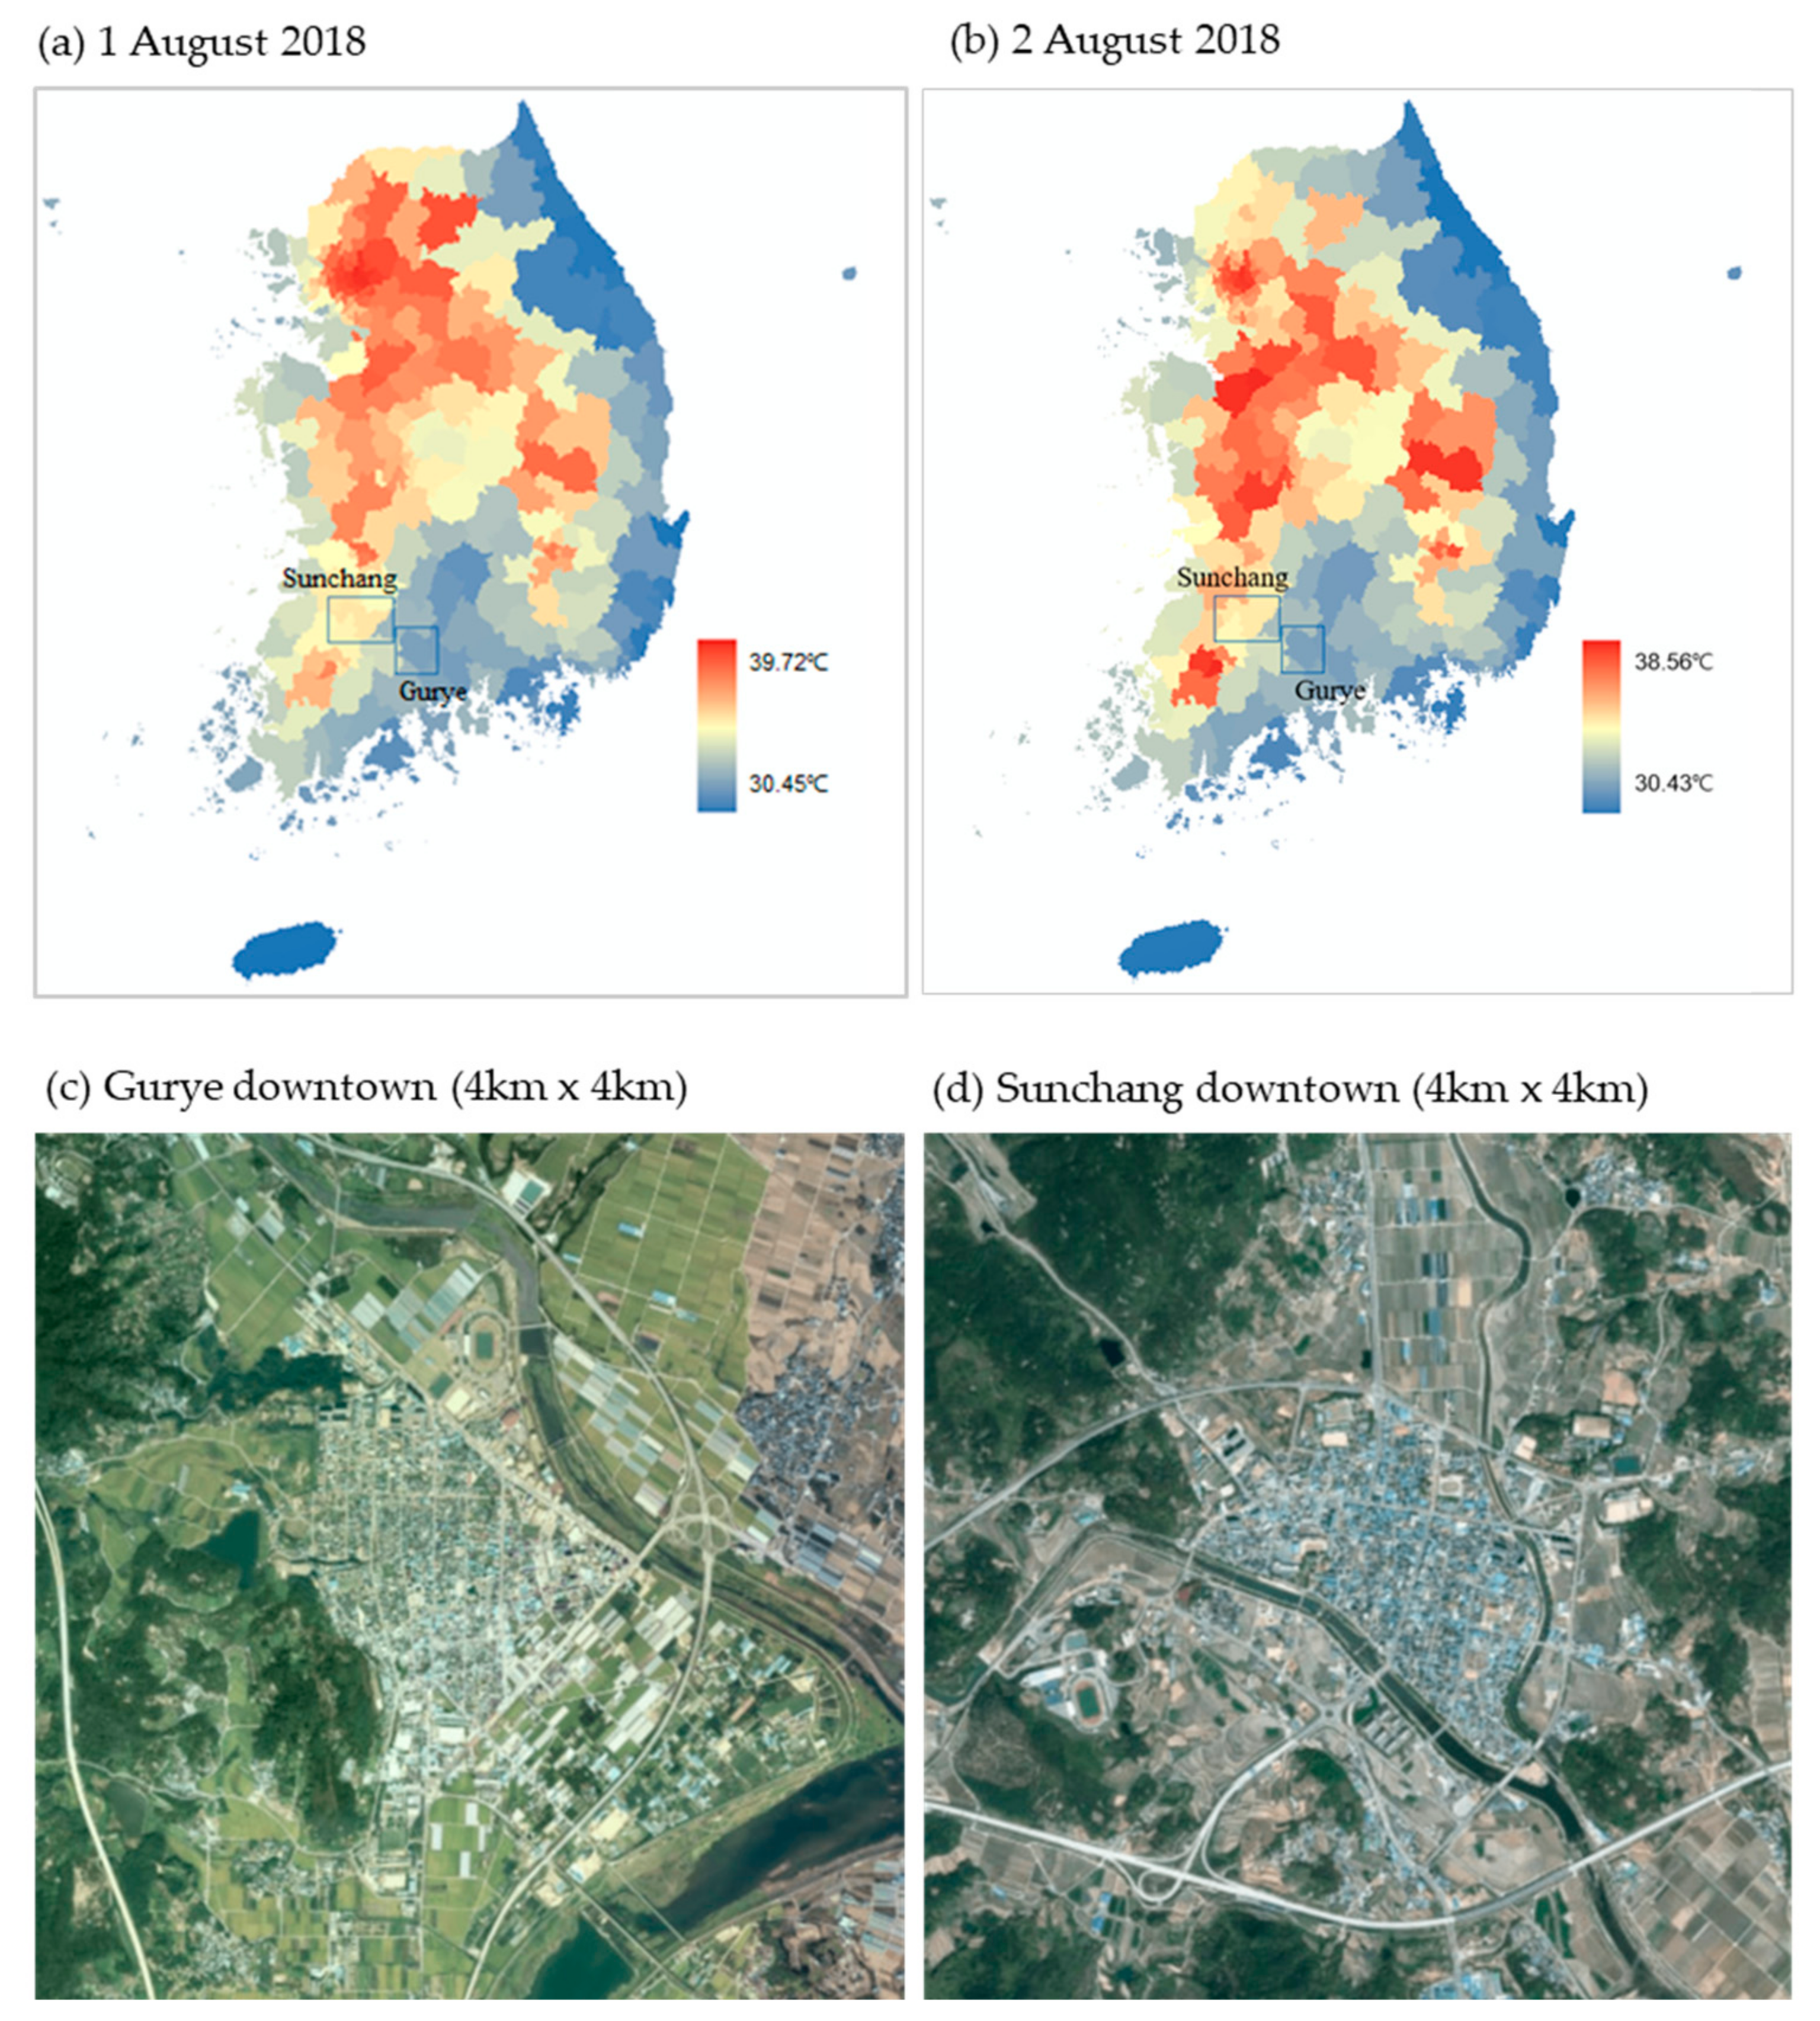
In the present study, the county of Gurye, in Jeollanam-do Province, and Sunchang, in Jeollabuk-do, which have similar populations and geographical environments, were selected as study areas in which to investigate the severe heatwave of the summer of 2018. To compare regional heatwave damages and analyze the detailed causes of heatwave vulnerability at the level of census output areas, spatial autocorrelation analyses were conducted, incorporating weather, environmental, personal, and disease factors. Heatwave damage risk maps were prepared using the vulnerability and heat exposure information obtained from the spatial autocorrelation analyses, and the detailed causes of heatwave vulnerability at the level of census output areas were derived through a comparison of the number of patients with heatwave-related illnesses. The results are useful for the establishment of detailed heatwave response policies for local governments.
3. Results and Discussion
3.1. Number of Heat-Related Illnesses and Heatwave Risk Characteristics in Gurye and Sunchang
A comparison was made between the number of patients with heat-related illnesses in the KDCA and NHIS data sets. The KDCA data set, collected from emergency rooms, reported sixteen patients in Gurye and three in Sunchang. In contrast, the NHIS data set, collected from all medical institutions, showed 27 patients in Gurye and 152 patients in Sunchang. Ultimately, the number of patients with heat-related illnesses was substantially different depending on the counting method of each institution.
In the case of both Gurye and Sunchang, detailed indicators corresponding to hazard, exposure, and vulnerability were calculated and compared according to the heatwave risk criteria suggested by the IPCC (
Table 4). Specifically, hazard indicates the severity of climate change, and its subsequent physical impact through the daily maximum temperature; the number of days when the daily maximum temperature ≥ 33 °C; and the relative humidity. Here, hazard was calculated using the ASOS data of KMA. In Gurye, which notably has no ASOS locations, the data from the closest Suncheon location were used. Exposure represents the degree to which humans or objects are spatially or environmentally subjected to climate-change-based damages and specifically pertains to persons ≥ 65 years, the elderly living alone, and recipients of basic livelihood security. Vulnerability is an indicator of the degree of sensitivity to climate change damage or the degree of insufficient response capacity, and involves the urbanized area ratio, financial independence, as well as the number of emergency medical institutions per unit population. The resident registration demographic data of MOIS (
https://jumin.mois.go.kr/ (accessed on 21 May 2023)) were used for the population, whereas the data provided in the National Statistical Portal of Statistics Korea (
https://kosis.kr/ (accessed on 21 May 2023)) were used for statistical information, such as the elderly living alone, basic livelihood security recipients, urbanized area ratio, and green area ratio. The weight calculated through analytic hierarchy process (AHP) by the Ministry of Environment (MOE) was 0.37 for hazard, 0.36 for exposure, and 0.27 for vulnerability; thus, the hazard index produced the highest weight. Comparatively, when the detailed heatwave risk indicators of MOE were compared, there was no significant difference in hazard index between Sunchang and Gurye, even though the daily maximum temperature, number of heatwave days, and number of tropical nights were slightly larger, while relative humidity was approximately 7% lower in Sunchang. Similarly, no significant difference in exposure was observed for most factors. With respect to vulnerability, the green area ratio was approximately 15% higher in Sunchang, whereas all remaining factors were similar across both locations.
3.2. Weather Factors in the Census Output Areas in 2018
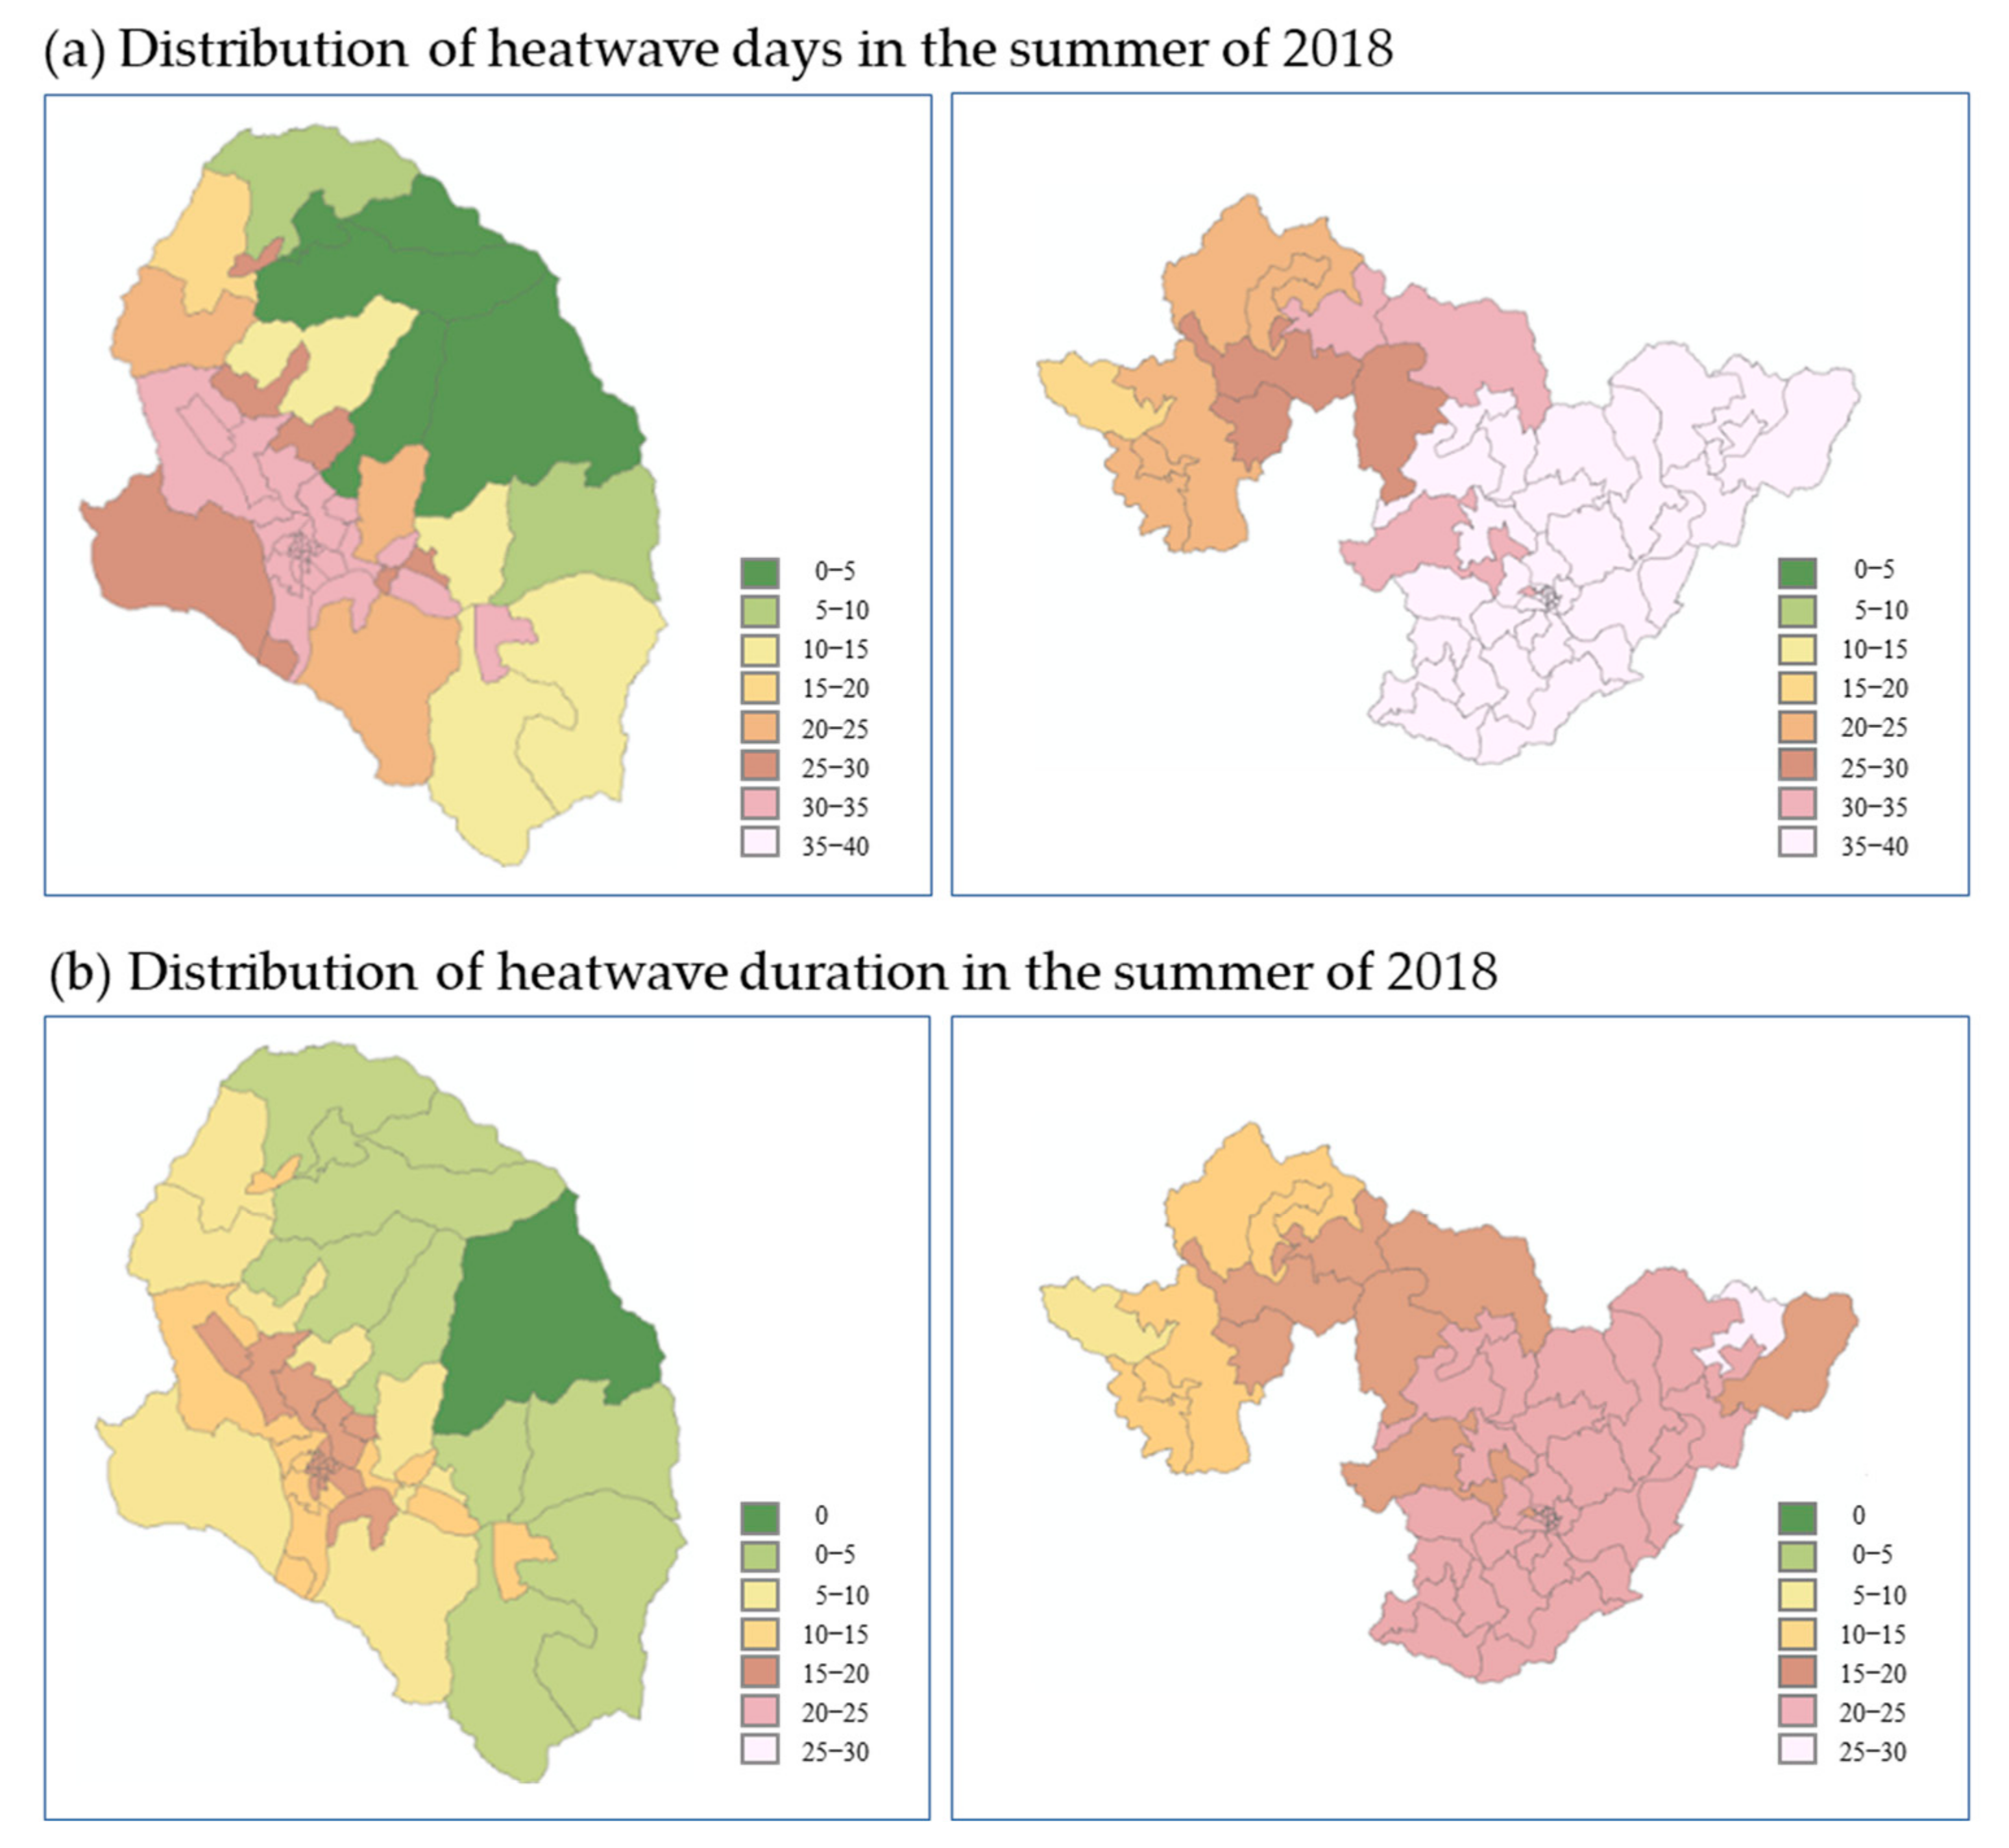
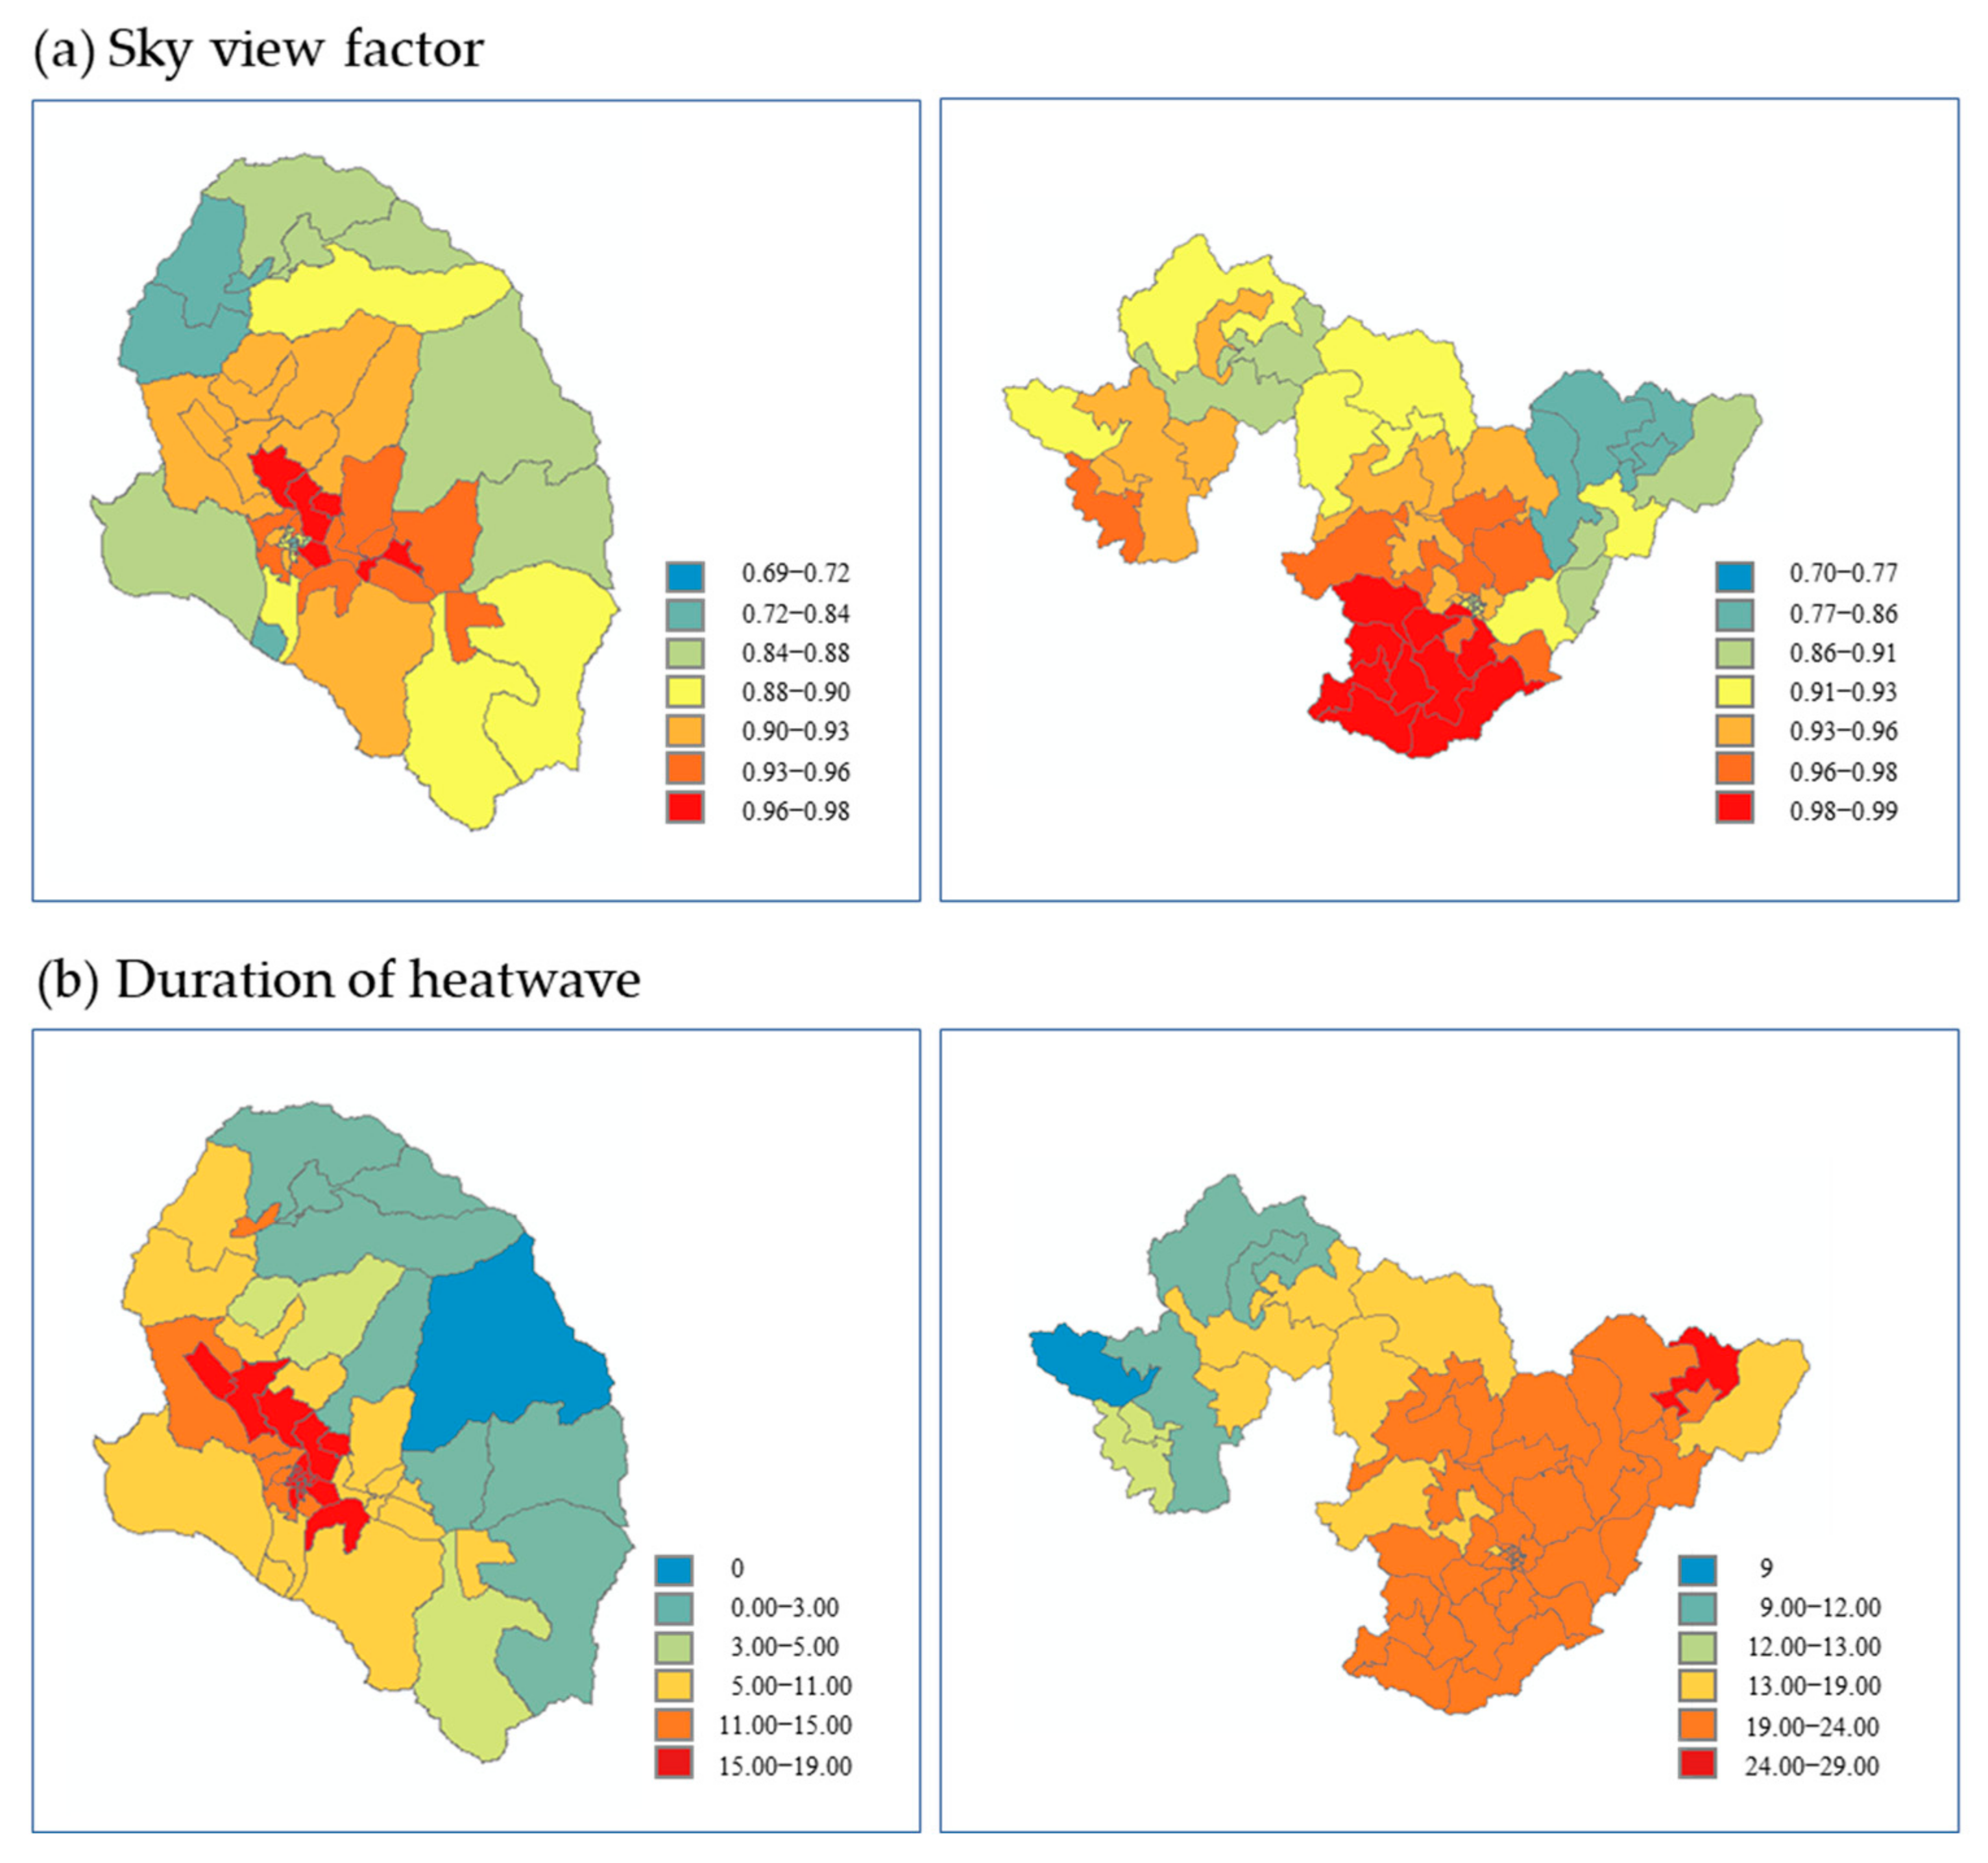
To compare the weather factor characteristics across the two regions, the number of heatwave days, duration of heatwave, and number of tropical nights at the level of census output areas were compared for 92 days in the summer of 2018 (June–August) using GPRM. The number of heatwave days ranged from 0 to 36 (average, 27.8 days) in Gurye and 22 to 39 (average, 36.5 days) in Sunchang (
Figure 5). Unlike the number of heatwave days in Gurye (29) announced by the KMA, spatial differences were observed depending on the census output area. In particular, for a census output area with extensive forest cover, the number of heatwave days was found to be zero. In Sunchang, the differences in the number of heatwave days among the 58 census output areas was small, as all values were ≥30 for most areas. Specifically, the smallest number of heatwave days in Sunchang (22) was different from that of Gurye (0). Heatwave duration is correlated with increasing heat stress, as high temperatures are maintained, and range from 0 to 19 days (average, 12.6) in Gurye, with low differences among areas. In Sunchang, the number duration ranged from 9 to 29 days (average, 21.9), and values were also generally similar among all census output areas. Both the number of heatwave days and the duration showed significant differences in the census output area distribution of Gurye and Sunchang according to the GPRM. The total number of heatwave days in Gurye in 2018, according to the KMA data, was 29; in comparison, the census output area results showed a maximum of 36 days, representing a significant difference (
Figure 5).
3.3. Heat Exposure in the Pedestrian Environment
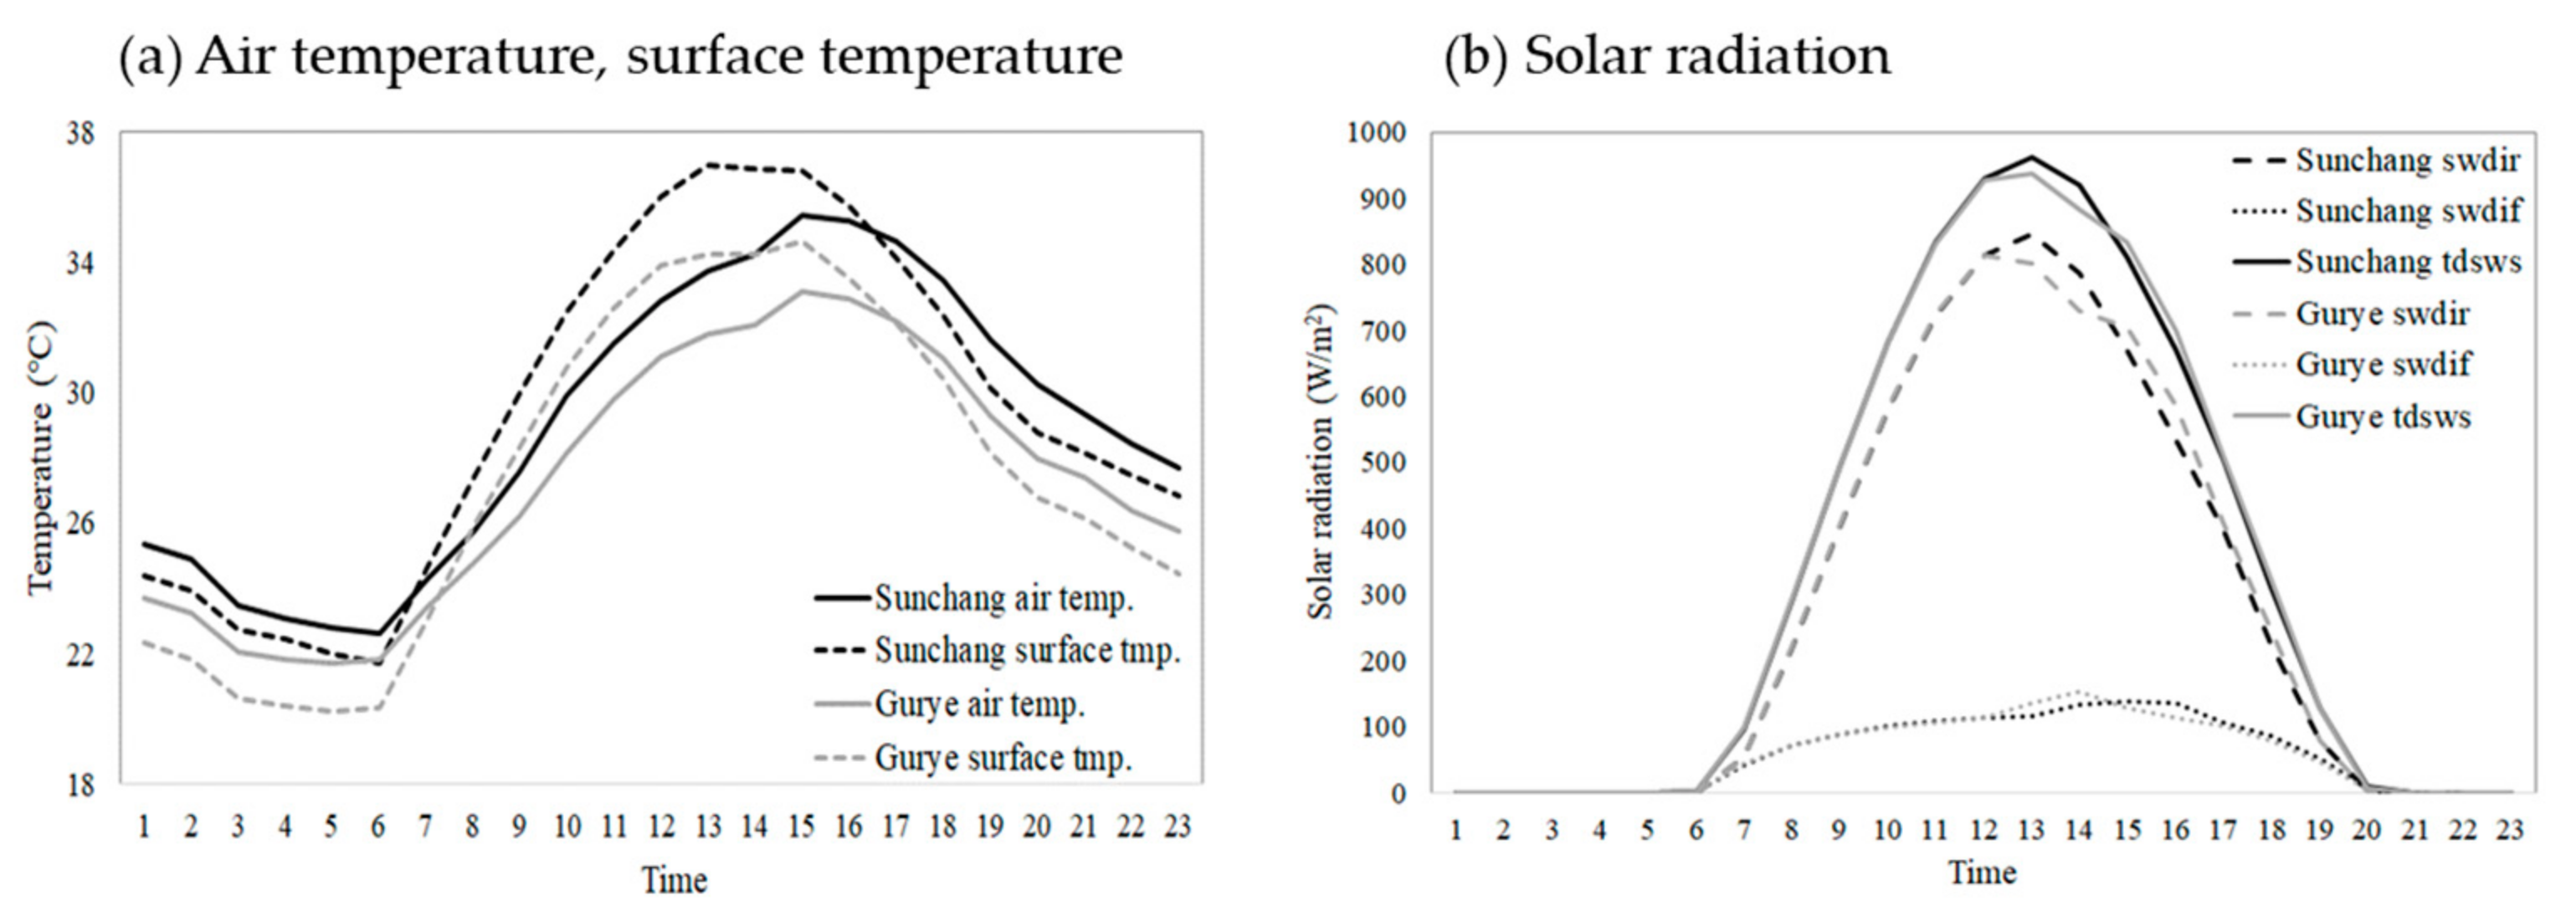
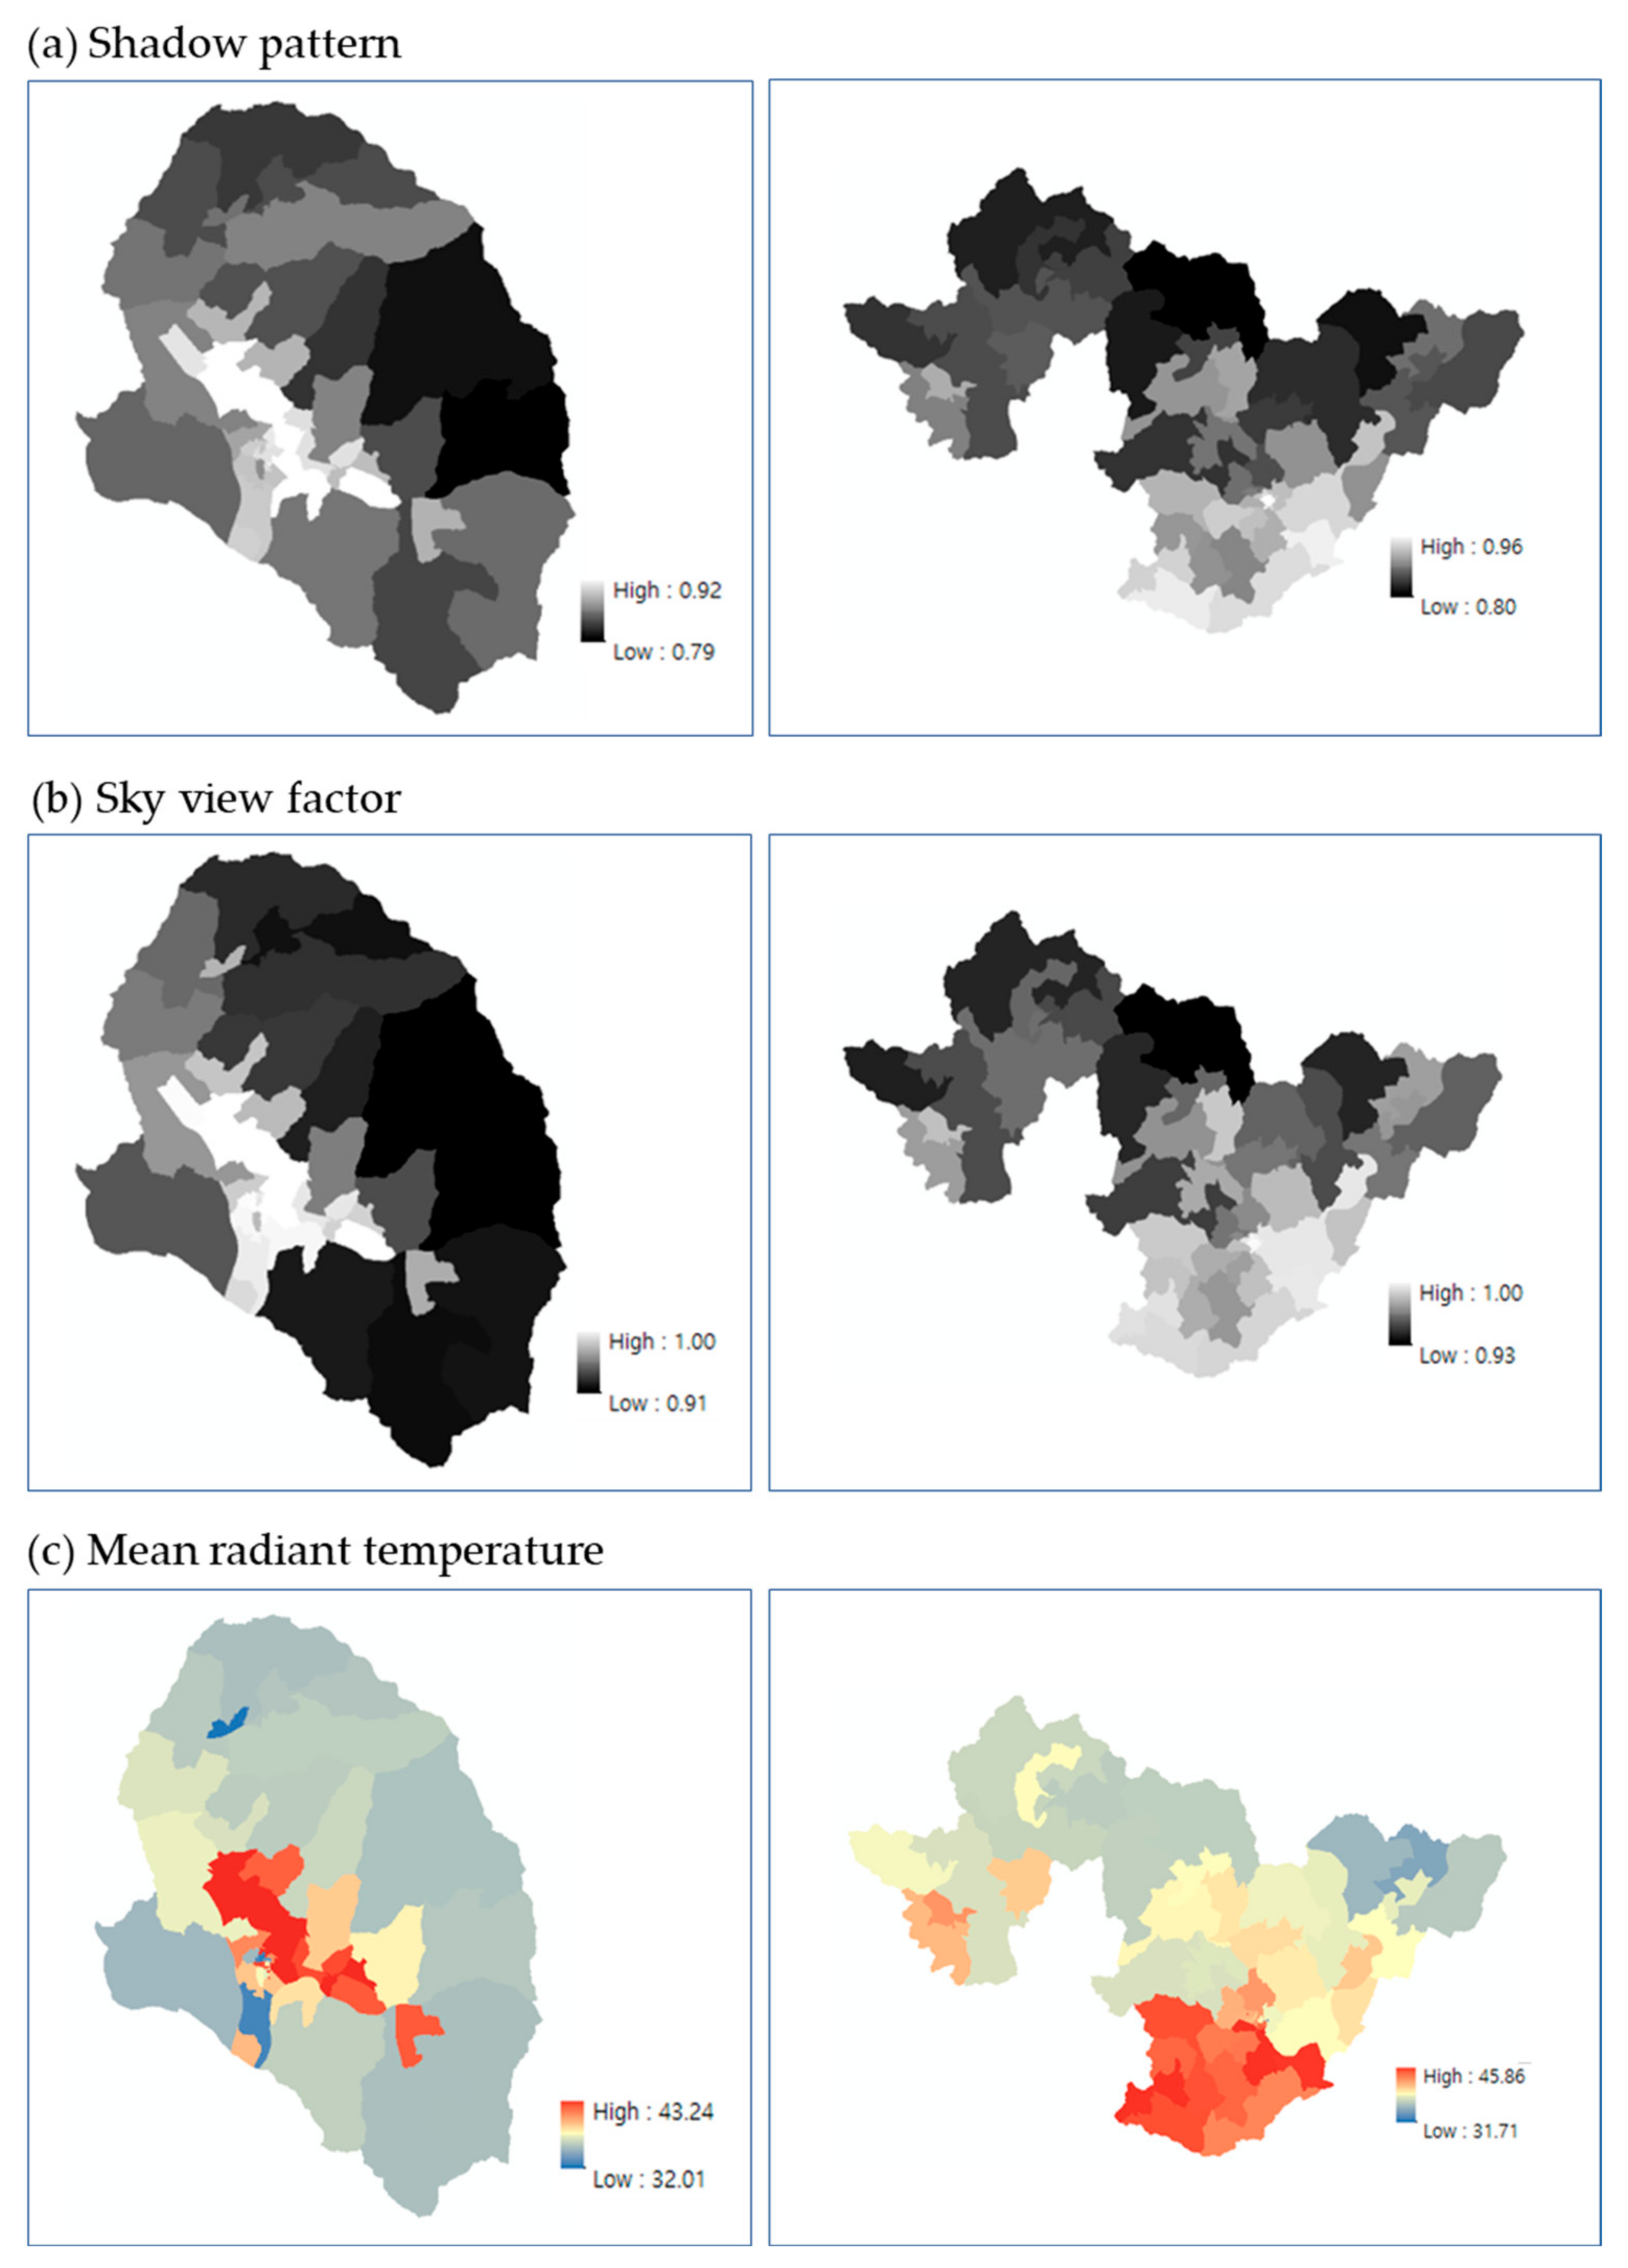
In the heat exposure analysis of the pedestrian environment, the distribution at the level of census output areas was analyzed by calculating the shadow pattern, SVF, and mean radiant temperature. Specifically, shadow pattern was calculated every 30 min from immediately after sunrise (06:00) to immediately before sunset (19:30), and the resulting time unit, as well as the daily average shadow pattern (ranging between 0 to 1). As the shadow pattern approached zero, more shadows were generated via the surrounding terrain, vegetation, and buildings over the grid. Comparatively, SVF quantifies the influence of obstacles that obscure the sky, describing complex geometric characteristics and the incidence relationship with solar radiation. An SVF value of 1 occurs on flat ground with no nearby obstacles, whereas a value of 0 is obtained when the sky is completely obscured by nearby terrain, buildings, or vegetation. In the present study, a 5 m resolution SVF was calculated for Gurye and Sunchang according to the methods of Yi et al. [
21]. The longwave and shortwave radiation fluxes, as well as the mean radiant temperature (used for final heat vulnerability assessment) were calculated based on the shadow pattern and SVF information. The mean radiant temperature depicts the average temperature of the surrounding surface that exchanges heat with the human body through radiation, indicating the sum of the shortwave and longwave fluxes of the non-uniform surfaces that surround a human body. In Europe, mean radiant temperature is primarily used to assess thermal comfort [
27].
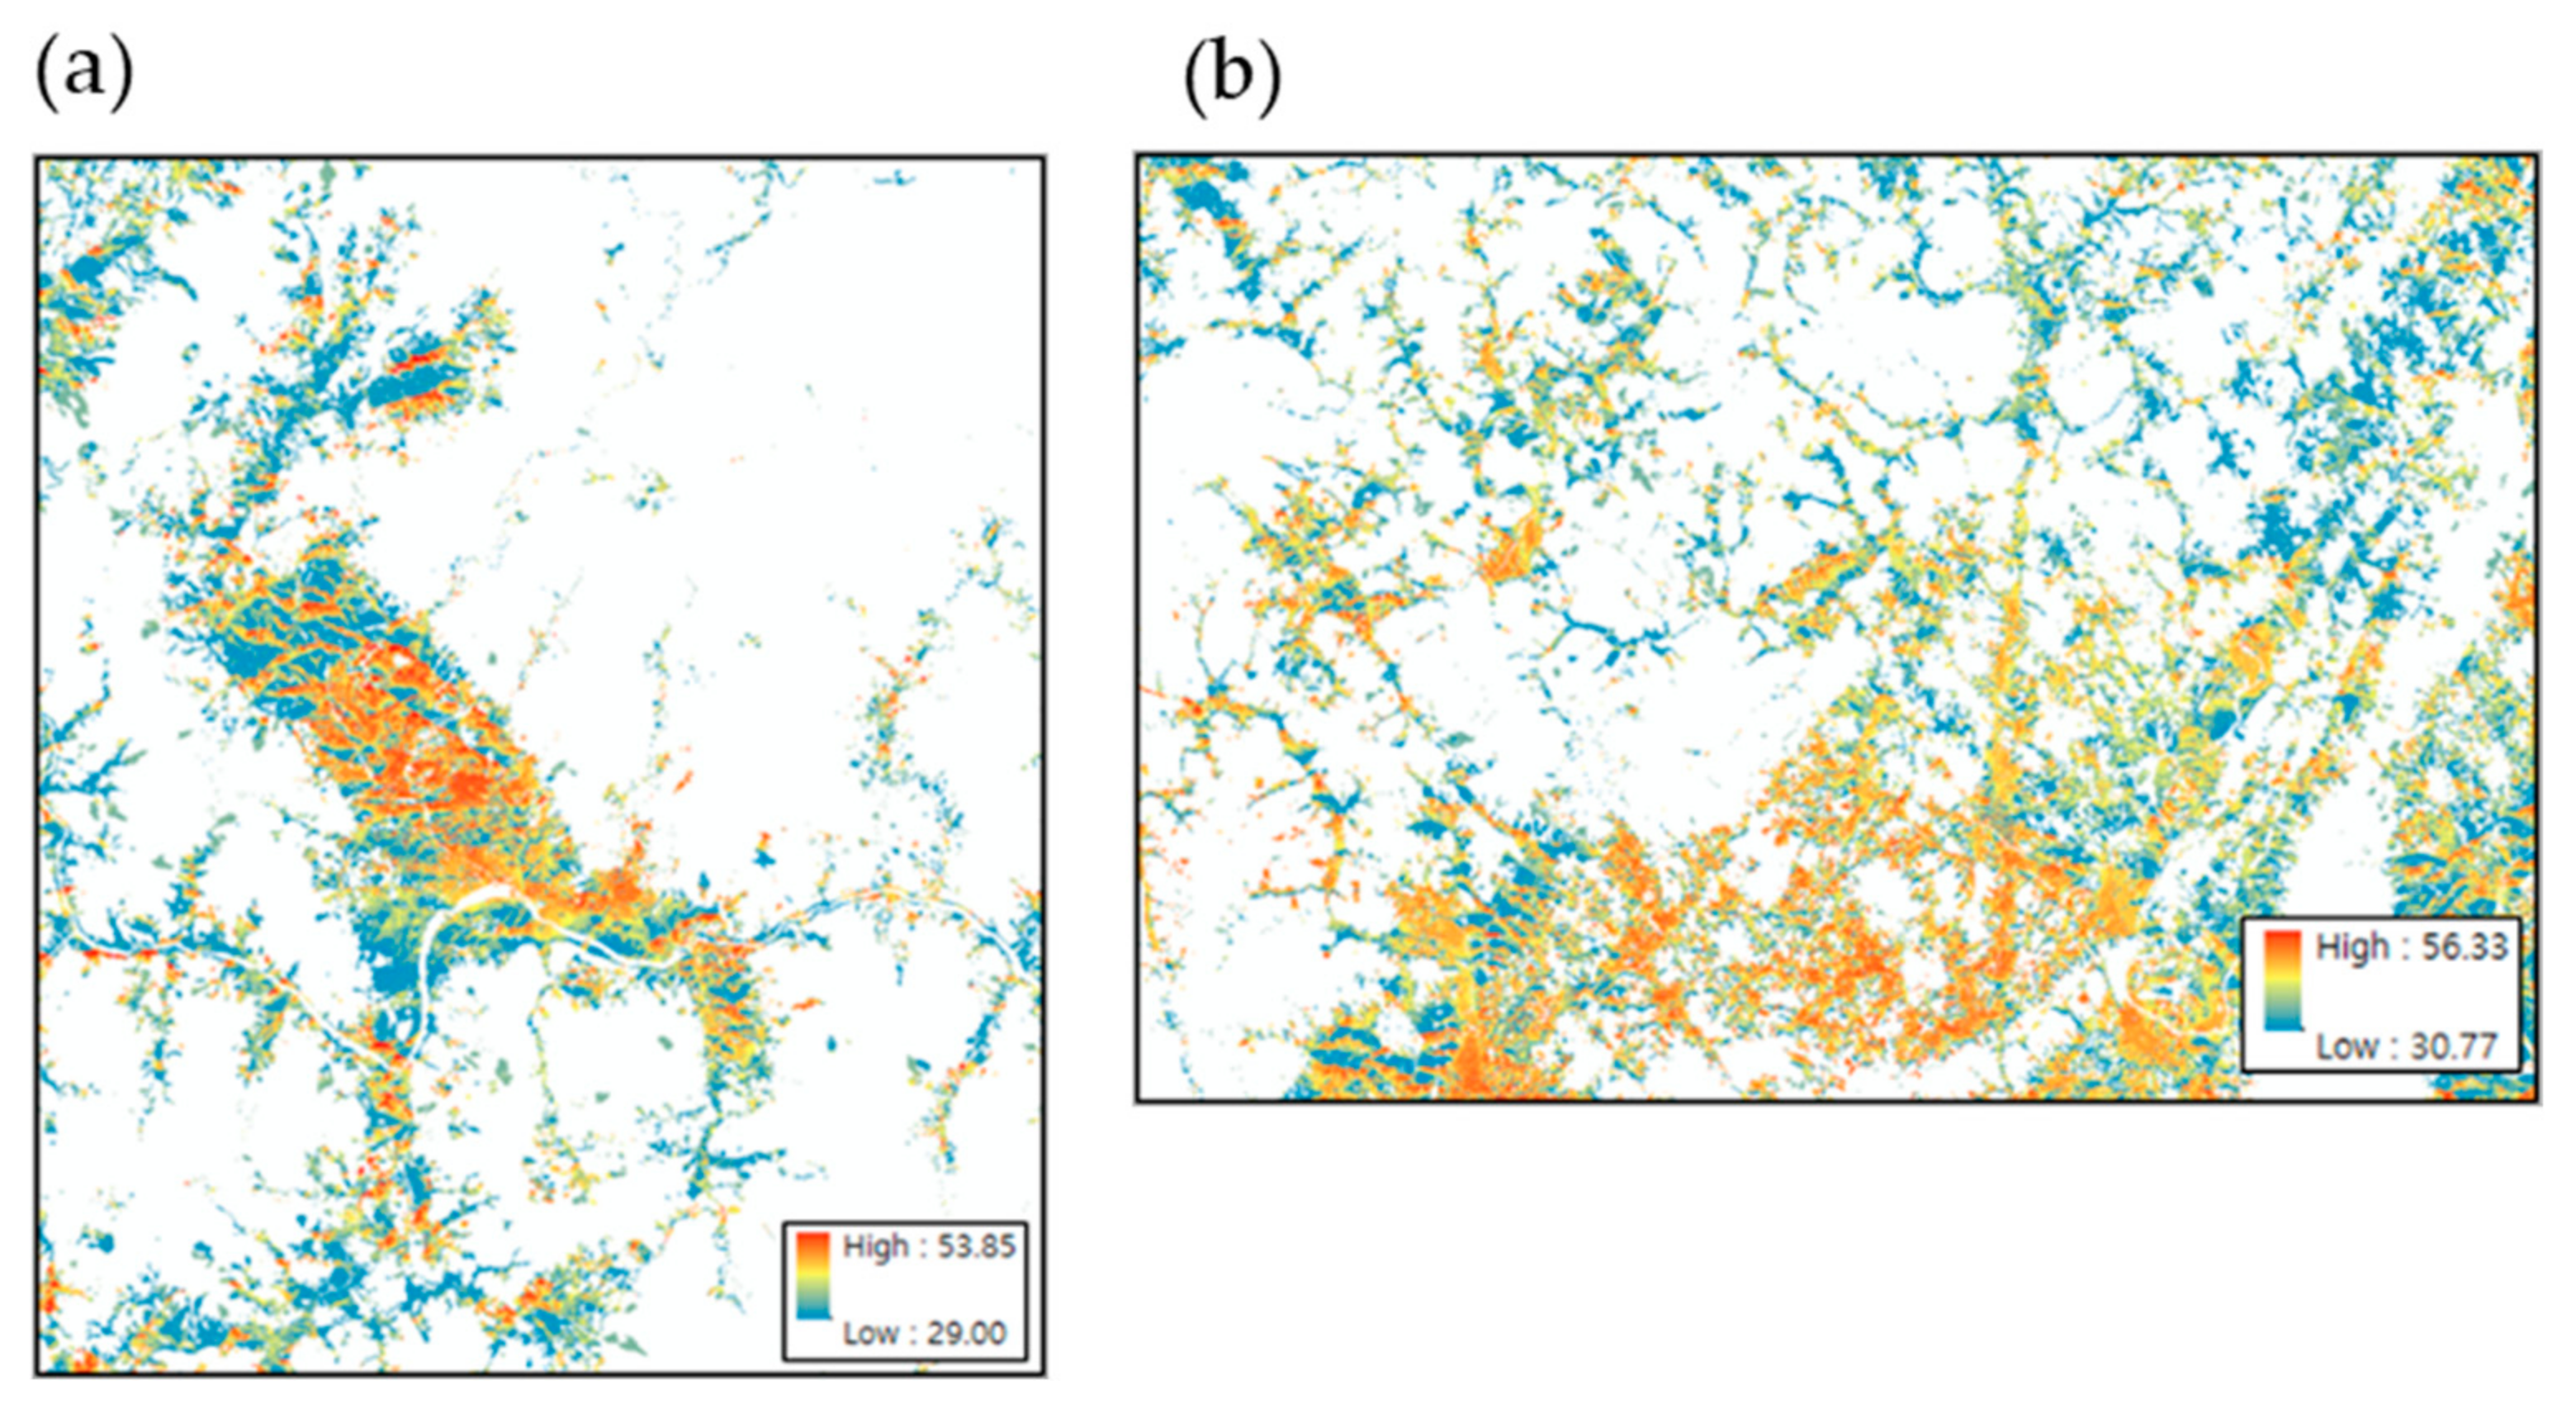
On 1 August 2018, when the largest number of heatwave-related deaths occurred, the average daytime mean radiant temperature (Tmrt) ranged from 29.0 °C to 53.8 °C (average, 34.1 °C) in Gurye and from 30.8 °C to 56.3 °C (average, 37.3 °C) in Sunchang. The maximum and minimum mean radiant temperatures of Sunchang were similar to those of Gurye; however, the average mean radiant temperature was 3.2 °C higher in Sunchang. From the calculated mean radiant temperature distribution, excluding forested and river areas, only urbanized and agricultural areas (where many people reside) were extracted using a land cover map and compared (
Figure 6). Here, the daily mean radiant temperature (average daytime Tmrt) ranged from 29.0 °C to 53.9 °C (average, 35.6 °C) in Gurye and from 30.8 °C to 56.3 °C (average, 39.2 °C) in Sunchang, whereas the mean radiant temperature of Sunchang was found to be 3.6 °C higher than that of Gurye, resulting in a larger difference than the average over the entire area. For the spatial distribution analysis, the shadow pattern, SVF, and mean radiant temperature calculated in SOLWEIG were converted according to census output area using the zonal statistics method (
Figure 7).
3.4. Spatial Autocorrelation of Heatwave Damage Vulnerability Factors
We present in
Table 5 the Moran’s index,
p-values, and cluster distribution characteristics calculated through the global spatial autocorrelation analysis. A negative value for Moran’s
I indicates the dispersion of high or low attribute units. The spatial autocorrelation analysis results for each vulnerability factor were found to differ between Gurye and Sunchang. In Gurye, vulnerability factors with a Moran’s index of ≥0.5 included the number of heatwave days, duration of heatwave, number of tropical nights, access to medical institutions, urbanization rate, capacity of the hot shelter, access to the hot shelter, population density, and number of cardiac infarction patients. In Sunchang, shadow pattern, SVF, number of old houses, urbanization rate, capacity of the hot shelter, access to the hot shelter, grade of old houses, average age, cardiac infarction, and stroke met this criterion (
Table 5). As for the detailed indicators of heatwave risk, the hazard factors showed a high correlation in Gurye, whereas the vulnerability factors exhibited a high correlation in Sunchang.
Regarding the hazard factors of heatwave risk corresponding to weather factors, heatwave duration and SVF showed the largest differences between Gurye and Sunchang. While both the duration of heatwave and SVF were significantly different among the census output areas and did not show clustered characteristics that were evident in Gurye, there were marked high-value clusters in Sunchang (
Figure 8). Among the hazard factors corresponding to weather factors, SVF and heatwave duration, which showed promising discrimination ability, as expressed through the largest differences between the two regions, are notably not provided by Statistics Korea or any other institutions but were calculated in the present study. Accordingly, it appears that the vulnerability factors of the regions can be distinguished under analyses at the census output area level due to the more detailed and diversified weather factors incorporated compared to previous studies. Specifically, the added factors representing the degree of bodily sensation in the pedestrian environment, which reflect the high-resolution ground surface data and surrounding environmental characteristics, were shown to be the most influential.
In Sunchang, where the customized data set of the NHIS showed a larger number of patients with heat-related illnesses, a total of 11 factors among the heatwave risk vulnerability factors (two of five hazard factors, six of seven vulnerability factors, and three of thirteen exposure factors) showed higher spatial autocorrelation. In Gurye, where a larger number of patients with heat-related illnesses was reported, a total of nine factors among the heatwave risk vulnerability factors (three of five hazard factors, four of seven vulnerability factors, and two of thirteen exposure factors) showed higher spatial autocorrelation (
Table 5).
In Sunchang, the shadow pattern and SVF, which represent bodily sensation among the weather factors of the hazard category, were both found to be high. Further, there was a strong correlation between the number and grade of old houses, which are the environmental factors of the vulnerability category. The infant population, elderly population, aging index, and support fee for the elderly were high among the personal factors of the vulnerability category, whereas cardiac infarction and stroke were high among the disease factors. For Gurye and Sunchang, similar vulnerability and exposure factors were represented by MOE (
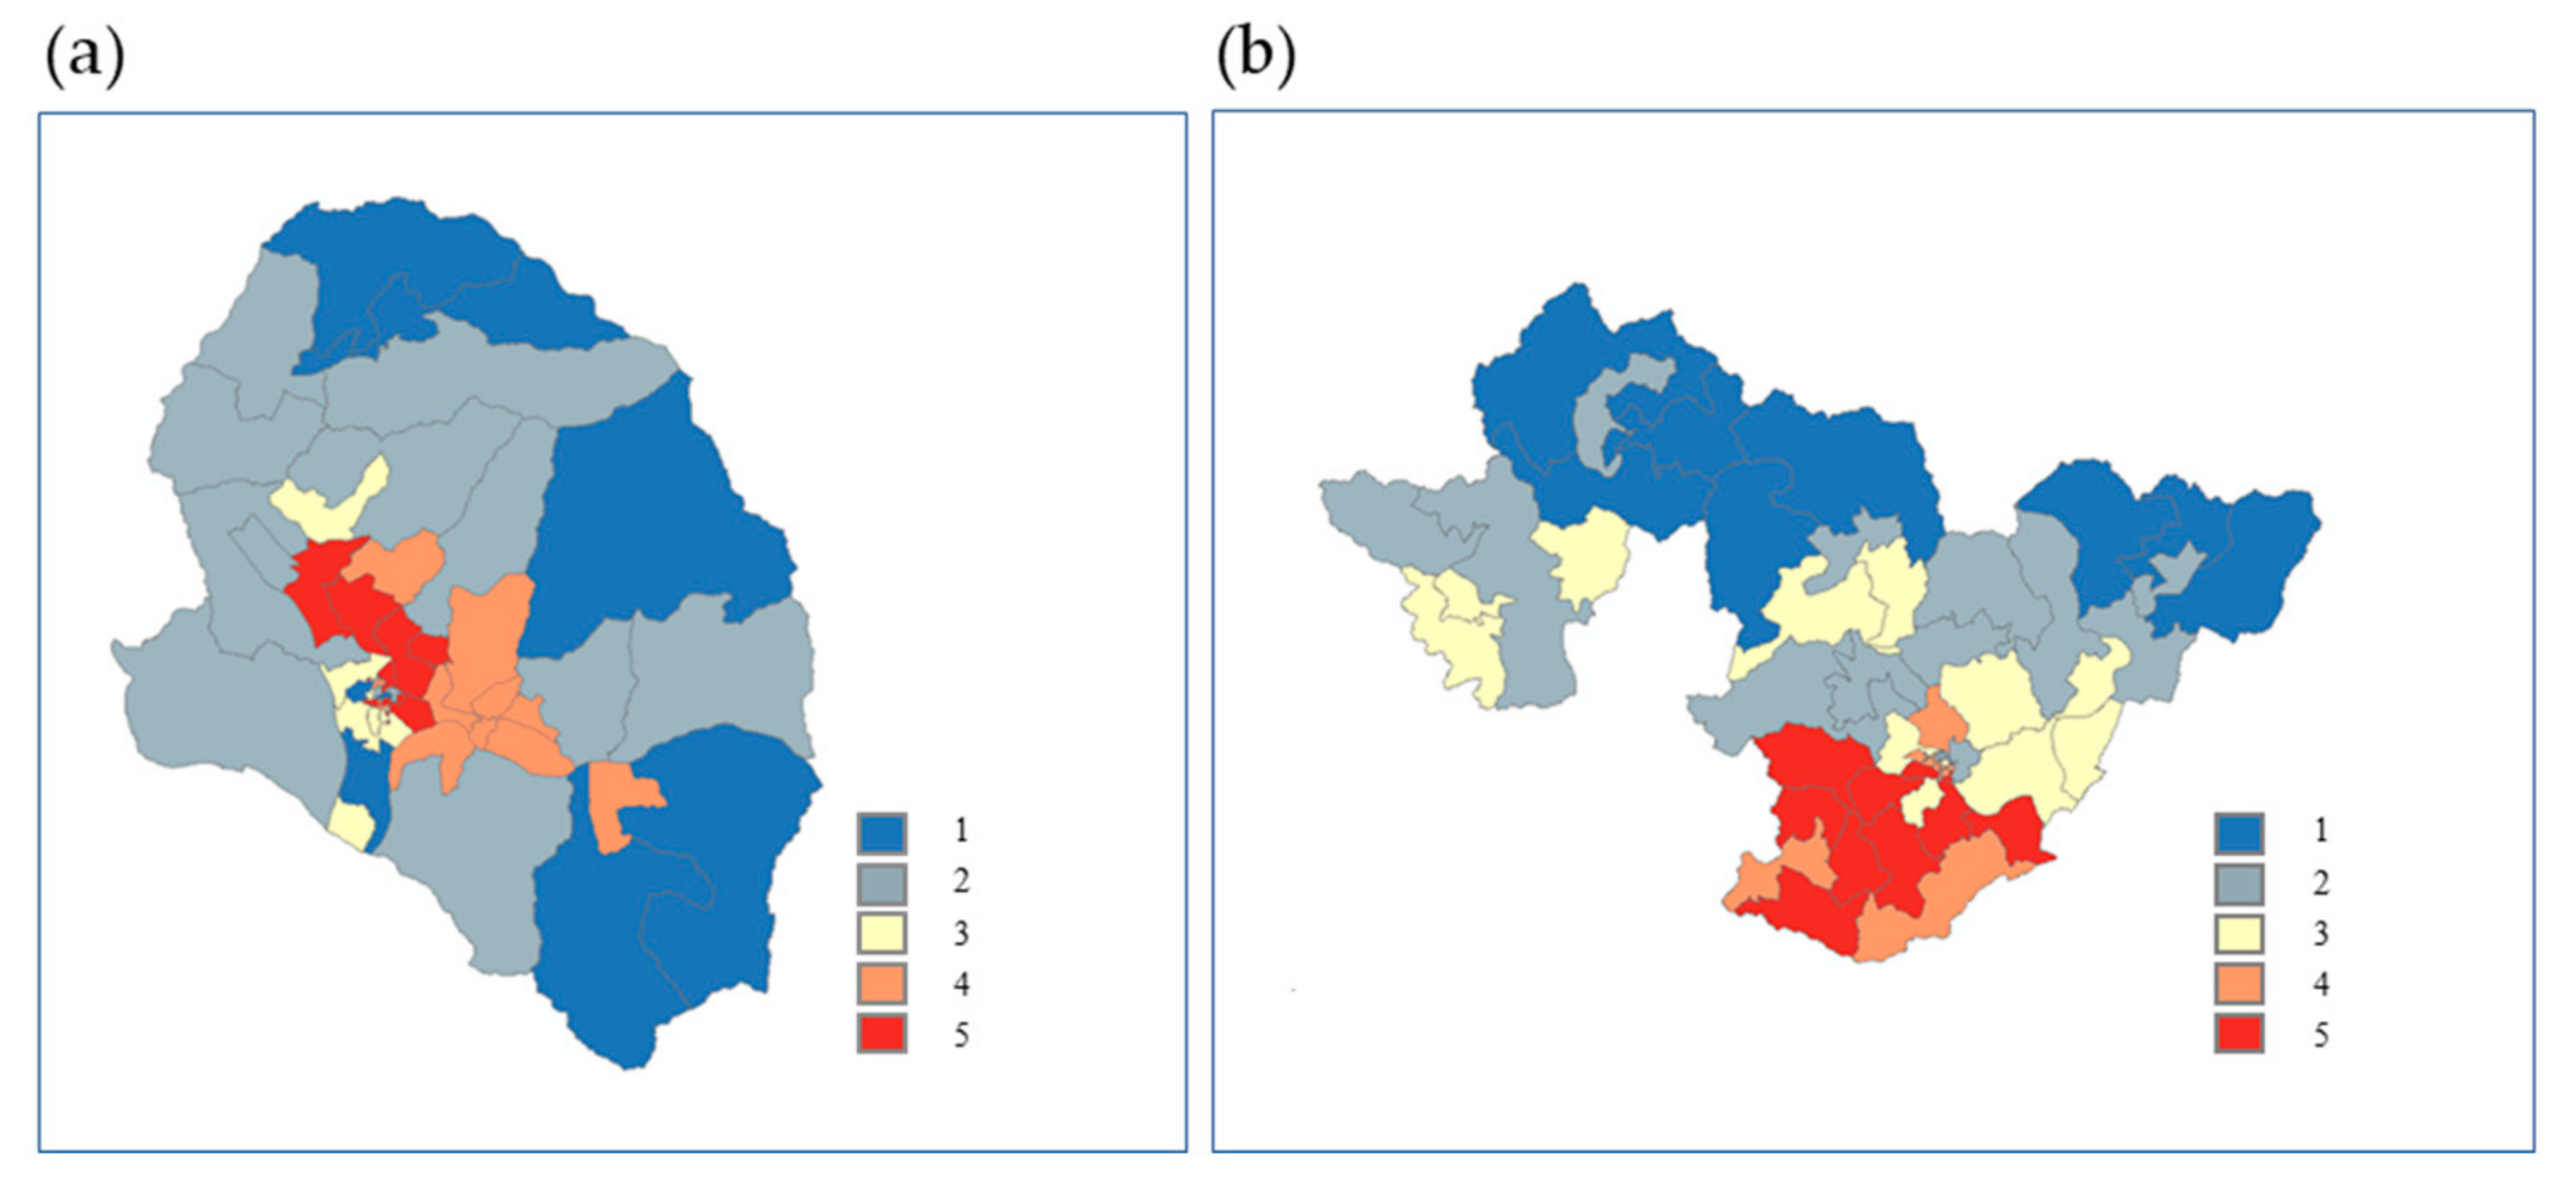
Table 4). It was found, however, that the vulnerability index varies depending on how detailed and diverse the environmental factors are within the vulnerability category and if the personal and disease factors are within the exposure category (i.e., whether factors that represent personal characteristics were created spatially). The heatwave risk maps of Gurye and Sunchang were calculated using the mean radiant temperature and spatial autocorrelation analysis results, which can represent the degree of heatwave risk by reflecting the high-resolution ground surface and surrounding environmental characteristics (
Figure 9). These maps were used to identify areas with high heatwave damage risks by reflecting vulnerability factors with high spatial autocorrelation. The applied weight for each vulnerability factor was 0.37 for hazard, 0.27 for vulnerability, and 0.36 for exposure.
The heatwave risk map was plotted using the mean radiant temperature, representing thermal vulnerability, and the value of the vulnerability factor to which weights for each factor were applied. The spatial scale unit is the census output area and the risk grade of the heatwave map is divided into grades 1 to 5, using the Jenks grade calculation method, with “5” indicating the highest risk of heatwave.
Grade 5 risk was mainly distributed in urban areas of Gurye. Among the 50 census output areas, 11 showed grade 5, which corresponds to 3.1% of the total regional area. Comparatively, in Sunchang, seven out of fifty-eight census output areas were identified as grade 5, corresponding to 10.4% of the total area. The portions of census output areas that exhibited grade 5 in Gurye and Sunchang were 22% and 12%, respectively. Sunchang is a larger land area than Gurye, and census output areas with grade 4 were primarily distributed around the grade 5 locations. Although census output areas with grades 1 and 2 were widely distributed in Gurye, grades 1–4 were relatively sporadically distributed in Sunchang. In Gurye, the proportions of grades 4 and 5 were found to comprise 38% (19) of the number of census output areas and 7.2% of the total area. Comparatively, in Sunchang, the proportions of grades 4 and 5 comprised 34.5% (20) of the census output areas (20) and 21.4% of the total area. Accordingly, the proportion of the area with high heatwave risk was approximately three times higher in Sunchang than in Gurye, with the more widely distributed risk area in the former indicating that if residential areas are located in locations with high heatwave risk, the proximate living areas are also likely to exhibit such risk.
3.5. Characteristics of Heat-Related Illness in Gurye and Sunchang
The number of heat-related illness patients in 2018, as recorded by the Korea Disease Control and Prevention Agency (KDCA), was sixteen in Gurye and three in Sunchang, more than five times higher in Gurye (
Table 6). In Gurye, 14 cases of heat illness occurred outdoors and, among heat illnesses, there were eight cases of T67.0 (heat stroke) in Gurye and no reported heat illnesses in Sunchang. Based on the KDCA patient counting method, it can be seen that more heat-related emergency cases occurred in Gurye than in Sunchang. According to the National Health Insurance Service (NHIS), the number of heat-related illness patients in 2018 was approximately three times more in Sunchang than in Gurye (26 in Gurye and 77 in Sunchang). Among them, nine cases of T67.0 (heat stroke) occurred in Gurye and forty-seven in Sunchang. The number of reported cases is somewhat different than what was reported by the KDCA: the number of cases in Sunchang was higher in the NHIS count, which is the number of heat-related patients who visited hospitals and received treatment. The KDCA data, related to emergencies, are highly related to the occurrence of acute and emergency cases; the NHIS data, related to hospital visits, are data collected when people voluntarily go to the hospital. As the cases are counted differently in the two data sets, it is necessary to select and use the data most suitable for the purpose.
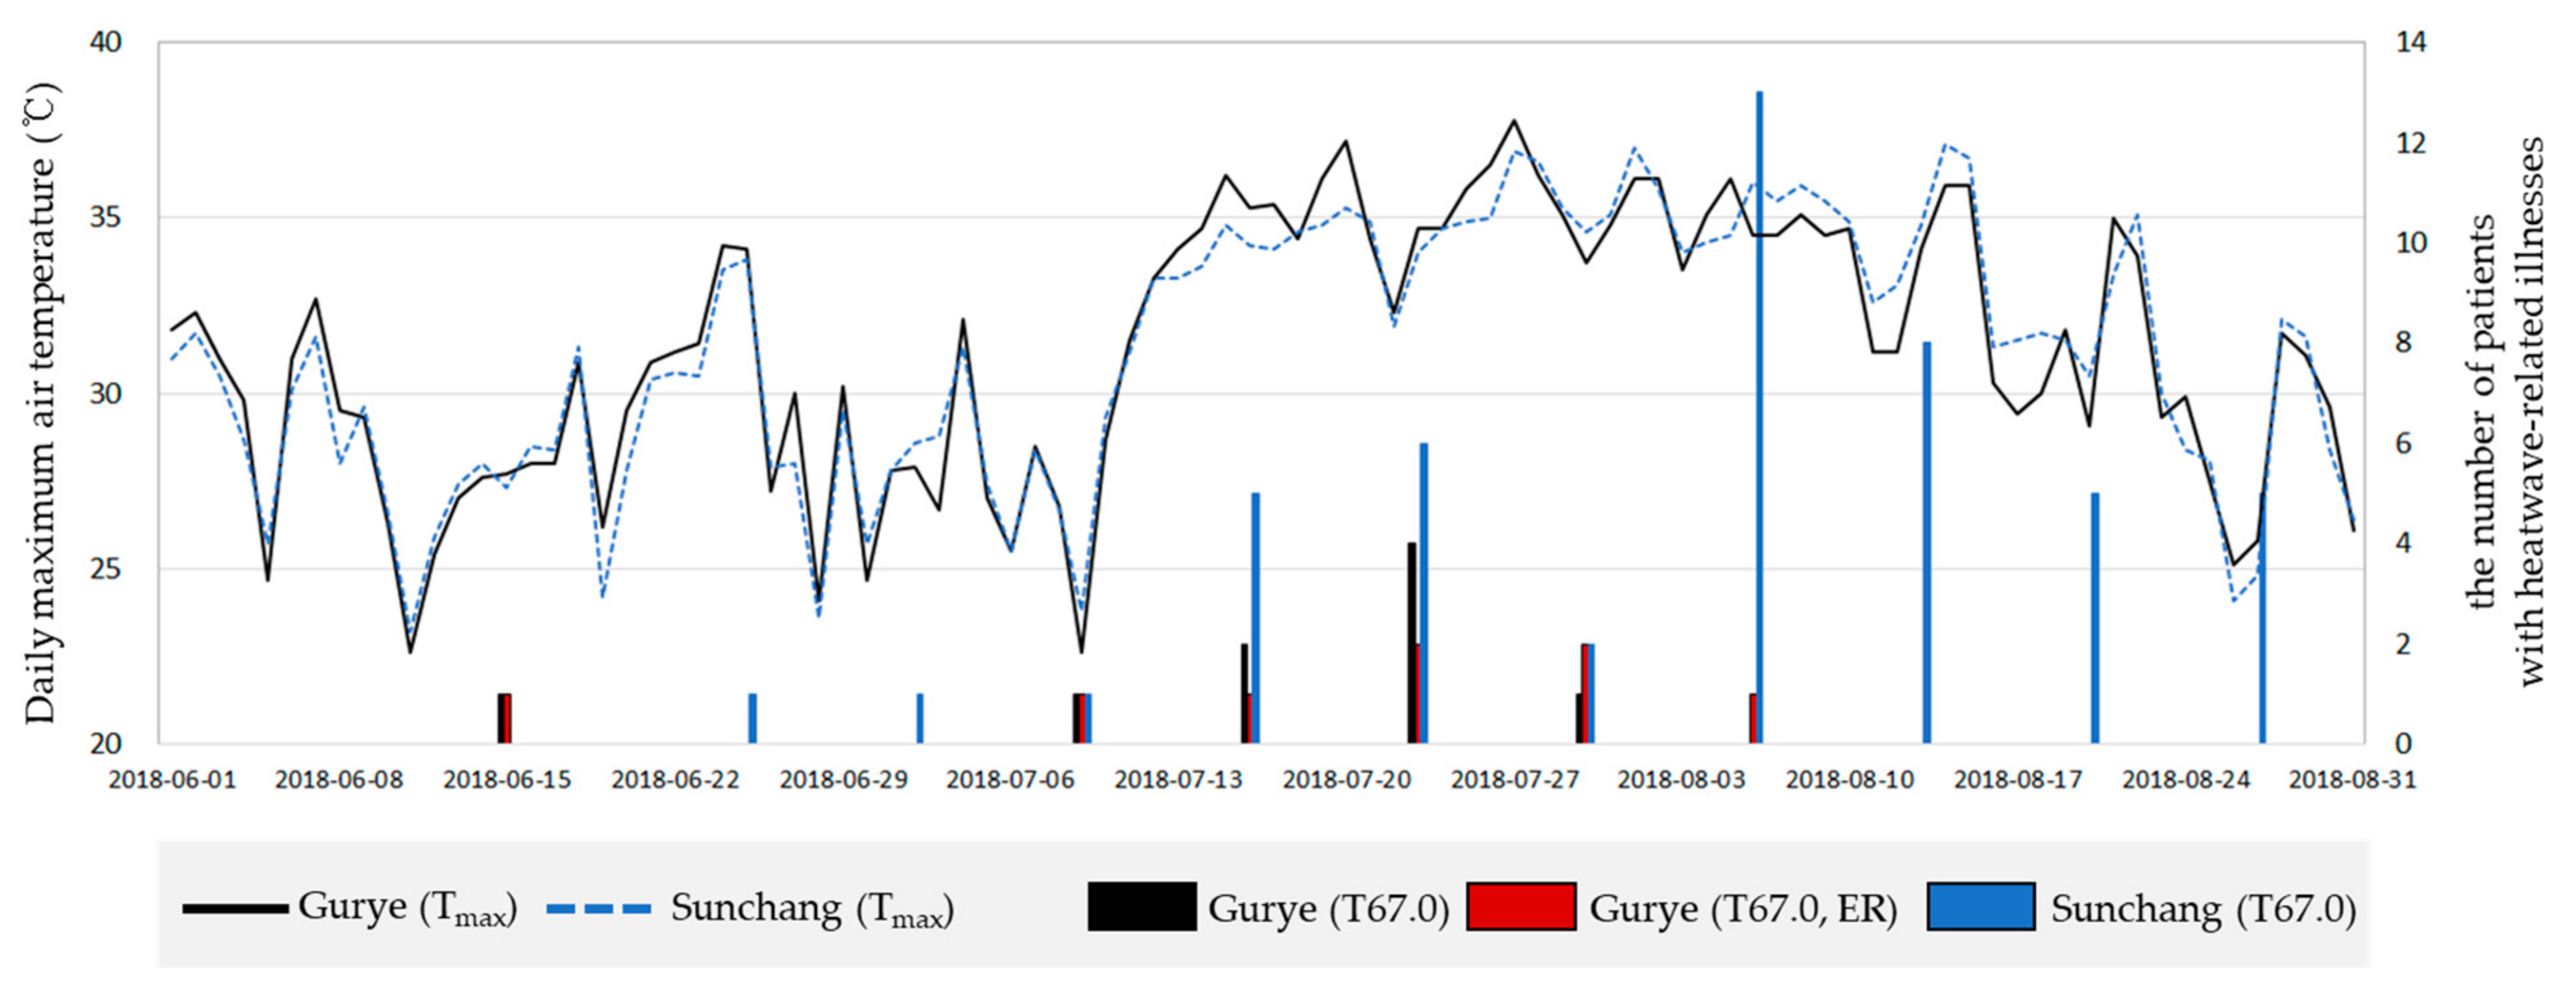
The time series change of the daily maximum air temperature and the number of T67.0 cases (summed per week) from 1 June 2018 to 31 August 2018 were plotted (
Figure 10). The number of patients began to increase in both regions from 6 July 2018, when the daily maximum temperature increased rapidly; in Gurye, cases occurred until August 3. Heat illness outbreaks continued until August 31, while the temperature persisted at approximately 35 °C.
The cause of this continuous occurrence to late summer can be explained in relation to the results analyzed in
Section 3.4. As a result of calculating the heatwave risk map, 12 out of 50 counted by census output area in Gurye showed a heatwave risk level of 5, accounting for approximately 3.4% of the total area of the administrative district. In Sunchang, seven out of fifty-eight counted by census output area showed a heatwave risk level of 5 and it was analyzed that they accounted for approximately 10.4% of the total area of the administrative district. Although the number of grade 5 counts in the census output area in Sunchang is smaller than in Gurye, the area (spatially exposed area to heatwave risk) is approximately three times wider.
In the hazard factors (sky view factor and mean radiant temperature related to physical residential environment among meteorological factors) and vulnerability factors, Sunchang clearly showed clustered characteristics with high values. In Sunchang, which has more areas and elements representing grade 5 heatwave risk, the number of patients with heat illness (T67.x) was three times higher and those with severe T67.0 were five times higher than the corresponding numbers in Gurye. On the basis of these results, it can be concluded that physical factors can affect illness occurrence.
4. Conclusions
In the present study, the detailed causes of heatwave vulnerability were analyzed at the level of census output areas in Gurye, Jeollanam-do, and Sunchang, Jeollabuk-do, South Korea, as they had previously been selected as study areas for assessing the severe heatwave-induced damages during the summer of 2018. Further, the causes of the differences between the two counties were identified through spatial autocorrelation analyses. Weather, environmental, personal, and disease factors at the level of census output areas were constructed as heatwave damage vulnerability factors, and factors reflecting the pedestrian environment and personal characteristics of residents were calculated to increase the detail and diversity of the public data used.
Spatial autocorrelation analyses revealed that hazard factors were highly correlated with heatwave risk in Gurye, whereas vulnerability factors exhibited a high correlation in Sunchang. The duration of heatwave and SVF that exhibited the largest difference in the spatial autocorrelation analyses comprised the variables distinct to this study. Accordingly, it was concluded here that the vulnerability factors of the regions were distinguished when heatwave vulnerability was analyzed at the census output area level due to the detailed and diversified weather factors incorporated here that represent the degree of bodily sensation in the pedestrian environment. Further, this also reflects the importance of incorporating high-resolution ground surface and surrounding environmental characteristics in such analyses.
The enhanced method of analyzing causes of heatwave vulnerability at the census output area level proposed here, as well as the corresponding results, can inform more detailed heatwave response policies for local governments. In addition, because the number of patients with heat-related illnesses differed depending on the data for each region, it is necessary to analyze and interpret the detailed causes of heatwave vulnerability when the heatwave damage statuses at the city, county, and district levels are analyzed. If a comparative analysis is performed by drawing up detailed heatwave risk maps with various types of heatwaves, it is thought that the characteristics of heatwave damage occurrence according to the regionality and heatwave type can be identified.
Future analyses of the causes of heatwave damage should contain more detailed, and a wider variety of factors that represent even the personal characteristics of local community members, rather than solely the temperature-dependent risk levels provided by the Korea Meteorological Administration (KMA) used to create heatwave alerts and warnings. In particular, it is necessary to develop various heatwave vulnerability assessment techniques by adding an analysis that reflects multiple factors, even though it is difficult to quantitatively assess some social factors at the individual level.
‘Adaptive capacity’, such as heat mitigation and heat adaptation in the target area, was not applied to the heatwave risk map prepared in this study. The heatwave risk map of more diverse regions and the analysis of heatwave response policies by local government should be performed together, and it is thought that the additional application of ‘socioeconomic’ factors such as income, education, and acclimatization will be necessary.
