
Impacts of Urban Green on Cardiovascular and Cerebrovascular Diseases—A Systematic Review and Meta-Analysis


Abstract
1. Introduction
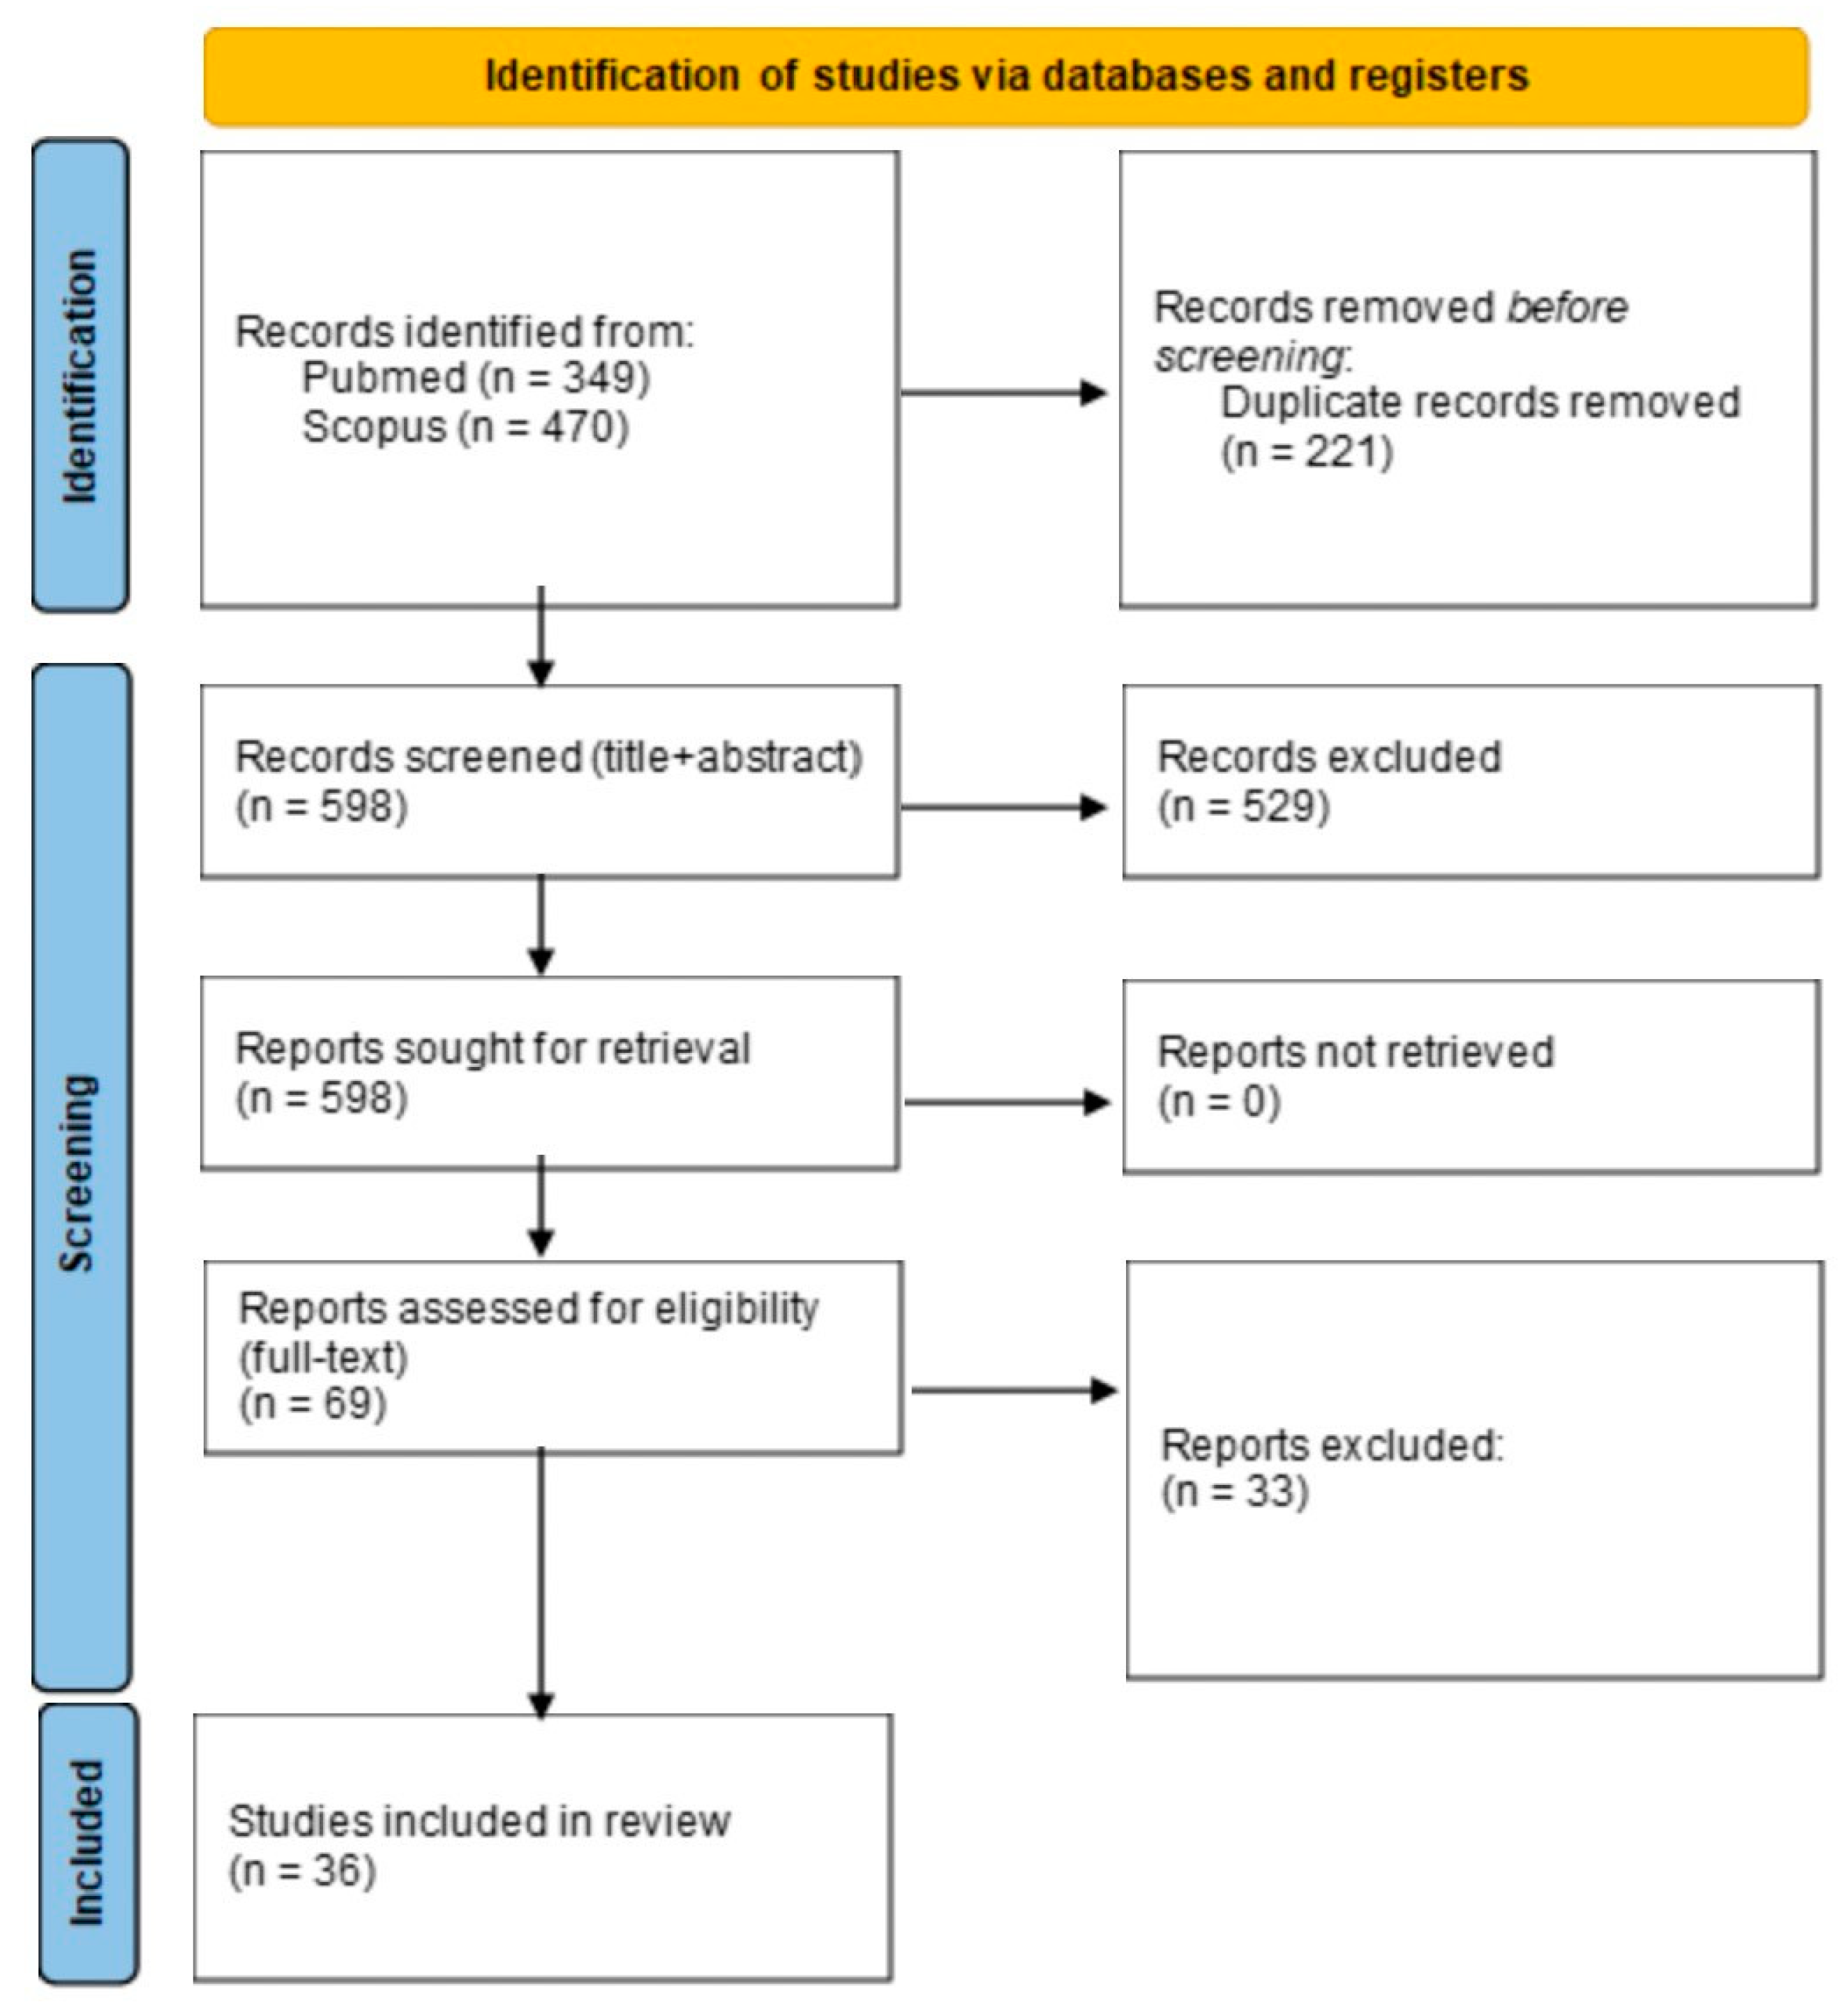
2. Materials and Methods
2.1. Study Design
2.2. Study Eligibility Criteria and Selection Strategy
- Primary/original research articles;
- Studies involving humans;
- Studies with a quantitative association between urban green exposure variables and cardiovascular and cerebrovascular outcomes.
- Meta-analyses and reviews;
- Non-research articles;
- Non-primary research articles;
- Studies involving animals;
- Articles in languages other than English;
- Studies with no correlation assessed between urban green and cerebrovascular or cardiovascular outcomes.
2.3. Meta-Analysis
3. Results

| Authors | Year | Country | Study Design | Population | Sample Size | UG Exposure Variable | Comparison | Outcome Variable | Type of Estimate | Estimate of Assosiation | Quality Score | |
|---|---|---|---|---|---|---|---|---|---|---|---|---|
| Richardson et al. [14] | 2010 | UK | Ecological study | General population (aged 16–64) | Not specified, approximately 28.6 million | % Green space at CAU level | Four equal groups: >25%, 25–50%, 50–75%, >75% (highest vs. lowest) | CVD mortality | IRR (95% C.I.) | 60 | ||
| Male | 0.95 (0.91–0.98) | |||||||||||
| Female | 1.00 (0.95–1.06) | |||||||||||
| Richardson et al. [15] | 2010 | New Zeland | Ecological study | General population | 1,546,405 | % Total and % usable green space at CAU level | Q4 vs. Q1 | CVD mortality | IRR (95% C.I.) | 60 | ||
| Total green space | 1.01 (0.91, 1.11) | |||||||||||
| Usable green space | 0.96 (0.90, 1.03) | |||||||||||
| Richardson et al. [16] | 2012 | USA | Ecological study | General population | Not specified, approximately 43 million | % Green space at CAU level | T3 vs. T1 | CVD mortality | linear regression coefficient (β) (95% C.I.) | 40 | ||
| Male | 6.49 (−62.46 to 75.45) | |||||||||||
| Female | 1.90 (−41.96 to 45.76) | |||||||||||
| Pereira et al. [17] | 2012 | Australia | Cross-sectional | General population (>18 yrs old) | 11,404 | NDVI with 1600 m buffer from residence address | T3 vs. T1 | CHD + Stroke prevalence, self-reported | OR (95% C.I.) | 0.84 (0.68, 1.03) | 60 | |
| CHD + Stroke hospital admission | 0.63 (0.43, 0.92) | |||||||||||
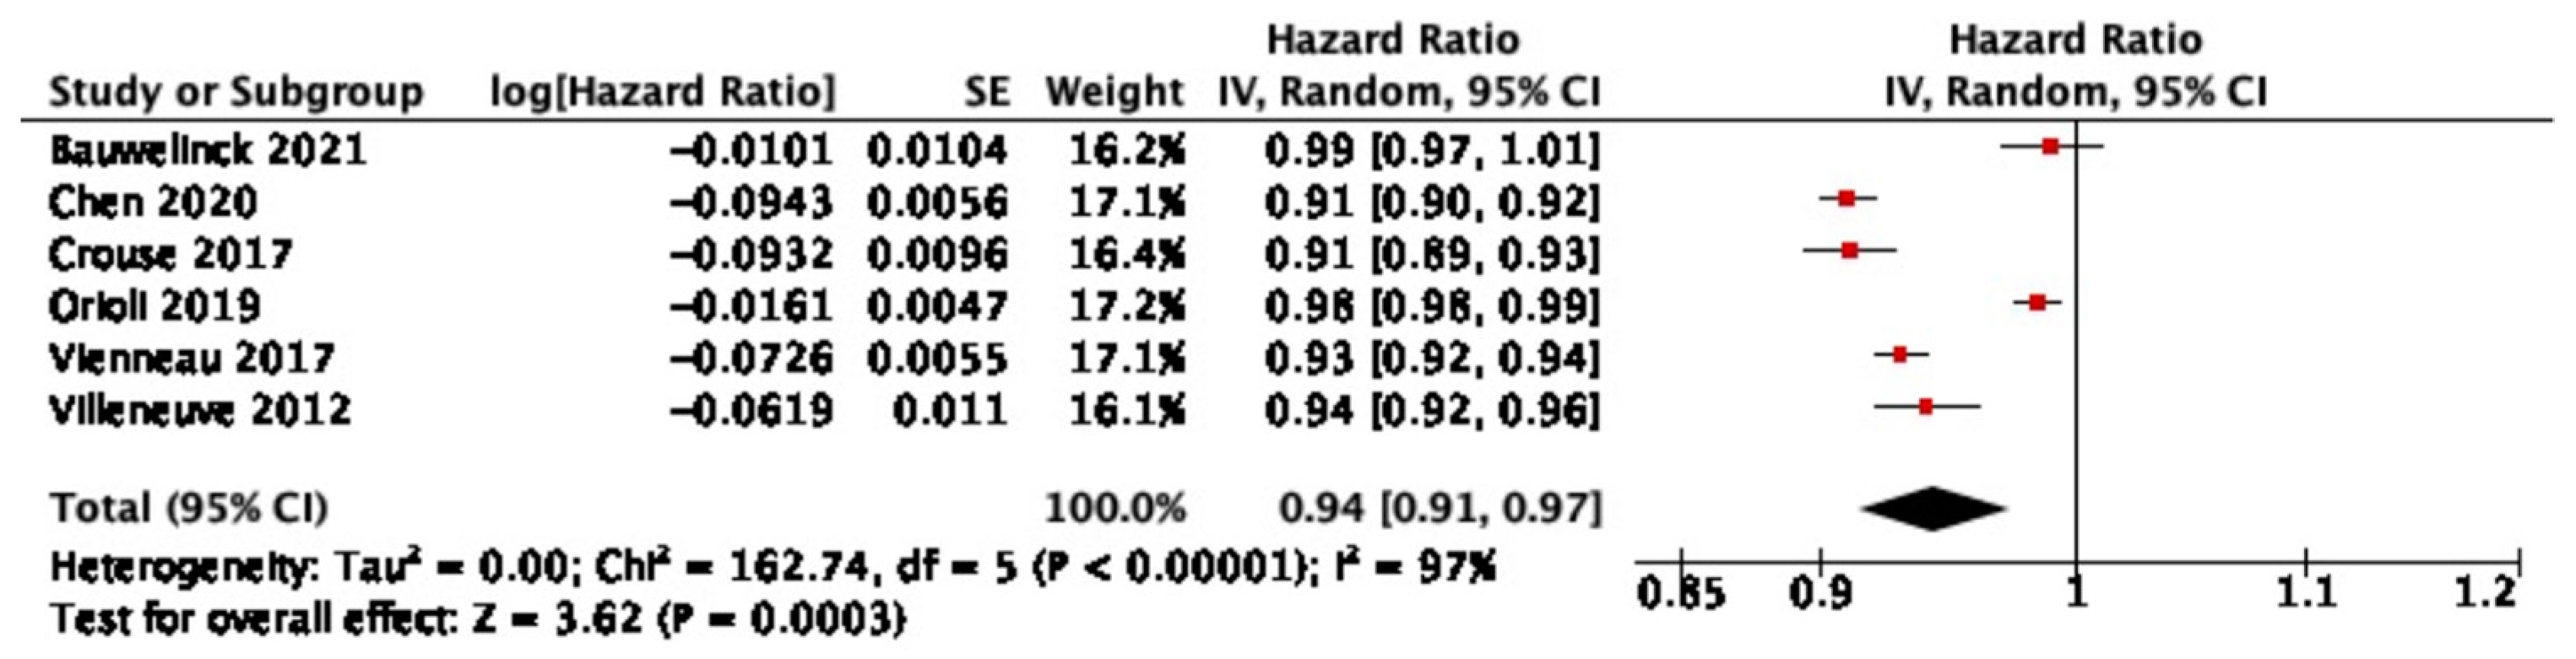
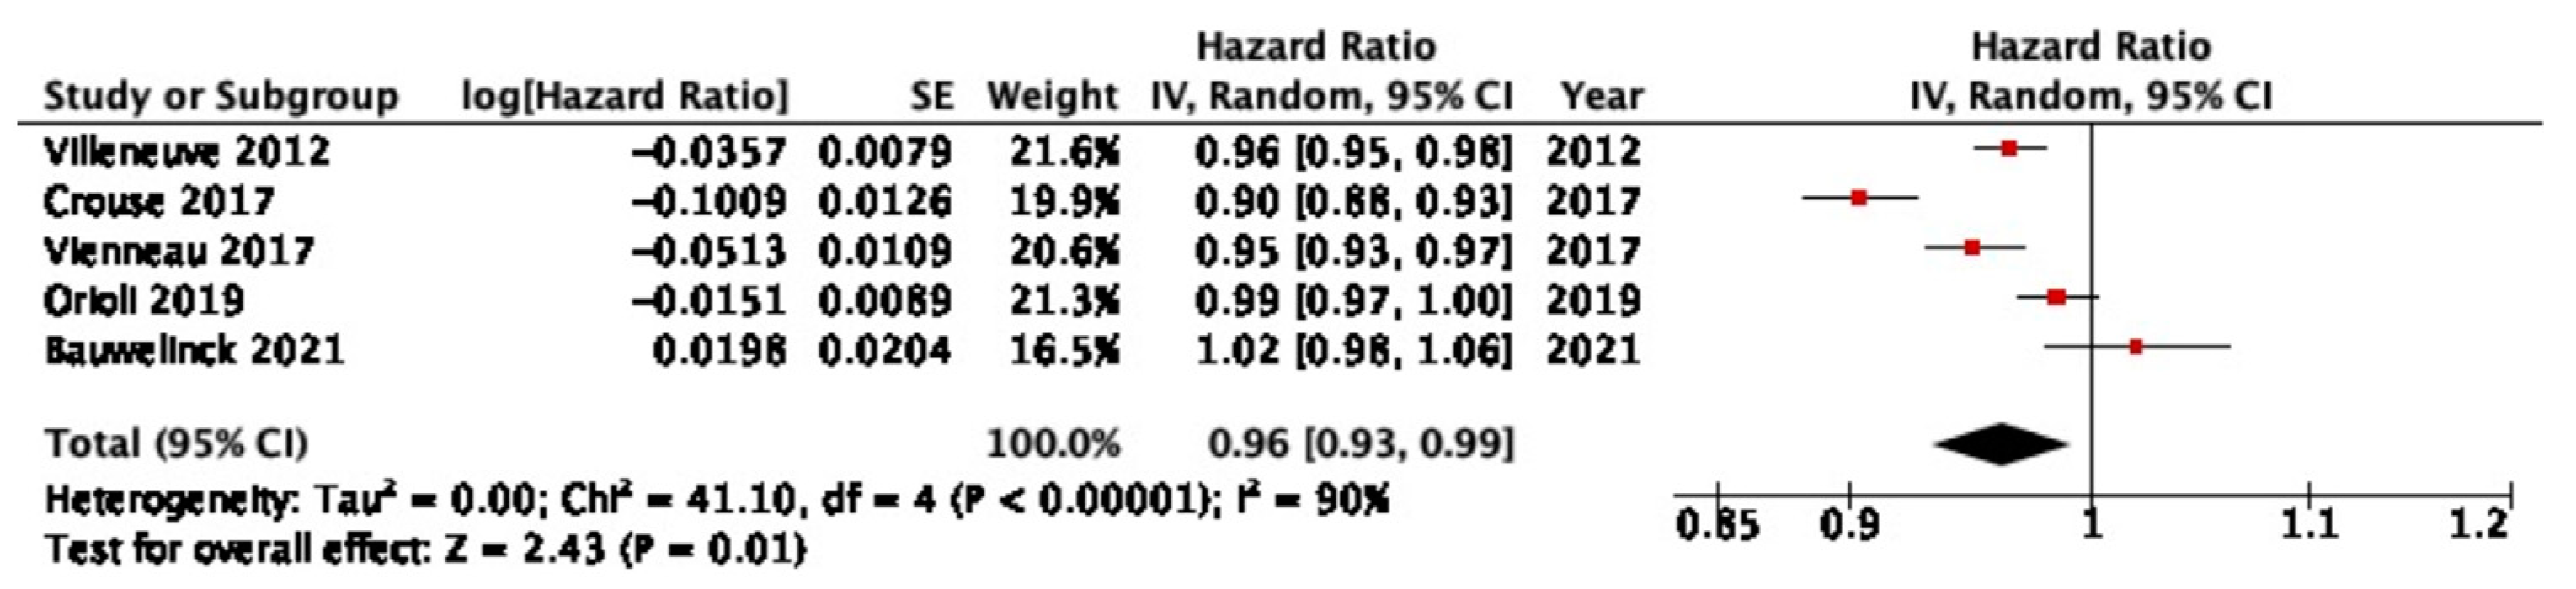
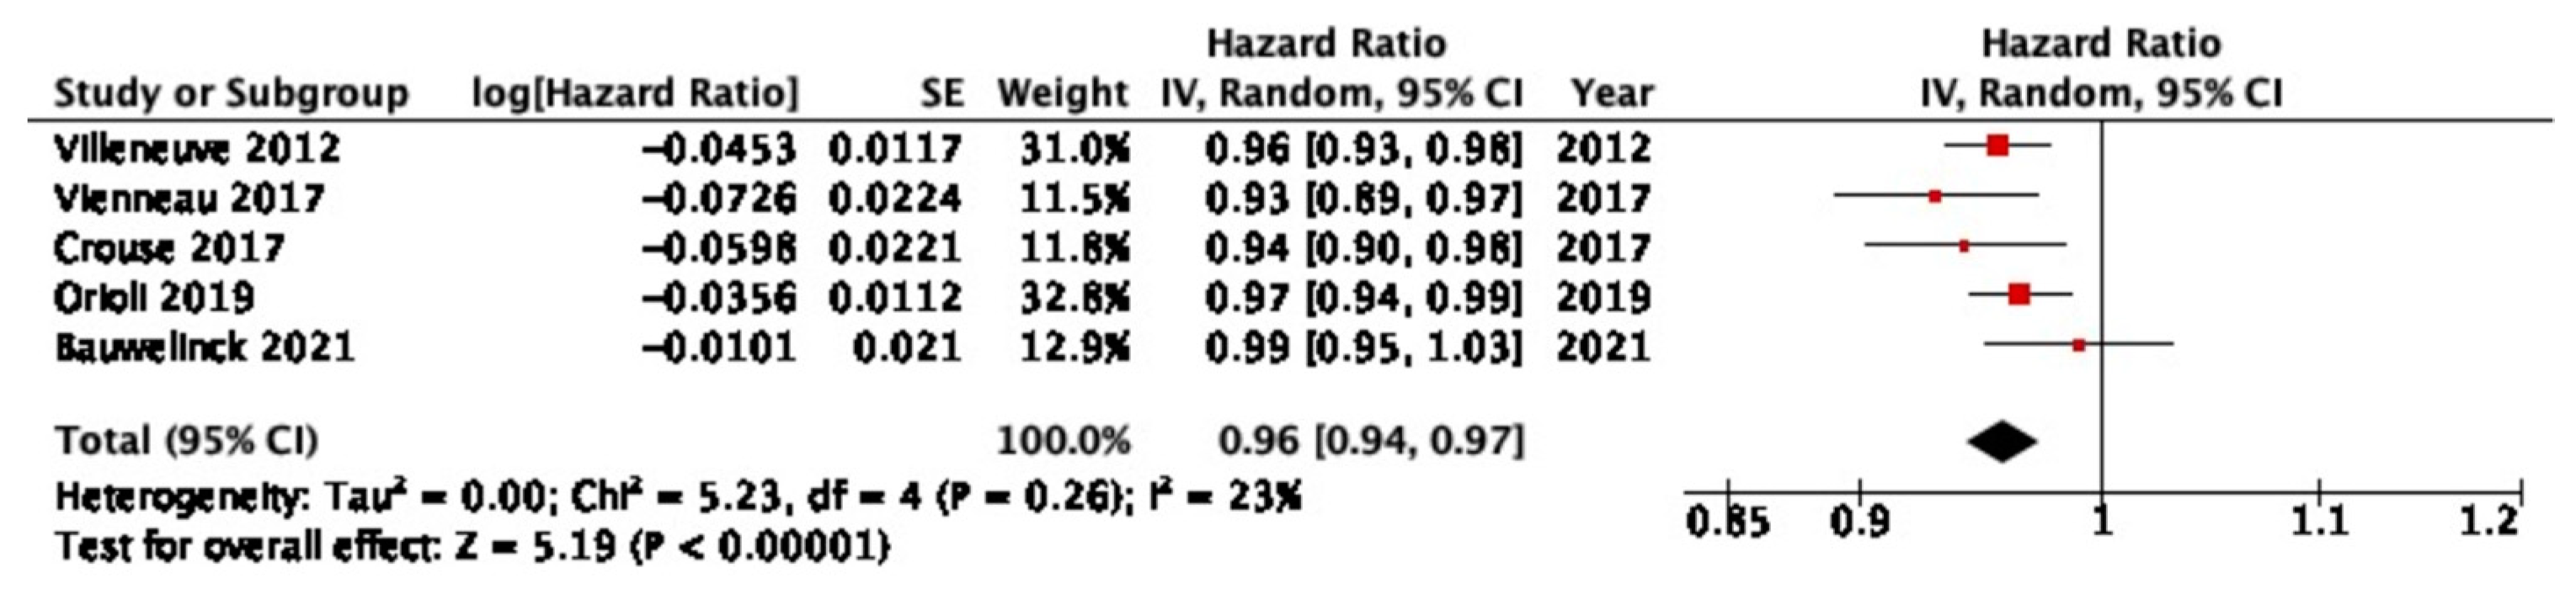
| Villeneuve et al. [18] | 2012 | Canada | Cohort Study | General population (>35 yrs old) | Not specified, approximately 575,000 | NDVI with 500 m buffer from residence address | IQR | CVD mortality | HR (95% C.I.) | 0.94 (0.92–0.96) | 90 | |
| IHD mortality | 0.96 (0.95–0.98) | |||||||||||
| Stroke mortality | 0.96 (0.93–0.98) | |||||||||||
| Richardson et al. [19] | 2013 | New Zeland | Cross-sectional | General population (>15 yrs old) | 8157 | % Green space at CAU level | Q3 vs. Q1 Q4 vs. Q1 | CVD prevalence | OR (95% C.I.) | 0.80 (0.64–0.99) [Q3 vs. Q1]; 0.84 (0.65–1.08) [Q4 vs. Q1] | 70 | |
| Tamosiunas et al. [20] | 2014 | Lithuania | Cohort study | General population (aged 45–72) | 5112 | Residence distance from city parks larger than 1 hectare | T3 vs. T1 | CVD | HR (95% C.I.) | 1.36 (1.03–1.80) | 70 | |
| Male | 1.51 (1.04–2.19) | |||||||||||
| Female | 1.22 (0.79–1.89) | |||||||||||
| Bixby et al. [21] | 2015 | UK | Ecological study | General population | Not specified, approximately 11 million people | % Green space of total city area | Q5 vs. Q1 | CVD mortality | RR (95% C.I.) | 50 | ||
| Male | 0.95 (0.86–1.05) | |||||||||||
| Female | 0.94 (0.83–1.07) | |||||||||||
| Massa et al. [22] | 2016 | Brazil | Cross-sectional | General population (>60 yrs old) | 1333 | % Green space at CAU level | Q4 vs. Q1 | CVD morbidity (self reported) | OR (95% C.I.) | 0.48 (0.42–0.54) | 50 | |
| Xu et al. [23] | 2017 | Hong Kong | Ecological study | General population | 58,854 CVD-related deaths | NDVI at CAU level | IQR | CVD mortality | RR (95% C.I.) | 0.88 (0.80, 0.98) | 60 | |
| Male | 0.83 (0.74, 0.93) | |||||||||||
| Female | 0.94 (0.84, 1.05) | |||||||||||
| Wang et al. [24] | 2017 | China | Cohort Study | General population (>65 yrs old) | 3544 | % Green space in 300 m buffer from residence address | 10% increase | CVD mortality | HR (95% C.I.) | 0.888 (0.817 to 0.964) | 90 | |
| IHD mortality | 0.912 (0.805 to 1.033) | |||||||||||
| Stroke mortality | 0.658 (0.519 to 0.833) | |||||||||||
| Crouse et al. [25] | 2017 | Canada | Cohort study | General population (≥19 yrs old) | 1,265,515 | NDVI with 250 m buffer from residence address | IQR | CVD mortality | HR (95% C.I.) | 0.911 (0.894–0.928) | 90 | |
| IHD mortality | 0.904 (0.882–0.927) | |||||||||||
| CBVD mortality | 0.942 (0.902–0.983) | |||||||||||
| da Silveira et al. [26] | 2017 | Brazil | Ecological study | General population | 6,320,446 | NDVI at CAU level | Q4 vs. Q1 | IHD mortality | Coefficient of the Bayesian CAR model (β) (95% C.I.) | −0.069 (−0.101–−0.038) | 50 | |
| CBVD mortality | −0.048 (−0.083–−0.012) | |||||||||||
| Vienneau et al. [27] | 2017 | Switzerland | Cohort study | General population (>30 yrs old) | 4,284,680 | NDVI in a 500 m buffer from residence address | IQR | CVD Mortality | HR (95% C.I.) | 0.93 (0.92–0.94) | 80 | |
| IHD mortality | 0.95 (0.93–0.97) | |||||||||||
| Stroke mortality | 0.93 (0.89–0.96) | |||||||||||
| Servadio et al. [28] | 2019 | USA | Ecological study | General population | Not specified, almost 6 million inhabitants | % Tree canopy cover at CAU level | CHD prevalence | Coefficient of the Bayesian CAR model (95% C.I.) | 0.3600 (p < 0.05) | 30 | ||
| Stroke prevalence | 0.2012 (p < 0.05) | |||||||||||
| Orioli et al. [29] | 2019 | Italy | Cohort Study | General population (>30 yrs old) | 1,263,721 | NDVI in 300 m from residence address | IQR | CVD mortality | HR (95% C.I.) | 0.984 (0.975, 0.994) | 90 | |
| IHD mortality | 0.985 (0.968, 1.001) | |||||||||||
| CBVD mortality | 0.965 (0.944, 0.986) | |||||||||||
| Stroke incidence | 0.976 (0.960, 0.993) | |||||||||||
| Seo et al. [30] | 2019 | South Korea | Cohort study | General population | 351,409 | % Green space of total district area, limited to built environment | Q4 vs. Q1 | CVD | HR (95% C.I.) | 0.85 (0.81–0.89) | 80 | |
| Male | 0.86 (0.80–0.92) | |||||||||||
| Female | 0.85 (0.79–0.91) | |||||||||||
| Under 40 yrs old | 0.88 (0.73–1.05) | |||||||||||
| 40–60 yrs old | 0.81 (0.75–0.87) | |||||||||||
| Over 60 yrs old | 0.89 (0.84–0.95) | |||||||||||
| CHD | 0.83 (0.78–0.89) | |||||||||||
| AMI | 0.77 (0.68–0.88) | |||||||||||
| Total stroke | 0.87 (0.82–0.93) | |||||||||||
| Ischemic stroke | 0.86 (0.80–0.94) | |||||||||||
| Hemorrhagic stroke | 0.98 (0.86–1.12) | |||||||||||
| Wang et al. [31] | 2019 | USA | Ecological study | General population | 1,530,981 | % Green space at CAU level | CVD mortality | Negative binomial coefficient (95% C.I.) | −0.0041 (−0.0092, 0.0010) | 60 | ||
| Jennings et al. [32] | 2019 | USA | Ecological study | General population | 335,327 | % Tree canopy cover and LAI at CAU level | CVD hospital admission | OR (95% C.I.) | 50 | |||
| Tree canopy cover | 0.98 (0.97–1.01) | |||||||||||
| LAI | 2.28 (0.91–5.74) | |||||||||||
| Astell-Burt et al. [10] | 2019 | Australia | Cross-sectional | General population | 46,786 | % Total green space and % tree canopy in 1600 m buffer from residence address | CVD prevalence | OR (95% C.I.) | 60 | |||
| Total green space | 0.999 (0.996–1.002) | |||||||||||
| Tree canopy cover | 0.996 (0.993–0.999) | |||||||||||
| Kim et al. [33] | 2019 | South Korea | Ecological study | General population | 317,869 | NDVI at district level | IQR | CVD mortality | Percent changes in cause-specific mortality (95% C.I.) | −2.56% (−4.68%, −0.39%) | 40 | |
| IHD mortality | −3.45% (−6.84%, 0.07%) | |||||||||||
| Paul et al. [34] | 2020 | Canada | Cohort study | General population (aged 35–85) | 4,251,146 | NDVI with 500 m buffer from residence address | IQR | Stroke morbidity | HR (95% C.I.) | 0.96 (0.94–0.97) | 90 | |
| Hartig et al. [35] | 2020 | Sweden | Ecological study | General population (>18 yrs old) | 5,498,405 | % Green space and % urban park at parish level | CVD mortality | IRR (95% C.I.) | 50 | |||
| Green space | 0.998 (0.995 to 1.000) | |||||||||||
| Urban park | 1.001 (0.998 to 1.004) | |||||||||||
| Astell-Burt et al. [36] | 2020 | Australia | Cohort Study | Type 2 Diabetes | 4166 | % of Tree canopy cover in 1600 m buffer from residence address | four intervals: <10% to 11–19.9%, 21–29.9%, or ≥30% (highest vs. lowest) | CVD mortality | HR (95% C.I.) | 0.75 (0.47, 1.16) | 80 | |
| first CVD hospital admission | 0.92 (0.77, 1.11) | |||||||||||
| first AMI hospital admission | 0.77 (0.42, 1.36) | |||||||||||
| Chen et al. [37] | 2020 | Canada | Cohort study | General population (>35 yrs old) | 1,290,288 | NDVI with a 250 buffer from residence address | IQR | CVD mortality | HR (95% C.I.) | 0.91 (0.90–0.93) | 90 | |
| AMI incidence | 0.94 (0.92–0.96) | |||||||||||
| HF incidence | 0.95 (0.93–0.96) | |||||||||||
| Yang et al. [38] | 2020 | China | Cross-sectional | General population (aged 18–74) | 24,845 | NDVI and SAVI with 500 m buffer from community centroid (not residential) | CVD prevalence | OR (95% C.I.) | 0.73 (0.65–0.83) | 70 | ||
| 0.74 (0.66–0.84) | ||||||||||||
| Lee et al. [39] | 2020 | Taiwan | Ecological study | General population | Not specified | NDVI at township level | CVD mortality | RR (95% C.I.) | 0.903 (0.791, 1.030) | 50 | ||
| Bauwelinck et al. [40] | 2021 | Belgium | Cohort Study | General population (>30 yrs old) | 2,185,170 | NDVI with 500 m buffer, % green space within buffer of 500 m | IQR | CVD mortality | HR (95% C.I.) | 80 | ||
| NDVI | 0.99 (0.97–1.01) | |||||||||||
| % Green space | 1.01 (1.00–1.02) | |||||||||||
| IHD mortality | ||||||||||||
| NDVI | 1.02 (0.98–1.05) | |||||||||||
| % Green space | 1.03 (1.01–1.05) | |||||||||||
| CBVD mortality | ||||||||||||
| NDVI | 0.99 (0.95–1.04) | |||||||||||
| % Green space | 1.00 (0.98–1.03) | |||||||||||
| Padmaka Silva et al. [41] | 2021 | Sri Lanka | Cross-sectional | Working-age men | 5268 | NDVI with 400 m from residence address | Heart disease, self reported | OR (95% C.I.) | 0.80 (0.64, 1.00) | 60 | ||
| Liu et al. [42] | 2021 | China | Cross-sectional | General population | 2100 | NDVI with 1500 m buffer from residence address | T3 vs. T1 | CVD prevalence | OR (95% C.I.) | 0.618 (0.434–0.879) | 70 | |
| Male | 0.768 (0.663, 0.890) | |||||||||||
| Female | 0.906 (0.805, 1.020) | |||||||||||
| Under 65 yrs old | 0.805 (0.669, 0.969) | |||||||||||
| Over 65 yrs old | 0.836 (0.752, 0.930) | |||||||||||
| Cheruvalath et al. [43] | 2022 | USA | Case-control study | General population (>18 yrs old) | 5870 (1174 case and 4696 control patients) | NDVI with 250 m buffer from residence address | IQR | Stroke | OR (95% C.I.) | 0.330 (0.111, 0.975) | 70 | |
| Ischemic stroke | 0.32 (0.088–1.178) | |||||||||||
| Wang et al. [44] | 2022 | China | Ecological study | General population | 469 CVD deaths | NDVI at district level | CVD mortality | Spearman correlation coefficient ρ (p-value) | −0.179 (p < 0.01) | 20 | ||
| Li et al. [45] | 2022 | China | Ecological study | General population | 6,334,875 | NDVI at CAU level | IHD | Coefficient of the Bayesian CAR model (β) (95% C.I.) | −0.0044 (−0.0077, −0.0010) | 40 | ||
| Li et al. [46] | 2022 | China | Cohort Study | General population (adults) | 32,521 | NDVI in buffer of 250 m from residence address | IQR | IHD incidence | HR (95% C.I.) | 0.89 (0.81, 0.98) | 80 | |
| Ponjoan et al. [47] | 2022 | Spain | Cohort study | DM type 2 patients (>18 yrs old) | 41,463 | NDVI with buffer of 300 m around the census tract | 0.01 increase | AMI | HR (95% C.I.) | 0.94 (0.89–0.99) | 90 | |
| Male | 0.91 (0.86–0.97) | |||||||||||
| Female | 0.99 (0.92–1.08) | |||||||||||
| Ho et al. [48] | 2022 | Hong-Kong | Ecological study | General population | 8697 hemorrhagic stroke deaths and 10,270 non-hemorrhagic stroke deaths | NDVI at CAU level | Two groups: low exposure (mean NDVI < 0.1) vs. high exposure (mean NDVI ≥ 0.1) | Hemorrhagic stroke mortality | OR (95% C.I.) | 0.961 (0.890, 1.037) | 40 | |
| Under 65 yrs old | 0.983 (0.844, 1.145) | |||||||||||
| 65 to 79 yrs old | 1.006 (0.882, 1.148) | |||||||||||
| Over 89 yrs old | 0.903 (0.801, 1.017) | |||||||||||
| Non-hemorrhagic stroke mortality | 1.066 (0.993, 1.145) | |||||||||||
| Under 65 yrs old | 1.101 (0.871, 1.391) | |||||||||||
| 65 to 79 yrs old | 1.091 (0.962, 1.237) | |||||||||||
| Over 89 yrs old | 1.031 (0.940, 1.132) |
3.1. CVD Mortality
3.2. IHD Mortality
3.3. CBVD Mortality
3.4. Other CVD Outcomes
3.5. Other CBVD Outcomes
3.6. Gender and Age Effects
4. Discussion
4.1. Summary of the Results
4.2. Study Limitations
5. Conclusions
Supplementary Materials
Author Contributions
Funding
Institutional Review Board Statement
Informed Consent Statement
Data Availability Statement
Conflicts of Interest
References
- 68% of the World Population Projected to Live in Urban Areas by 2050, Says UN|UN DESA|United Nations Department of Economic and Social Affairs. Available online: https://www.un.org/development/desa/en/news/population/2018-revision-of-world-urbanization-prospects.html (accessed on 5 September 2022).
- Integrating Health in Urban and Territorial Planning: A Sourcebook. Available online: https://www.who.int/publications-detail-redirect/9789240003170 (accessed on 5 September 2022).
- Why Urban Health Matters. Available online: https://apps.who.int/iris/handle/10665/70230 (accessed on 10 November 2022).
- Renalds, A.; Smith, T.H.; Hale, P.J. A Systematic Review of Built Environment and Health. Fam. Community Health 2010, 33, 68–78. [Google Scholar] [CrossRef] [PubMed]
- Carmichael, L.; Racioppi, F.; Calvert, T.; Sinnett, D. Environment and Health for European Cities in the 21st Century: Making a Difference; World Health Organization, Regional Office for Europe: Copenhagen, Denmark, 2017. [Google Scholar]
- Hunter, R.; Cleary, A.; Cleland, C.; Braubach, M. Urban Green Space Interventions and Health: A Review of Impacts and Effectiveness; Full Report; World Health Organisation: Geneva, Switzerland, 2017. [Google Scholar]
- Urban Green Spaces and Health. Available online: https://apps.who.int/iris/handle/10665/345751 (accessed on 10 November 2022).
- Astell-Burt, T.; Feng, X.; Kolt, G.S. Green space is associated with walking and moderate-to-vigorous physical activity (MVPA) in middle-to-older-aged adults: Findings from 203 883 Australians in the 45 and Up Study. Br. J. Sport. Med. 2013, 48, 404–406. [Google Scholar] [CrossRef] [PubMed]
- Roth, G.A.; Mensah, G.A.; Johnson, C.O.; Addolorato, G.; Ammirati, E.; Baddour, L.M.; Barengo, N.C.; Beaton, A.Z.; Benjamin, E.J.; Benziger, C.P.; et al. Global Burden of Cardiovascular Diseases and Risk Factors, 1990–2019: Update From the GBD 2019 Study. J. Am. Coll. Cardiol. 2020, 76, 2982–3021. [Google Scholar] [CrossRef] [PubMed]
- Astell-Burt, T.; Feng, X. Urban green space, tree canopy and prevention of cardiometabolic diseases: A multilevel longitudinal study of 46 786 Australians. Leuk. Res. 2019, 49, 926–933. [Google Scholar] [CrossRef] [PubMed]
- Gascon, M.; Triguero-Mas, M.; Martínez, D.; Dadvand, P.; Rojas-Rueda, D.; Plasència, A.; Nieuwenhuijsen, M.J. Residential green spaces and mortality: A systematic review. Environ. Int. 2016, 86, 60–67. [Google Scholar] [CrossRef]
- Page, M.J.; McKenzie, J.E.; Bossuyt, P.M.; Boutron, I.; Hoffmann, T.C.; Mulrow, C.D.; Shamseer, L.; Tetzlaff, J.M.; Akl, E.A.; Brennan, S.E.; et al. The PRISMA 2020 Statement: An Updated Guideline for Reporting Systematic Reviews. BMJ 2021, 372, n71. [Google Scholar] [CrossRef]
- Cochrane Handbook for Systematic Reviews and Interventions. Available online: http://training.cochrane.org/handbook (accessed on 3 June 2020).
- Richardson, E.A.; Mitchell, R. Gender differences in relationships between urban green space and health in the United Kingdom. Soc. Sci. Med. 2010, 71, 568–575. [Google Scholar] [CrossRef]
- Richardson, E.; Pearce, J.; Mitchell, R.; Day, P.; Kingham, S. The association between green space and cause-specific mortality in urban New Zealand: An ecological analysis of green space utility. BMC Public Health 2010, 10, 240. [Google Scholar] [CrossRef]
- Richardson, E.A.; Mitchell, R.; Hartig, T.; de Vries, S.; Astell-Burt, T.; Frumkin, H. Green cities and health: A question of scale? J. Epidemiol. Community Health 2012, 66, 160–165. [Google Scholar] [CrossRef]
- Pereira, G.; Foster, S.; Martin, K.; Christian, H.; Boruff, B.J.; Knuiman, M.; Giles-Corti, B. The association between neighborhood greenness and cardiovascular disease: An observational study. BMC Public Health 2012, 12, 466. [Google Scholar] [CrossRef]
- Villeneuve, P.J.; Jerrett, M.; Su, J.G.; Burnett, R.T.; Chen, H.; Wheeler, A.J.; Goldberg, M.S. A cohort study relating urban green space with mortality in Ontario, Canada. Environ. Res. 2012, 115, 51–58. [Google Scholar] [CrossRef] [PubMed]
- Richardson, E.; Pearce, J.; Mitchell, R.; Kingham, S. Role of physical activity in the relationship between urban green space and health. Public Health 2013, 127, 318–324. [Google Scholar] [CrossRef]
- Tamosiunas, A.; Grazuleviciene, R.; Luksiene, D.; Dedele, A.; Reklaitiene, R.; Baceviciene, M.; Vencloviene, J.; Bernotiene, G.; Radisauskas, R.; Malinauskiene, V.; et al. Accessibility and use of urban green spaces, and cardiovascular health: Findings from a Kaunas cohort study. Environ. Health 2014, 13, 20. [Google Scholar] [CrossRef] [PubMed]
- Bixby, H.; Hodgson, S.; Fortunato, L.; Hansell, A.; Fecht, D. Associations between Green Space and Health in English Cities: An Ecological, Cross-Sectional Study. PLoS ONE 2015, 10, e0119495. [Google Scholar] [CrossRef] [PubMed]
- Massa, K.H.C.; Pabayo, R.; Lebrão, M.L.; Filho, A.D.P.C. Environmental factors and cardiovascular diseases: The association of income inequality and green spaces in elderly residents of São Paulo, Brazil. BMJ Open 2016, 6, e011850. [Google Scholar] [CrossRef] [PubMed]
- Xu, L.; Ren, C.; Yuan, C.; Nichol, J.E.; Goggins, W.B. An Ecological Study of the Association between Area-Level Green Space and Adult Mortality in Hong Kong. Climate 2017, 5, 55. [Google Scholar] [CrossRef]
- Wang, D.; Lau, K.K.-L.; Yu, R.; Wong, S.Y.-S.; Kwok, T.T.Y.; Woo, J. Neighbouring green space and mortality in community-dwelling elderly Hong Kong Chinese: A cohort study. BMJ Open 2017, 7, e015794. [Google Scholar] [CrossRef]
- Crouse, D.L.; Pinault, L.; Balram, A.; Hystad, P.; Peters, P.A.; Chen, H.; van Donkelaar, A.; Martin, R.V.; Ménard, R.; Robichaud, A.; et al. Urban greenness and mortality in Canada’s largest cities: A national cohort study. Lancet Planet. Health 2017, 1, e289–e297. [Google Scholar] [CrossRef] [PubMed]
- Da Silveira, I.H.; Junger, W.L. Green spaces and mortality due to cardiovascular diseases in the city of Rio de Janeiro. Rev. Saude Publica 2018, 52, 49. [Google Scholar] [CrossRef]
- Vienneau, D.; de Hoogh, K.; Faeh, D.; Kaufmann, M.; Wunderli, J.M.; Röösli, M.; SNC Study Group. More than clean air and tranquillity: Residential green is independently associated with decreasing mortality. Environ. Int. 2017, 108, 176–184. [Google Scholar] [CrossRef]
- Servadio, J.L.; Lawal, A.S.; Davis, T.; Bates, J.; Russell, A.G.; Ramaswami, A.; Convertino, M.; Botchwey, N. Demographic Inequities in Health Outcomes and Air Pollution Exposure in the Atlanta Area and its Relationship to Urban Infrastructure. J. Urban Health 2018, 96, 219–234. [Google Scholar] [CrossRef] [PubMed]
- Orioli, R.; Antonucci, C.; Scortichini, M.; Cerza, F.; Marando, F.; Ancona, C.; Manes, F.; Davoli, M.; Michelozzi, P.; Forastiere, F.; et al. Exposure to Residential Greenness as a Predictor of Cause-Specific Mortality and Stroke Incidence in the Rome Longitudinal Study. Environ. Health Perspect. 2019, 127, 027002. [Google Scholar] [CrossRef] [PubMed]
- Seo, S.; Choi, S.; Kim, K.; Kim, S.M.; Park, S.M. Association between urban green space and the risk of cardiovascular disease: A longitudinal study in seven Korean metropolitan areas. Environ. Int. 2019, 125, 51–57. [Google Scholar] [CrossRef] [PubMed]
- Wang, H.; Tassinary, L.G. Effects of greenspace morphology on mortality at the neighbourhood level: A cross-sectional ecological study. Lancet Planet. Health 2019, 3, e460–e468. [Google Scholar] [CrossRef]
- Jennings, V.; Gragg, R.S.; Brown, C.P.; Hartel, D.; Kuehler, E.; Sinykin, A.; Johnson, E.; Kondo, M. Structural Characteristics of Tree Cover and the Association with Cardiovascular and Respiratory Health in Tampa, FL. J. Urban Health 2019, 96, 669–681. [Google Scholar] [CrossRef]
- Kim, S.; Kim, H.; Lee, J.-T. Interactions between Ambient Air Particles and Greenness on Cause-specific Mortality in Seven Korean Metropolitan Cities, 2008–2016. Int. J. Environ. Res. Public Health 2019, 16, 1866. [Google Scholar] [CrossRef]
- Paul, L.A.; Hystad, P.; Burnett, R.T.; Kwong, J.C.; Crouse, D.L.; van Donkelaar, A.; Tu, K.; Lavigne, E.; Copes, R.; Martin, R.V.; et al. Urban green space and the risks of dementia and stroke. Environ. Res. 2020, 186, 109520. [Google Scholar] [CrossRef]
- Hartig, T.; Astell-Burt, T.; Bergsten, Z.; Amcoff, J.; Mitchell, R.; Feng, X. Associations between greenspace and mortality vary across contexts of community change: A longitudinal ecological study. J. Epidemiol. Community Health 2020, 74, 534–540. [Google Scholar] [CrossRef]
- Astell-Burt, T.; Navakatikyan, M.A.; Walsan, R.; Davis, W.; Figtree, G.; Arnolda, L.; Feng, X. Green space and cardiovascular health in people with type 2 diabetes. Health Place 2021, 69, 102554. [Google Scholar] [CrossRef]
- Chen, H.; Burnett, R.T.; Bai, L.; Kwong, J.C.; Crouse, D.L.; Lavigne, E.; Goldberg, M.S.; Copes, R.; Benmarhnia, T.; Ilango, S.D.; et al. Residential Greenness and Cardiovascular Disease Incidence, Readmission, and Mortality. Environ. Health Perspect. 2020, 128, 87005. [Google Scholar] [CrossRef]
- Yang, B.-Y.; Hu, L.-W.; Jalaludin, B.; Knibbs, L.D.; Markevych, I.; Heinrich, J.; Bloom, M.S.; Morawska, L.; Lin, S.; Jalava, P.; et al. Association Between Residential Greenness, Cardiometabolic Disorders, and Cardiovascular Disease among Adults in China. JAMA Netw. Open 2020, 3, e2017507. [Google Scholar] [CrossRef] [PubMed]
- Lee, H.-Y.; Wu, C.-D.; Chang, Y.-T.; Chern, Y.-R.; Lung, S.-C.C.; Su, H.-J.; Pan, W.-C. Association between Surrounding Greenness and Mortality: An Ecological Study in Taiwan. Int. J. Environ. Res. Public Health 2020, 17, 4525. [Google Scholar] [CrossRef] [PubMed]
- Bauwelinck, M.; Casas, L.; Nawrot, T.S.; Nemery, B.; Trabelsi, S.; Thomas, I.; Aerts, R.; Lefebvre, W.; Vanpoucke, C.; Van Nieuwenhuyse, A.; et al. Residing in urban areas with higher green space is associated with lower mortality risk: A census-based cohort study with ten years of follow-up. Environ. Int. 2021, 148, 106365. [Google Scholar] [CrossRef] [PubMed]
- Silva, J.P.; Singh, A.; Oldenburg, B.; Gunathunga, W.; Alagiyawanna, A.M.A.A.P.; Mavoa, S. Associations between residential greenness and self-reported heart disease in Sri Lankan men: A cross-sectional study. PLoS ONE 2021, 16, e0252382. [Google Scholar] [CrossRef]
- Liu, T.; Cai, B.; Peng, W.; Xiao, L.; Shi, H.; Wu, X.; Gao, H.; Jia, X. Association of neighborhood greenness exposure with cardiovascular diseases and biomarkers. Int. J. Hyg. Environ. Health 2021, 234, 113738. [Google Scholar] [CrossRef]
- Cheruvalath, H.; Homa, J.; Singh, M.; Vilar, P.; Kassam, A.; A Rovin, R. Associations Between Residential Greenspace, Socioeconomic Status, and Stroke: A Matched Case-Control Study. J. Patient-Cent. Res. Rev. 2022, 9, 89–97. [Google Scholar] [CrossRef]
- Wang, B.; Gu, K.; Dong, D.; Fang, Y.; Tang, L. Analysis of Spatial Distribution of CVD and Multiple Environmental Factors in Urban Residents. Comput. Intell. Neurosci. 2022, 2022, 9799054. [Google Scholar] [CrossRef]
- Li, X.; Zhou, L.; Liu, X.; Dun, Q.; Ma, L.; Zou, Y. Community built environment and the associated ischemic heart disease risk: Evidence from multi-source data in Wuhan, China. J. Transp. Health 2022, 25, 101371. [Google Scholar] [CrossRef]
- Li, T.; Yu, Z.; Xu, L.; Wu, Y.; Yu, L.; Yang, Z.; Shen, P.; Lin, H.; Shui, L.; Tang, M.; et al. Residential greenness, air pollution, and incident ischemic heart disease: A prospective cohort study in China. Sci. Total. Environ. 2022, 838, 155881. [Google Scholar] [CrossRef]
- Ponjoan, A.; Blanch, J.; Alves-Cabratosa, L.; Martí-Lluch, R.; Comas-Cufí, M.; Cirach, M.; Nieuwenhuijsen, M.; Garcia-Gil, M.d.M.; Ramos, R. Impact of residential greenness on myocardial infarction in the population with diabetes: A sex-dependent association? Environ. Res. 2021, 205, 112449. [Google Scholar] [CrossRef]
- Ho, H.C.; Guo, H.; Chan, T.-C.; Shi, Y.; Webster, C.; Fong, K.N. Community planning for a “healthy built environment” via a human-environment nexus? A multifactorial assessment of environmental characteristics and age-specific stroke mortality in Hong Kong. Chemosphere 2021, 287, 132043. [Google Scholar] [CrossRef] [PubMed]
- World Cities Report 2022. Available online: https://unhabitat.org/wcr/ (accessed on 14 November 2022).
- Roth, G.A.; Johnson, C.; Abajobir, A.; Abd-Allah, F.; Abera, S.F.; Abyu, G.; Ahmed, M.; Aksut, B.; Alam, T.; Alam, K.; et al. Global, Regional, and National Burden of Cardiovascular Diseases for 10 Causes, 1990 to 2015. J. Am. Coll. Cardiol. 2017, 70, 1–25. [Google Scholar] [CrossRef] [PubMed]
- Hartig, T.; Mitchell, R.; de Vries, S.; Frumkin, H. Nature and Health. Annu. Rev. Public Health 2014, 35, 207–228. [Google Scholar] [CrossRef] [PubMed]
- Wendel-Vos, G.W.; Schuit, A.J.; DE Niet, R.; Boshuizen, H.C.; Saris, W.H.M.; Kromhout, D. Factors of the Physical Environment Associated with Walking and Bicycling. Med. Sci. Sport. Exerc. 2004, 36, 725–730. [Google Scholar] [CrossRef]
- Climate Change as a Threat to Health and Well-Being in Europe: Focus on Heat and Infectious Diseases—European Environment Agency. Available online: https://www.eea.europa.eu/publications/climate-change-impacts-on-health (accessed on 15 November 2022).
- Urban Adaptation in Europe—European Environment Agency. Available online: https://www.eea.europa.eu/publications/urban-adaptation-in-europe (accessed on 15 November 2022).
- Nature-Based Solutions. Available online: https://research-and-innovation.ec.europa.eu/research-area/environment/nature-based-solutions_en (accessed on 10 November 2022).
- Jamei, E.; Chau, H.W.; Seyedmahmoudian, M.; Stojcevski, A. Review on the cooling potential of green roofs in different climates. Sci. Total. Environ. 2021, 791, 148407. [Google Scholar] [CrossRef]
- Loughner, C.P.; Allen, D.; Zhang, D.-L.; Pickering, K.E.; Dickerson, R.; Landry, L. Roles of Urban Tree Canopy and Buildings in Urban Heat Island Effects: Parameterization and Preliminary Results. J. Appl. Meteorol. Clim. 2012, 51, 1775–1793. [Google Scholar] [CrossRef]
- Abhijith, K.; Kumar, P.; Gallagher, J.; McNabola, A.; Baldauf, R.; Pilla, F.; Broderick, B.; Di Sabatino, S.; Pulvirenti, B. Air pollution abatement performances of green infrastructure in open road and built-up street canyon environments—A review. Atmos. Environ. 2017, 162, 71–86. [Google Scholar] [CrossRef]
- González-Oreja, J.A.; Bonache-Regidor, C.; de la Fuente-Díaz-Ordaz, A.A. Far from the Noisy World? Modelling the Relationships Between Park Size, Tree Cover and Noise Levels in Urban Green Spaces of the City of Puebla, Mexico. Interciencia 2010, 35, 486–492. [Google Scholar]
- Irvine, K.N.; Devine-Wright, P.; Payne, S.R.; Fuller, R.A.; Painter, B.; Gaston, K.J. Green space, soundscape and urban sustainability: An interdisciplinary, empirical study. Local Environ. 2009, 14, 155–172. [Google Scholar] [CrossRef]
- Shuda, Q.; Bougoulias, M.E.; Kass, R. Effect of nature exposure on perceived and physiologic stress: A systematic review. Complement. Ther. Med. 2020, 53, 102514. [Google Scholar] [CrossRef]
- World Health Organization. Regional Office for Europe. Burden of disease from Environmental Noise: Quantification of Healthy Life Years Lost in Europe; World Health Organization. Regional Office for Europe: Copenhagen, Denmark, 2011. [Google Scholar]
- Jennings, V.; Bamkole, O. The Relationship between Social Cohesion and Urban Green Space: An Avenue for Health Promotion. Int. J. Environ. Res. Public Health 2019, 16, 452. [Google Scholar] [CrossRef] [PubMed]
- Wan, C.; Shen, G.Q.; Choi, S. Underlying relationships between public urban green spaces and social cohesion: A systematic literature review. City Cult. Soc. 2021, 24, 100383. [Google Scholar] [CrossRef]
- Grigoletto, A.; Mauro, M.; Latessa, P.M.; Iannuzzi, V.; Gori, D.; Campa, F.; Greco, G.; Toselli, S. Impact of Different Types of Physical Activity in Green Urban Space on Adult Health and Behaviors: A Systematic Review. Eur. J. Investig. Health Psychol. Educ. 2021, 11, 20. [Google Scholar] [CrossRef] [PubMed]
- Inequality in the Built Environment Underlies Key Health Disparities in Physical Activity and Obesity|Pediatrics|American Academy of Pediatrics. Available online: https://publications.aap.org/pediatrics/article/117/2/417/68499/Inequality-in-the-Built-Environment-Underlies-Key (accessed on 10 November 2022).
- Wolch, J.R.; Byrne, J.; Newell, J.P. Urban green space, public health, and environmental justice: The challenge of making cities “just green enough”. Landsc. Urban Plan. 2014, 125, 234–244. [Google Scholar] [CrossRef]
- Mitchell, R.; Popham, F. Effect of exposure to natural environment on health inequalities: An observational population study. Lancet 2008, 372, 1655–1660. [Google Scholar] [CrossRef]
- Sang, Å.O.; Knez, I.; Gunnarsson, B.; Hedblom, M. The effects of naturalness, gender, and age on how urban green space is perceived and used. Urban For. Urban Green. 2016, 18, 268–276. [Google Scholar] [CrossRef]
- Derose, K.P.; Han, B.; Williamson, S.; Cohen, D.A. Gender Disparities in Park Use and Physical Activity among Residents of High-Poverty Neighborhoods in Los Angeles. Women’s Health Issues 2017, 28, 6–13. [Google Scholar] [CrossRef]
- Polko, P.; Kimic, K. Gender as a factor differentiating the perceptions of safety in urban parks. Ain Shams Eng. J. 2021, 13, 101608. [Google Scholar] [CrossRef]
- Rubin, J.B.; Borden, W.B. Coronary Heart Disease in Young Adults. Curr. Atheroscler. Rep. 2012, 14, 140–149. [Google Scholar] [CrossRef]
- Pettorelli, N.; Vik, J.O.; Mysterud, A.; Gaillard, J.-M.; Tucker, C.J.; Stenseth, N.C. Using the satellite-derived NDVI to assess ecological responses to environmental change. Trends Ecol. Evol. 2005, 20, 503–510. [Google Scholar] [CrossRef]
- Tischer, C.; Gascon, M.; Fernández-Somoano, A.; Tardón, A.; Materola, A.L.; Ibarluzea, J.; Ferrero, A.; Estarlich, M.; Cirach, M.; Vrijheid, M.; et al. Urban green and grey space in relation to respiratory health in children. Eur. Respir. J. 2017, 49, 1502112. [Google Scholar] [CrossRef] [PubMed]
- Callaghan, A.; McCombe, G.; Harrold, A.; McMeel, C.; Mills, G.; Moore-Cherry, N.; Cullen, W. The impact of green spaces on mental health in urban settings: A scoping review. J. Ment. Health 2020, 30, 179–193. [Google Scholar] [CrossRef] [PubMed]
- Hansford, K.M.; Wheeler, B.W.; Tschirren, B.; Medlock, J.M. Questing Ixodes ricinus ticks and Borrelia spp. in urban green space across Europe: A review. Zoonoses Public Health 2022, 69, 153–166. [Google Scholar] [CrossRef] [PubMed]


Disclaimer/Publisher’s Note: The statements, opinions and data contained in all publications are solely those of the individual author(s) and contributor(s) and not of MDPI and/or the editor(s). MDPI and/or the editor(s) disclaim responsibility for any injury to people or property resulting from any ideas, methods, instructions or products referred to in the content. |
© 2023 by the authors. Licensee MDPI, Basel, Switzerland. This article is an open access article distributed under the terms and conditions of the Creative Commons Attribution (CC BY) license (https://creativecommons.org/licenses/by/4.0/).
Share and Cite
Bianconi, A.; Longo, G.; Coa, A.A.; Fiore, M.; Gori, D. Impacts of Urban Green on Cardiovascular and Cerebrovascular Diseases—A Systematic Review and Meta-Analysis. Int. J. Environ. Res. Public Health 2023, 20, 5966. https://doi.org/10.3390/ijerph20115966
Bianconi A, Longo G, Coa AA, Fiore M, Gori D. Impacts of Urban Green on Cardiovascular and Cerebrovascular Diseases—A Systematic Review and Meta-Analysis. International Journal of Environmental Research and Public Health. 2023; 20(11):5966. https://doi.org/10.3390/ijerph20115966
Chicago/Turabian StyleBianconi, Alessandro, Giulia Longo, Angela Andrea Coa, Matteo Fiore, and Davide Gori. 2023. "Impacts of Urban Green on Cardiovascular and Cerebrovascular Diseases—A Systematic Review and Meta-Analysis" International Journal of Environmental Research and Public Health 20, no. 11: 5966. https://doi.org/10.3390/ijerph20115966
APA StyleBianconi, A., Longo, G., Coa, A. A., Fiore, M., & Gori, D. (2023). Impacts of Urban Green on Cardiovascular and Cerebrovascular Diseases—A Systematic Review and Meta-Analysis. International Journal of Environmental Research and Public Health, 20(11), 5966. https://doi.org/10.3390/ijerph20115966