

Evaluating Spatial Identity Based on Climate Adaptation in Small Cities


Abstract
1. Introduction
2. Materials and Method
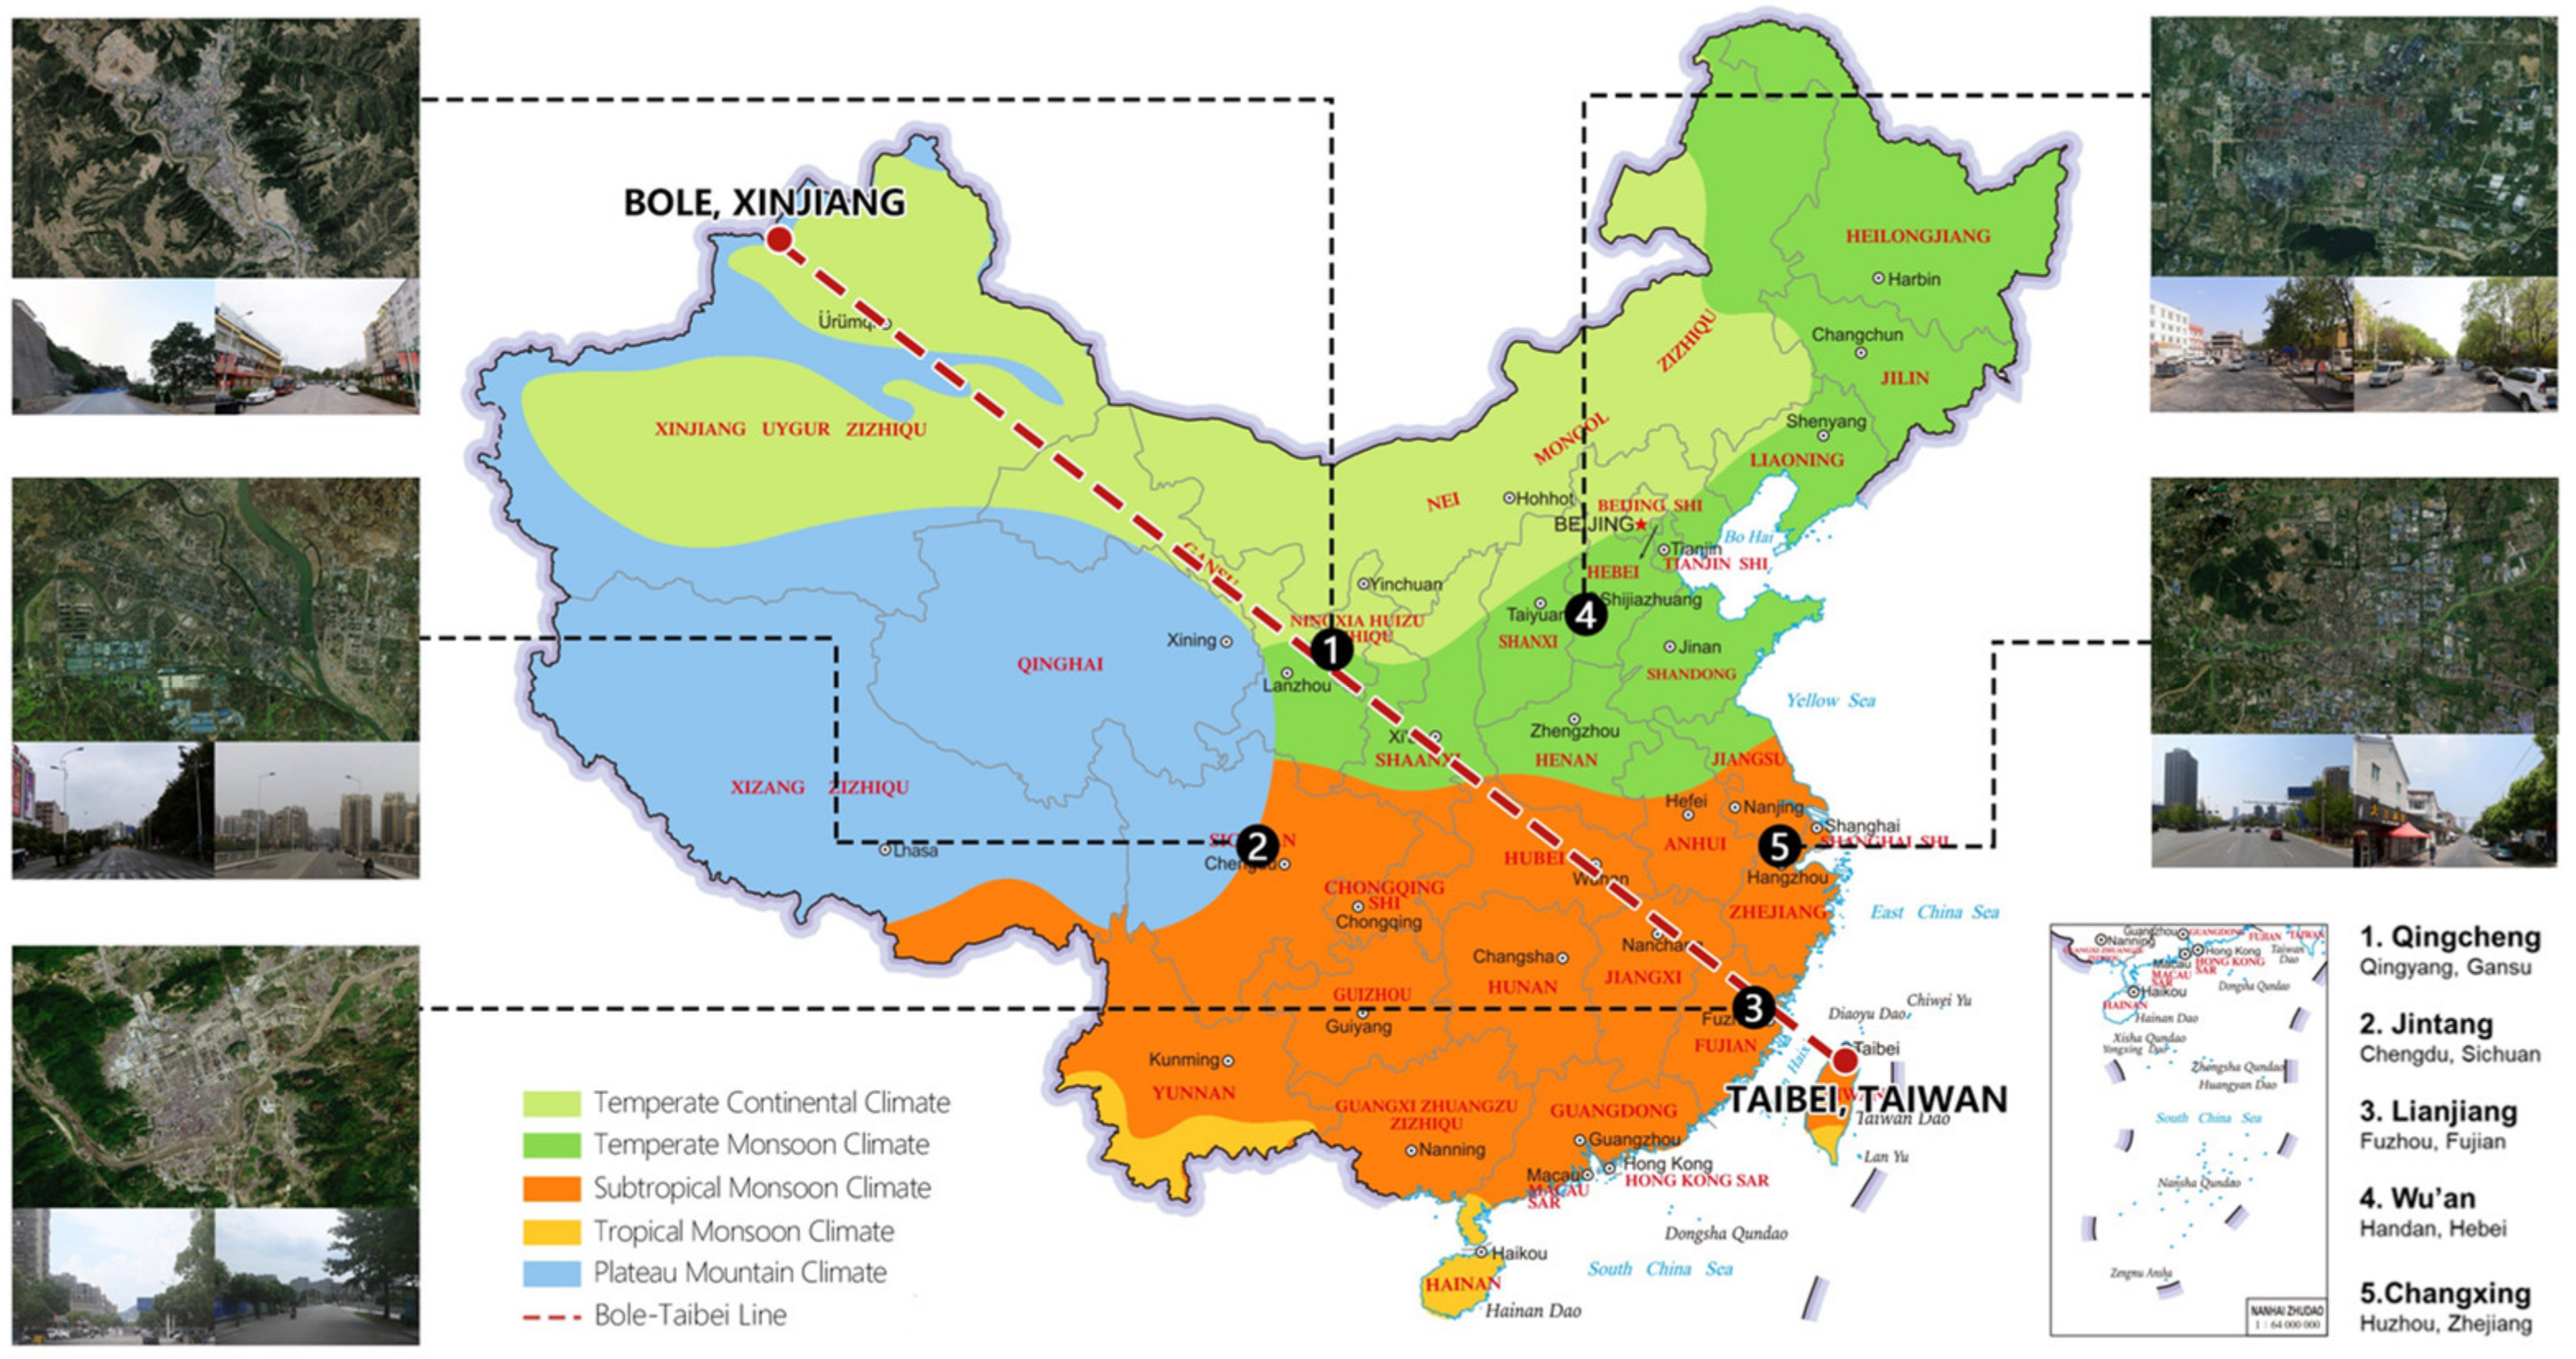
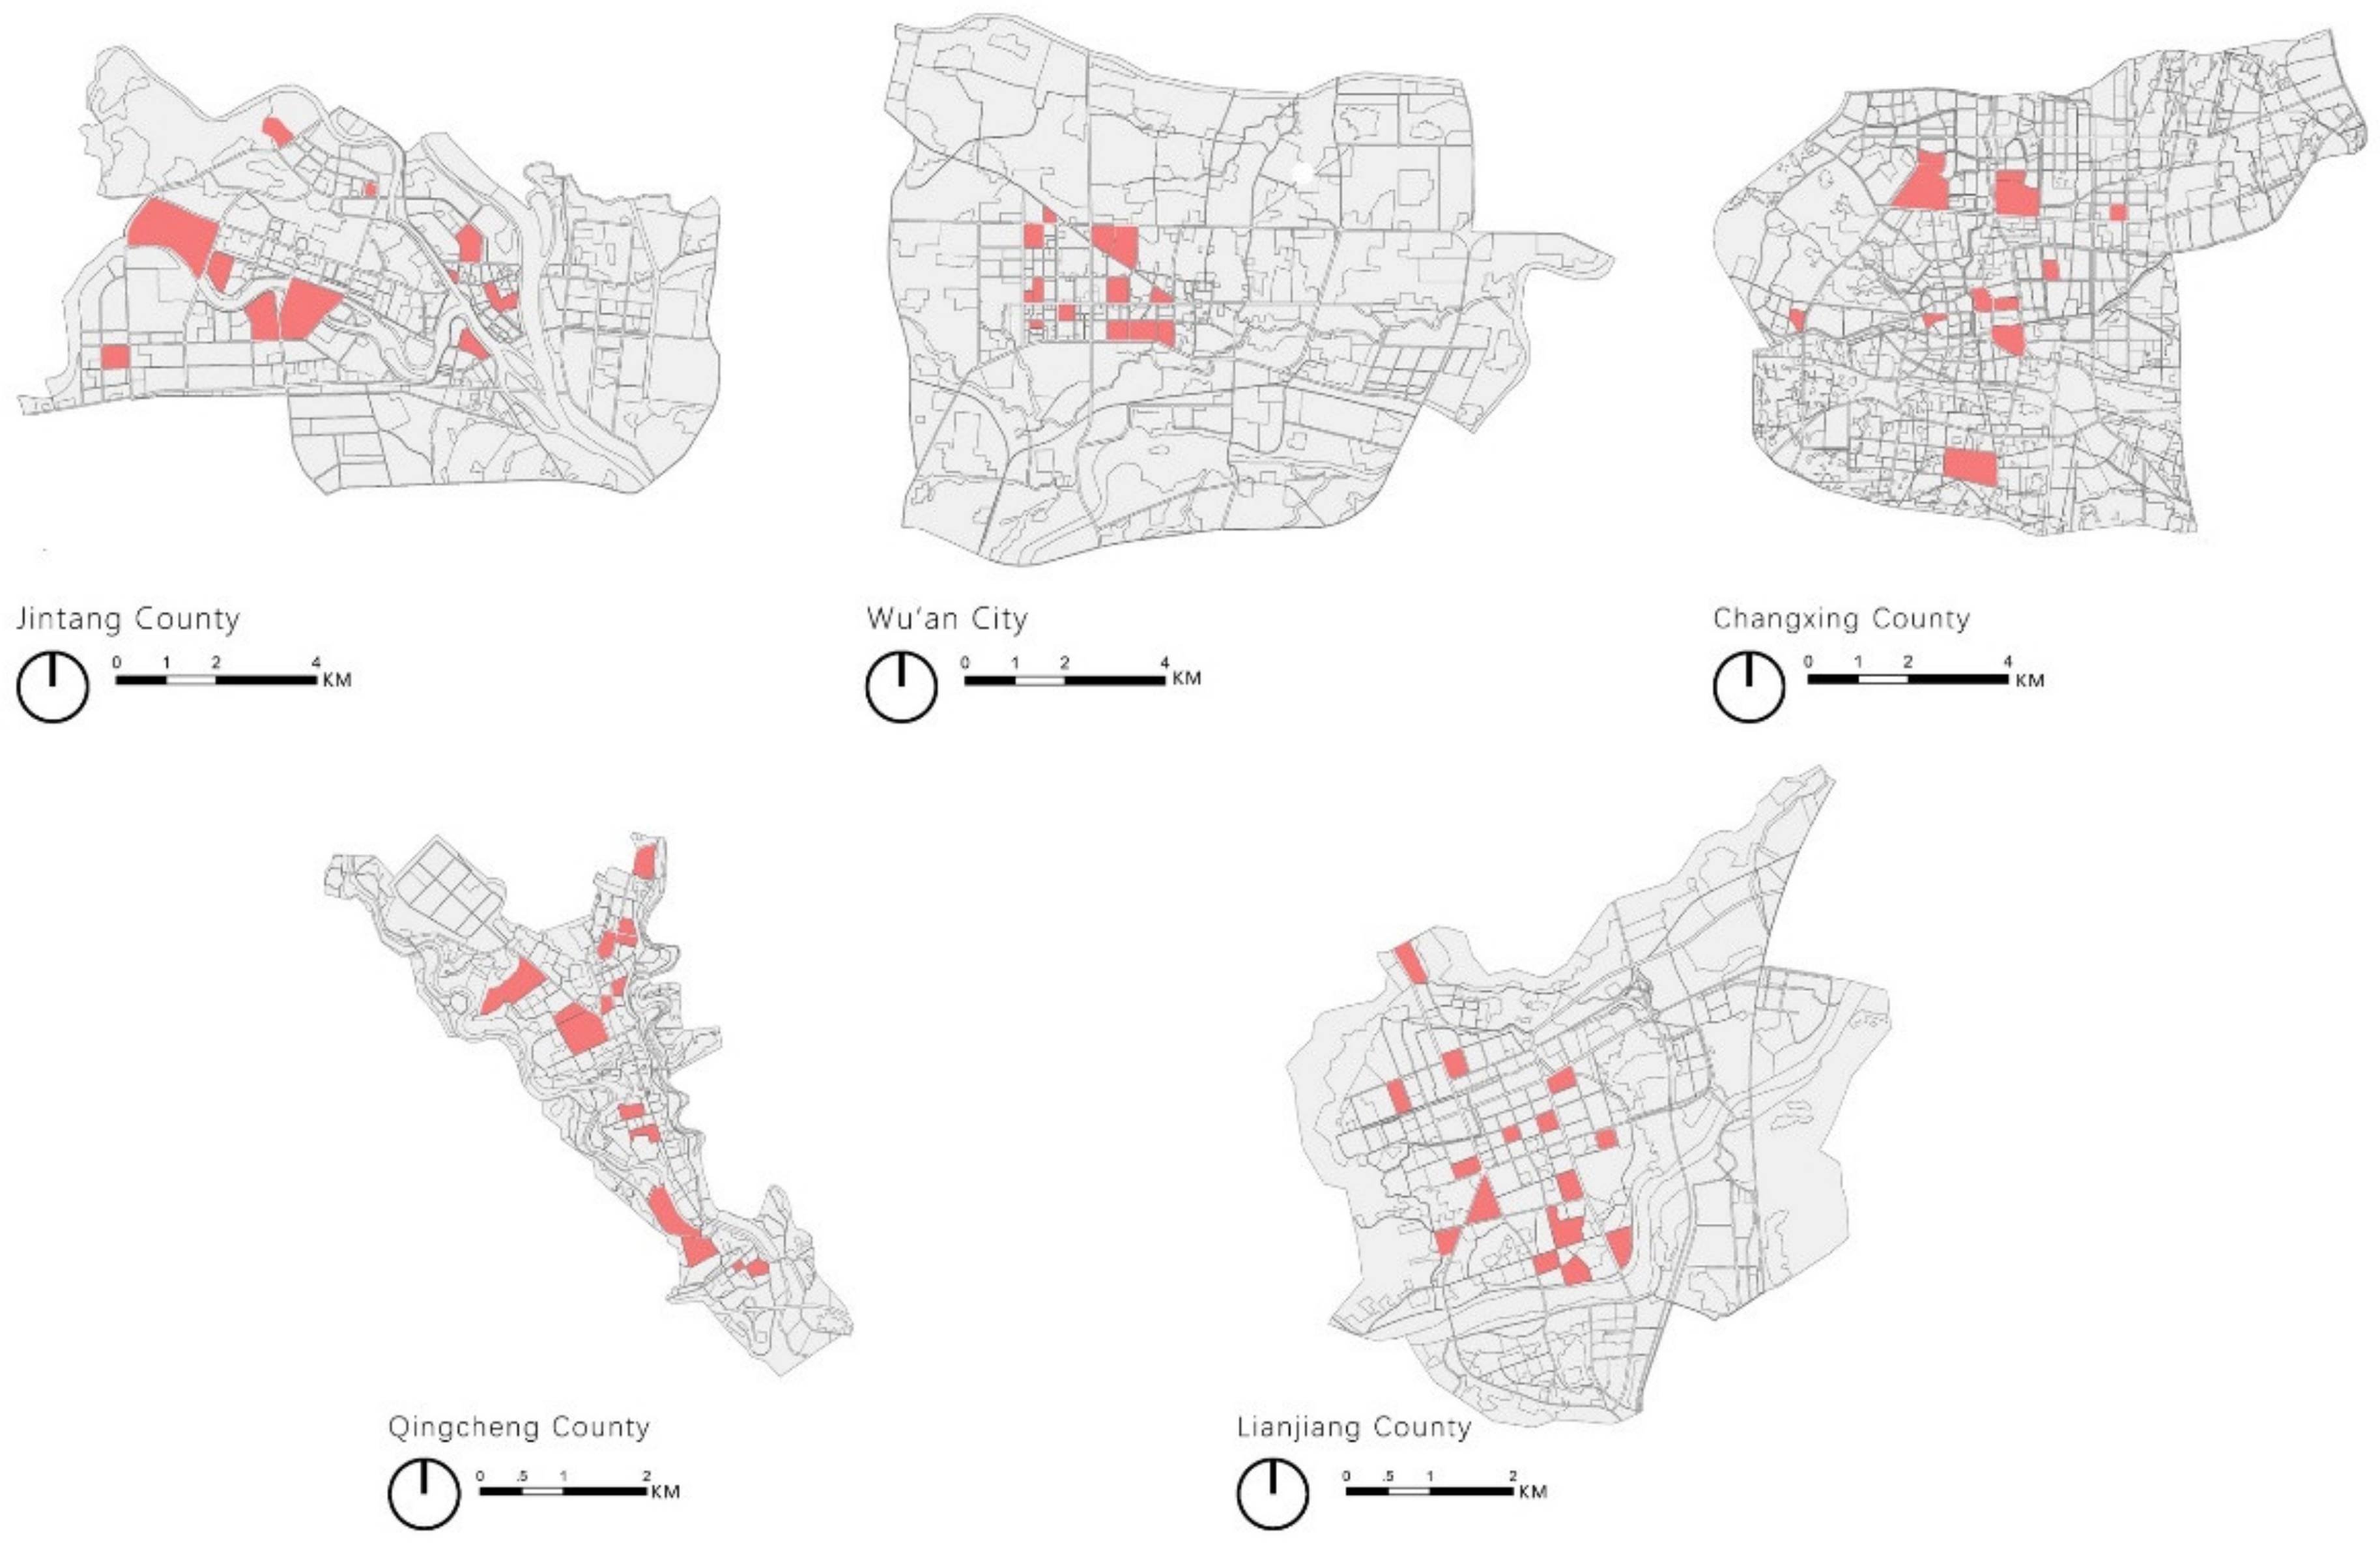
2.1. Study Area
2.2. Data Sources
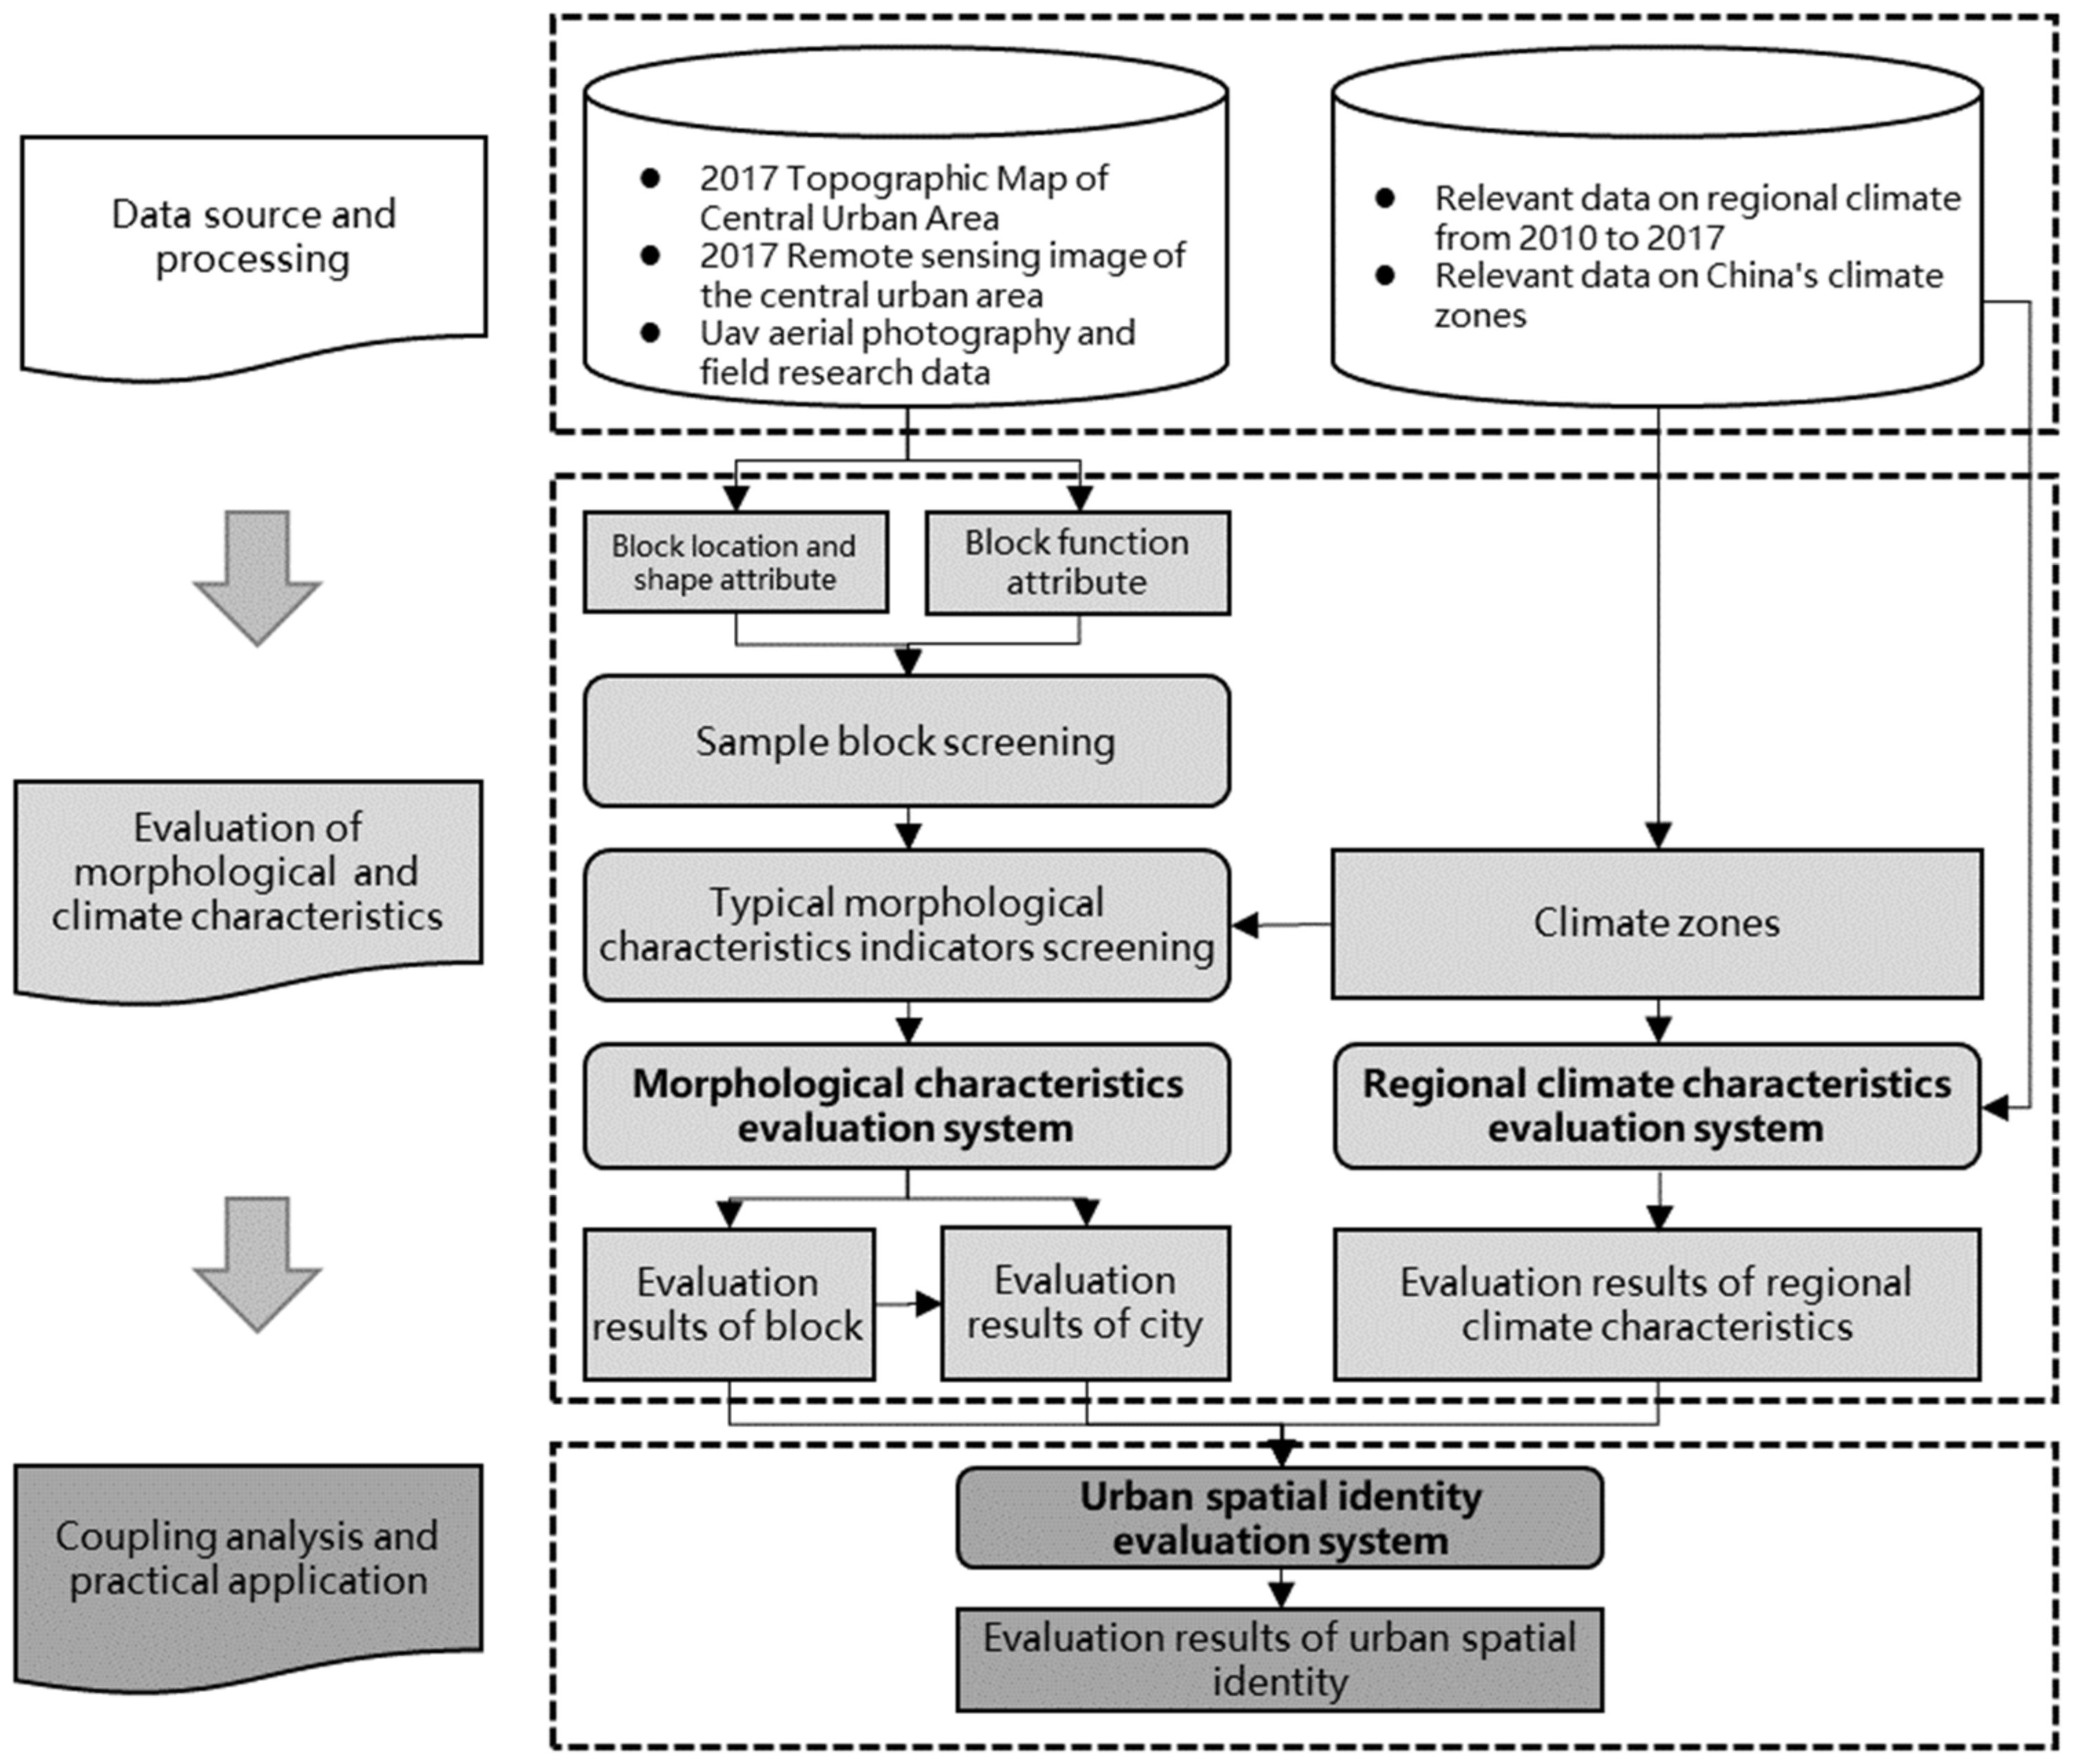
2.3. Methods
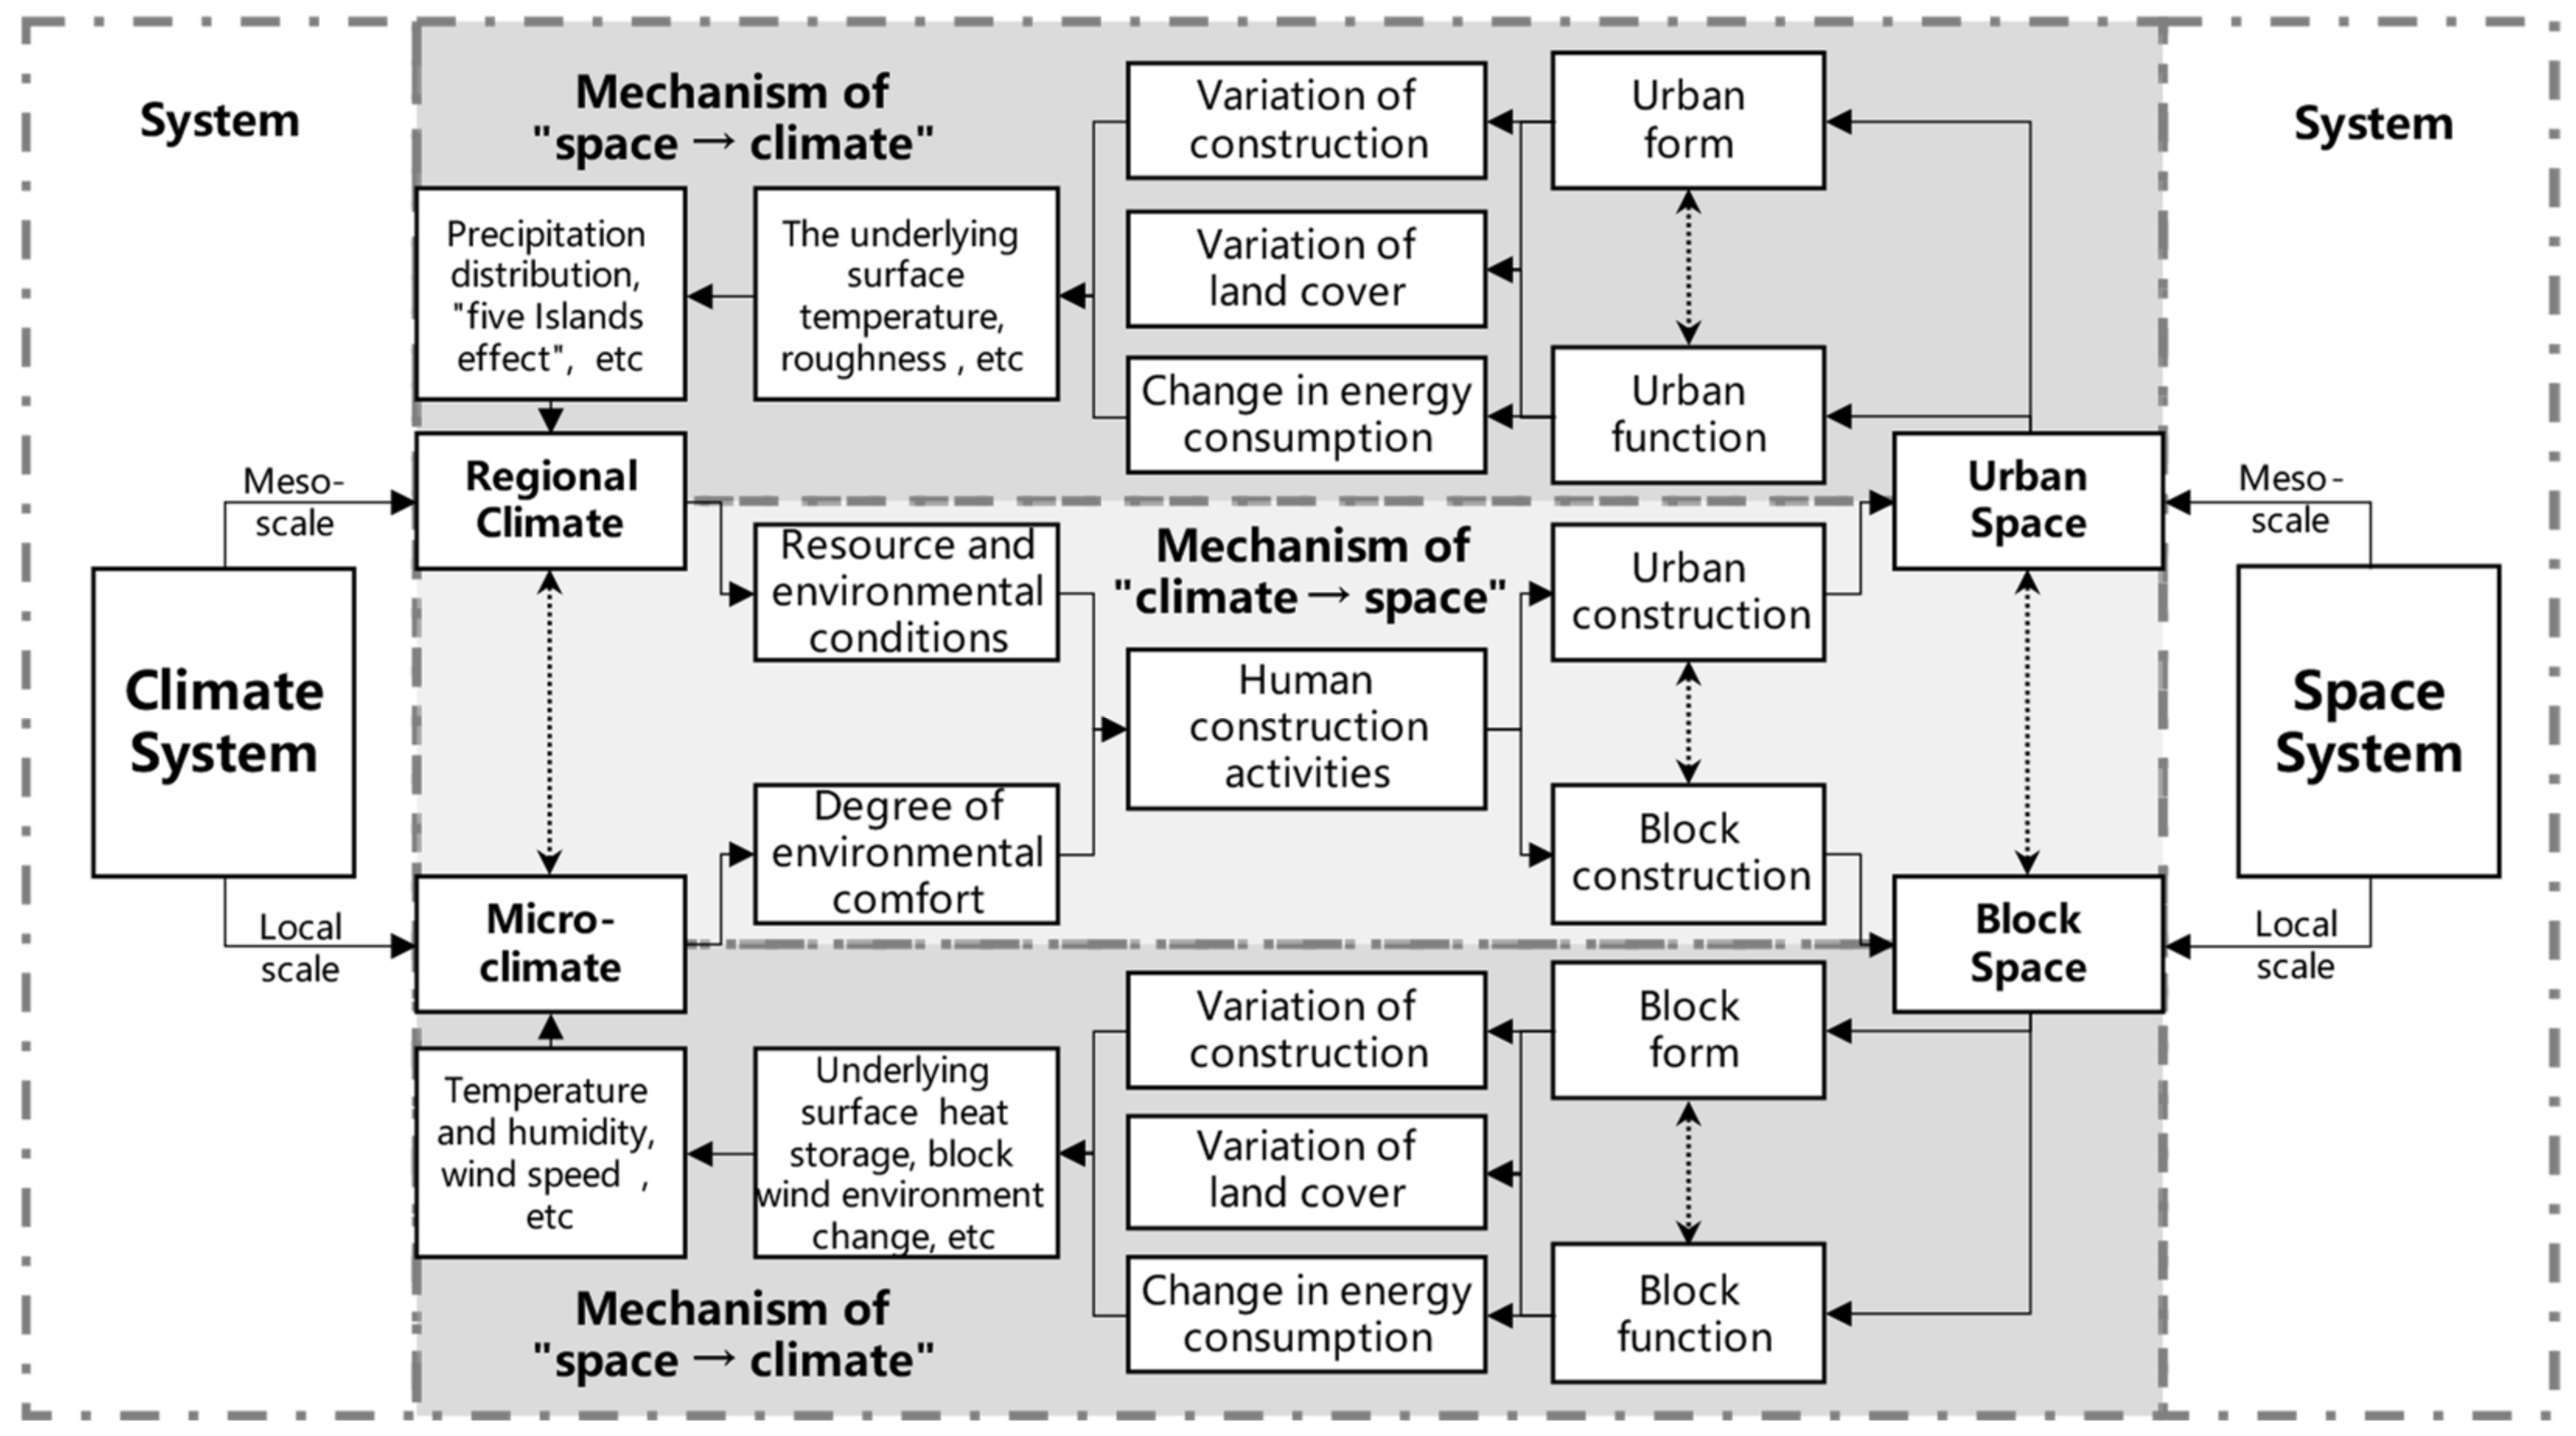
2.3.1. Research Framework
2.3.2. Evaluation of Regional Climate Characteristics
2.3.3. Evaluation of Morphological Characteristics
2.3.4. Evaluation of Urban Spatial Identity
3. Results
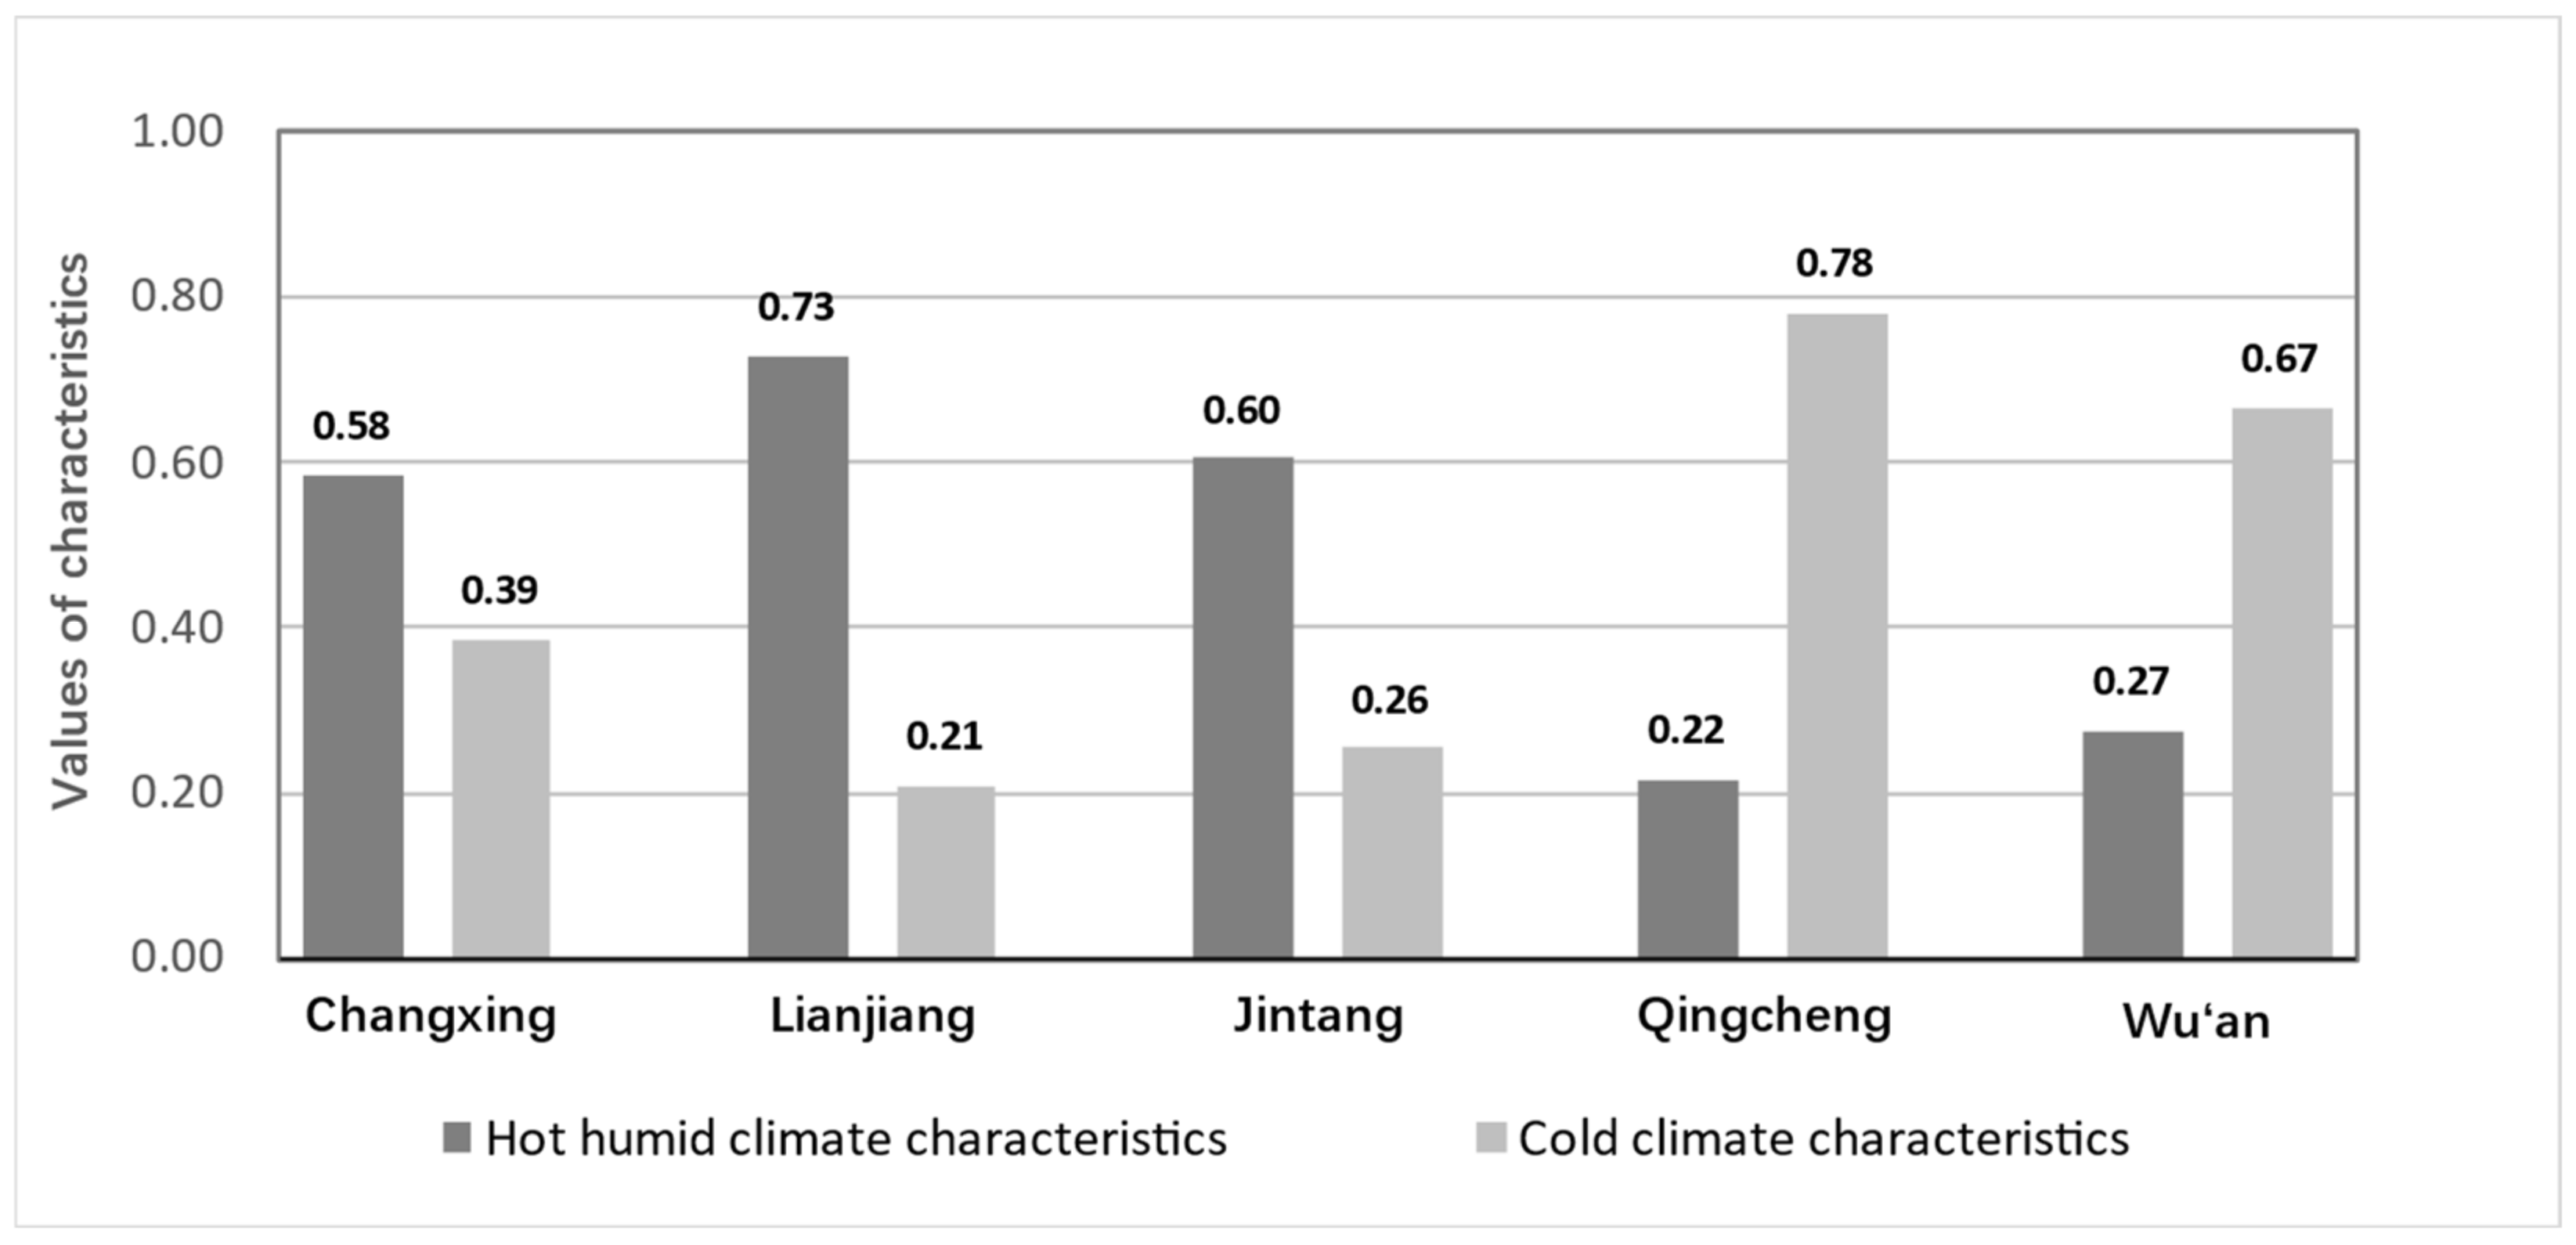
3.1. Evaluation Results of Climate Characteristics
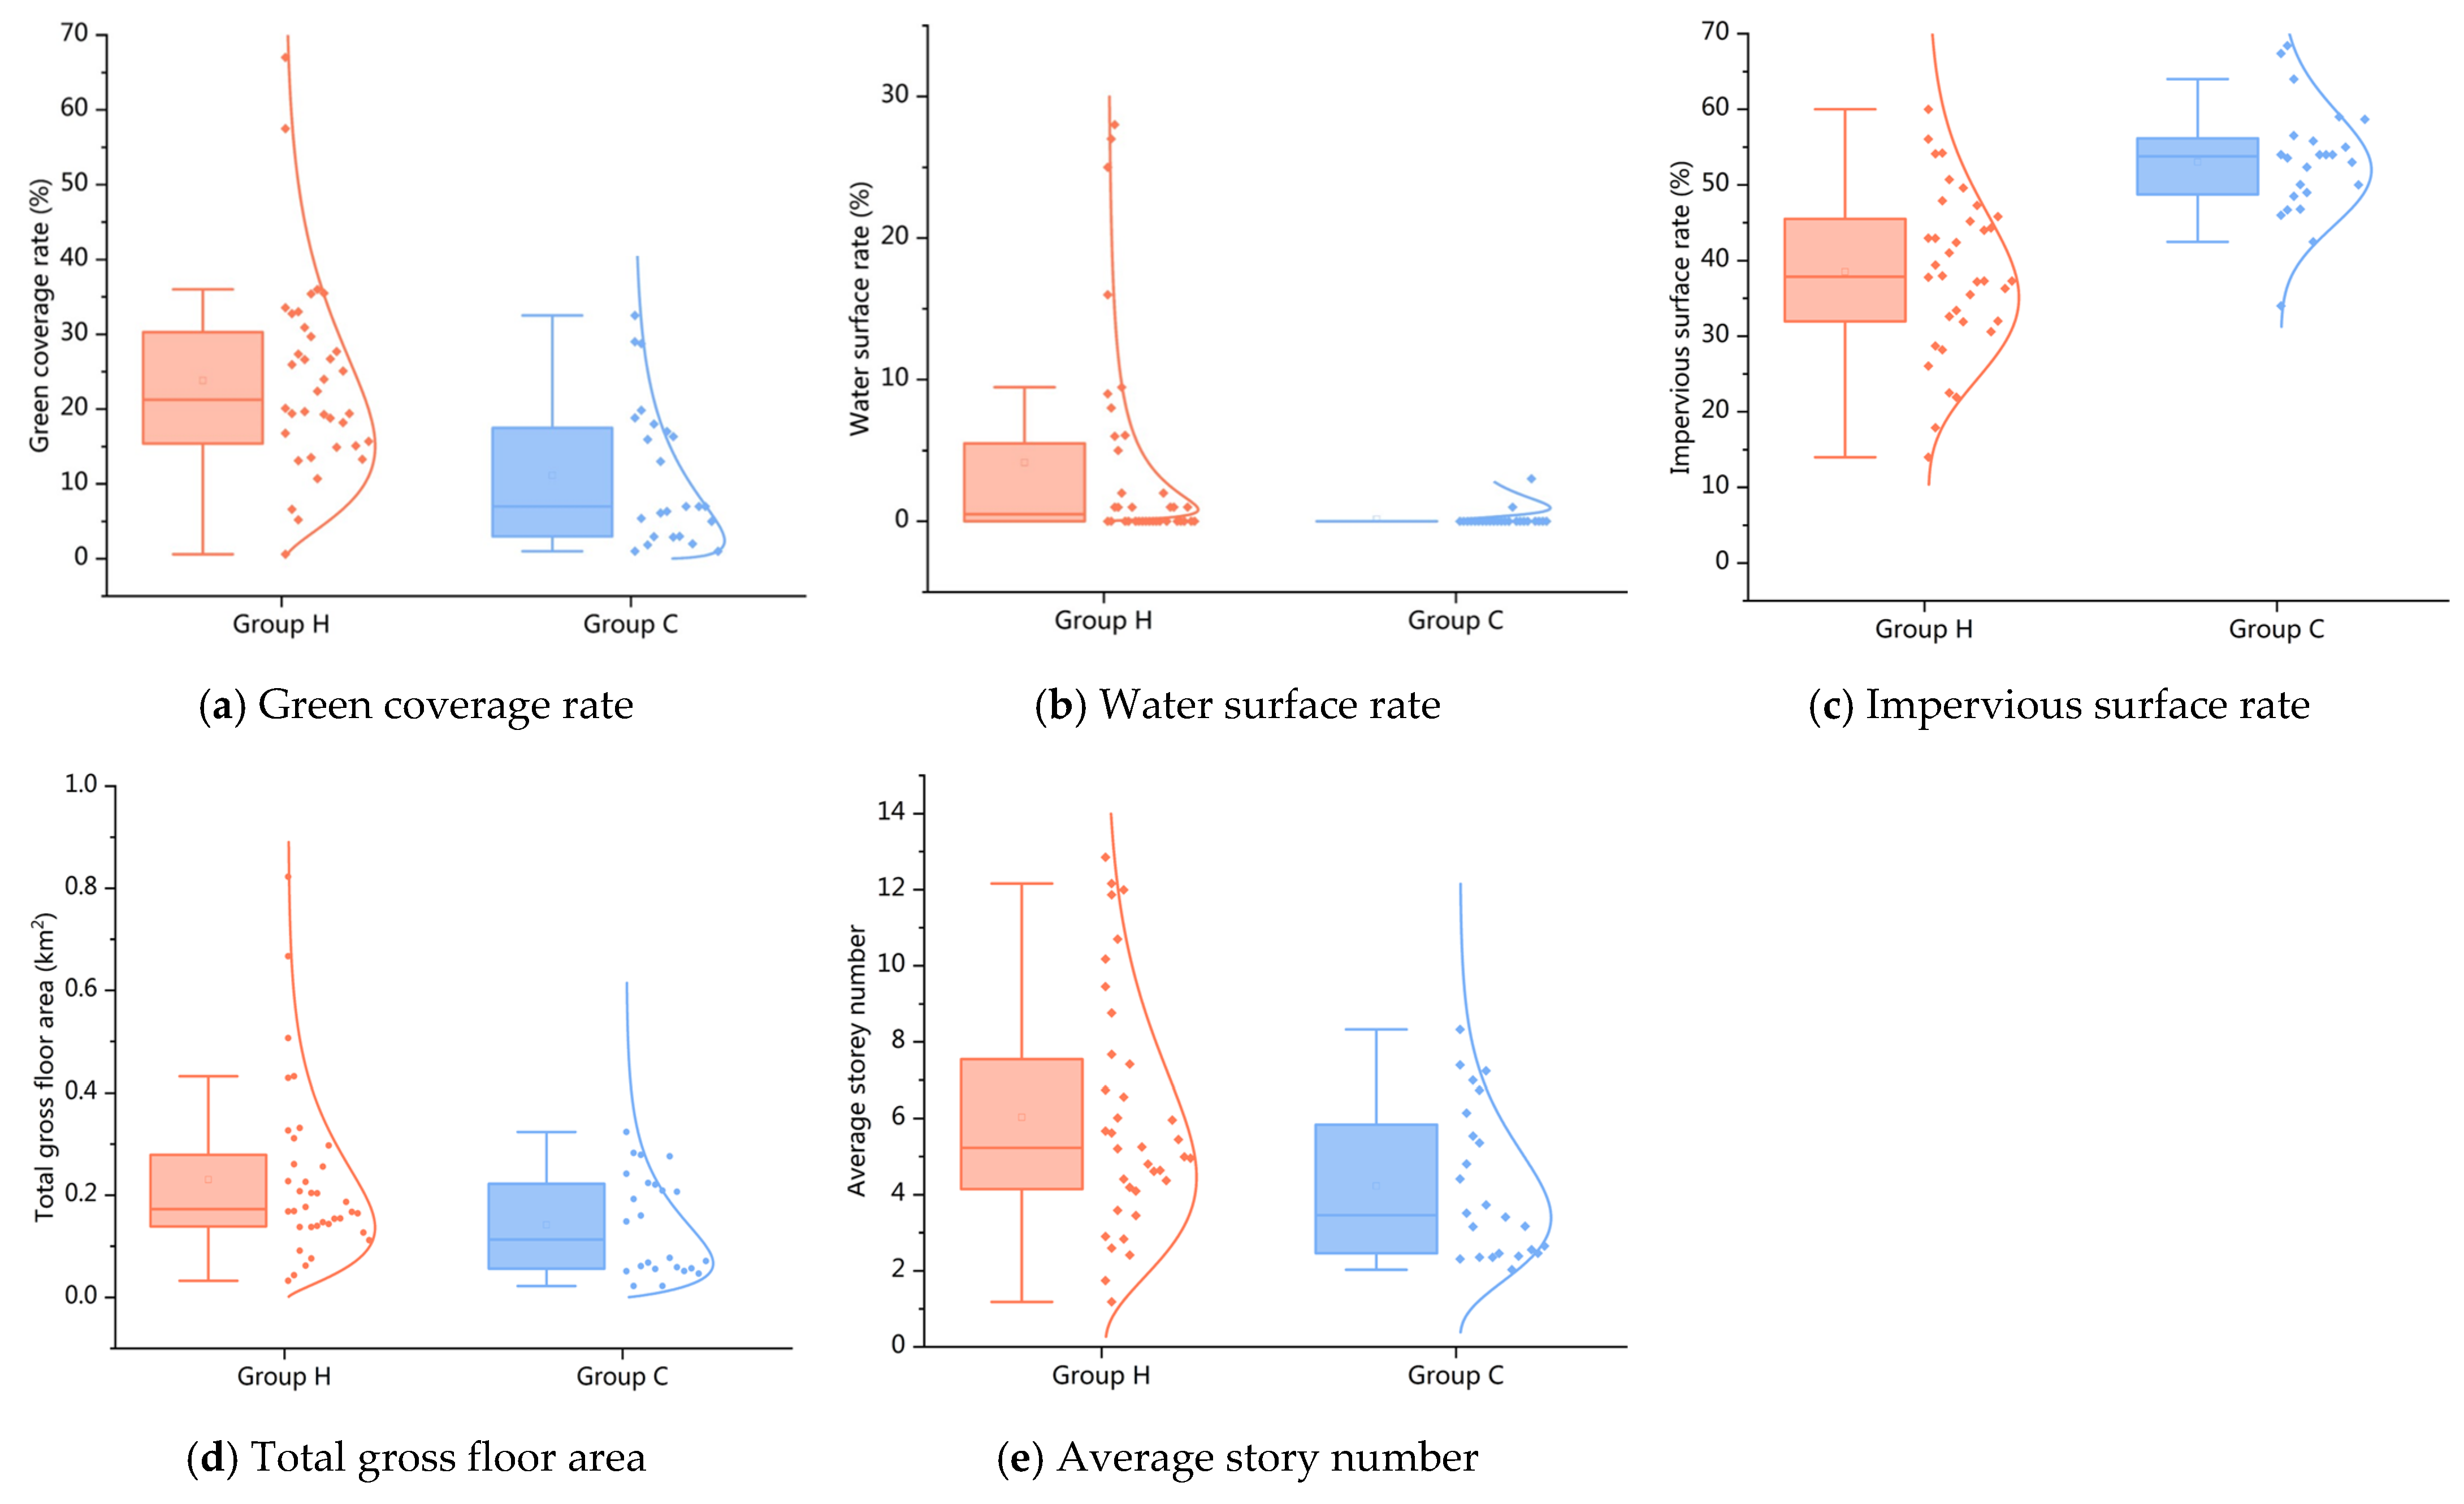
3.2. Evaluation Results of Morphological Characteristics
3.2.1. Morphological Characteristics Evaluation System
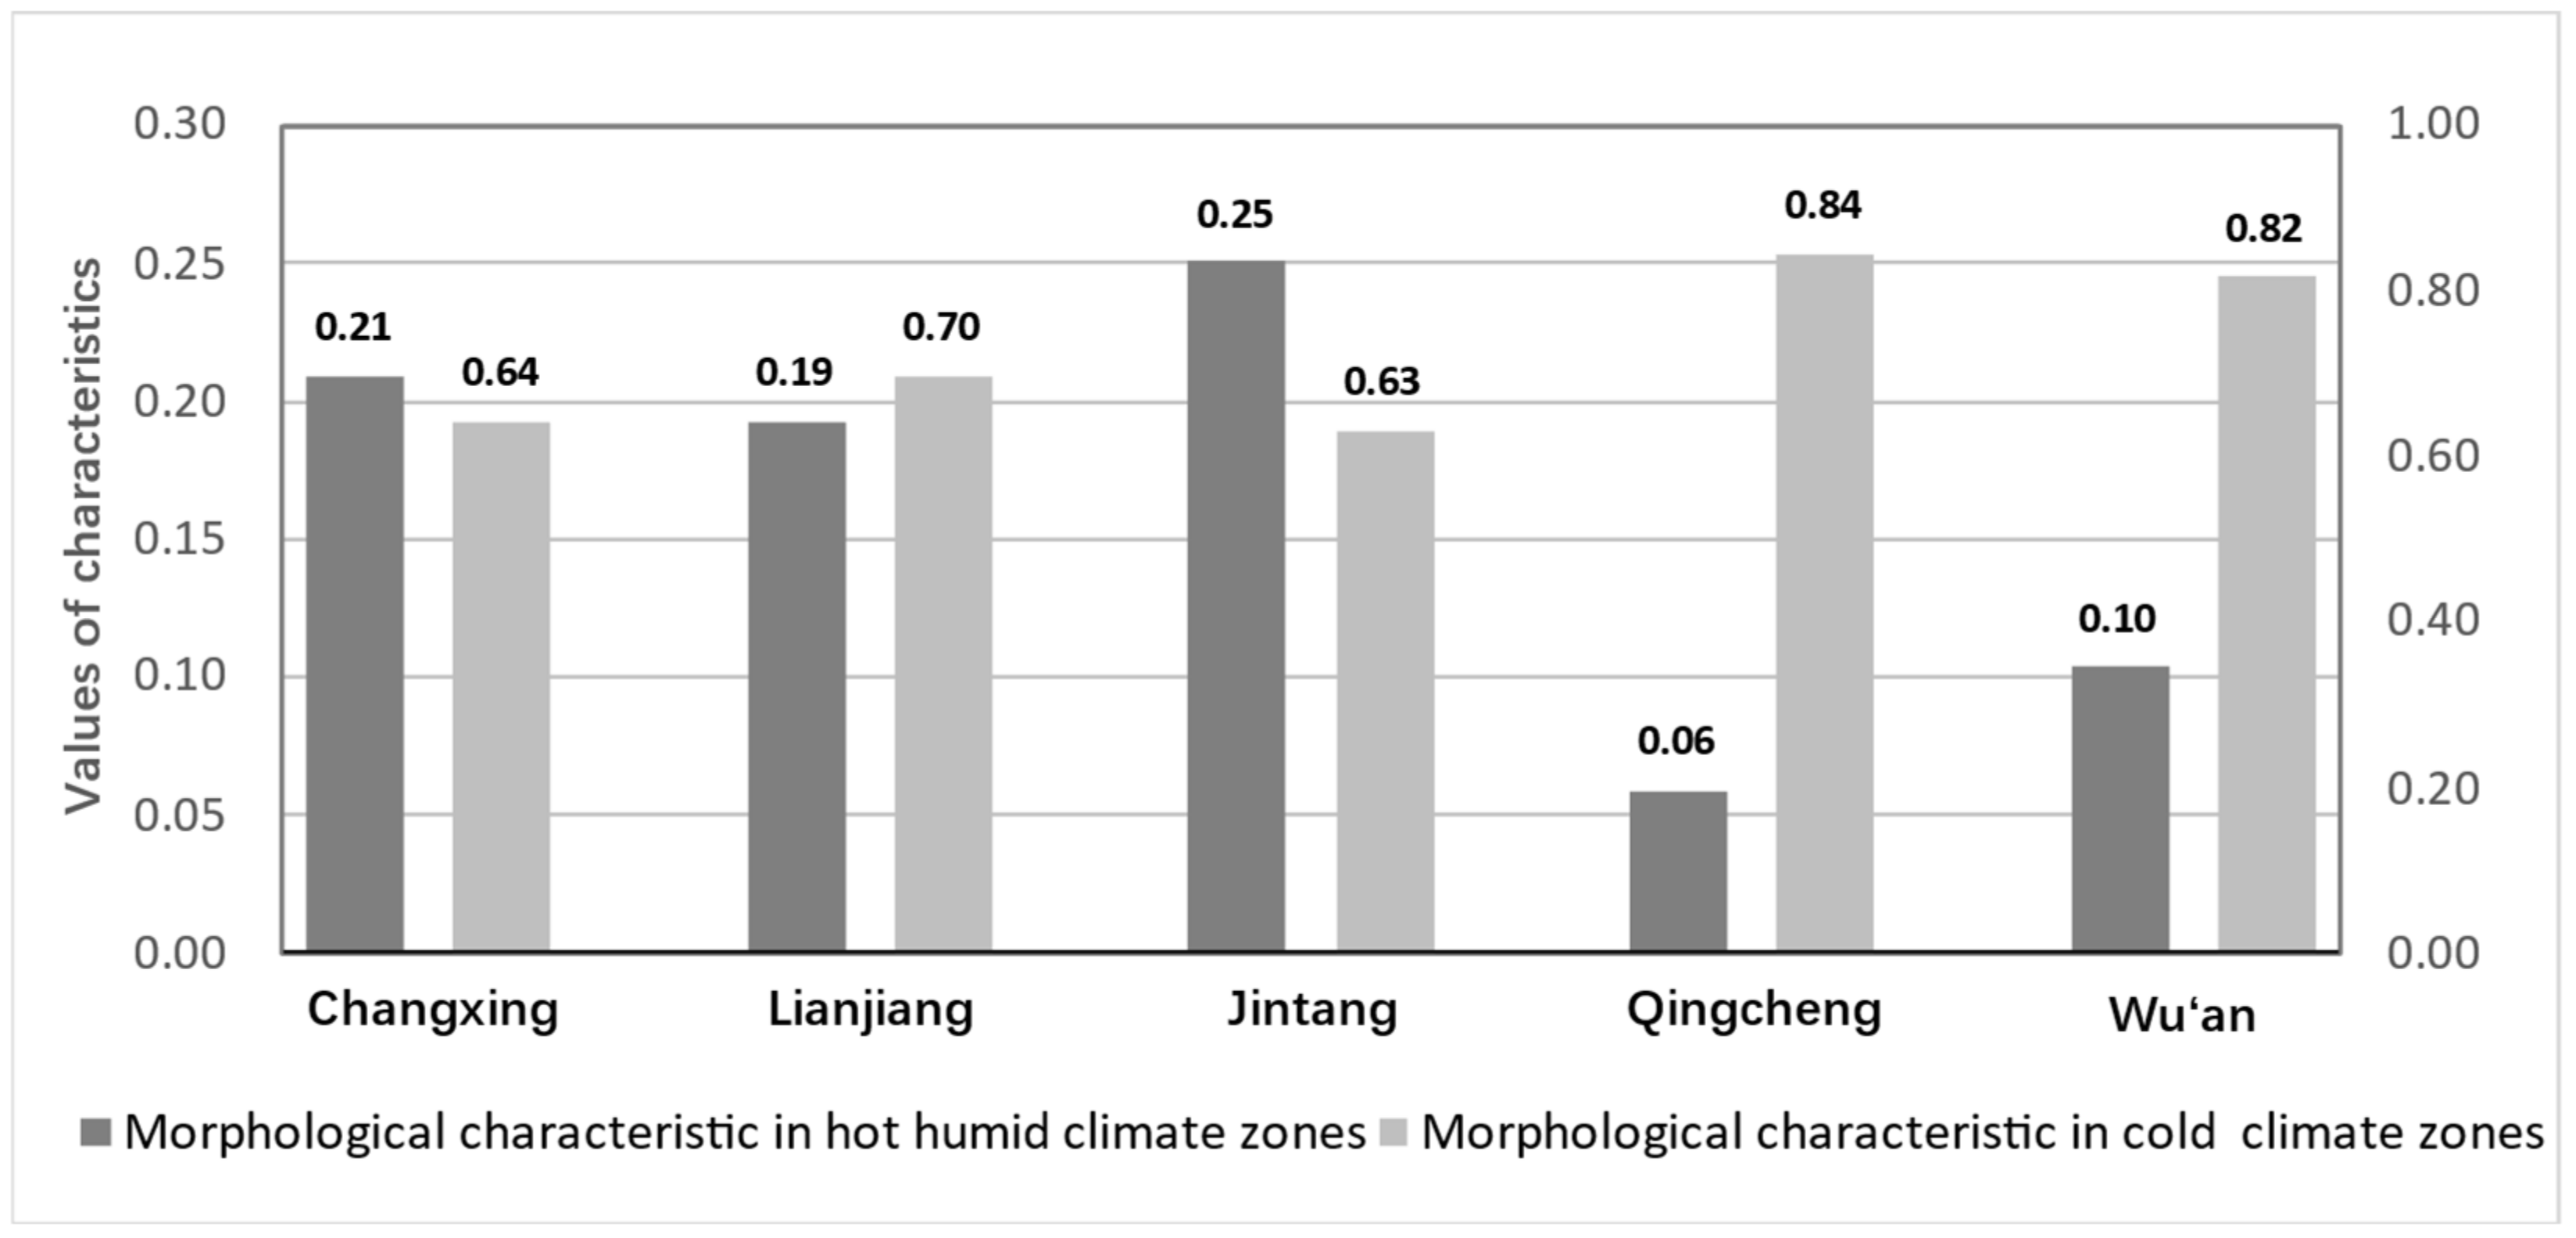
3.2.2. Evaluation Results of Morphological Characteristics
3.3. Evaluation Results of Urban Spatial Identity
3.3.1. Evaluation Results of Central Urban Areas’ Spatial Identity
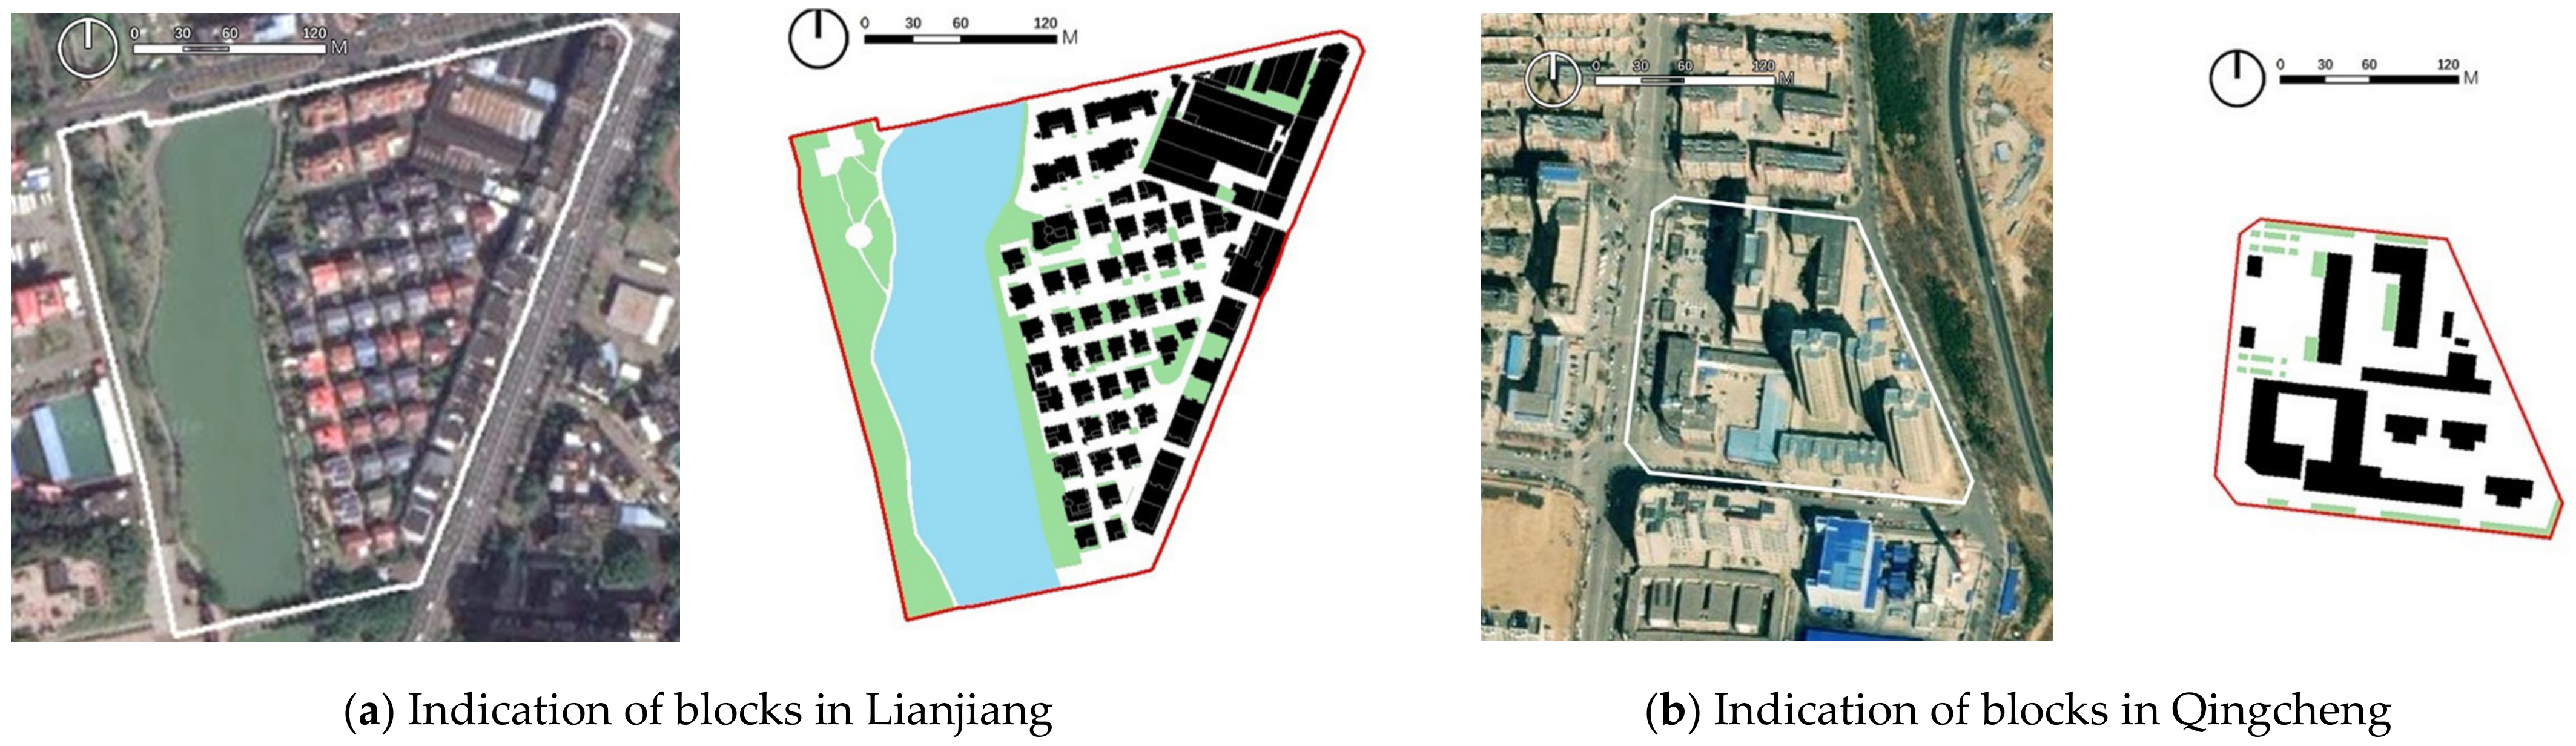
3.3.2. Representative Blocks Screening
4. Discussion
4.1. Typical Indicators of Urban Morphological Characteristics
4.2. Evaluation of Urban Identity
4.3. Limitations
5. Conclusions
Author Contributions
Funding
Institutional Review Board Statement
Informed Consent Statement
Data Availability Statement
Conflicts of Interest
References
- United Nations Department of Economic and Social Affairs. 2018 Revision of World Urbanization Prospects; United Nations Department of Economic and Social Affairs: New York, NY, USA, 2018. [Google Scholar]
- Ginkel, H. Urban Future. Nature 2008, 456, 32–33. [Google Scholar] [CrossRef]
- Kalandides, A. The Problem with Spatial Identity: Revisiting the “Sense of Place”. J. Place Manag. Dev. 2011, 4, 28–39. [Google Scholar] [CrossRef]
- May, G.H. New Technology and the Urban Environment. Futures 1998, 30, 887–899. [Google Scholar] [CrossRef]
- Sakar, S.; Ünlü, T. Formation of Space and Urban Character; Izmir (Kemeralti) Case Study. Planlama 2019, 29, 129–146. [Google Scholar] [CrossRef]
- Davison, G.T. Place-Making or Place-Claiming? Creating a “latino Quarter” in Oakland, California. Urban Des. Int. 2013, 18, 200–216. [Google Scholar] [CrossRef]
- Dovey, K.; Woodcock, I.; Wood, S. A Test of Character: Regulating Place-Identity in Inner-City Melbourne. Urban Stud. 2009, 46, 2595–2615. [Google Scholar] [CrossRef]
- Duan, J.; Lan, W.; Jiang, Y. An Evaluation Approach to Spatial Identity in Historic Urban Areas from a Humanistic Perspective. Front. Archit. Res. 2022, 11, 806–814. [Google Scholar] [CrossRef]
- Barke, M.; Harrop, K. Selling the Industrial Town: Identity, Image and Illusion; Gold, J.R., Ward, S.V., Eds.; Wiley: Chichester, UK, 1994; pp. 93–104. [Google Scholar]
- Juvancic, M.; Verovsek, S. Spatial Identity (Re)Constructed from Web-Sourced Imagery: Comparing Expert Opinion with Quantitative Query. J. Cult. Herit. Manag. Sustain. Dev. 2017, 7, 193–207. [Google Scholar] [CrossRef]
- Kropf, K. Urban Tissue and the Character of Towns. Urban Des. Int. 1996, 1, 247–263. [Google Scholar] [CrossRef]
- Yang, J.; Hu, X. Approaches and Techniques for Planning of Urban Space Identity. City Plan. Rev. 2013, 37, 68–75. [Google Scholar]
- Yaldız, E.; Aydın, D.; Sıramkaya, S.B. Loss of City Identities in the Process of Change: The City of Konya-Turkey. Procedia Soc. Behav. Sci. 2014, 140, 221–233. [Google Scholar] [CrossRef]
- Pattacini, L. Climate and Urban Form. Urban Des. Int. 2012, 17, 106–114. [Google Scholar] [CrossRef]
- Kleerekoper, L.; van Esch, M.; Salcedo, T.B. How to Make a City Climate-Proof, Addressing the Urban Heat Island Effect. Resour. Conserv. Recycl. 2012, 64, 30–38. [Google Scholar] [CrossRef]
- Yang, L.; Yan, H.; Lam, J.C. Thermal Comfort and Building Energy Consumption Implications—A Review. Appl. Energy 2014, 115, 164–173. [Google Scholar] [CrossRef]
- Egondi, T.; Kyobutungi, C.; Rocklöv, J. Temperature Variation and Heat Wave and Cold Spell Impacts on Years of Life Lost among the Urban Poor Population of Nairobi, Kenya. Int. J. Environ. Res. Public Health 2015, 12, 2735–2748. [Google Scholar] [CrossRef] [PubMed]
- Eliasson, I.È. The Use of Climate Knowledge in Urban Planning. Landsc. Urban Plan. 2000, 48, 31–44. [Google Scholar] [CrossRef]
- Capeluto, I.G.; Yezioro, A.; Shaviv, E. Climatic Aspects in Urban Design-a Case Study. Build. Environ. 2003, 38, 827–835. [Google Scholar] [CrossRef]
- Oke, T.R. Towards Better Scientific Communication in Urban Climate. Theor. Appl. Climatol. 2006, 84, 179–190. [Google Scholar] [CrossRef]
- Ziter, C.D.; Pedersen, E.J.; Kucharik, C.J.; Turner, M.G. Scale-Dependent Interactions between Tree Canopy Cover and Impervious Surfaces Reduce Daytime Urban Heat during Summer. Proc. Natl. Acad. Sci. USA 2019, 116, 7575–7580. [Google Scholar] [CrossRef]
- Mohtat, N.; Khirfan, L. The Climate Justice Pillars Vis-à-Vis Urban Form Adaptation to Climate Change: A Review. Urban Clim. 2021, 39, 100951. [Google Scholar] [CrossRef]
- Liang, H.; Meng, Q.; Qi, Q.; Ren, P. Spatiotemporal Interaction between Urban Heat Island and Urban-Construction Indicators on the Block Scale in Autumn in a Humid and Hot Climate. Sustain. Cities Soc. 2022, 78, 103638. [Google Scholar] [CrossRef]
- Yang, J.; Wang, Y.; Xue, B.; Li, Y.; Xiao, X.; Xia, J.C.; He, B. Contribution of Urban Ventilation to the Thermal Environment and Urban Energy Demand: Different Climate Background Perspectives. Sci. Total Environ. 2021, 795, 148791. [Google Scholar] [CrossRef] [PubMed]
- Yin, L.; Wang, Z. Measuring Visual Enclosure for Street Walkability: Using Machine Learning Algorithms and Google Street View Imagery. Appl. Geogr. 2016, 76, 147–153. [Google Scholar] [CrossRef]
- Hu, F.; Wang, Z.; Sheng, G.; Lia, X.; Chen, C.; Geng, D.; Hong, X.; Xu, N.; Zhu, Z.; Zhang, Z.; et al. Impacts of National Park Tourism Sites: A Perceptual Analysis from Residents of Three Spatial Levels of Local Communities in Banff National Park. Environ. Dev. Sustain. 2022, 24, 3126–3145. [Google Scholar] [CrossRef]
- Bell, D.; Jayne, M. Small Cities? Towards a Research Agenda. Int. J. Urban Reg. Res. 2009, 33, 683–699. [Google Scholar] [CrossRef]
- Cheshmehzangi, A.; Heat, T. Urban Identities: Influences on Socio-Environmental Values and Spatial Inter-Relations. Procedia Soc. Behav. Sci. 2012, 36, 253–264. [Google Scholar] [CrossRef]
- Ziyaee, M. Assessment of Urban Identity through a Matrix of Cultural Landscapes. Cities 2018, 74, 21–31. [Google Scholar] [CrossRef]
- Manahasa, E.; Manahasa, O. Defining Urban Identity in a Post-Socialist Turbulent Context: The Role of Housing Typologies and Urban Layers in Tirana. Habitat Int. 2020, 102, 102202. [Google Scholar] [CrossRef]
- Erdoğan, B.D.; Ayataç, H. Assessment of Urban Identity Characteristics in Public Places: A Case Study of Ortaköy Square. A|Z ITU J. Fac. Archit. 2015, 12, 115–125. [Google Scholar]
- Phetsuriya, N.; Heath, T. Defining the Distinctiveness of Urban Heritage Identity: Chiang Mai Old City, Thailand. Soc. Sci. 2021, 10, 101. [Google Scholar] [CrossRef]
- Ye, Y.; Qiu, H. Environmental and Social Benefits, and Their Coupling Coordination in Urban Wetland Parks. Urban For. Urban Gree. 2021, 60, 127043. [Google Scholar] [CrossRef]
- Wang, M.; Wang, K. Exploring Water Landscape Adaptability of Urban Spatial Development Base on Coupling Coordination Degree Model a Case of Caidian District, Wuhan. Sustainability 2021, 13, 1475. [Google Scholar] [CrossRef]
- Wende, W.; Huelsmann, W.; Marty, M.; Penn-Bressel, G.; Bobylev, N. Climate Protection and Compact Urban Structures in Spatial Planning and Local Construction Plans in Germany. Land Use Policy 2010, 27, 864–868. [Google Scholar] [CrossRef]
- Shi, C.; Guo, N.; Zeng, L.; Wu, F. How Climate Change Is Going to Affect Urban Livability in China. Clim. Serv. 2022, 26, 100284. [Google Scholar] [CrossRef]
- Hou, Q.; Xia, S.; Wang, W. Research on Land Utilization Intensity Control and Urban Design Fusion Mechanism Based on Spatial Hierarchy Coupling Model. Comput. Model. New Technol. 2014, 18, 270–278. [Google Scholar]
- Zhang, Y.; Xue, W.; Wen, Y.; Wang, X. Sustainability Assessment of Water Resources Use in 31 Provinces in China: A Combination Method of Entropy Weight and Cloud Model. Int. J. Environ. Res. Public Health 2022, 19, 12870. [Google Scholar] [CrossRef] [PubMed]
- Chen, Y.; Miao, Q.; Zhou, Q. Spatiotemporal Differentiation and Driving Force Analysis of the High-Quality Development of Urban Agglomerations along the Yellow River Basin. Int. J. Environ. Res. Public Health 2022, 19, 2484. [Google Scholar] [CrossRef] [PubMed]
- Zhang, R. Spatial Differentiation and Tradeoff–Synergy of Rural Multifunction at the County Scale in Anhui Province in the China’s Traditional Agricultural Areas. Int. J. Environ. Res. Public Health 2022, 19, 13604. [Google Scholar] [CrossRef] [PubMed]
- Su, L. The Impact of Coordinated Development of Ecological Environment and Technological Innovation on Green Economy: Evidence from China. Int. J. Environ. Res. Public Health 2022, 19, 6994. [Google Scholar] [CrossRef]
- Liu, W.; Jiao, F.; Ren, L.; Xu, X.; Wang, J.; Wang, X. Coupling Coordination Relationship between Urbanization and Atmospheric Environment Security in Jinan City. J. Clean. Prod. 2018, 204, 1–11. [Google Scholar] [CrossRef]
- Huang, Z.; Liu, J.; Luo, T.; Hong, X. Research on the Spatial-Temporal Changes of Regional Morphology of Residential Neighborhoods in County-Level Cities of China: Cases Studies on Qingcheng County, Wu’an City, Changxing County, Lianjiang County, and Jintang County. Landsc. Archit. Front. 2021, 9, 12. [Google Scholar] [CrossRef]
- Fleischmann, M.; Arribas-Bel, D. Geographical Characterisation of British Urban Form and Function Using the Spatial Signatures Framework. Sci. Data 2022, 9, 546. [Google Scholar] [CrossRef] [PubMed]
- Stewart, I.D.; Oke, T.R. Local Climate Zones for Urban Temperature Studies. Bull. Am. Meteorol. Soc. 2012, 93, 1879–1900. [Google Scholar] [CrossRef]
- Xiao, X.; Zhang, L.; Xiong, Y.; Jiang, J.; Xu, A. Influence of Spatial Characteristics of Green Spaces on Microclimate in Suzhou Industrial Park of China. Sci. Rep. 2022, 12, 9121. [Google Scholar] [CrossRef]
- Zhang, L.; Zhan, Q.; Lan, Y. Effects of the Tree Distribution and Species on Outdoor Environment Conditions in a Hot Summer and Cold Winter Zone: A Case Study in Wuhan Residential Quarters. Build Environ. 2018, 130, 27–39. [Google Scholar] [CrossRef]
- Leng, H.; Liang, S.; Yuan, Q. Outdoor Thermal Comfort and Adaptive Behaviors in the Residential Public Open Spaces of Winter Cities during the Marginal Season. Int. J. Biometeorol. 2020, 64, 217–229. [Google Scholar] [CrossRef]
- Li, C.; Chen, L.; Liu, D.; Wei, J.; He, J.; Duan, X. The Hidden Risk in China’s Cropland Conversion from the Perspective of Slope. Catena 2021, 206, 105536. [Google Scholar] [CrossRef]
- Chen, Z.; Zhu, T.Y.; Liu, J.; Hong, X.C. Before Becoming a World Heritage: Spatiotemporal Dynamics and Spatial Dependency of the Soundscapes in Kulangsu Scenic Area, China. Forests 2022, 13, 1526. [Google Scholar] [CrossRef]
- Hong, X.C.; Wang, G.Y.; Liu, J.; Song, L.; Wu, E.T. Modeling the impact of soundscape drivers on perceived birdsongs in urban forests. J. Clean. Prod. 2021, 292, 125315. [Google Scholar] [CrossRef]
- Zhou, Z.; Shi, H.; Fu, Q.; Li, T.; Gan, T.Y.; Liu, S.; Liu, K. Is the Cold Region in Northeast China Still Getting Warmer under Climate Change Impact? Atmos. Res. 2020, 237, 104864. [Google Scholar] [CrossRef]
- Elmore, A.J.; Guinn, S.M.; Minsley, B.J.; Richardson, A.D. Landscape Controls on the Timing of Spring, Autumn, and Growing Season Length in Mid-Atlantic Forests. Glob. Chang. Biol. 2012, 18, 656–674. [Google Scholar] [CrossRef]
- Okamoto, N. Spatial and Institutional Urbanisation in China. Asia Pac. J. Clin. Oncol. 2019, 3, 863–886. [Google Scholar] [CrossRef]
- Batty, M. The Size, Scale, and Shape of Cities. Science 2008, 319, 769–771. [Google Scholar] [CrossRef]
- Gasper, R.; Blohm, A.; Ruth, M. Social and Economic Impacts of Climate Change on the Urban Environment. Curr. Opin. Environ. Sust. 2011, 3, 150–157. [Google Scholar] [CrossRef]


| Dimension | Indicator | Indicator Properties of Hot humid Climate Characteristics | Indicator Weight of Hot humid Climate Characteristics | Indicator Properties of Cold Climate Characteristics | Indicator Weight of Cold Climate Characteristics |
|---|---|---|---|---|---|
| Temperature | Annual mean air temperature | Positive | 0.116 | Negative | 0.188 |
| Annual mean maximum temperature | Positive | 0.084 | Negative | 0.041 | |
| Annual mean minimum temperature | Positive | 0.119 | Negative | 0.243 | |
| Rain | Annual precipitation | Positive | 0.243 | Negative | 0.129 |
| Annual number of rainy days | Positive | 0.094 | Negative | 0.059 | |
| Sunshine | Annual mean sunshine duration | Negative | 0.098 | Positive | 0.085 |
| Wind speed | Annual mean wind speed | Negative | 0.101 | Positive | 0.135 |
| Humidity | Annual mean relative humidity | Positive | 0.144 | Negative | 0.117 |
| Dimension | Indicator | Indicator Description | Quantification Method |
|---|---|---|---|
| Block shape | Total land area (TLA) | Total land area of a sample block. | / |
| Compactness ratio (CR) | Compactness is a measure of the shape characteristics of a block. | where is the total land area, P represents the block perimeter. | |
| Land cover | Building density (BD) | A rate of the building area to the total land area within the block. | where is the building area, represents the total land area of the block. |
| Green coverage rate (GCR) | A rate of green coverage area to the total land area within the block. | where is the is the green coverage area, represents the total land area of the block. | |
| Water surface rate (WSR) | A rate of the water surface area to the total land area within the block. | where is the water surface area, represents the total land area of the block. | |
| Impervious surface rate (ISR) | A rate of the impervious surface area to the total land area within the block. | where is the impervious surface area, represents the total land area of the block. | |
| Spatial order of buildings | Degree of building angle disorder (DAD) | The mean value of the angle difference of building orientation. It is used to indicate the characteristics of the building’s directionality. | where is the orientation angle of the building, represents the angle difference from the adjacent buildings. |
| Degree of building area disorder (DBA) | The mean difference of the building area. It is used to indicate the variation degree of the building area in the block. | where is the area of the building, represents the area of adjacent buildings. | |
| Degree of building distance disorder (DBD) | The standard deviation of the minimum distance. It is used to indicate the degree of variation in the spacing of buildings within a block. | where is straight-line distance between the geometric centers of adjacent buildings, represents the arithmetic means of the distance. | |
| Development density | Total gross floor area (TGFA) | A sum of the horizontal areas of each floor of a building. | where is the average story number, represents the building area. |
| Average story number (ASR) | Average number of stories of all buildings in the block. | / | |
| Floor area ratio (FAR) | A ratio of the total gross floor area to the total area within the block. | where is the total gross floor area, represents the total land area of the block. |
| Indicators of Difference Statistically Significant | Statistically Significant | Indicators of Difference Not Statistically Significant | Statistically Significant |
|---|---|---|---|
| Impervious surface rate | 0.000 ** | Total land area | 0.194 |
| Green coverage rate | 0.000 ** | Building density | 0.546 |
| Water surface rate | 0.001 ** | Compactness index | 0.424 |
| Average story number | 0.019 ** | Degree of building angle disorder | 0.330 |
| Total gross floor area | 0.040 ** | Degree of building distance disorder | 0.556 |
| Degree of building distance disorder | 0.056 * | ||
| Floor area ratio | 0.097 |
| Dimension | Indicator | Indicator Properties of Group H | Indicator Weight of Group H | Indicator Properties of Group C | Indicator Weight of Group C |
|---|---|---|---|---|---|
| Development density | Total gross floor area | Positive | 0.127 | Negative | 0.145 |
| Average story number | Positive | 0.143 | Negative | 0.145 | |
| Land cover | Green coverage rate | Positive | 0.108 | Negative | 0.187 |
| Water surface rate | Positive | 0.573 | Negative | 0.195 | |
| Impervious surface rate | Negative | 0.049 | Positive | 0.327 |
Disclaimer/Publisher’s Note: The statements, opinions and data contained in all publications are solely those of the individual author(s) and contributor(s) and not of MDPI and/or the editor(s). MDPI and/or the editor(s) disclaim responsibility for any injury to people or property resulting from any ideas, methods, instructions or products referred to in the content. |
© 2022 by the authors. Licensee MDPI, Basel, Switzerland. This article is an open access article distributed under the terms and conditions of the Creative Commons Attribution (CC BY) license (https://creativecommons.org/licenses/by/4.0/).
Share and Cite
Luo, T.; Zhang, Z.; Hong, X.; Wang, Y.; Zhang, X. Evaluating Spatial Identity Based on Climate Adaptation in Small Cities. Int. J. Environ. Res. Public Health 2023, 20, 713. https://doi.org/10.3390/ijerph20010713
Luo T, Zhang Z, Hong X, Wang Y, Zhang X. Evaluating Spatial Identity Based on Climate Adaptation in Small Cities. International Journal of Environmental Research and Public Health. 2023; 20(1):713. https://doi.org/10.3390/ijerph20010713
Chicago/Turabian StyleLuo, Tao, Zijing Zhang, Xinchen Hong, Yanyun Wang, and Xuewei Zhang. 2023. "Evaluating Spatial Identity Based on Climate Adaptation in Small Cities" International Journal of Environmental Research and Public Health 20, no. 1: 713. https://doi.org/10.3390/ijerph20010713
APA StyleLuo, T., Zhang, Z., Hong, X., Wang, Y., & Zhang, X. (2023). Evaluating Spatial Identity Based on Climate Adaptation in Small Cities. International Journal of Environmental Research and Public Health, 20(1), 713. https://doi.org/10.3390/ijerph20010713