Abstract
Despite the consensus that keeping global temperature rise within 1.5 °C above pre-industrial level by 2100 reduces the chance for climate change to reach the point of no return, the newest Intergovernmental Panel on Climate Change (IPCC) report warns that the existing commitment of greenhouse gas emission reduction is only enough to contain the warming to 3–4 °C by 2100. The harsh reality not only calls for speedier deployment of existing CO2 reduction technologies but demands development of more cost-efficient carbon removal strategies. Here we report an ocean alkalinity-based CO2 sequestration scheme, taking advantage of proton consumption during nitrate assimilation by marine photosynthetic microbes, and the ensuing enhancement of seawater CO2 absorption. Benchtop experiments using a native marine phytoplankton community confirmed pH elevation from ~8.2 to ~10.2 in seawater, within 3–5 days of microbial culture in nitrate-containing media. The alkaline condition was able to sustain at continued nutrient supply but reverted to normalcy (pH ~8.2–8.4) once the biomass was removed. Measurements of δ13C in the dissolved inorganic carbon revealed a significant atmospheric CO2 contribution to the carbonate alkalinity in the experimental seawater, confirming the occurrence of direct carbon dioxide capture from the air. Thermodynamic calculation shows a theoretical carbon removal rate of ~0.13 mol CO2/L seawater, if the seawater pH is allowed to decrease from 10.2 to 8.2. A cost analysis (using a standard bioreactor wastewater treatment plant as a template for CO2 trapping, and a modified moving-bed biofilm reactor for nitrate recycling) indicated that a 1 Mt CO2/year operation is able to perform at a cost of ~$40/tCO2, 2.5–5.5 times cheaper than that offered by any of the currently available direct air capture technologies, and more in line with the price of $25–30/tCO2 suggested for rapid deployment of large-scale CCS systems.
1. Introduction
Global CO2 emission surged strongly in the past three years following a three-year lull, despite the deployment of renewable energies and the continuous increase in energy efficiency. The accelerating upswing rate, 2% in 2017 [1,2] and 2.7% in 2018 [3], and the projected 2019 increase of atmospheric CO2 (5.2 ± 0.9 Gt, or 2.5 ± 0.4 ppm) [4] only reinforces the notion that negative emission technologies (NETs) are necessities in the next 2 to 3 decades, if we are to curb the end-of-century warming to 1.5 °C, while continuing the reliance on fossil fuels for economic development. Current estimates show the total tonnage of CO2 needing to be removed through NETs in the 21st century amounts to 100–1000 billion [5]. This sizable quantity may herald the emergence of the NET industry in light of the recently enacted carbon tax credit in the US ($50 for a ton of CO2 buried and $35 a ton for CO2 re-utilized).
Available NETs are either biological (e.g., forestry and land management), chemical (e.g., direct air capture), or geological (e.g., mineral carbonation), depending upon the carbon removal mechanism. At present, most 1.5 °C pathways are land-plant based, that is, relying heavily on afforestation and crop plantation, followed by bioenergy generation with carbon capture and storage (BECCS). However, this scheme is severely fettered by land availability [6]. Recent progress in direct air capture (DAC) [7] brings a new and engineering perspective to this field. The current DAC technique uses a conventional approach (large mechanical fans driving ambient air through chemical adsorbents) to trap CO2, followed by heat-induced degassing to recycle the adsorbents. While operable at small scales, such apparatus raises serious questions concerning the feasibility (scalability, capital investment, and energy input) of having any significant effect on atmospheric CO2 reduction, in addition to the need for long term and safe storage of compressed CO2 [8].
Natural carbon management in the Earth system is attained by converting CO2 to aqueous species HCO3− and CO32− and storing them as carbonate alkalinity in seawater. On geological scales, this scheme proceeds through weathering in the form of
for carbonate substrates or
for silicate rocks. Such reactions remove 1 to 2 moles of atmospheric CO2 for every mole of minerals dissolved, and are responsible for sequestering 0.5 Gt CO2 annually [9]. The resultant seawater alkalinity is counterbalanced through carbonate mineral precipitation (marine biota formation), and ultimately transported to the deep by the biological pump.
CO2 + H2O + CaCO3 (calcite) = Ca2+ + 2HCO3−
2CO2 + H2O + CaSiO3 (wallostonite) = Ca2+ + 2HCO3− + SiO2 (quartz)
A large amount of work has been devoted to developing CO2 removal technologies mimicking reactions such as Equations (1) and (2). To date, however, a breakthrough has yet to emerge to bring this approach close to the readiness level for carbon management [10]. On the one hand, the development is stymied technically by a bottleneck, resulting from the slow reaction kinetics commensurate only to geological time scale. On the other hand, even if the reaction rates can be artificially accelerated with minimal energy input, the magnitude and expenses of rock mining/CO2 transport and related processing are prohibitively too immense to be manageable financially and logistically. For example, an estimate shows that the amount of rocks needing to be weathered every year just to offset the world’s current level of new emissions is on the order of 100 billion tons [11]. As a comparison, the total US coal production from 1949 to 2011 is only about 46 billion tons.
Despite the lack of a leapfrogging advance, carbonate alkalinity based on CO2 trapping remains a rational option for climate mitigation because of the low risk to disturb earth system and the virtually unlimited natural carbon storage capacity. Nevertheless, radically different approaches need to be devised to deal with the sluggish reaction rates and the enormity of needed reactants (i.e., minerals). Here we present a different strategy, using microbial proton consumption, to circumvent rock weathering. The new scheme combines the efficiency and speed of microbial growth and the immense capacity of ocean and lithosphere to revitalize the seawater alkalinity approach and to broaden the NET portfolio.
2. Materials and Methods
2.1. Microbial Culture Experiments
Marine and freshwater phytoplankton communities were cultured under different nitrogen nutrient conditions. Seawater samples were first collected from the Bohai Bay in Tianjin city and a paddy field in Guangdong province, and subsequently cultured for microbial growth using the enriched seawater (ESAW) medium (modified after Harrison [12]) and the Wright Chu (WC) medium for freshwater (Supplementary Materials File S1). Dominant phyla in the samples were found to be cyanobacteria, green algae, and diatom. The culture was allowed to grow at 25 °C in a dark greenhouse illuminated by fluorescent lamps (2000 lux), with a 12-h:12-h on/off cycle.
To maintain an optimum nutrient level, 0.2 mL stock medium was added every three days. A sterile breathable membrane was used to seal the pool to ensure air circulation and prevent water loss through evaporation. The media were measured daily for pH and sampled every three days for C content determination.
2.2. Simples Analysis
Total Organic Carbon (TOC) and Total Carbon (TC) analyses of water samples were conducted using a total organic carbon analyzer (OI 1030W). For the TOC measurement, the filtered samples were pre-acidified with ~10% H3PO4 solution to remove inorganic carbon, while water samples for the TC measurement were filtered without pre-acidification. Dissolved inorganic carbon (DIC) was calculated by subtracting TOC from TC in water samples. Bio-carbon content of the microbial biomass (collected from biofilm on the substrate and rinsed by diluted or 10% HCl) was determined by an elemental analyzer (Vario EL III, Elementar, Germany). The carbon isotope measurement was performed by mass spectrometry (Finnigan MAT 253), with an analytical precision of ±0.1‰, and the results were expressed with reference to VPDB.
Biofilm formed in the experiments was fixed with 2% glutaraldehyde, dehydrated in concentrated ethanol, and gold-coated before imaging by SEM (Hitachi Su3500).
See SI material for a detailed description of the culture medium composition.
2.3. Working Principle
Inspecting the chemistry of Equations (1) and (2), one can readily see that the role of mineral weathering in these reactions is to neutralize the acidity generated by CO2 dissolution. A crucial aspect to note is that CO2 dissolution is not a kinetic hindrance for the purpose of alkalinity trapping because of CO2 hydration and the ensuing dissociation reactions
can reach equilibria in a matter of hours. It then follows that capturing CO2 in water is practically achievable, if a persistent alkaline condition can be generated and maintained in a timely fashion, to consume the protons produced in Equation (3).
CO2 + H2O ⇔ H2CO3 ⇔ H+ + HCO3−
The new approach we adopted to supplant mineral weathering is marine phytoplankton nitrogen assimilation. Nitrogen is a critical component of life. Other than diazotrophs that are able to directly utilize atmospheric N2 via biological nitrogen fixation (BNF), most organisms assimilate aqueous nitrate through enzyme (nitrate and nitrite reductase) catalysed processes, where NO3− is first reduced to NO2−, which subsequently undergoes further reduction to form NH3. The overall reaction of nitrate assimilation can be written as
The consumption of H+ in Equation (4) ultimately begets an alkaline environment over the course of phytoplankton growth [13] through
Notice that ammonia assimilation, the conversion of ammonia to amino acids, will not produce this desired result because the overall reaction
brings about a net acidity increase.
106CO2 + 106H2O + 16NH4+ → (CH2O)106(NH3)16 + 16H+ + 106O2
3. Results and Discussions
3.1. Carbonate Alkalinity
Consistent with Equation (5), both marine and freshwater microbial growth showed a persistent pH increase when nitrate was used as a N source (Figure 1A). The highest pH in seawater reached ~10.2 within 3–5 days, with total aqueous carbon (sum of biomass, organic, and inorganic carbon) increased by approximately 12 times. The alkaline conditions were able to maintain through the continued supply of nitrate. However, once the biomass was filtered out, the pH began to decrease, and ultimately reached a stable level of ~8.40 overnight (with aeration, Figure 2); meanwhile, the total dissolved inorganic carbon (DIC) in the media increased by ~80%, relative to the original seawater. Carbon stable isotope measurements showed that the δ13CDIC values changed from the initial ~−20‰ to ~−11‰ within a 20-day incubation period, approaching the atmospheric value of ~−8‰ [14] (Figure 3) and signalling the occurrence of air CO2 absorption (Equation (3)), by seawater in the system. Under the same conditions, the freshwater microbial community was able to bring up the pH even higher (~10.5) within a similar time frame, with the total carbon increasing by ~23 times.
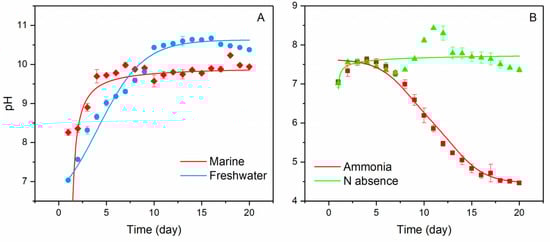
Figure 1.
pH changes in different culture environments over 20 days of incubation, showing rising pH with time in nitrate condition for both marine and freshwater communities and (A) declining pH over time in ammonia condition as well as the relatively stable pH, when N is absent in freshwater (B). Error bars represent range of the measurements (n = 3).
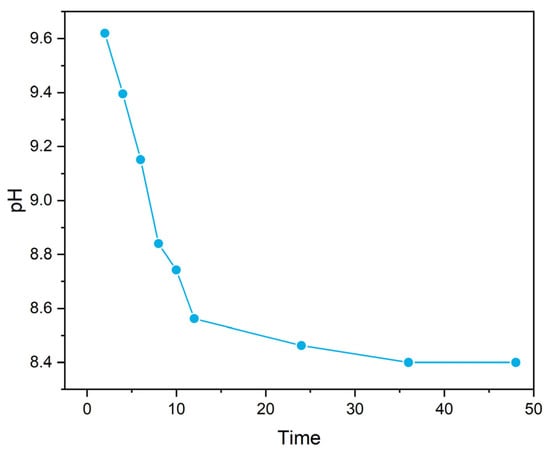
Figure 2.
pH changes on time scale after continuous aeration.
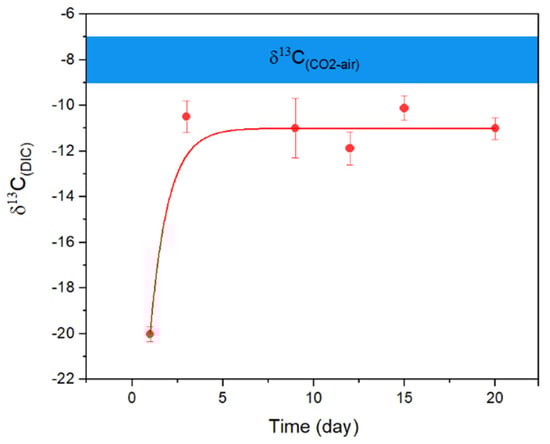
Figure 3.
Evolution of δ13C(DIC) in marine microbial culture over 20 days of incubation showing that the isotope composition approached the level of current atmospheric CO2 (blue bar at approximately −8‰). Error bars represent the range of the measurements (n = 3).
The pH-time relation shown in Figure 1 is expected from the biomass growth curve that increases exponentially during the logarithmic phase, followed by a stable period when cell death rate becomes equal to growth rate. At the exponential growth stage, a large amount of nitrate and ammonia is absorbed, due to the rapid proliferation of cells, for the synthesis of nitrogenous living substances. Accordingly, a rapid pH increase and decline is observed in nitrate and ammonia treated experiments, respectively. However, the growth and death rate of the cell reaches a steady state when the space and nutrients in the media have been utilized to the maximal potential. Consequently, the biomass growth shifts into a stable period, leading little additional changes in the pH.
A quick glance of the stoichiometry of Equation (5) reveals that the amount of carbon trapped in biomass (106 CO2) is significantly greater than that by alkalinity (16, assuming complete CO2 dissolution). The laboratory measurements (comparison of total carbon increase in the culture experiments to the added DIC, associated with pH decline from ~10.2 to ~8.4 after filtering out the biomass) were consistent with the theoretical implication.
It’s worth noting that the absence of N in the system still led to microbial growth (presumably through BNF), but the rate was sluggish and pH (7.5–8.5) little changed (Figure 1B). Furthermore, as predicted by Equation (6), the culture media under the ammonia condition exhibited a strong trend of acidity increase over time, where the pH, after an early increase from 7–7.5 in the first 3–5 days, experienced a steady decline, and ultimately reached ~4.5 at the end of the 20-day experiments (Figure 1B). The respective increase and decrease of pH associated nitrate and ammonia assimilation observed in the experiments are in total agreement with the proposition given by [15].
Organisms in general prefer ammonia over nitrate because of the lower energy cost for biosynthesis. If ammonia is absent and nitrate is the sole nitrogen source, cell growth usually occurs at a slower rate. For phytoplankton, the subdued growth leads to ~12% less biomass yield per unit N source (see summary by Raven et al. [16]). One way to compensate phototrophs for the excess energy consumption associated with nitrate assimilation may be stronger photosynthetic photon flux densities (PPFD). In field settings of shallow (<5 m) estuary, Møhlenberg [17] observed positive phytoplankton biomass growth at a minimal photon flux density of 0.2 mol m−2 d−1 and a saturation density of ~3 mol m−2 d−1 and ~15 mol m−2 d−1 in spring and summer, respectively. The illuminance of the fluorescent light used in the present study was 2000 lux, equivalent to ~2 mol m−2 d−1, significantly lower than the average saturation density reported by Møhlenberg [17], suggesting that the measured OH− production can be further enhanced. Estimated PPFD at mid-latitude (37~56° north) is on the order of 43–48 mol m−2 d−1 [18], at least 300% stronger than the reported saturation density for phytoplankton growth, and certainly has sufficient intensity to be harvested to offset the nitrate disadvantage. Even at the yearly minimum (winter solstice), theoretically estimated PPFD at the latitude of 55° N comes to be approximately 5 mol m−2 d−1 [19] and above the ~3 mol m−2 d−1 saturation density for phytoplankton.
3.2. Carbonate Mineralization
When pH rises beyond ~8.92 in marine environment, Equation (3) can go through further disassociation via
to render the system dominated by carbonate anions. Given the 400 ppm (10−2 mol) and 1300 ppm (10−1.27 mol) average concentrations for Ca2+ and Mg2+ in seawater, it follows that the precipitation of calcite (CaCO3, solubility product Ksp = 10−8.48) and magnesite (MgCO3, Ksp = 10−8.03) becomes practically relevant to permanently storing the trapped CO2 into mineral forms, if Equation (7) yields a modest amount of CO32− (>10−5~10−4 mol). Speciation calculation via the thermodynamic code of PhreeQC [20] revealed the presence of 10−3~10−2 mol CO32− in the media at pH 10, corresponding to a saturation index (defined as the ratio of ionic activity product to Ksp) of Ω = 2 and 1.27 for calcite and magnesite in seawater, respectively. This supersaturated condition was confirmed by the observed (Figure 4) extensive mineralization of calcite and amorphous magnesium carbonate phases on the biofilm. The absence of magnesite is expected because anhydrous magnesium carbonate has not been shown to crystallize at room temperature.
HCO3− + OH− ⇔ CO32− + H2O
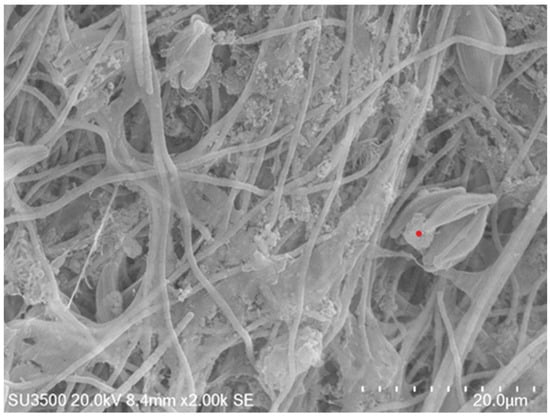
Figure 4.
Scanning electron microscope (SEM) microphotograph of algae biofilm showing the formation of mineral phases on the cell surfaces. A typical composition of the inorganic precipitates (given by Energy-dispersive X-ray spectroscopy (EDX) analysis performed on the grain indicted by the red dot) is C (40.38% ± 4.01), O (47.2% ± 4.13), Mg (6.27% ± 0.21), and Si (6.15% ± 0.17), similar to the mineral phase (i.e., MgCO3 and SiO2).
3.3. CO2 Trapping Methodology
Based upon the experimental testing results, we propose a microbially induced direct air capture (MI-DAC) strategy. The core concept is to increase seawater carbonate alkalinity without invoking mineral weathering. This approach relies on coastal marine phytoplankton farms to elevate seawater pH through microbial nitrate assimilation. The produced high pH water can be circulated back to ocean after aeration processes to absorb CO2. Unlike algae farms intended for biofuel production where specially selected phytoplankton rich in triacylglycerols is raised to maximize oil yield, MI-DAC can be executed using the entire marine photoautotrophic microbial community, eliminating the need to guard the culture chambers from contamination by unwanted microorganisms.
The intended strategy can be viewed as a coupled nitrate reduction-CO2 absorption process. On the surface, CO2 trapping occurs through biomass growth and hydroxyl alkalinity production. This is apparent as the assimilation of each nitrate ion consumes 6.625 CO2 molecules (the Redfield stoichiometry) via photosynthesis [13], while producing one OH− to dissolve CO2. However, it is important to note that MI-DAC requires a steady input of nitrate to maintain phytoplankton growth. A straightforward calculation using the stoichiometry in Equation (5) shows a nitrate (in the form of nitric acid) consumption rate of ~187 Mt per Gt CO2 trapped. This parity ratio, if not amended, would put a severe constraint on the scales of MI-DIC operation, given the total size of 230 Mt for annual industrial nitrogen fixation (2018 data). To circumvent this restriction, we further propose an on-site nitrate recycling facility that converts organic N and ammonia from biomass to NO3−. This sets MI-DAC apart from conventional biological CO2 trapping methods such as photosequestration [21], biofertilizer manufacturing [22], and BECCS in that the resultant biomass (~0.76 ton wet or ~0.35 ton dry for every ton of CO2 trapped) is now considered a nitrogen holder and a transitory carbon storage. The new strategy instead focuses on taking advantage of the biologically spawned hydroxyl to absorb CO2 molecules through dissolution reactions (Equation (3)) and store it as carbonate alkalinity in seawater.
The regeneration of nitrate from ammonia can be fulfilled either through industrial processes or biological nitrification. Although the traditional chemical engineering method via the Haber-Bosch process is a mature technology and can perform with high (97%) yield, it is energy intensive due to the requirement of high temperatures (400~500 °C) and pressure (15~25MPa). On the other hand, microbial nitrification occurs at ambient conditions extensively and is used commonly in wastewater (including saline water) treatment. Biological nitrification technologies most relevant to MI-DIC may be akin to that used in aerobic tanks outfitted with moving-bed biofilm reactors (MBBR) for wastewater treatment [23]. Traditionally, the active bacteria in these settings are those that obtain energy by oxidizing ammonia (NH3 and NH4+, whose relative quantity depends on pH and salinity) to nitrate [24]. While the conventional view holds that biological nitrification is a two-step aerobic process carried out first by ammonia oxidizing bacteria (AOB, converting ammonium to nitrite) followed by nitrite oxidizing bacteria (NOB, further oxidation of nitrite to nitrate), new studies [25,26] found that certain Nitrospira bacteria are able to mediate the Complete Ammonia Oxidation (dubbed Comammox) process. Furthermore, recent metagenomic data from recirculating aquaculture systems (a process similar to nitrifying moving bed biofilm reactor (MBBR)) revealed additional diversity in the ammonia-oxidizing microbiological community, implying the potential resilience of nitrification function under a range of environmental conditions [27].
Additional factors external to MI-DIC, such as the carbon holding capacity of ocean and environmental consequence of seawater alkalinity increase, need to be evaluated to ensure the validity and safety of this strategy. The ocean has already absorbed ~40% of all anthropogenic C emissions, but on the whole, is still a carbon sink at present [28]. Global carbon cycle model suggests that the CO2 storage tonnage in the ocean is on the order of trillions, similarly to that underground. Furthermore, it is concluded that such capacity will allow the majority of the present atmospheric CO2, excessive to pre-industrial levels, to be absorbed naturally by the ocean [29], in a longer term (100 to 200 ka pending on estimated CO2 uptake rate). Collectively, current understanding appears to converge on the adequacy of ocean carbon sequestration capacity. For the alkalinity effect on ocean chemistry, consensus seems to remain in the making (at least for short term impact), as most existing work so far has focused on exploring the potential outcome of acidifying conditions. Nevertheless, assuming all the anthropogenic CO2 in the next 100 years is added to the ocean in the form of HCO3− and CO32−, the calculation showed that seawater alkalinity is not anticipated to greatly exceed 3 mEq/Kg [30]. While this represents a ~30% increase from today’s average value of ~2.3 mEq/Kg [31], it needs to be evaluated in conjunction with the ocean surface acidity that has experienced 0.1 pH unit decrease, due to atmospheric CO2 elevation. Moreover, available evidence suggests that about 17% of the added alkalinity can be used by coral reefs, leading to a ~7% increase in the net community calcification, as ocean chemistry is restored closer to pre-industrial conditions [32].
The MI-DAC process is a de facto coupled C and N biogeochemical cycle and can take advantage of anthropogenically elevated N presence in natural waters. Nitrogen pollution from fertilizers, livestock effluent, and fossil fuel combustion occurs widely in global aquatic systems. Artificially fixed nitrogen in seawater exists mostly in the form of nitrate [33] and can potentially facilitate the MI-DAC operation. This could be particularly fitting to major nitrogen fertilizing regions such as the east Asian sea, where anthropogenic NOx emission has experienced more than a twofold increase since 2000 [34], along with a burst (1463 Gg N/year) of mostly nitrate depositions [35].
3.4. Cost Analysis
Cost has always been a highly contested issue for carbon reduction technologies, largely in view of financial sustainability. For DAC, an economic analysis conducted 10 years ago [36] gave an estimate of $250–$1200/tCO2. This number was further refined with consideration of thermodynamic efficiency and capital expenditure, and finally converged at ~$1000/tCO2 [8]. It was subsequently concluded that the cost was prohibitively high for DAC to be a climate mitigation tool. However, a later study [37] argued that the expense can be reduced to $309/tCO2 with optimized energy consumption and low-cost packing materials for the air-absorbent contacting device (contactor). A most recent estimation, based upon refined engineering design and the recyclability of the chemical absorbents, further lowered the cost to $94 to $232/tCO2 [38]. Despite the significant decline, current pricing is still far above the threshold of $25–30 range at which carbon capture and storage (CCS) systems can be deployed at a significant level [39].
Existing DAC technologies rely on CO2 absorption by alkaline substances of either liquid or solid state. Whereas CO2 trapping takes place at ambient conditions (with the help of air blowers), a complete operation needs to embed in a very energy and cost intensive process for CO2 liberation, to regenerate/recycle the sorbent. For this type of setup, strong heating (as high as 900 °C) is used to decompose precipitated carbonate salts (normally CaCO3) so that the original alkalinity (usually in the form of alkali metal hydroxide) can be recovered [40]. The use of solid sorbents lowers the CO2 desorption temperature but still requires heat at 80 to 480 °C [41]. The MI-DAC approach differs principledly from the existing ones in that CO2 discharge from sorbent (seawater in our case) is no longer part of the scheme. The projected process flow of MI-DAC is in fact similar to that of membrane bioreactor wastewater treatment plants (MB-WWTP), less the conventional components needed for solid waste separation and processing (such as sedimentation tank and sludge dehydration system). Accordingly, a cost analysis (hypothetical due to lack of constraints by field testing data) can be performed using a typical MB-WWTP as a template (assuming 1 Mt water/day processing capacity, Table 1). Investment to be considered for fixed assets (CAS) may include expenses for infrastructure construction, pump station, distribution well system, biofilm reaction tank, fan room, electrical controller, and other ancillary equipment. Operation & maintenance costs (COM) may include items such as energy, microbial growth maintenance, water test, and labor. Assuming the levelized cost per ton CO2 captured from the air is the sum of the levelized CAS and the annual COM, our estimate gives a value of $30 to 31/tCO2 for a MI-DAC plant with a 30-year lifetime (Table 2). This low-cost stems to a large extent from the exclusion of absorbent regeneration/recycle and solid waste disposal operation that otherwise requires heavy capital and energy investment. Due to the lower costs of fixed assets, the MI-DAC approach run at ~10.5% of the COM to CAS ratio, about 2.6 times greater than the calculated values for traditional DAC facilities [42], and over 0.5 times higher than that suggested for wastewater treatment plants.

Table 1.
Fix asset investment ($million) for a 106 tCO2/year MI-DAC operation.
Table 2.
Annual operations and maintenance expense and levelized cost for per tCO2 captured from the air ($million/year).
More theoretical cost analyses of MB-WWTP operation intended for MI-DAC can be carried out using known cost functions. A straightforward thermodynamic calculation shows 0.13 moles of CO2 will be absorbed per liter of water to bring the pH down from 10.2 to 8.2. Assuming 80% of this rate is applicable to MI-DAC in seawater, a 1 Mt CO2/year MI-DAC plant requires a daily water processing capacity of ~630,000 m3. The full cost of a MB-WWTP at this scale, estimated via the published [43] cost function C(€) = 17.3617 V0.5771 e(0.1006A + 0.6932COD) (V = volume of water/year, A = lifespan of the plant, COD = chemical oxygen demand removal efficiency for bacterial bed reactor), ranges from €47 to €24 for COD = 100% and zero, respectively. The chemical oxygen removal demand requirement for MI-DAC operation is minimal, in theory. Assuming 30% COD is enforced, the cost function given is a value of ~€29/tCO2, or slightly below $32/tCO2, based upon the conversion rate of €1 = $1.10, similar to the hypothetical estimation of $30–31/tCO2.
The operations and maintenance (O&M) costs are estimated based on current industrial wastewater treatment plant (WWTP) operation with similar equipment and process. Energy costs were calculated using a commercial charge of $0.12/kW·h. Equipment maintenance cost accounts for 5% of total equipment cost. Other costs followed the average market-set price.
To complete the cost analysis, an on-site biological nitrification tank, intended to regenerate NO3− from ammonia, is further budgeted in. Microbial removal of N from wastewater conventionally requires two separate operations: aerobic nitrification (oxidizing NH4+/NH3 to NO3−) and anaerobic denitrification (reducing NO3− to N2). The aerobic process alone is sufficient for the MI-DAC purpose, as nitrate instead of dinitrogen is the intended product. Accordingly, the cost is expected to be a fraction of that for regular MBBR, due to the omission of anaerobic denitrification. The scale of the needed aeration facility depends on the surface area of the biofilm carrier and the nitrification rate, which in turn is a function of inlet ammonia loading rate (or hydraulic retention time) and dissolved oxygen content. The majority of existing MBBR find applications at relatively low nitrogen concentrations where the influent ammonia varies from <40 mg/L in municipal sewage [44] to ~500 mg/L in industrial wastewater [45], with the nitrification efficiency frequently reaching 80% and above. Within the range of 183–438 mg/L, NH3-N [24] observed a linear relation of ratenitrification = (0.51rinlet-ammonium + 0.53) and reported a nitrification rate of 3.05 gNH4/day/m2biofilm, when the inlet ammonium loading was maximized at 5 g m−2 day−1. At this rate, recycling one ton N will require ~420 × 103 m2 of biofilm surface area. Using commercially available MBBR media (e.g., AlgaeControl Canada, Ecologix Environmental Systems) that offer >5000 m2/m3 active surface area, one estimates the footprint of such tanks will be ~84 m3.
For decomposed biomass where the (NH3 + NH4+) level can reach 5000 mg/L [46], the ammonia loading rate may be further increased by several folds, leading to potentially much more rapid nitrification, assuming the Torkaman et al. linear relation holds. Nevertheless, cost assessment for aerobic nitrification at such a high ammonia concentration is difficult to be specific without kinetic data. At present, we assume aerobic nitrification is 50% of a regular moving-bed biofilm reactor, whose expense can be estimated by the same cost function [43] of MB-WWTP, less COD removal. For a nitrate self-sufficient MI-DAC setup, 1 Mt CO2/year capacity needs a companion nitrification tank of ~300,000 m3 water/day, assuming an influent ammonia concentration of 3725 mg/L, or 75% of the (NH3 + NH4+) level reported for bio-waste [47]. The inclusion of such facility will lead to an additional $8.5 increase per ton CO2 captured, making the final cost to be around $40/tCO2. This value is drastically lower than any of the known DAC technologies have offered thus far (by a factor of at least 2.5~5.5, see review in [36] and Table 3), and is in fact approaching the number of $25–30/tCO2 suggested by most energy and economic modelling for the rapid deployment of large-scale CCS systems [37]. To this end, the MI-DAC strategy appears to hold great promise as a carbon management tool, given the 100~1000 ka residence time for alkalinity in ocean.
Table 3.
Cost comparison of current direct air capture technologies.
4. Conclusions and Outlook
Bench-top experiments confirmed that phytoplankton nitrate assimilation combined with CO2 dissolution can potentially be a low-cost DAC strategy for carbon mitigation. This method utilizes the hydroxyl alkalinity produced during microbial transformation of nitrate to ammonia to increase water pH. Laboratory tests showed that strong alkaline conditions of pH > 10 can be achieved in seawater. At this pH level, atmospheric CO2 is readily absorbed and converted to carbonate alkalinity, and in the long-term captured by carbonate mineralization in ocean. Nitrate can be recycled on-site through nitrifying biofilter from the harvested biomass, a by-product that can also be used as stock material for algal products such as green fertilizers.
A cost analysis based upon laboratory data indicated the MI-DAC approach has a strong likelihood to sharply cut down the expenses of carbon sequestration. The estimated cost of ~$40/tCO2 is merely ~20–40% of those offered by currently available technologies, and appears to suggest that this method at least has the potential to be another climate mitigation tool that meets the economic demands for large-scale deployment.
It is suggested [46] that, to meet the 1.5 °C target, atmospheric CO2 capture needs to operate at 10 Gt CO2 yr−1 by mid-century and 20 Gt·yr−1 by the end of century. There are about half a dozen known NETs, including reforestation, BECCS, DAC, soil carbon, biochar, and enhanced weathering, that can remove CO2 from air. Thus, on average, DAC is preferred to have an ability to trap 1.5 to 2 Gt CO2 per year (15–20% of the proposed total CO2 removal), by mid-century. Industrial-scale direct air capture using currently available methods may take 20–30 years to reach this desired capacity. Incidentally, a forestry/soil-based approach appears to be ready for massive deployment, but is unlikely to achieve its full capability because of the fierce competition with agriculture for land usage. In contrast, the WWTP technology-based MI-DAC approach may be made deployable much earlier at large scales, thanks to the milder R&D needs and lower costs, while competing for little natural resources and leaving no legacy of CO2 storage.
To reach the natural CO2 consumption level of continental weathering (~0.5 Gt CO2 per annum, [46]), the daily water processing capacity of MI-DAC needs to reach ~239 million m3. Putting this into perspective, the combined WWTP capability of US and China alone is ~310 million m3/day, indicating the scale of MI-DAC operations ought to be fully manageable in practice. On the other hand, there are ~40,000 wastewater treatment systems in the US, Europe, and China alone, and the top 10 largest wastewater treatment facilities in the world have a combined processing capacity of only ~25 million m3/day [53], equivalent to 54 Mt CO2/year, if used for MI-DAC. Thus, scaling up MI-DAC may require substantial initial investment to set up multiple facilities equivalent to the largest wastewater treatment plants in the world.
Supplementary Materials
The following supporting information can be downloaded at: https://www.mdpi.com/article/10.3390/ijerph20010550/s1. Supplementary File S1: ESAW medium and WC medium.
Author Contributions
J.S. and H.H.T. designed the research. J.S. conducted the research (data collections and analyses). H.H.T. and J.S. completed this paper together. C.-Q.L., J.Z. and X.W. commented on the manuscript. All authors have read and agreed to the published version of the manuscript.
Funding
This research was funded by the National Natural Science Foundation of China (41830859).
Institutional Review Board Statement
Not applicable.
Informed Consent Statement
Not applicable.
Data Availability Statement
Some or all data and models that support the findings of this study are available from the corresponding author upon reasonable request.
Conflicts of Interest
The authors declare no conflict of interest.
References
- Le Quéré, C.; Andrew, R.M.; Friedlingstein, P.; Sitch, S.; Pongratz, J.; Manning, A.C.; Korsbakken, J.I.; Peters, G.P.; Canadell, J.G.; Jackson, R.B.; et al. Global Carbon Budget 2017. Earth Syst. Sci. Data 2018, 10, 405–448. [Google Scholar] [CrossRef]
- Peters, G.P.; Le Quéré, C.; Andrew, R.M.; Canadell, J.G.; Friedlingstein, P.; Ilyina, T.; Jackson, R.B.; Joos, F.; Korsbakken, J.I.; McKinley, G.A. Towards real-time verification of CO2 emissions. Nat. Clim. Chang. 2017, 7, 848–850. [Google Scholar] [CrossRef]
- Figueres, C.; Le Quéré, C.; Mahindra, A.; Bäte, O.; Whiteman, G.; Peters, G.; Guan, D. Emissions are still rising: Ramp up the cuts. Nature 2018, 564, 27–30. [Google Scholar] [CrossRef] [PubMed]
- IPCC. Global Warming of 1.5 °C An IPCC Special Report on the Impacts of Global Warming of 1.5 °C above Pre-Industrial Levels and Related Global Greenhouse Gas Emission Pathways, in the Context of Strengthening the Global Response to the Threat of Climate Change, Sustainable Development, and Efforts to Eradicate Poverty; Masson-Delmotte, V., Zhai, P., Pörtner, H.-O., Roberts, D., Skea., J., Shukla, P.R., Pirani, A., Moufouma-Okia, S., Péan, C., Pidcock, R., Eds.; IPCC: Geneva, Switzerland, 2018. [Google Scholar]
- Friedlingstein, P.; Jones, M.W.; O’Sullivan, M.; Andrew, R.M.; Hauck, J.; Peters, G.P.; Peters, W.; Pongratz, J.; Sitch, S.; Le Quéré, C.; et al. Global Carbon Budget 2019. Earth Syst. Sci. Data 2019, 11, 1783–1838. [Google Scholar] [CrossRef]
- Fuss, S.; Lamb, W.F.; Callaghan, M.W.; Hilaire, J.; Creutzig, F.; Amann, T.; Beringer, T.; de Oliveira Garcia, W.; Hartmann, J.; Khanna, T.; et al. Negative emissions—Part 2: Costs, potentials and side effects. Environ. Res. Lett. 2018, 13, 063002. [Google Scholar] [CrossRef]
- Keith, D.W. Why capture CO2 from the atmosphere? Science 2009, 325, 1654–1655. [Google Scholar] [CrossRef]
- House, K.Z.; Baclig, A.C.; Ranjan, M.; van Nierop, E.A.; Wilcox, J.; Herzog, H.J. Economic and energetic analysis of capturing CO2 from ambient air. Proc. Natl. Acad. Sci. USA 2011, 108, 20428. [Google Scholar] [CrossRef]
- Renforth, P.; Henderson, G. Assessing ocean alkalinity for carbon sequestration. Rev. Geophys. 2017, 55, 636–674. [Google Scholar] [CrossRef]
- Mai, B.; Adjiman, C.S.; Bardow, A.; Anthony, E.J.; Dowell, N.M. Carbon capture and storage (CCS): The way forward. Energy Environ. Sci. 2018, 11, 1062–1176. [Google Scholar]
- Council, N.R. Climate Intervention: Carbon Dioxide Removal and Reliable Sequestration; The National Academies Press: Washington, DC, USA, 2015; p. 154. [Google Scholar] [CrossRef]
- Berges, J.A.; Franklin, D.J.; Harrison, P.J. Evolution of an artificial seawater medium: Improvements in enriched seawater, artificial water over the last two decades. J. Phycol. 2001, 37, 1138–1145. [Google Scholar] [CrossRef]
- Peter, G.; Brewer, J.C.G. Alkalinity changes generated by phytoplankton growth. Limnol. Ocean. 1976, 21, 108–117. [Google Scholar]
- Tsai, D.D.-W.; Chen, P.H.; Ramaraj, R. The potential of carbon dioxide capture and sequestration with algae. Ecol. Eng. 2017, 98, 17–23. [Google Scholar] [CrossRef]
- Wolf-Gladrow, D.A.; Zeebe, R.E.; Klaas, C.; Körtzinger, A.; Dickson, A.G. Total alkalinity: The explicit conservative expression and its application to biogeochemical processes. Mar. Chem. 2007, 106, 287–300. [Google Scholar] [CrossRef]
- Raven, J.A.; Wollenweber, B.; Handley, L.L. A comparison of ammonium and nitrate as nitrogen sources for photolithotrophs. New Phytol. 1992, 121, 19–32. [Google Scholar] [CrossRef]
- Møhlenberg, F. Regulating mechanisms of phytoplankton growth and biomass in a shallow estuary. Ophelia 1995, 42, 239–256. [Google Scholar] [CrossRef]
- Ge, S.; Smith, R.G.; Jacovides, C.P.; Kramer, M.G.; Carruthers, R.I. Dynamics of photosynthetic photon flux density (PPFD) and estimates in coastal northern California. Theor. Appl. Climatol. 2011, 105, 107–118. [Google Scholar] [CrossRef]
- Ritchie, R.J. Modelling photosynthetic photon flux density and maximum potential gross photosynthesis. Photosynthetica 2010, 48, 596–609. [Google Scholar] [CrossRef]
- Parkhurst, D.L.; Appelo, C.A.J. Description of Input and Examples for PHREEQC Version 3—A Computer Program for Speciation, Batch-Reaction, One-Dimensional Transport, and Inverse Geochemical Calculations: U.S. Geological Survey Techniques and Methods; USGS: Cheboygan, MI, USA, 2013. [Google Scholar]
- Jansson, C.; Wullschleger, S.D.; Kalluri, U.C.; Tuskan, G.A. Phytosequestration: Carbon Biosequestration by Plants and the Prospects of Genetic Engineering. BioScience 2010, 60, 685–696. [Google Scholar] [CrossRef]
- Singh, J.S.; Kumar, A.; Rai, A.N.; Singh, D.P. Cyanobacteria: A precious bio-resource in agriculture, ecosystem, and environmental sustainability. Front. Microbiol. 2016, 7, 529. [Google Scholar] [CrossRef]
- Hoang, V.; Delatolla, R.; Abujamel, T.; Mottawea, W.; Gadbois, A.; Laflamme, E.; Stintzi, A. Nitrifying moving bed biofilm reactor (MBBR) biofilm and biomass response to long term exposure to 1 °C. Water Res. 2013, 49, 215–224. [Google Scholar] [CrossRef]
- Torkaman, M.; Borghei, S.M.; Tahmasebian, S.; Andalibi, M.R. Nitrogen removal from high organic loading wastewater in modified Ludzack–Ettinger configuration MBBR system. Water Sci. Technol. 2015, 72, 1274–1282. [Google Scholar] [CrossRef] [PubMed]
- Daims, H.; Lebedeva, E.V.; Pjevac, P.; Han, P.; Herbold, C.; Albertsen, M.; Jehmlich, N.; Palatinszky, M.; Vierheilig, J.; Bulaev, A.; et al. Complete nitrification by Nitrospira bacteria. Nature 2015, 528, 504–509. [Google Scholar] [CrossRef] [PubMed]
- Van Noorden, R. Carbon sequestration- Buried trouble. Nature 2010, 463, 871–873. [Google Scholar] [CrossRef]
- Huang, Z.; Jiang, Y.; Song, X.; Hallerman, E.; Peng, L.; Dong, D.; Ma, T.; Zhai, J.; Li, W. Ammonia-oxidizing bacteria and archaea within biofilters of a commercial recirculating marine aquaculture system. AMB Express 2018, 8, 17. [Google Scholar] [CrossRef]
- Sabine, C.L.; Tanhua, T. Estimation of Anthropogenic CO2 Inventories in the Ocean. Annu. Rev. Mar. Sci. 2010, 2, 175. [Google Scholar] [CrossRef] [PubMed]
- Khatiwala, S.; Primeau, F.; Hall, T. Reconstruction of the history of anthropogenic CO2 concentrations in the ocean. Nature 2009, 462, 346–349. [Google Scholar] [CrossRef]
- Baciocchi, R.; Storti, G.; Mazzotti, M. Process design and energy requirements for the capture of carbon dioxide from air. Chem. Eng. Process. Process. Intensif. 2006, 45, 1047–1058. [Google Scholar] [CrossRef]
- Takahashi, T.; Wallace, S.; Bainbridge, E. The alkalinity and total carbon dioxide concentration in the world oceans. Carbon Cycle Model. 1981, 16, 271–286. [Google Scholar]
- Albright, R.; Caldeira, L.; Hosfelt, J.; Kwiatkowski, L.; Maclaren, J.K.; Mason, B.M.; Nebuchina, Y.; Ninokawa, A.; Pongratz, J.; Ricke, K.L.; et al. Reversal of ocean acidification enhances net coral reef calcification. Nature 2016, 531, 362–365. [Google Scholar] [CrossRef]
- Zakem, E.J.; Al-Haj, A.; Church, M.J.; van Dijken, G.L.; Dutkiewicz, S.; Foster, S.Q.; Fulweiler, R.W.; Mills, M.M.; Follows, M.J. Ecological control of nitrite in the upper ocean. Nat. Commun. 2018, 9, 1206. [Google Scholar] [CrossRef]
- Yan, X.Y.; Akimoto, H.; Ohara, T. Estimation of nitrous oxide, nitric oxide and ammonia emissions from croplands in East, Southeast and South Asia. Glob. Chang. Biol. 2003, 9, 1080–1096. [Google Scholar] [CrossRef]
- Liu, X.; Zhang, Y.; Han, W.; Tang, A.; Shen, J.; Cui, Z.; Vitousek, P.; Erisman, J.W.; Goulding, K.; Christie, P.; et al. Enhanced nitrogen deposition over China. Nature 2013, 494, 459–462. [Google Scholar] [CrossRef] [PubMed]
- Ranjan, M.; Herzog, H.J. Feasibility of air capture. Energy Procedia 2011, 4, 2869–2876. [Google Scholar] [CrossRef]
- Zeman, F. Reducing the Cost of Ca-Based Direct Air Capture of CO2. Environ. Sci. Technol. 2014, 48, 11730–11735. [Google Scholar] [CrossRef]
- Keith, D.W.; Holmes, G.; St. Angelo, D.; Heidel, K. A Process for Capturing CO2 from the Atmosphere. Joule 2018, 2, 1573–1594. [Google Scholar] [CrossRef]
- IPCC. Special Report on Carbon Dioxide Capture and Storage; IPCC: Geneva, Switzerland, 2005; p. 431. [Google Scholar]
- Li, C.; Shi, H.; Cao, Y.; Kuang, Y.; Zhang, Y.; Gao, D.; Sun, L. Modeling and optimal operation of carbon capture from the air driven by intermittent and volatile wind power. Energy 2015, 87, 201–211. [Google Scholar] [CrossRef]
- Sinha, A.; Darunte, L.A.; Jones, C.W.; Realff, M.J.; Kawajiri, Y. Systems Design and Economic Analysis of Direct Air Capture of CO2 through Temperature Vacuum Swing Adsorption Using MIL-101(Cr)-PEI-800 and mmen-Mg2(dobpdc) MOF Adsorbents. Ind. Eng. Chem. Res. 2016, 56, 750–764. [Google Scholar] [CrossRef]
- Fasihi, M.; Efimova, O.; Breyer, C. Techno-economic assessment of CO2 direct air capture plants. J. Clean. Prod. 2019, 224, 957–980. [Google Scholar] [CrossRef]
- Hernandez-Sancho, F.; Molinos-Senante, M.; Sala-Garrido, R. Cost modelling for wastewater treatment processes. Desalination 2011, 268, 1–5. [Google Scholar] [CrossRef]
- Nhut, H.T.; Hung, N.T.Q.; Sac, T.C.; Bang, N.H.K.; Quang Tri, T.; Trung Hiep, N.; Minh Ky, N. Removal of nutrients and organic pollutants from domestic wastewater treatment by sponge-based moving bed biofilm reactor. Environ. Eng. Res. 2020, 25, 652–658. [Google Scholar] [CrossRef]
- Sahariah, B.P.; Anandkumar, J.; Chakraborty, S. Treatment of coke oven wastewater in an anaerobic–anoxic–aerobic moving bed bioreactor system. Desalin. Water Treat. 2016, 57, 14396–14402. [Google Scholar] [CrossRef]
- Pires, J.C.M. Negative emissions technologies: A complementary solution for climate change mitigation. Sci. Total Environ. 2019, 672, 502–514. [Google Scholar] [CrossRef] [PubMed]
- Limoli, A.; Langone, M.; Andreottola, G. Ammonia removal from raw manure digestate by means of a turbulent mixing stripping process. J. Environ. Manag. 2016, 176, 1–10. [Google Scholar] [CrossRef] [PubMed]
- Keith, D.W.; Ha-Duong, M.; Stolaroff, J.K. Climate Strategy with CO2 Capture from the Air. Clim. Chang. 2006, 74, 17–45. [Google Scholar] [CrossRef]
- Socolow, R.; Desmond, M.; Aines, R.; Blackstock, J.; Bolland, O.; Kaarsberg, T.; Lewis, N.; Mazzotti, M.; Pfeffer, A.; Sawyer, K. Direct Air Capture of CO2 with Chemicals: A Technology Assessment for the APS PANEL on Public Affairs; American Physical Society: College Park, MD, USA, 2011. [Google Scholar]
- Mazzotti, M.; Baciocchi, R.; Desmond, M.J.; Socolow, R.H. Direct air capture of CO2 with chemicals: Optimization of a two-loop hydroxide carbonate system using a countercurrent air-liquid contactor. Clim. Chang. 2013, 118, 119–135. [Google Scholar] [CrossRef]
- Antecy. About Us. Hoevelaken, Netherlands. 2018. Available online: http://www.antecy.com/about-us/ (accessed on 5 February 2018).
- Lackner, K.S. Capture of carbon dioxide from ambient air. Eur. Phys. J. Spec. Top. 2009, 176, 93–106. [Google Scholar] [CrossRef]
- Lu, J.-Y.; Wang, X.-M.; Liu, H.-Q.; Yu, H.-Q.; Li, W.-W. Optimizing operation of municipal wastewater treatment plants in China: The remaining barriers and future implications. Environ. Int. 2019, 129, 273–278. [Google Scholar] [CrossRef]
Disclaimer/Publisher’s Note: The statements, opinions and data contained in all publications are solely those of the individual author(s) and contributor(s) and not of MDPI and/or the editor(s). MDPI and/or the editor(s) disclaim responsibility for any injury to people or property resulting from any ideas, methods, instructions or products referred to in the content. |
© 2022 by the authors. Licensee MDPI, Basel, Switzerland. This article is an open access article distributed under the terms and conditions of the Creative Commons Attribution (CC BY) license (https://creativecommons.org/licenses/by/4.0/).