
Temporal and Spatial Evolution of Eichmann Lake Wetland in Aksu River Basin and Its Response to Ecological Water Supply

Abstract
1. Introduction
2. Materials and Methods
2.1. Data Sources
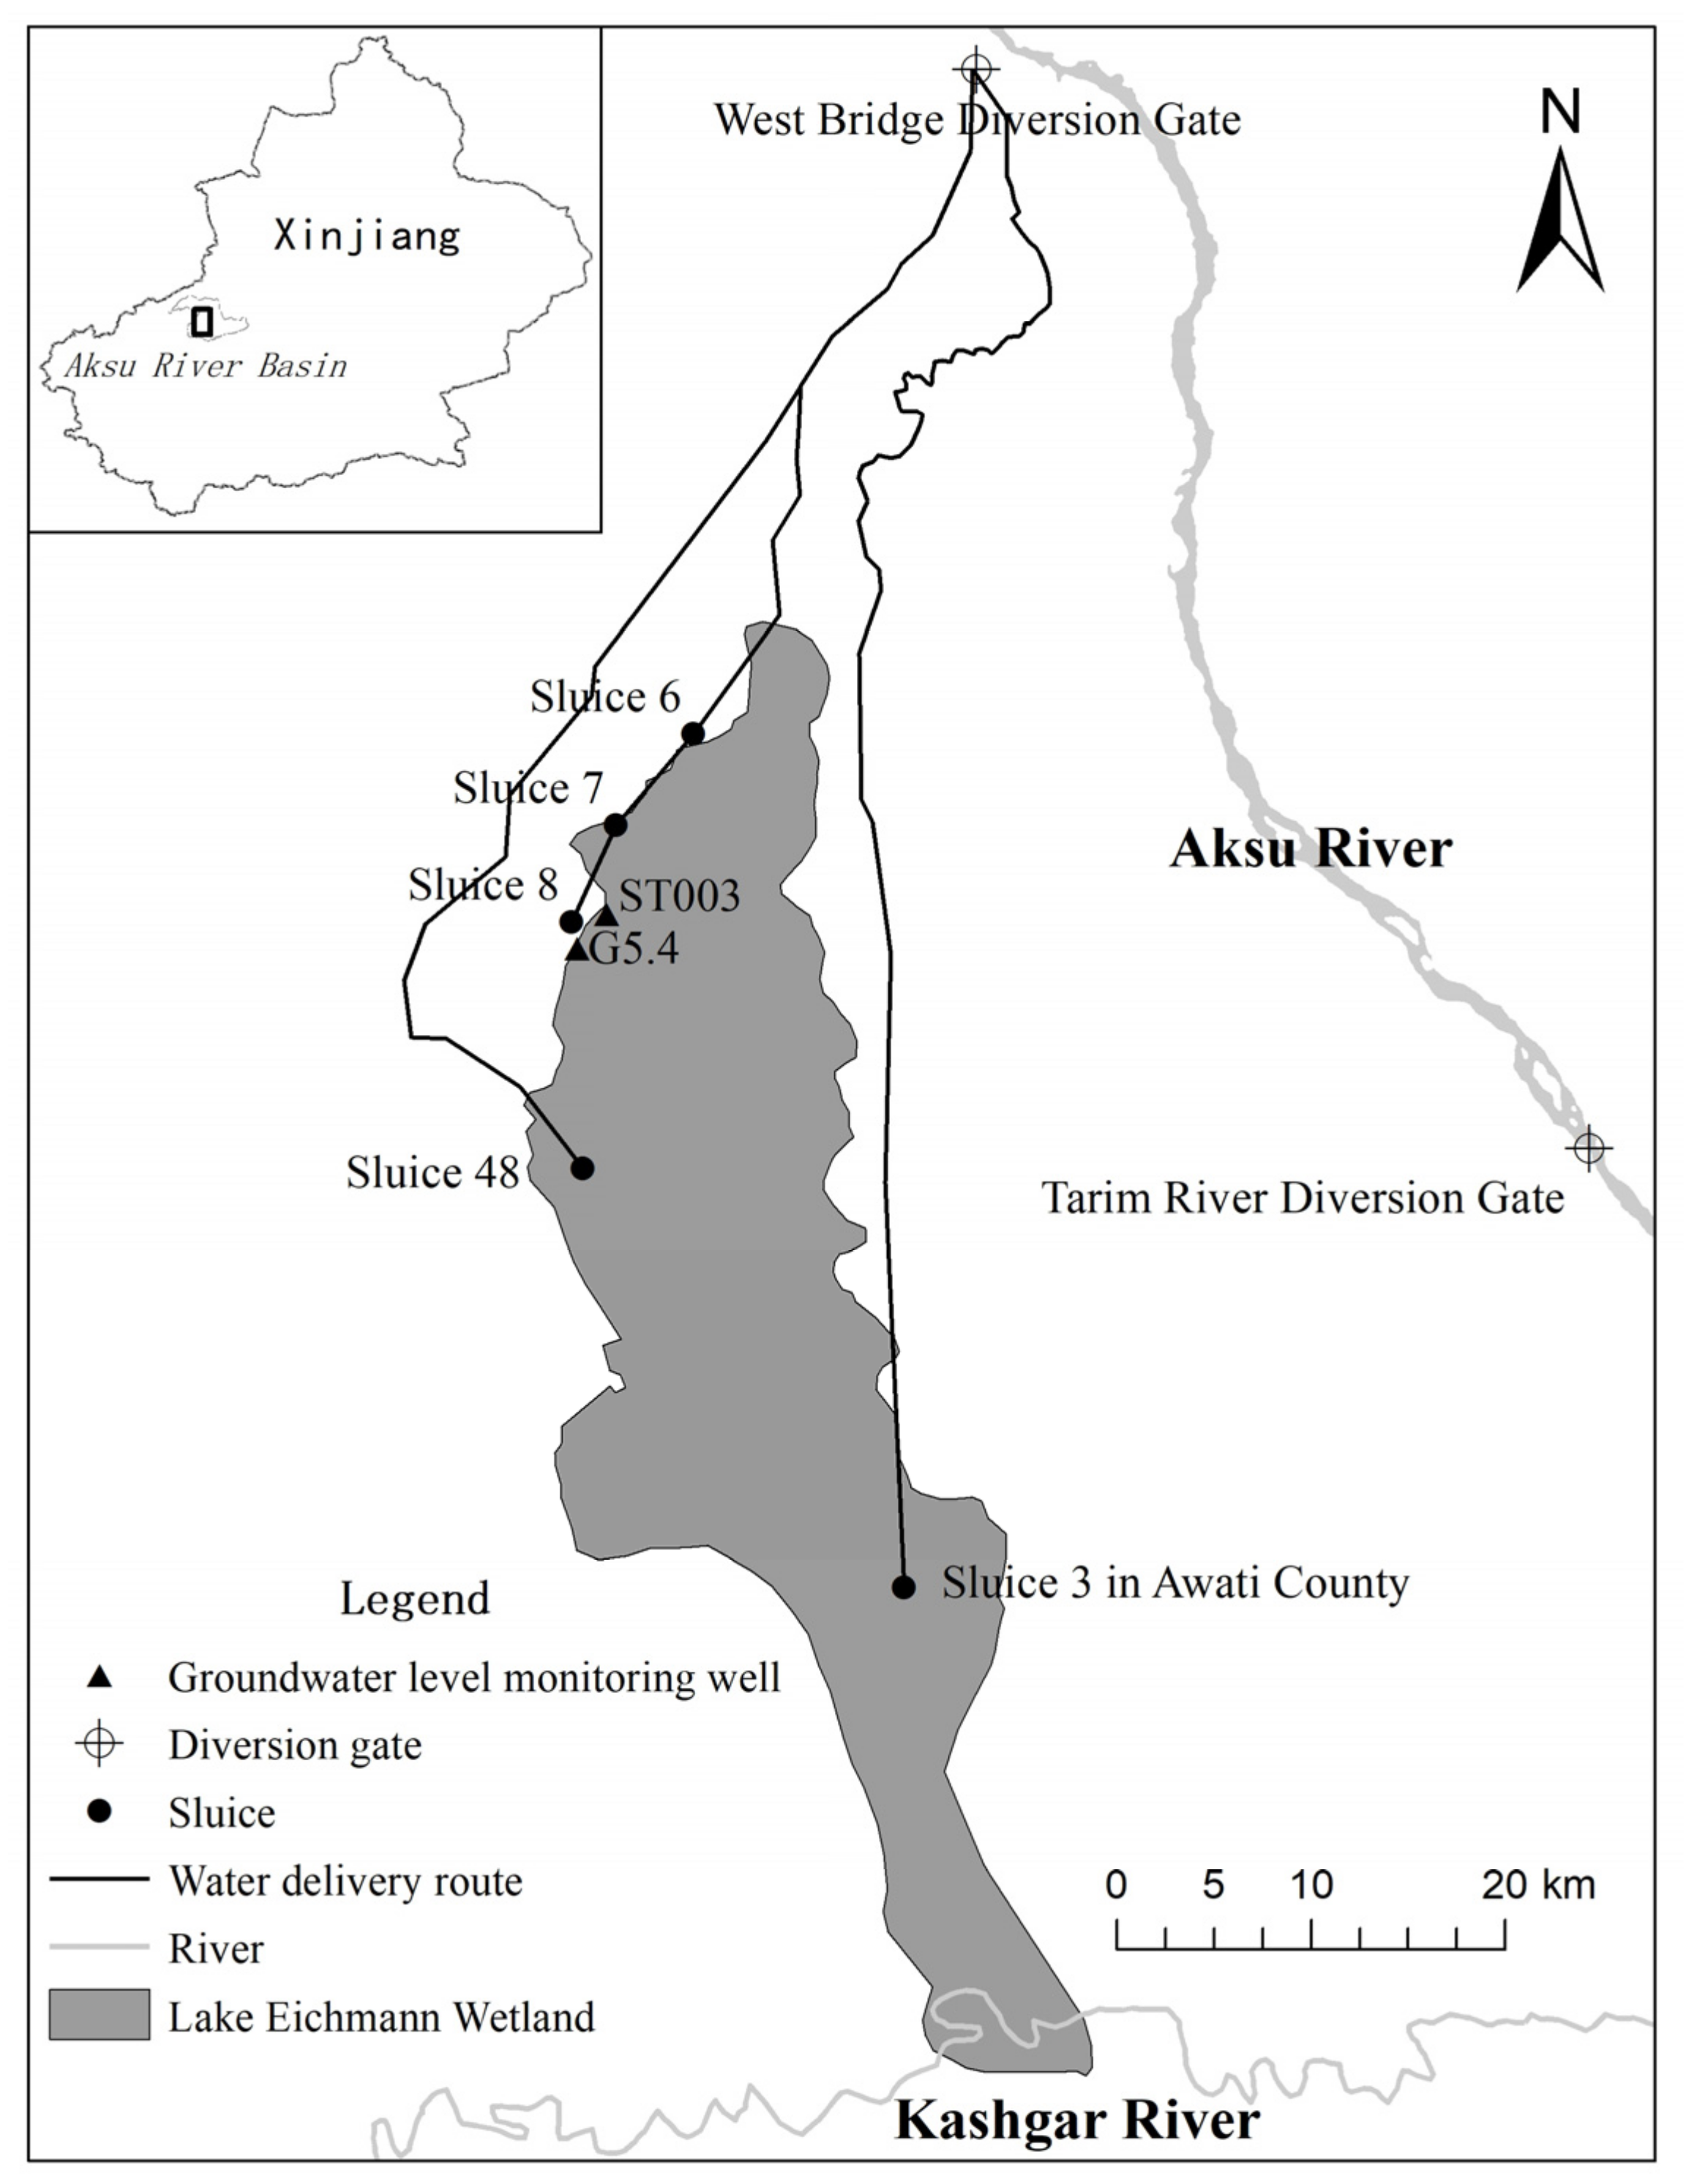
2.2. Study Area
2.3. Methods
2.3.1. Water Index Method
2.3.2. Time Series Change and Response Analysis
3. Results
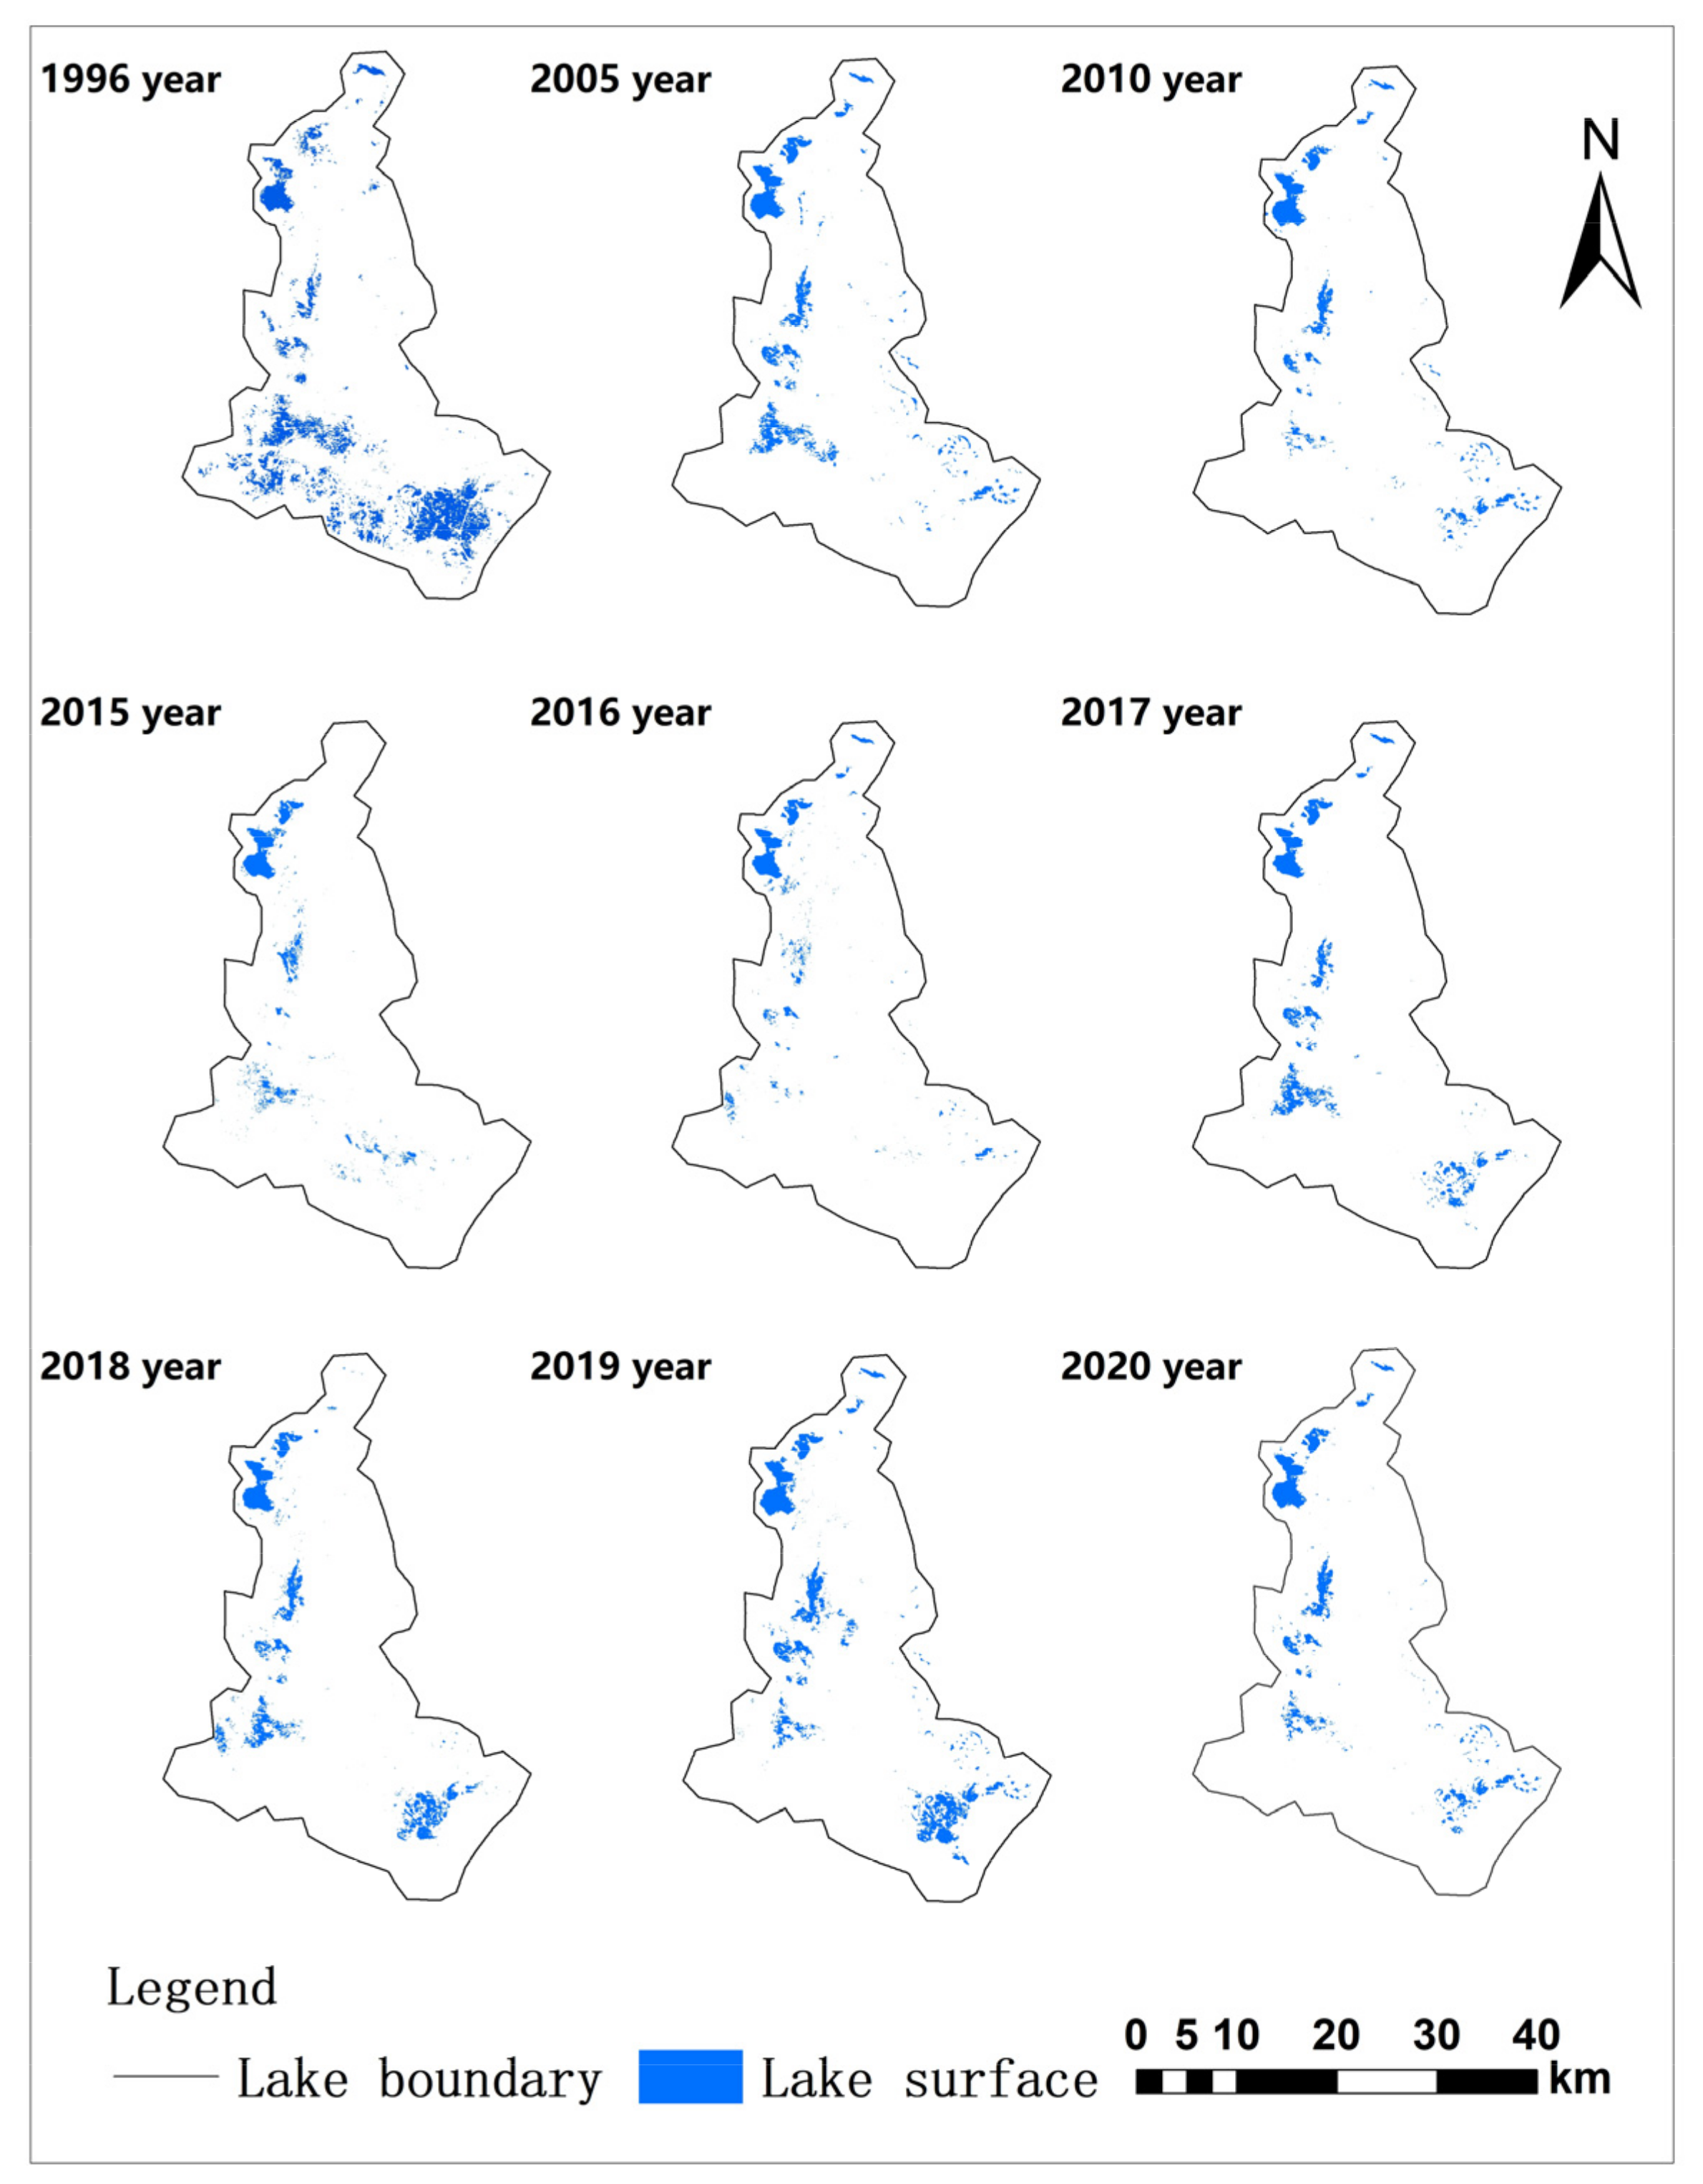
3.1. Annual Variation Characteristics of Lake Water Surface and Its Response to Ecological Water Supply
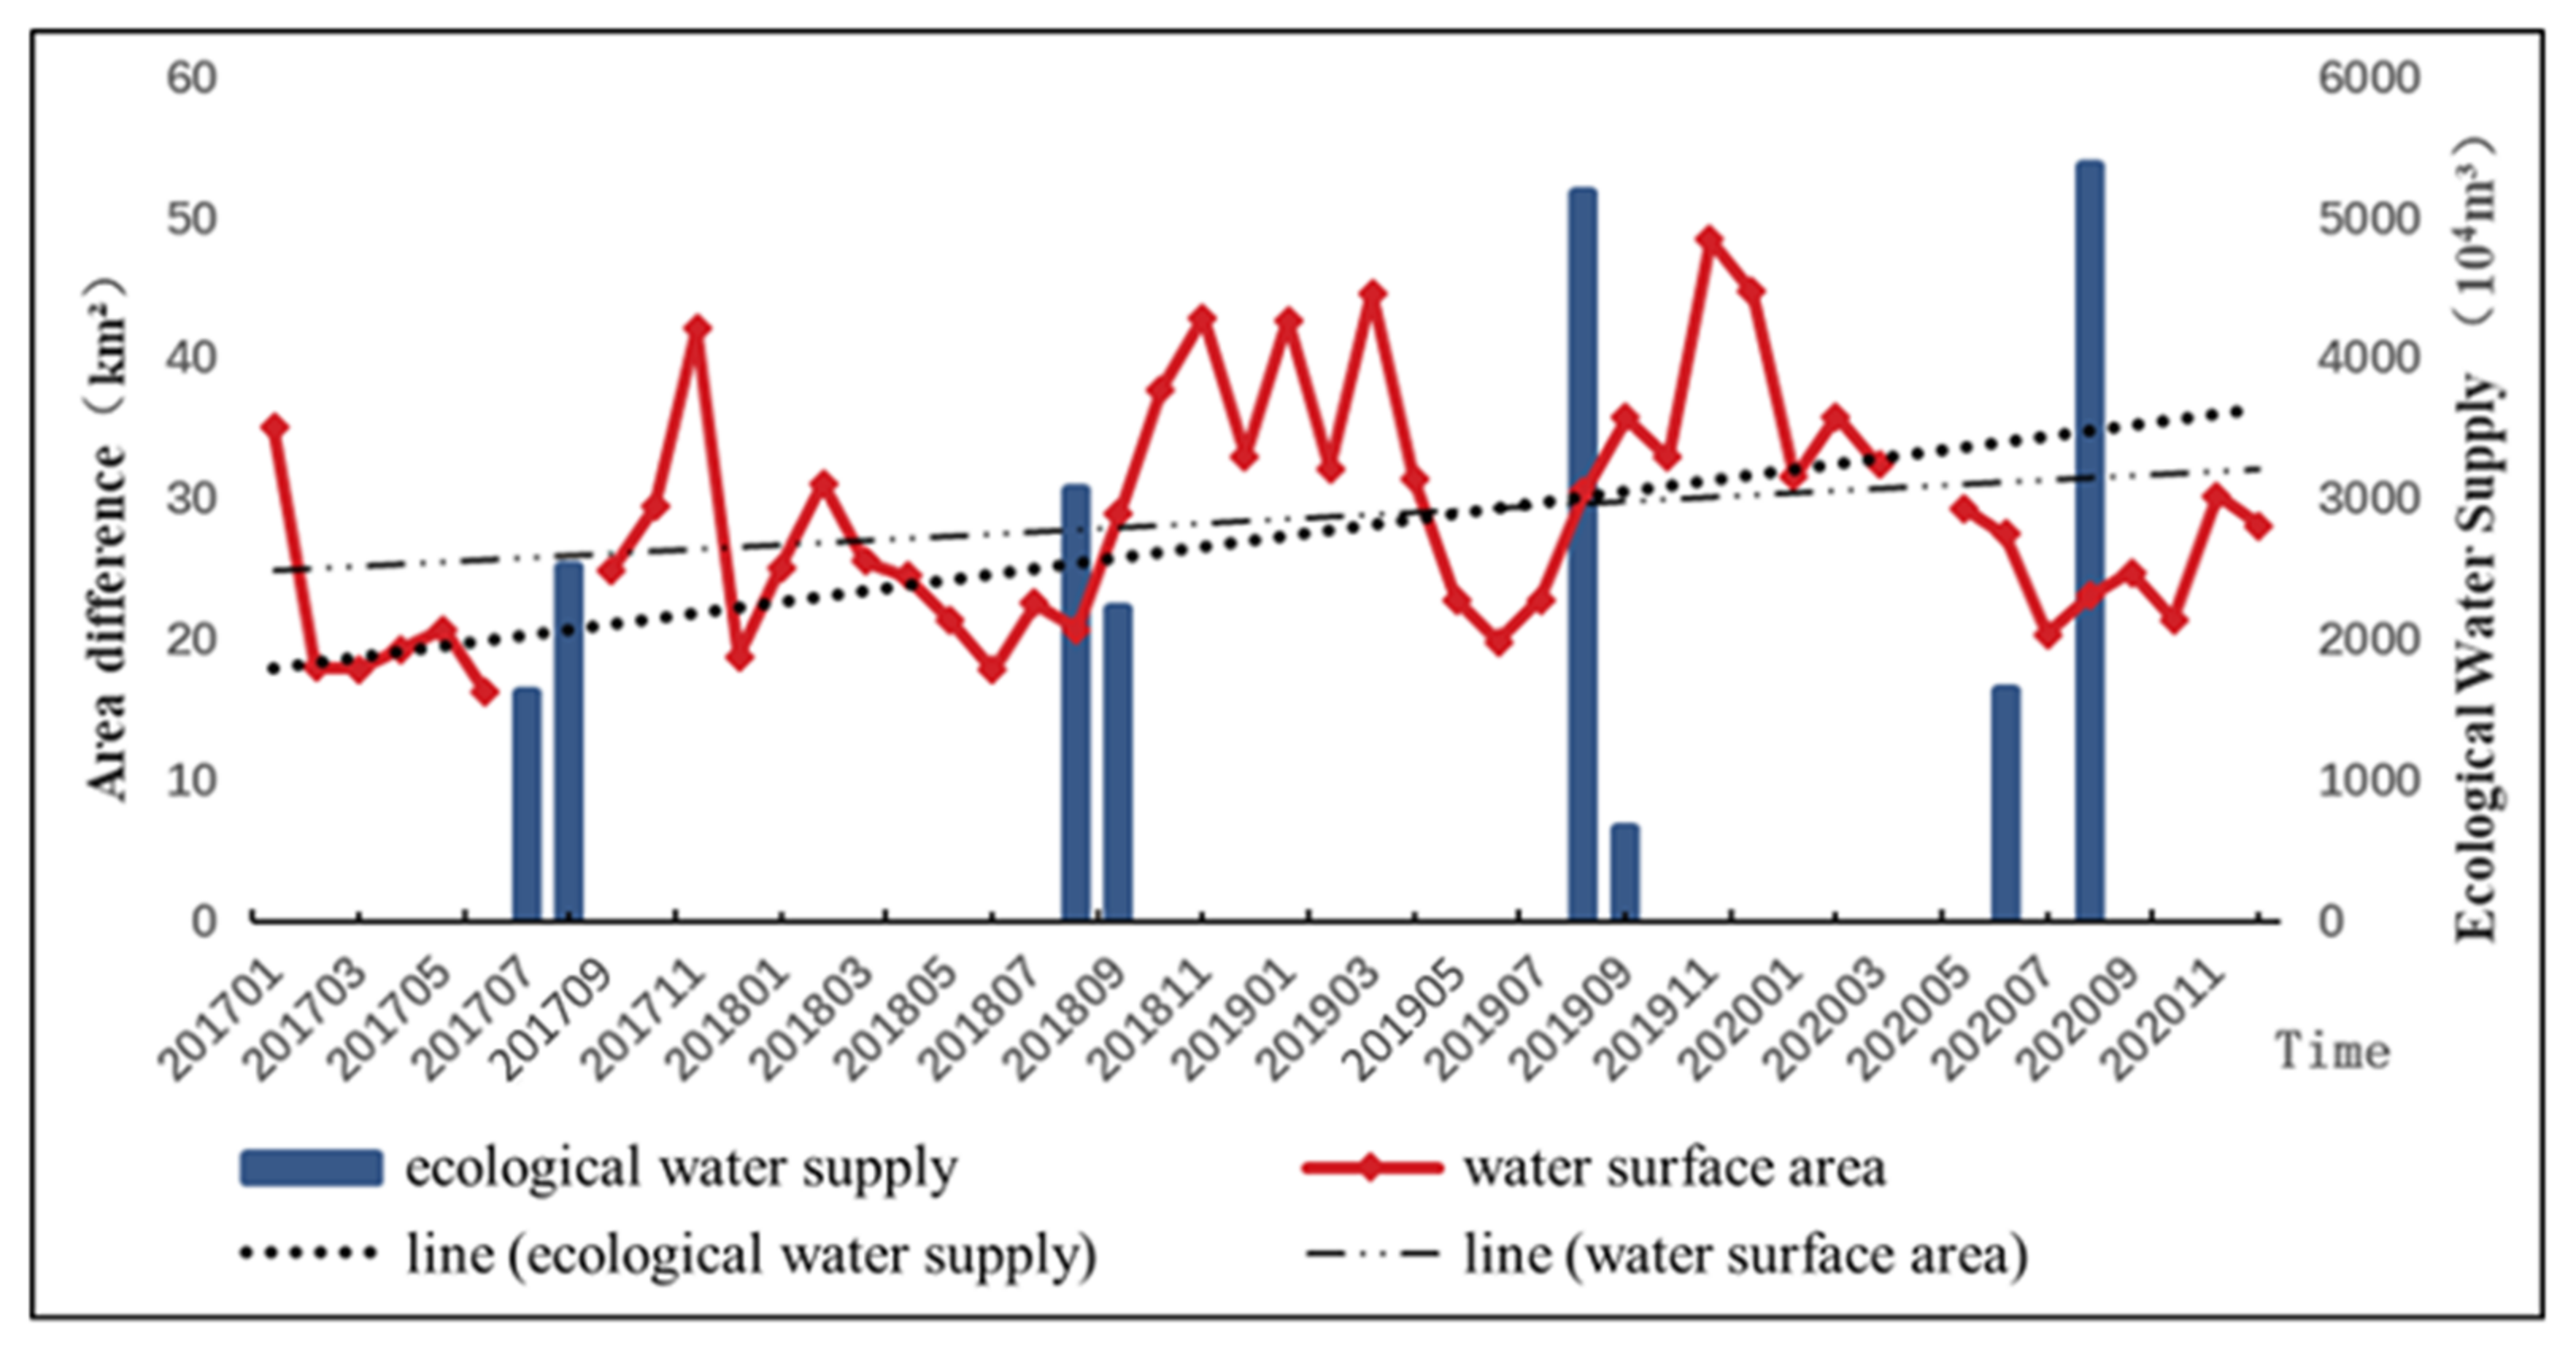
3.2. Seasonal Variation Characteristics of Water Surface of Lakes and Its Response to Ecological Water Supply
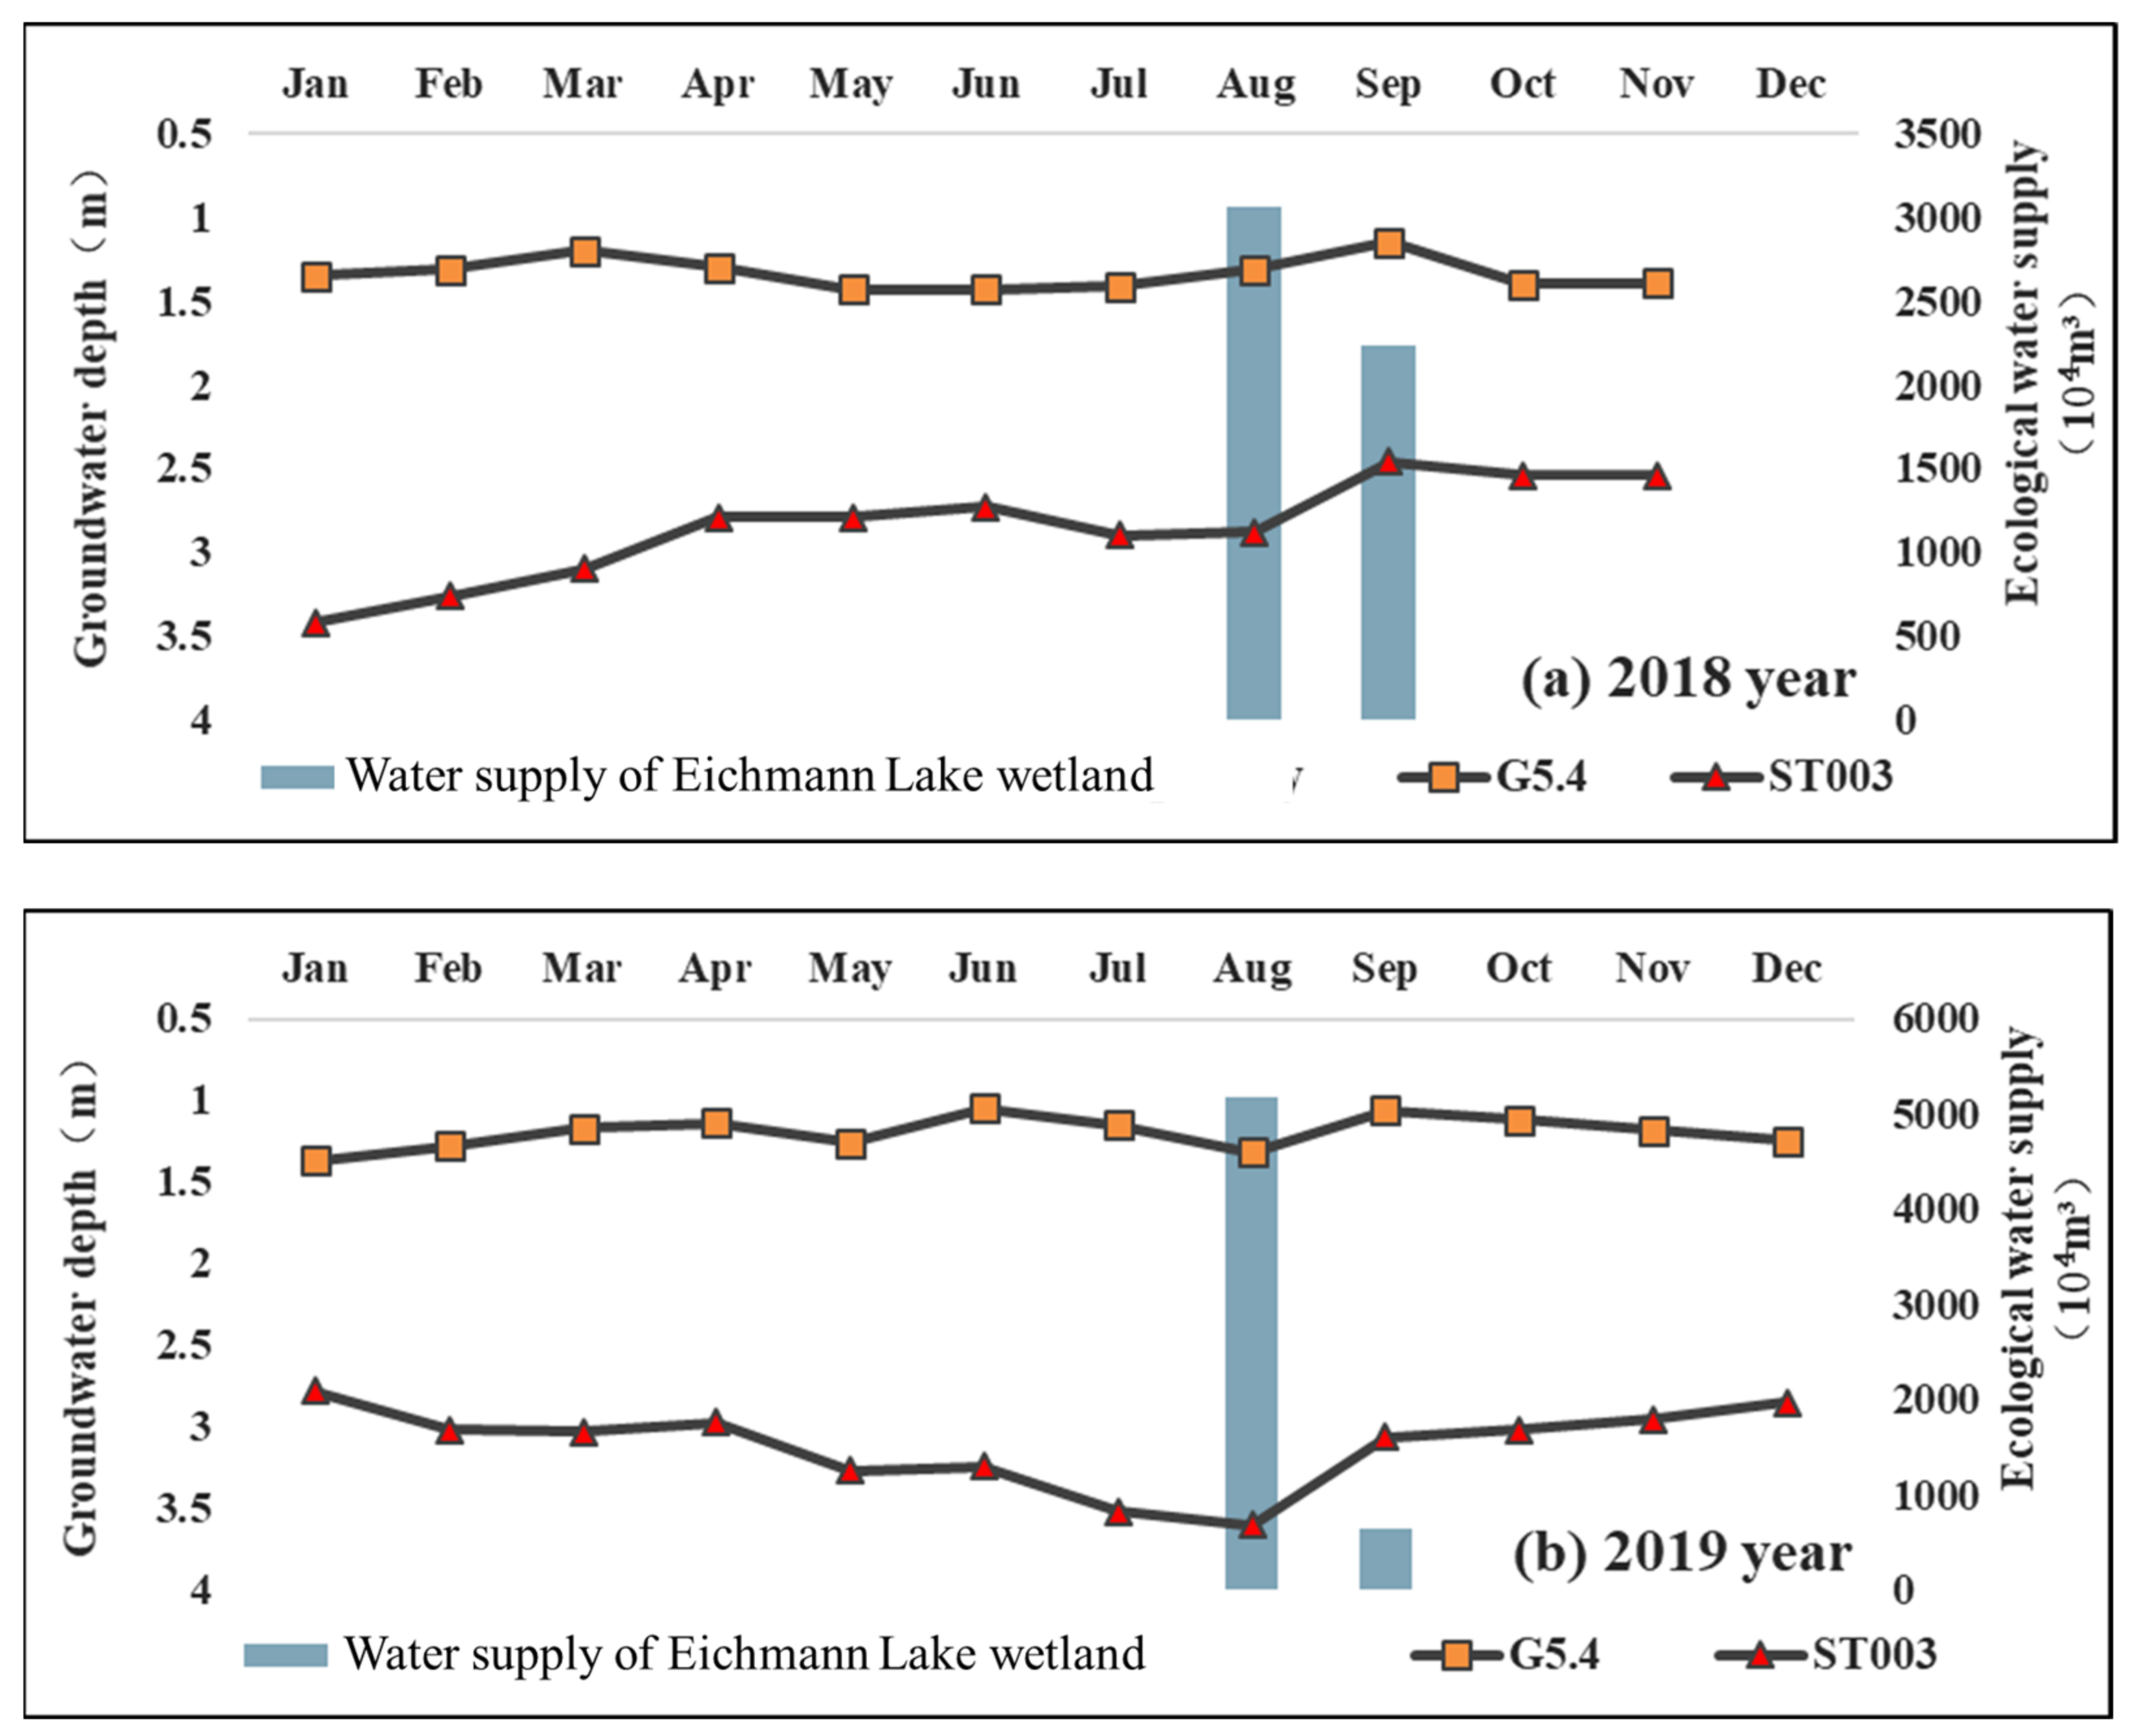
3.3. Dynamic Variation Characteristics of Groundwater Level and Its Response to Ecological Water Supply
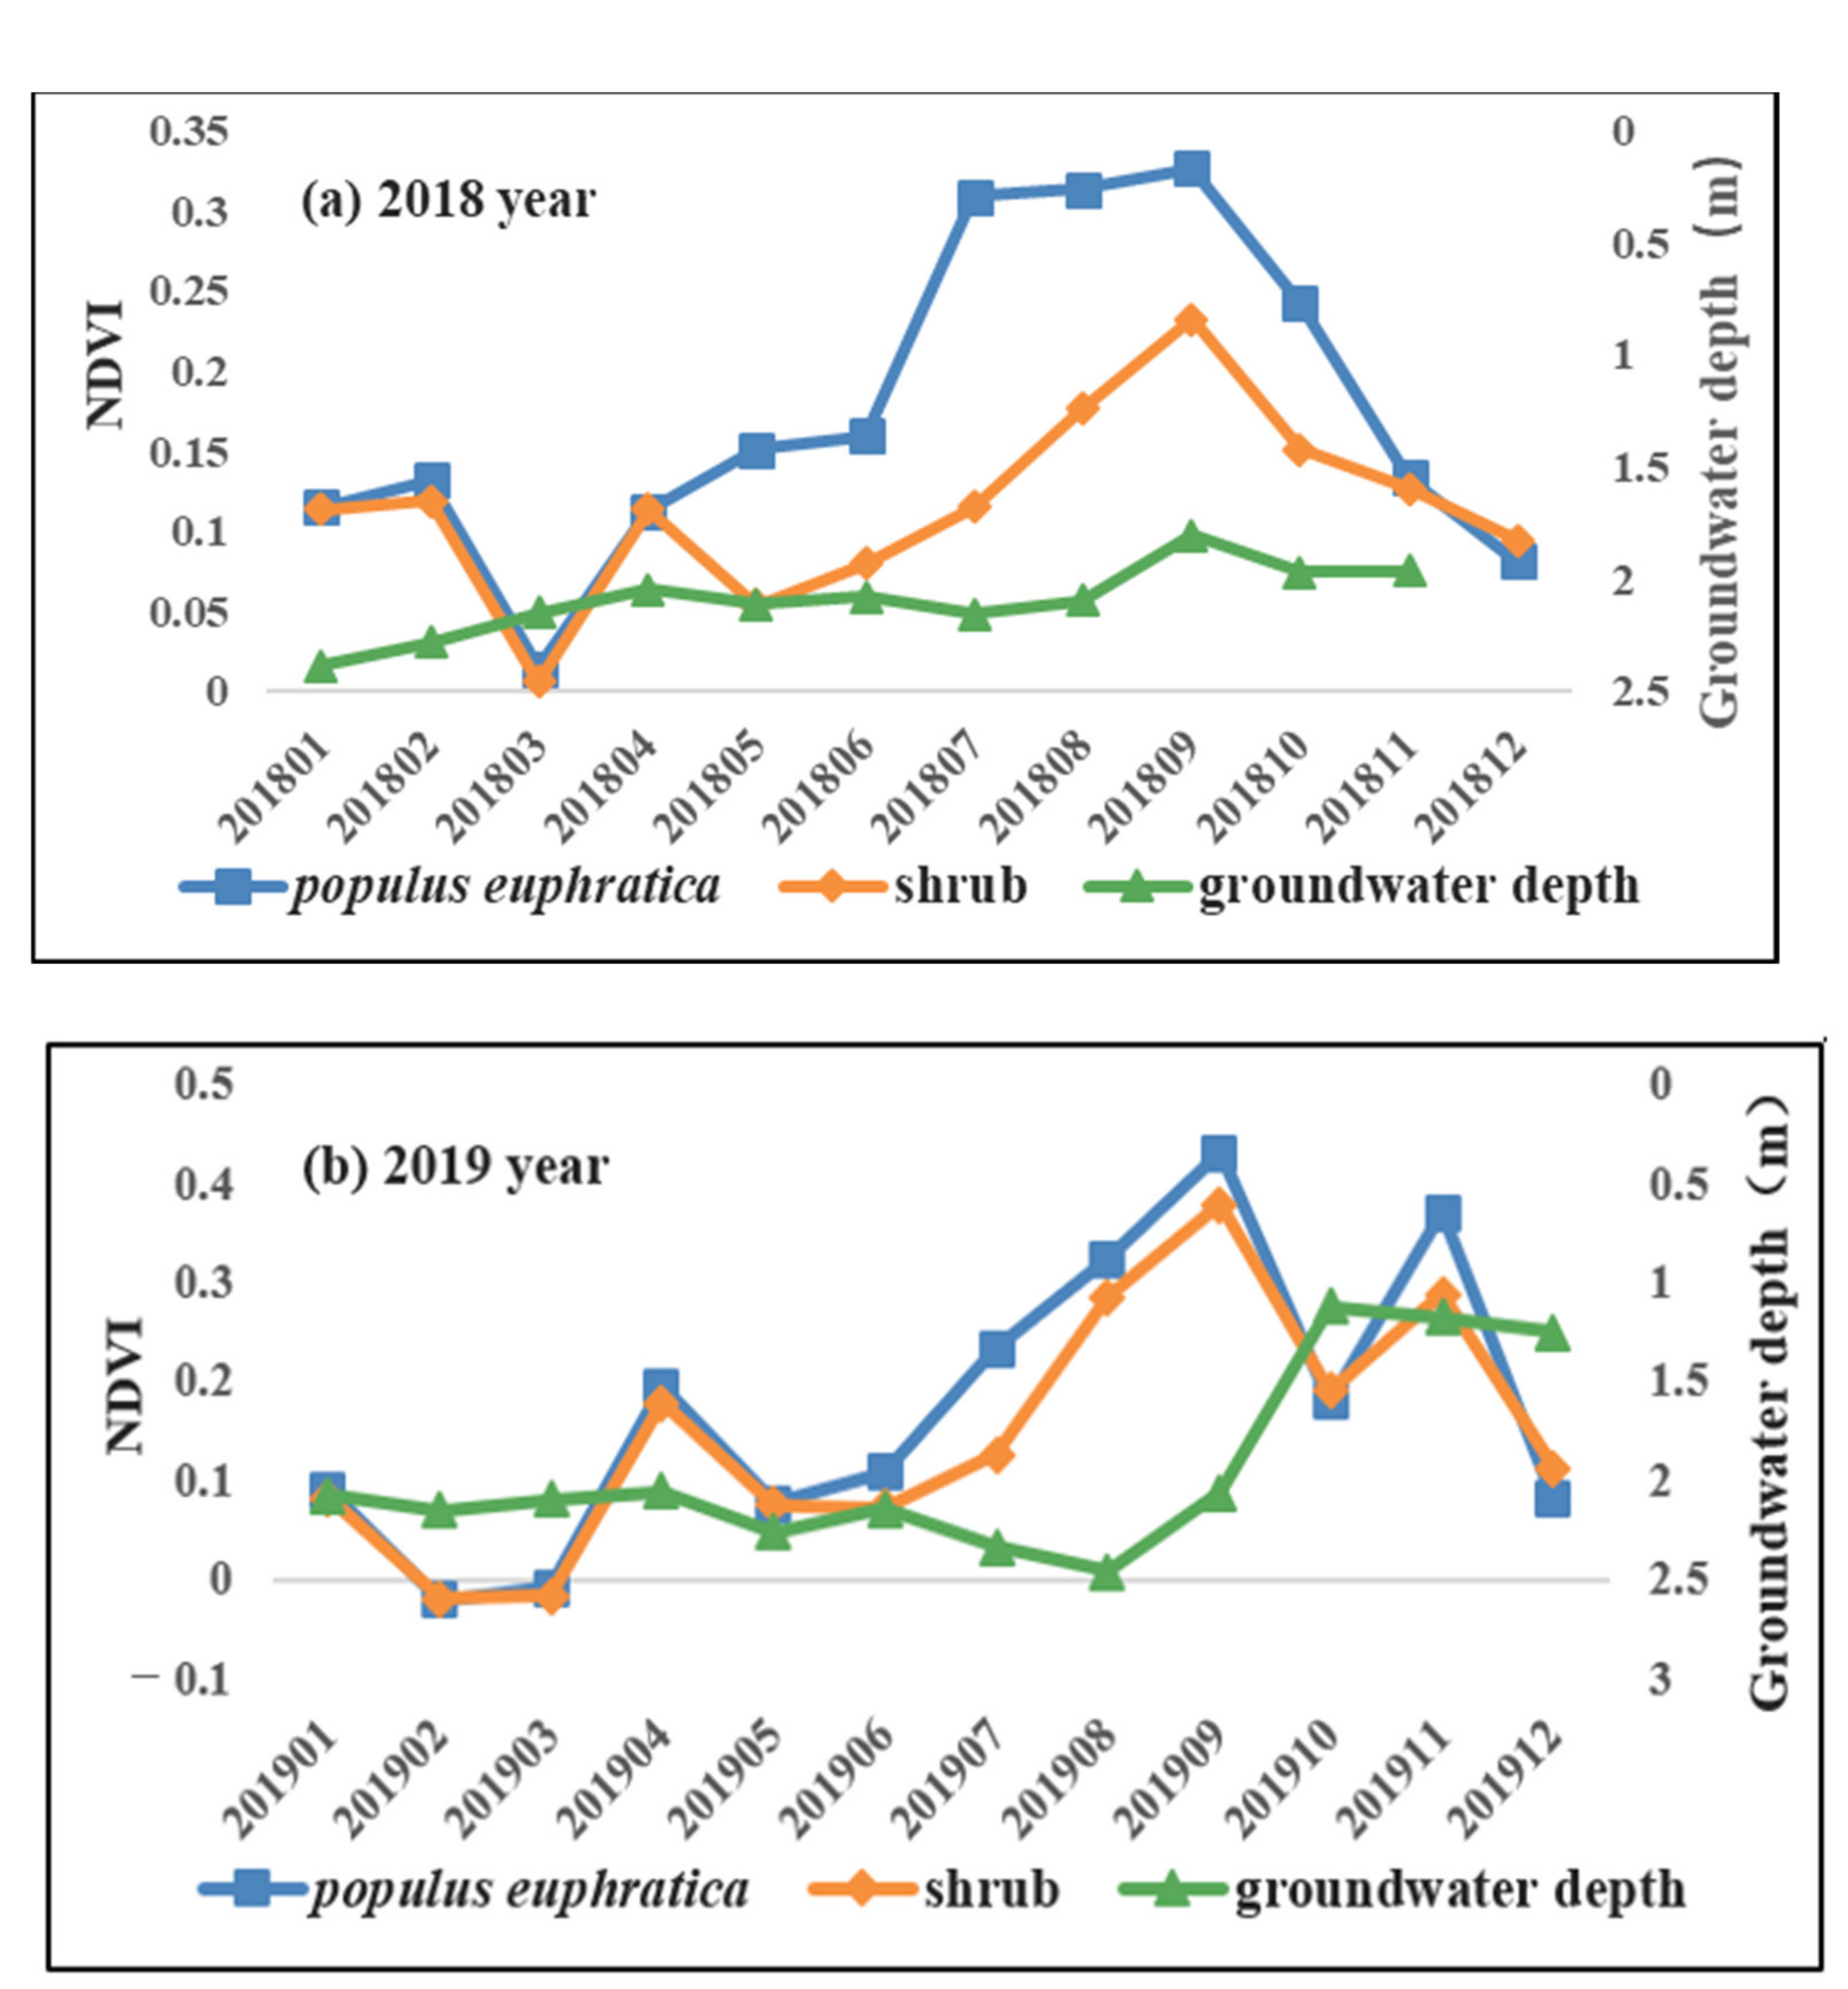
3.4. Response Relationship between Natural Vegetation and Seasonal Variation of Groundwater Level
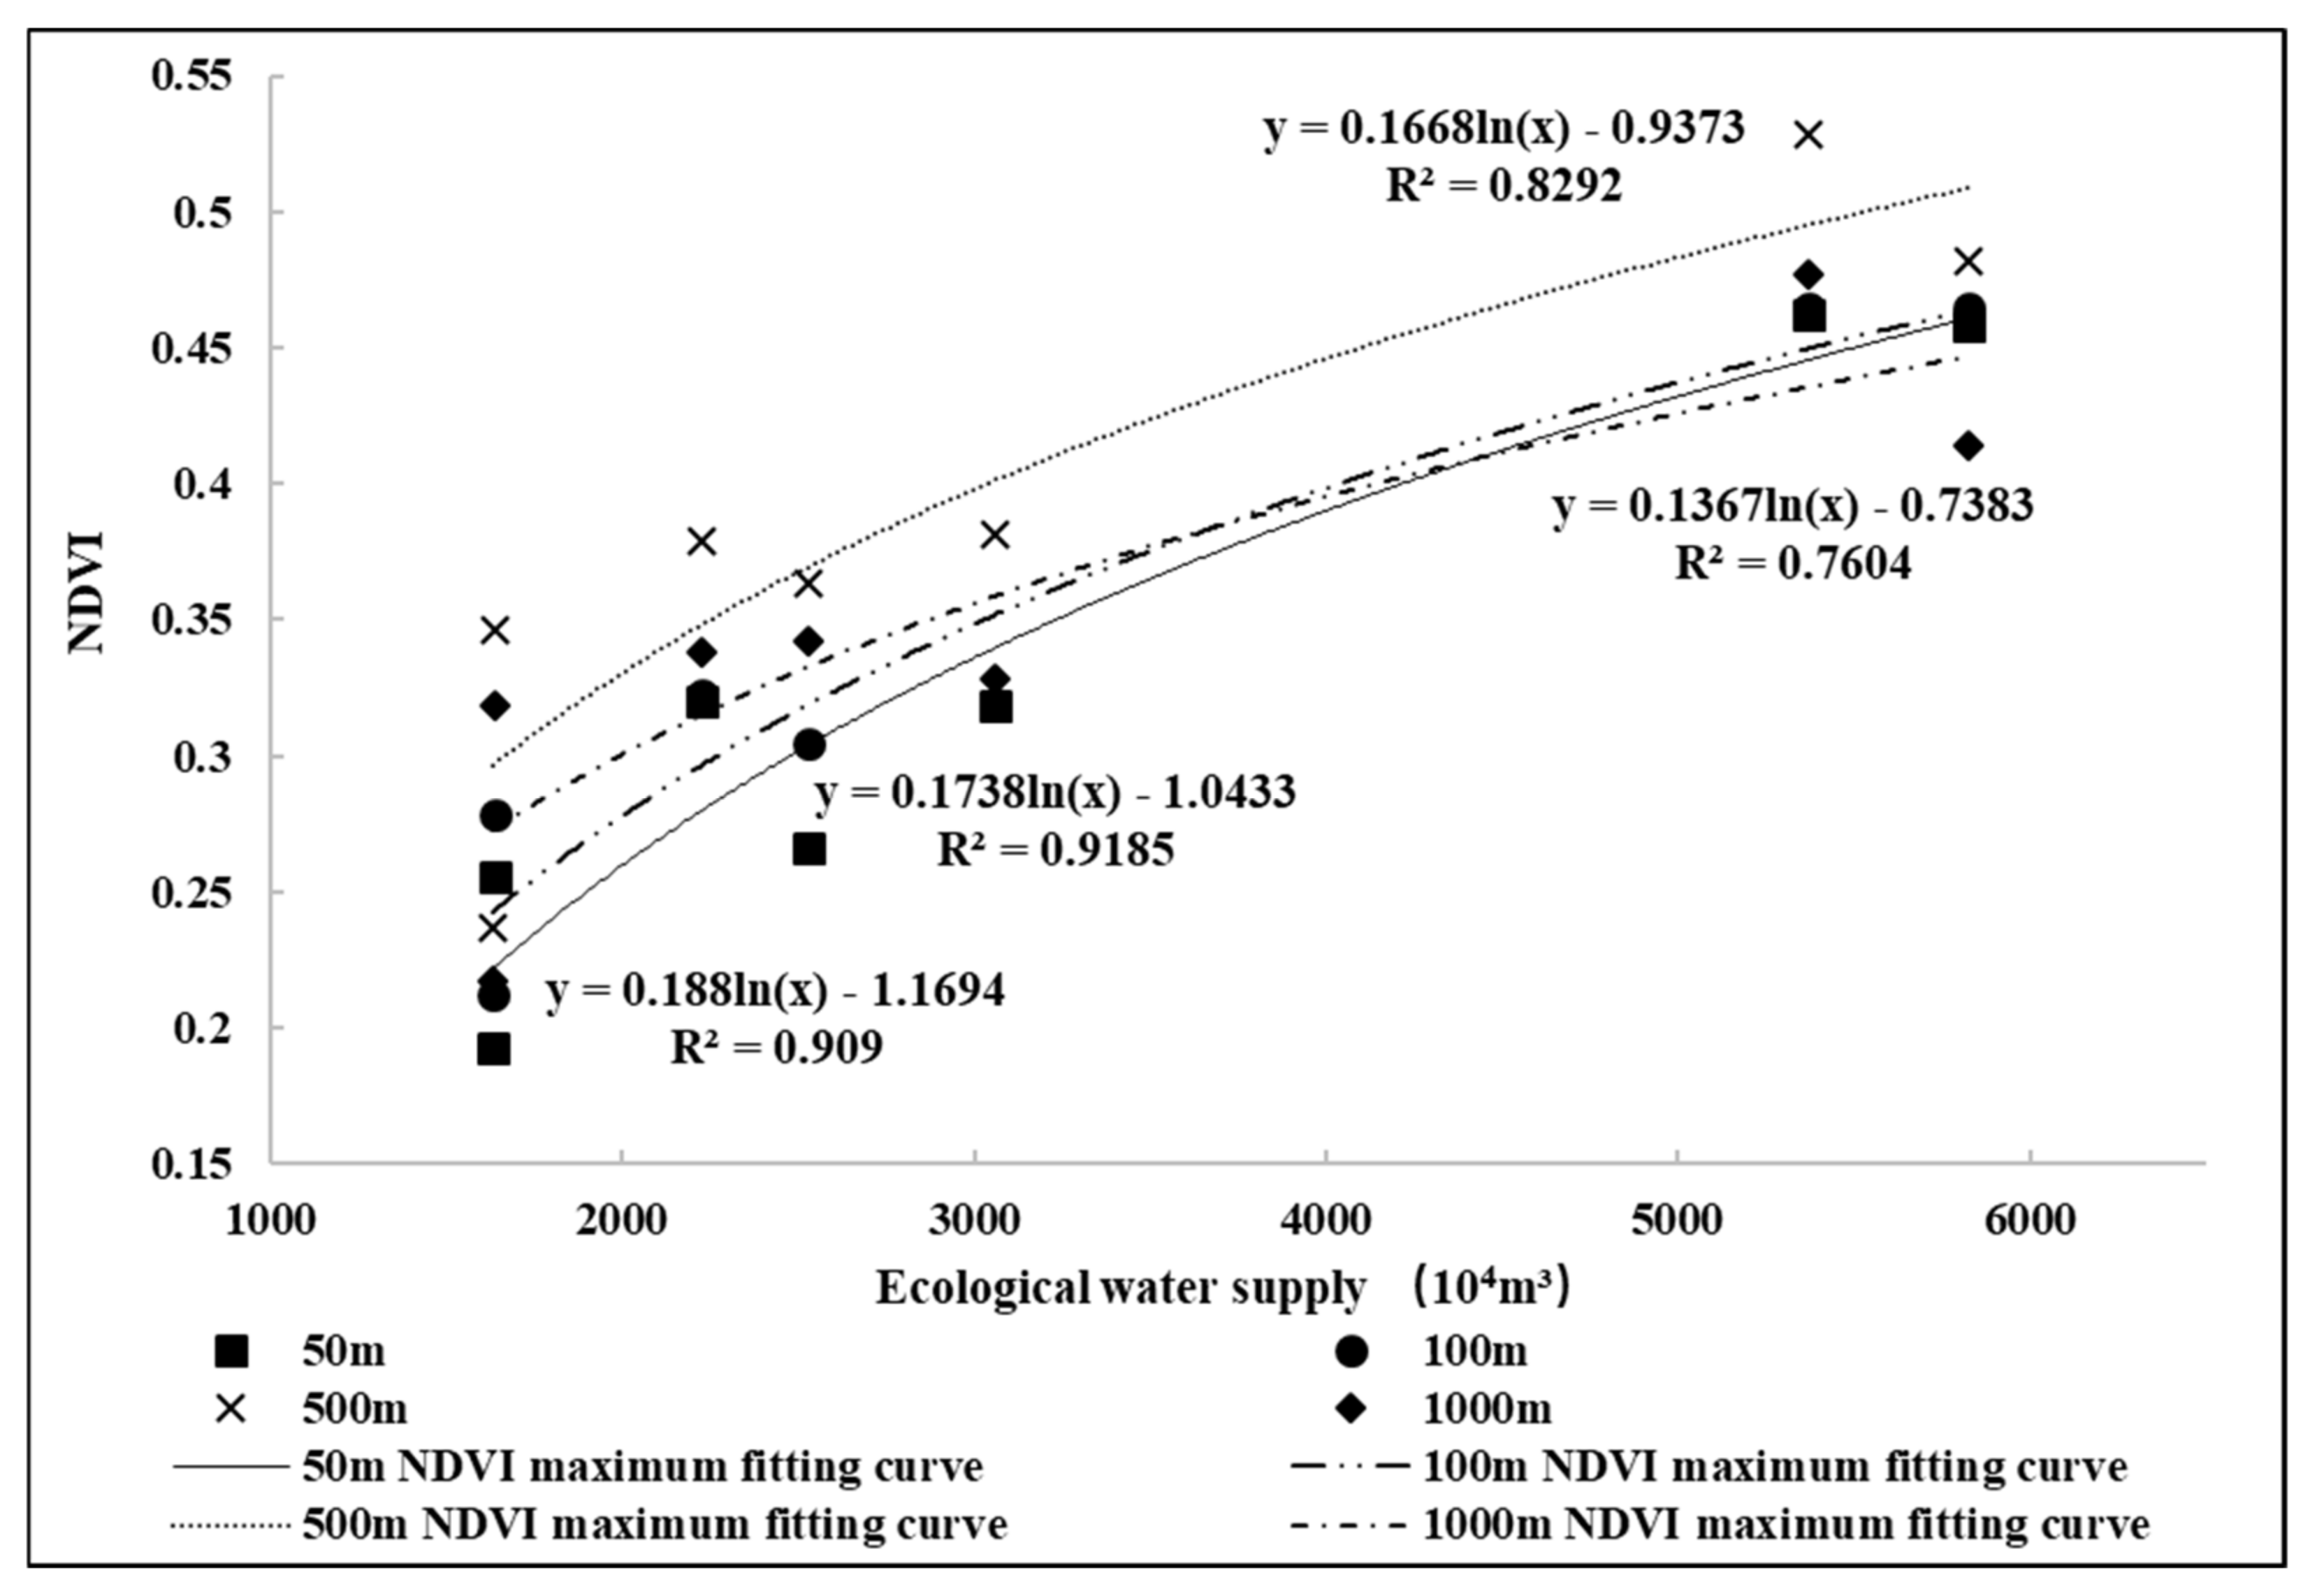
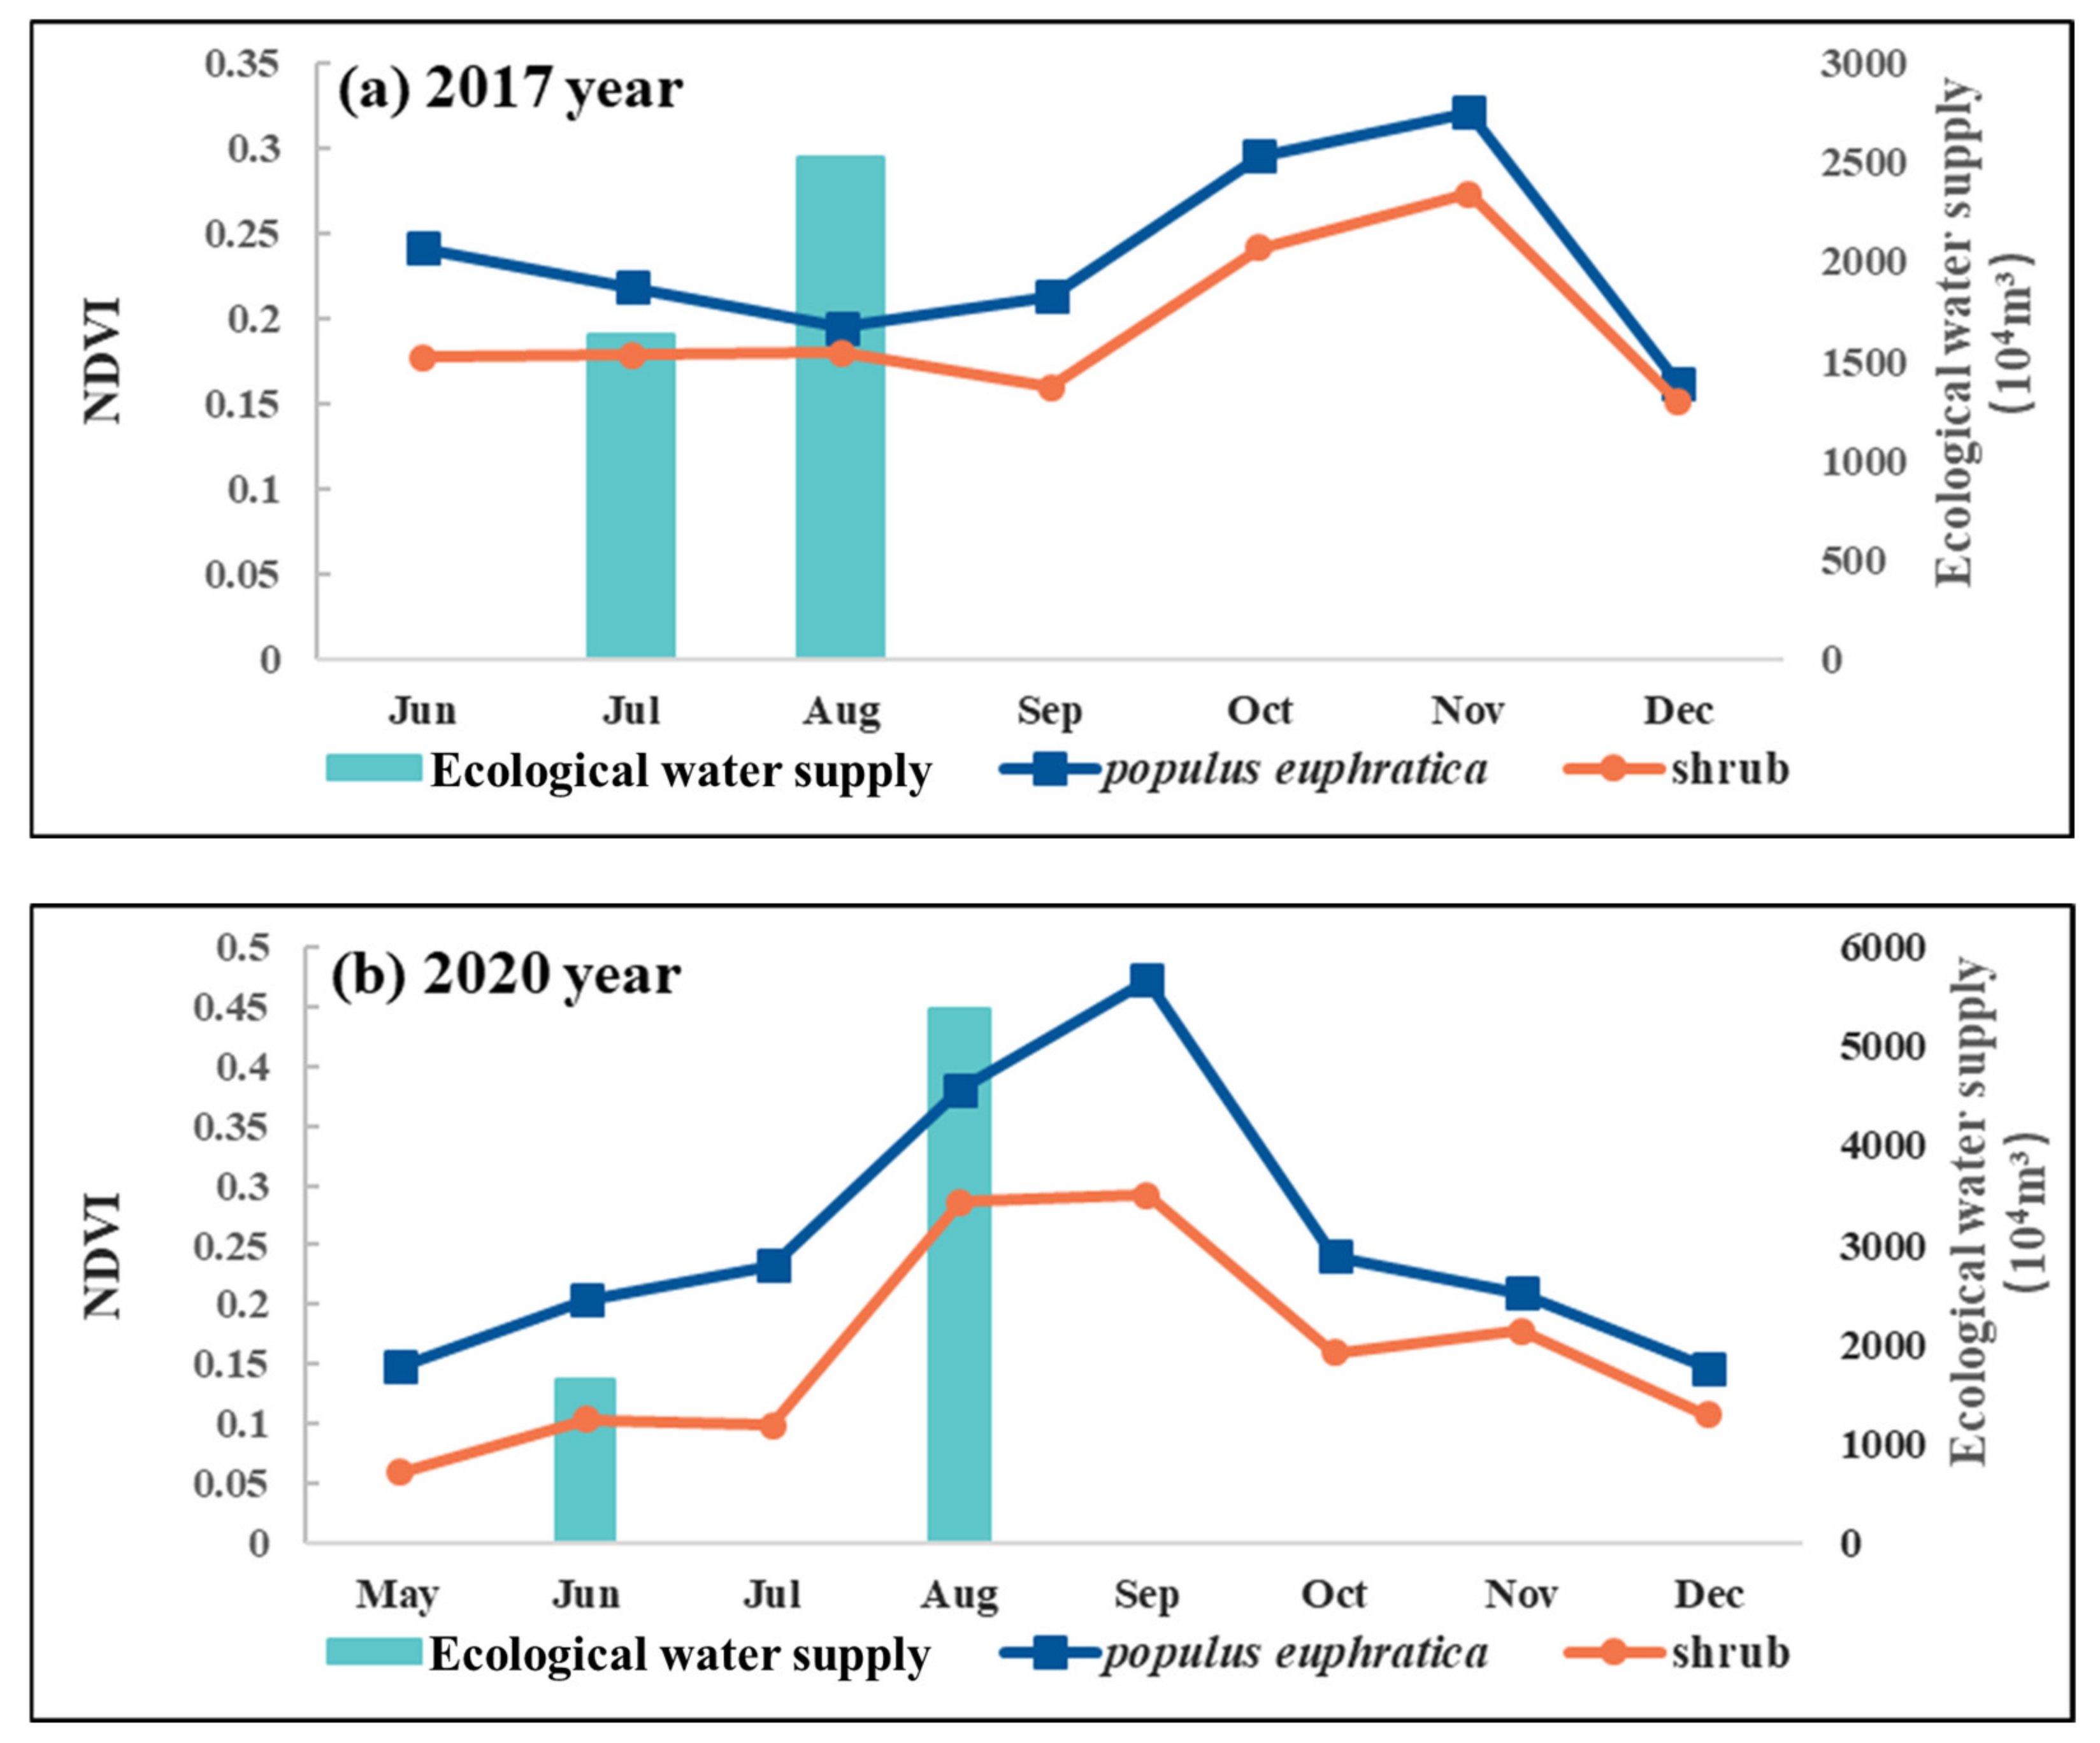
3.5. Response Relationship between Natural Vegetation and Ecological Water Supply
4. Discussion
5. Conclusions
Author Contributions
Funding
Institutional Review Board Statement
Informed Consent Statement
Data Availability Statement
Conflicts of Interest
References
- Wang, Y.C.; Liu, D.L.; Liang, E.H.; Ni, J.R. Structural Characteristics of Endorheic Rivers in the Tarim Basin. Remote Sens. 2022, 14, 4502. [Google Scholar] [CrossRef]
- Zeng, Y.; Zhao, C.Y.; Li, J.; Li, Y.; Lv, G.H.; Liu, T. Effect of groundwater depth on riparian plant diversity along riverside-desert gradients in the Tarim River. J. Plant Ecol. 2019, 12, 564–573. [Google Scholar] [CrossRef]
- Ye, Z.X.; Chen, S.F.; Zhang, Q.F.; Liu, Y.C.; Zhou, H.H. Ecological Water Demand of Taitema Lake in the Lower Reaches of the Tarim River and the Cherchen River. Remote Sens. 2022, 14, 832. [Google Scholar] [CrossRef]
- Geng, W.J.; Jiang, X.H.; Lei, Y.X.; Zhang, J.Y.; Zhao, H. The Allocation of Water Resources in the Midstream of Heihe River for the “97 Water Diversion Scheme” and the “Three Red Lines”. Int. J. Environ. Res. Public Health 2021, 18, 1887. [Google Scholar] [CrossRef] [PubMed]
- Rajanayaka, C.; Weir, J.; Kerr, T.; Rajanayaka, C.; Thomas, J. Sustainable water resource management using surface-groundwater modelling: Motueka-Riwaka Plains, New Zealand. Watershed Ecol. Environ. 2021, 3, 38–56. [Google Scholar] [CrossRef]
- Karandish, F.; Hogeboom, R.J.; Hoekstra, A.Y. Physical versus virtual water transfers to overcome local water shortages: A comparative analysis of impacts. Adv. Water Resour. 2021, 147, 103811. [Google Scholar] [CrossRef]
- Li, J.H.; Lei, X.H.; Qiao, Y.; Kang, A.Q.; Yan, P.R. The Water Status in China and an Adaptive Governance Frame for Water Management. Int. J. Environ. Res. Public Health 2020, 17, 2085. [Google Scholar] [CrossRef]
- Allen, M.R.; Ingram, W.J. Constraints on future changes in climate and the hydrologic cycle. Nature 2002, 419, 228–232. [Google Scholar] [CrossRef]
- Wang, Y.J.; Qin, D.H. Influence of climate change and human activity on water resources in arid region of Northwest China: An overview. Adv. Clim. Chang. Res. 2017, 8, 268–278. [Google Scholar] [CrossRef]
- Tenreiro, T.R.; García-Vila, M.; Gómez, J.A.; Jiménez-Berni, J.A.; Fereres, E. Using NDVI for the assessment of canopy cover in agricultural crops within modelling research. Comput. Electron. Agric. 2021, 182, 106038. [Google Scholar] [CrossRef]
- Gao, J.; Zhuo, L.; Liu, Y.L.; Xie, P.X.; Wang, X.; Li, M.; Gao, X.R.; Wu, P.T. Efficiency and sustainability of inter-provincial crop-related virtual water transfers in China. Adv. Water Resour. 2020, 138, 103560. [Google Scholar] [CrossRef]
- Zhao, L.H. Prediction model of ecological environmental water demand based on big data analysis. Environ. Technol. Innov. 2020, 21, 101196. [Google Scholar] [CrossRef]
- Yu, X.Y.; Zhu, W.B.; Wei, J.X.; Jia, S.F.; Wang, A.D.; Huang, Y.B.; Zhao, Y.J. Estimation of ecological water supplement for typical bird protection in the Yellow River Delta wetland. Ecol. Indic. 2021, 127, 107783. [Google Scholar] [CrossRef]
- Cai, D.L.; Yu, L.J.; Zhu, J.F.; Fraedrich, K.; Guan, Y.N.; Sielmann, F.; Zhang, C.Y.; Yu, M. The Shrinkage of Lake Lop Nur in the Twentieth Century: A Comprehensive Ecohydrological Analysis. J. Hydrometeorol. 2022, 23, 1245–1255. [Google Scholar] [CrossRef]
- Zhu, N.N.; Xu, J.H.; Zeng, G.; Cao, X.Z. Spatiotemporal Response of Hydrological Drought to Meteorological Drought on Multi-Time Scales Concerning Endorheic Basin. Int. J. Environ. Res. Public Health 2021, 18, 9074. [Google Scholar] [CrossRef]
- Yan, H.; Wang, Y.J.; Wang, Y.Q. The influence of 10 years of water conveyances on groundwater and juvenile Populus euphratica of the lower Tarim River. Environ. Earth Sci. 2014, 71, 4091–4096. [Google Scholar] [CrossRef]
- Chen, Y.N.; Chen, Y.P.; Zhu, C.G.; Wang, Y.; Hao, X.M. Ecohydrological effects of water conveyance in a disconnected river in an arid inland river basin. Sci. Rep. 2022, 12, 9982. [Google Scholar] [CrossRef]
- Zhao, X.F.; Xu, H.L.; Zhang, P. Changes of Lake Area, Groundwater Level and Vegetation under the Influence of Ecological Water Conveyance—A Case Study of the Tail Lake of Tarim River in China. Water 2022, 14, 1026. [Google Scholar] [CrossRef]
- Huang, F.; Zhang, D.R.; Chen, X. Vegetation Response to Groundwater Variation in Arid Environments: Visualization of Research Evolution, Synthesis of Response Types, and Estimation of Groundwater Threshold. Int. J. Environ. Res. Public Health 2019, 16, 1849. [Google Scholar] [CrossRef]
- Ye, Z.X.; Chen, Y.N.; Li, W.H.; Yan, Y.; Wan, J.H. Groundwater fluctuations induced by ecological water conveyance in the lower Tarim River, Xinjiang, China. J. Arid. Environ. 2009, 73, 726–732. [Google Scholar] [CrossRef]
- Chunyu, X.Z.; Huang, F.; Xia, Z.Q.; Zhang, D.R.; Chen, X.; Xie, Y.Y. Assessing the Ecological Effects of Water Transport to a Lake in Arid Regions: A Case Study of Qingtu Lake in Shiyang River Basin, Northwest China. Int. J. Environ. Res. Public Health 2019, 16, 145. [Google Scholar] [CrossRef] [PubMed]
- Jiao, A.Y.; Wang, W.Q.; Ling, H.B.; Deng, X.Y.; Yan, J.J.; Chen, F.L. Effect evaluation of ecological water conveyance in Tarim River Basin, China. Front. Environ. Sci. 2022, 10, 1019695. [Google Scholar] [CrossRef]
- Zhang, S.H.; Ye, Z.X.; Chen, Y.N.; Xu, Y.F. Vegetation responses to an ecological water conveyance project in the lower reaches of the Heihe River basin. Ecohydrology 2017, 10, e1866. [Google Scholar] [CrossRef]
- Kumar, P.; Liu, W.; Chu, X.; Zhang, Y.; Li, Z.H. Integrated water resources management for an inland river basin in China. Watershed Ecol. Environ. 2019, 1, 33–38. [Google Scholar] [CrossRef]
- Nie, Y.; Tan, Y.; Deng, Y.Q.; Yu, J. Suitability Evaluation of Typical Drought Index in Soil Moisture Retrieval and Monitoring Based on Optical Images. Remote Sens. 2020, 12, 2587. [Google Scholar] [CrossRef]
- Bai, J.; Bao, A.M.; Chang, C. Spatial-temporal variations of ecological vulnerability in the Tarim River Basin, Northwest China. J. Arid. Land. 2021, 13, 814–834. [Google Scholar] [CrossRef]
- Fu, A.H.; Li, W.H.; Chen, Y.N.; Wang, Y.; Hao, H.C.; Li, Y.P.; Sun, F.; Zhou, H.H.; Zhu, C.G.; Hao, X.M. The effects of ecological rehabilitation projects on the resilience of an extremely drought-prone desert riparian forest ecosystem in the Tarim River Basin, Xinjiang, China. Sci. Rep. 2021, 11, 18485. [Google Scholar] [CrossRef]
- Meng, F.H.; Liu, T.; Huang, Y.; Luo, M.; Bao, A.M.; Hou, D.W. Quantitative Detection and Attribution of Runoff Variations in the Aksu River Basin. Water 2016, 8, 338. [Google Scholar] [CrossRef]
- Yang, P.; Zhang, S.Q.; Xia, J.; Chen, A.N.; Zhang, Y.Y.; Cai, W.; Wang, W.Y.; Wang, H.J.; Luo, X.G.; Chen, X. Risk assessment of water resource shortages in the Aksu River basin of northwest China under climate change. J. Environ. Manag. 2022, 305, 114394. [Google Scholar] [CrossRef]
- Carreño-Conde, F.; Sipols, A.E.; de Blas, C.S.; Mostaza-Colado, D. A Forecast Model Applied to Monitor Crops Dynamics Using Vegetation Indices (NDVI). Appl. Sci. 2021, 11, 1859. [Google Scholar] [CrossRef]
- Zhang, H.; Xue, L.Q.; Wei, G.H.; Dong, Z.C.; Meng, X.Y. Assessing Vegetation Dynamics and Landscape Ecological Risk on the Mainstream of Tarim River, China. Water 2020, 12, 2156. [Google Scholar] [CrossRef]
- Jiang, N.; Zhang, Q.Q.; Zhang, S.C.; Zhao, X.M.; Cheng, H. Spatial and temporal evolutions of vegetation coverage in the Tarim River Basin and their responses to phenology. Catena 2022, 217, 106489. [Google Scholar] [CrossRef]
- Jin, G.; Deng, X.Z.; Zhao, X.D.; Guo, B.S.; Yang, J. Spatiotemporal patterns in urbanization efficiency within the Yangtze River Economic Belt between 2005 and 2014. J. Geogr. Sci. 2018, 28, 1113–1126. [Google Scholar] [CrossRef]
- Zhang, Z.; Jin, G.; Hu, Y.; He, N.; Niu, J. Performance Management of Natural Resources: A Systematic Review and Conceptual Framework for China. Water 2022, 14, 3338. [Google Scholar] [CrossRef]
- Liu, H.; Hu, H.; Liu, X.; Jiang, H.; Liu, W.; Yin, X. A Comparison of Different Water Indices and Band Downscaling Methods for Water Bodies Mapping from Sentinel-2 Imagery at 10-M Resolution. Water 2022, 14, 2696. [Google Scholar] [CrossRef]
- Al-Quraishi, A.M.F.; Gaznayee, H.A.; Crespi, M. Drought trend analysis in a semi-arid area of Iraq based on Normalized Difference Vegetation Index, Normalized Difference Water Index and Standardized Precipitation Index. J. Arid. Land. 2021, 13, 413–430. [Google Scholar] [CrossRef]
- Du, Y.; Zhang, Y.H.; Ling, F.; Wang, Q.M.; Li, W.B.; Li, X.D. Water Bodies’ Mapping from Sentinel-2 Imagery with Modified Normalized Difference Water Index at 10-m Spatial Resolution Produced by Sharpening the SWIR Band. Remote Sens. 2016, 8, 354. [Google Scholar] [CrossRef]
- Deng, Z.T.; Sun, Y.H.; Zhang, K.; Qiu, Q.; Sun, W. An enhanced water index in extracting water bodies from Landsat TM imagery. Ann. GIS 2017, 23, 141–148. [Google Scholar]
- Guo, B.S.; He, D.W.; Zhao, X.D.; Zhang, Z.Y.; Dong, Y. Analysis on the spatiotemporal patterns and driving mechanisms of China’s agricultural production efficiency from 2000 to 2015. Phys. Chem. Earth 2020, 120, 102909. [Google Scholar] [CrossRef]
- Jin, G.; Shi, X.; He, D.W.; Guo, B.S.; Li, Z.H.; Shi, X.B. Designing a spatial pattern to rebalance the orientation of development and protection in Wuhan. J. Geogr. Sci. 2020, 30, 569–582. [Google Scholar] [CrossRef]


| Year/a | 1996 | 2005 | 2010 | 2015 | 2016 | 2017 | 2018 | 2019 | 2020 |
| water surface area/km2 | 61.57 | 25.16 | 22.15 | 22.65 | 22.33 | 24.31 | 27.67 | 34.14 | 27.76 |
| Interval/Yrs | Total Change/Km2 | Annual Change/Km2 | Relative Change/% |
|---|---|---|---|
| 1996–2005 | −36.41 | −4.05 | −6.57 |
| 2005–2010 | −3.01 | −0.60 | −2.40 |
| 2010–2015 | 0.50 | 0.10 | 0.46 |
| 2015–2016 | −0.32 | −0.32 | −1.41 |
| 2016–2017 | 1.98 | 1.98 | 8.85 |
| 2017–2018 | 3.36 | 3.36 | 13.83 |
| 2019–2019 | 6.47 | 6.47 | 23.38 |
| 2019–2020 | −6.38 | −6.38 | −18.69 |
Disclaimer/Publisher’s Note: The statements, opinions and data contained in all publications are solely those of the individual author(s) and contributor(s) and not of MDPI and/or the editor(s). MDPI and/or the editor(s) disclaim responsibility for any injury to people or property resulting from any ideas, methods, instructions or products referred to in the content. |
© 2022 by the authors. Licensee MDPI, Basel, Switzerland. This article is an open access article distributed under the terms and conditions of the Creative Commons Attribution (CC BY) license (https://creativecommons.org/licenses/by/4.0/).
Share and Cite
Nie, Y.; Yin, C.; Wang, P.; He, X.; Cao, J.; Yu, J. Temporal and Spatial Evolution of Eichmann Lake Wetland in Aksu River Basin and Its Response to Ecological Water Supply. Int. J. Environ. Res. Public Health 2023, 20, 351. https://doi.org/10.3390/ijerph20010351
Nie Y, Yin C, Wang P, He X, Cao J, Yu J. Temporal and Spatial Evolution of Eichmann Lake Wetland in Aksu River Basin and Its Response to Ecological Water Supply. International Journal of Environmental Research and Public Health. 2023; 20(1):351. https://doi.org/10.3390/ijerph20010351
Chicago/Turabian StyleNie, Yan, Chen Yin, Pu Wang, Xingying He, Junjun Cao, and Jing Yu. 2023. "Temporal and Spatial Evolution of Eichmann Lake Wetland in Aksu River Basin and Its Response to Ecological Water Supply" International Journal of Environmental Research and Public Health 20, no. 1: 351. https://doi.org/10.3390/ijerph20010351
APA StyleNie, Y., Yin, C., Wang, P., He, X., Cao, J., & Yu, J. (2023). Temporal and Spatial Evolution of Eichmann Lake Wetland in Aksu River Basin and Its Response to Ecological Water Supply. International Journal of Environmental Research and Public Health, 20(1), 351. https://doi.org/10.3390/ijerph20010351