
The Rural Fires of 2017 and Their Influences on Water Quality: An Assessment of Causes and Effects


Abstract
1. Introduction
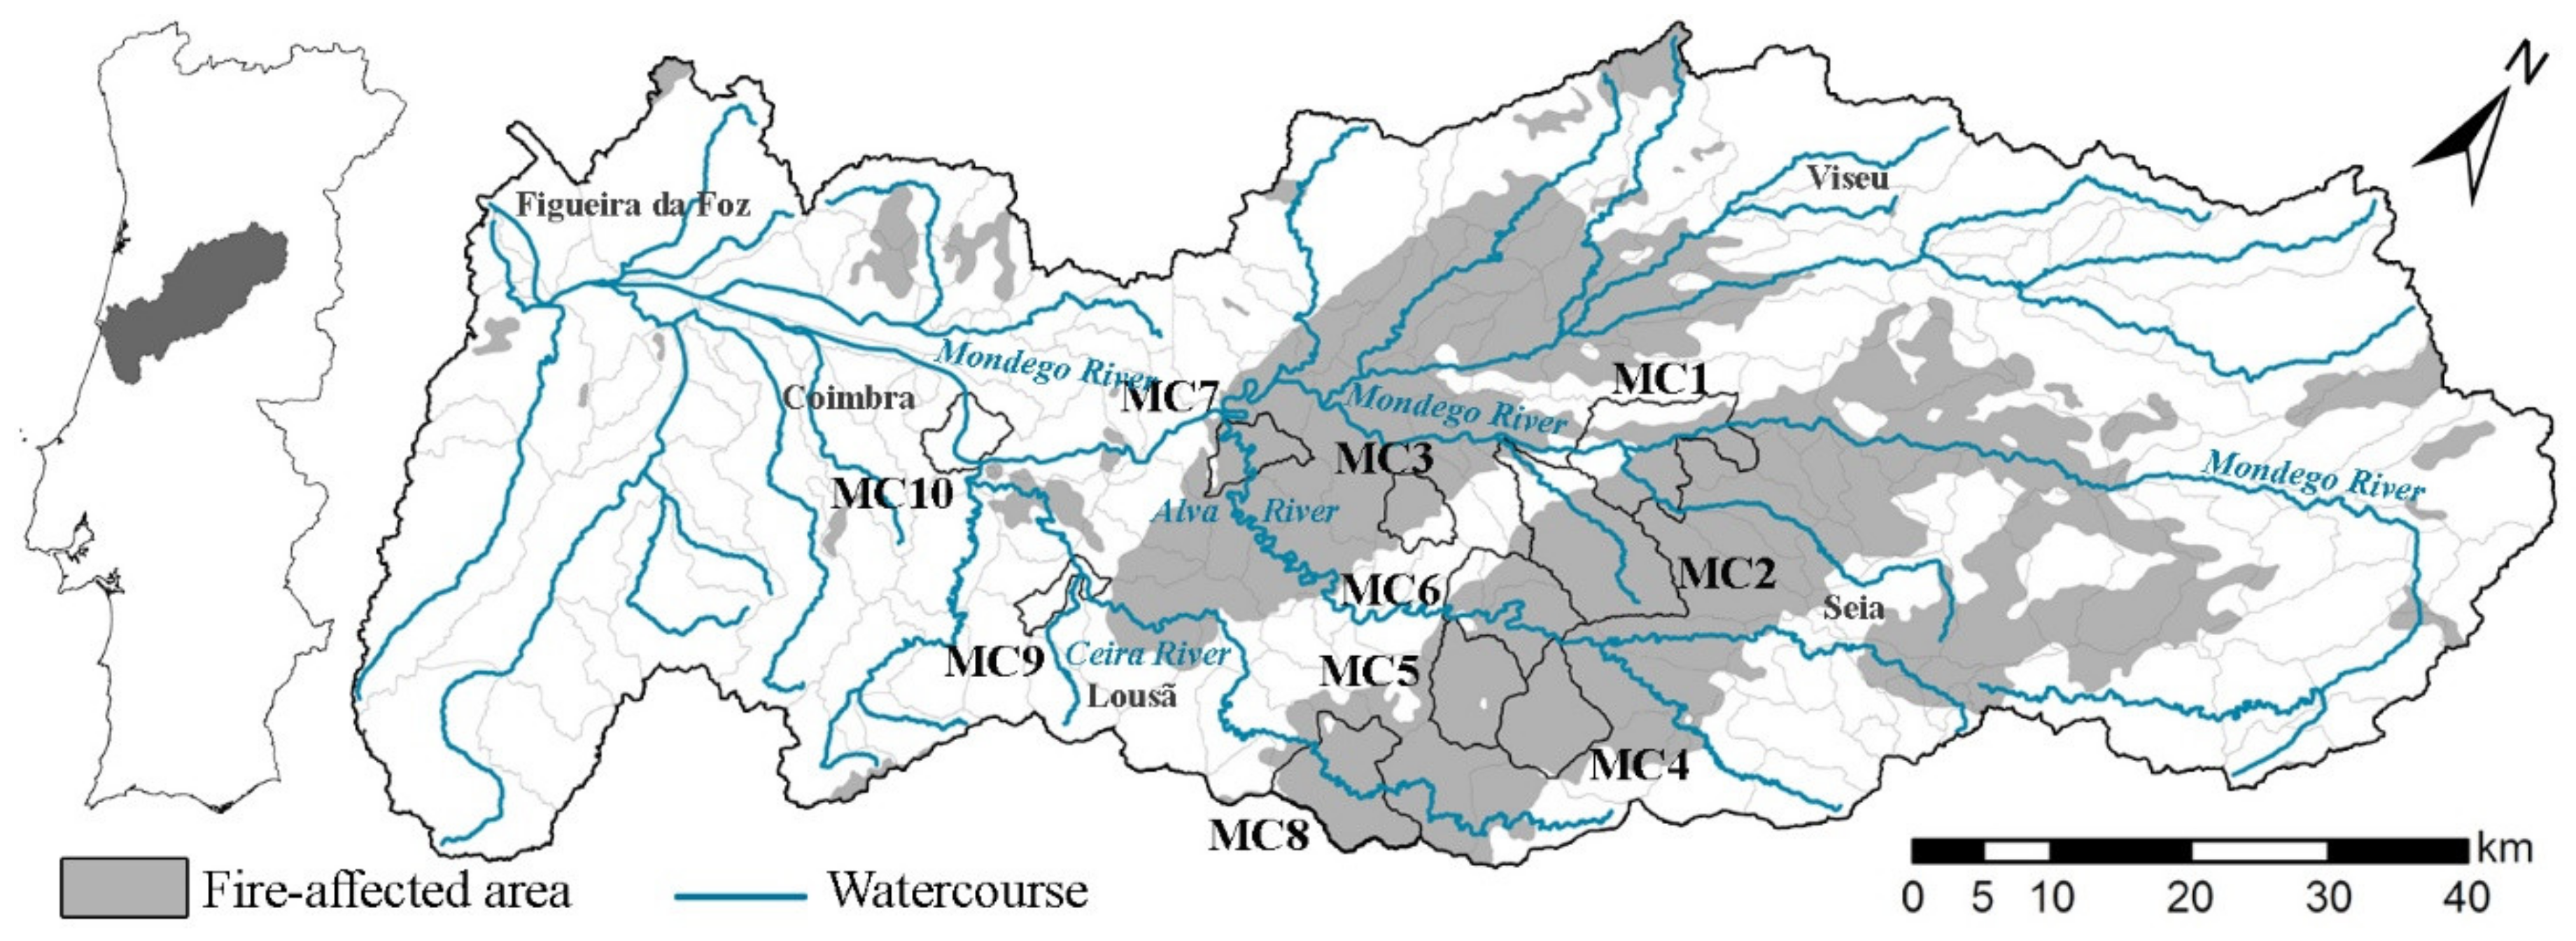
2. Study Area
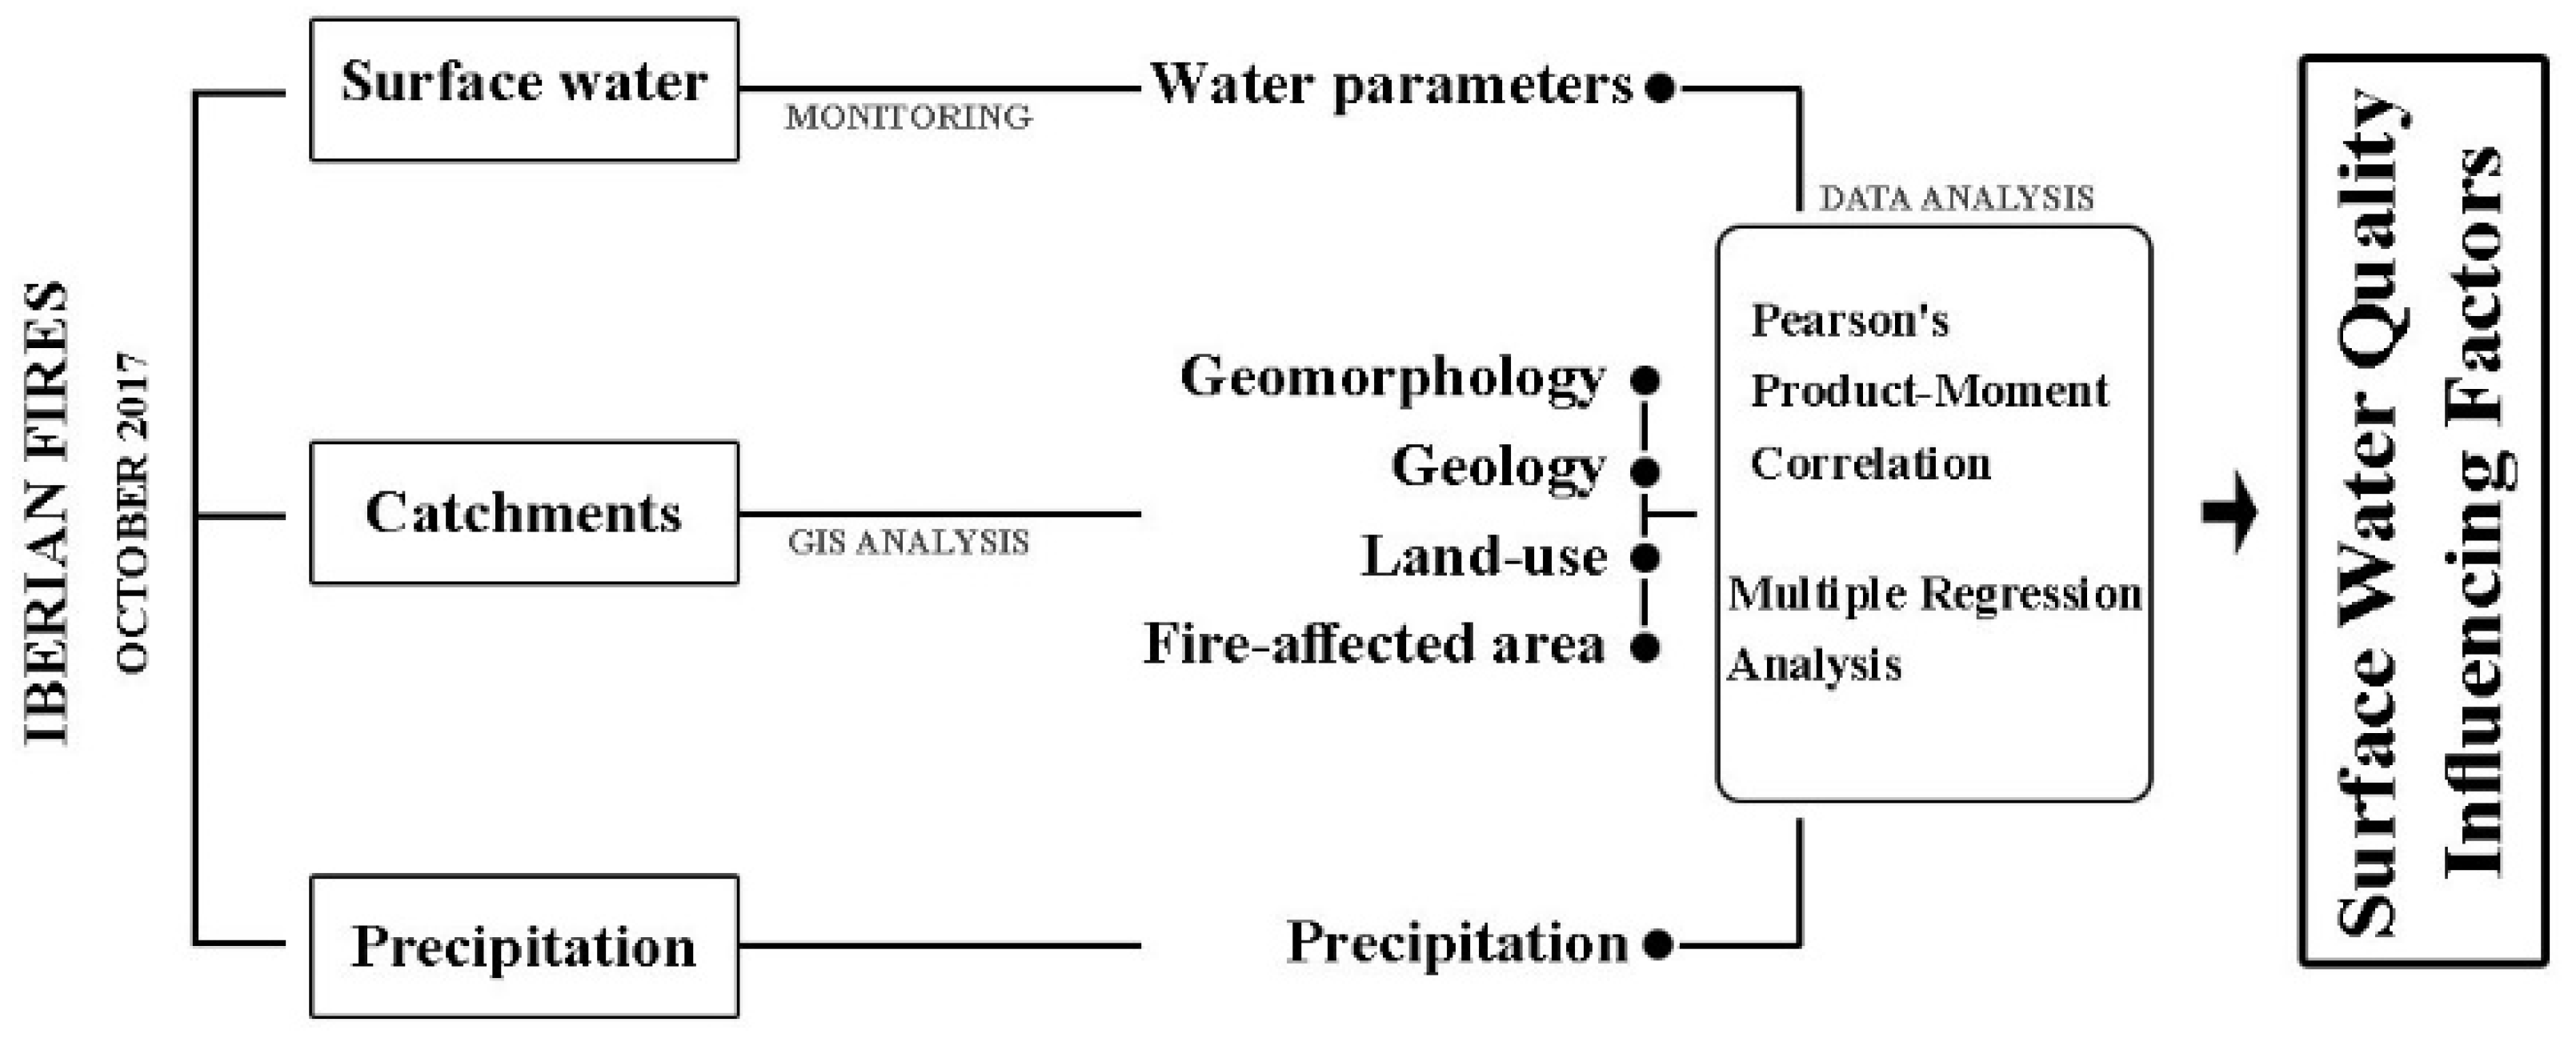
3. Methods
3.1. Measurements of the Catchments Characteristics
3.2. Water Sampling and Analysis
3.3. Statistical Analysis
4. Results
4.1. Pearson Correlation
4.2. Regression Analysis between Possible Influences and Water Parameters
5. Discussion
5.1. Rainfall
5.2. Geology
5.3. Land-Use and Occupation
5.4. Fire
6. Conclusions
Supplementary Materials
Author Contributions
Funding
Institutional Review Board Statement
Informed Consent Statement
Data Availability Statement
Conflicts of Interest
References
- United Nations General Assembly. Transforming our World: The 2030 Agenda for Sustainable Development. Available online: https://www.unfpa.org/resources/transforming-our-world-2030-agenda-sustainable-development (accessed on 24 March 2020).
- Areia, N.P.; Intrigliolo, D.; Tavares, A.; Mendes, J.M.; Sequeira, M.D. The role of media between expert and lay knowledge: A study of Iberian media coverage on climate change. Sci. Total Environ. 2019, 682, 291–300. [Google Scholar] [CrossRef] [PubMed]
- Mirauda, D.; Ostoich, M. Surface water vulnerability assessment applying the integrity model as a decision support system for quality improvement. Environ. Impact Assess. Rev. 2011, 31, 161–171. [Google Scholar] [CrossRef]
- Weatherhead, E.K.; Howden, N.J.K. The relationship between land use and surface water resources in the UK. Land Use Policy 2009, 26, S243–S250. [Google Scholar] [CrossRef]
- Anderson, E.P.; Jackson, S.; Tharme, R.E.; Douglas, M.; Flotemersch, J.E.; Zwarteveen, M.; Lokgariwar, C.; Montoya, M.; Wali, A.; Tipa, G.T.; et al. Understanding rivers and their social relations: A critical step to advance environmental water management. Wiley Interdiscip. Rev. W 2019, 6, e1381. [Google Scholar] [CrossRef] [PubMed]
- Chen, Y.; Feng, Y.; Zhang, F.; Wang, L. Assessing water resources vulnerability by using a rough set cloud model: A case study of the Huai River Basin, China. Entropy 2018, 21, 14. [Google Scholar] [CrossRef] [PubMed]
- Ewane, E.B. Assessing land use and landscape factors as determinants of water quality trends in Nyong River basin, Cameroon. Environ. Monit. Assess. 2020, 192, 1–35. [Google Scholar] [CrossRef]
- Smith, H.G.; Sheridan, G.J.; Lane, P.N.; Nyman, P.; Haydon, S. Wildfire effects on water quality in forest catchments: A review with implications for water supply. J. Hydrol. 2011, 396, 170–192. [Google Scholar] [CrossRef]
- Szewrański, S.; Chruściński, J.; Van Hoof, J.; Kazak, J.K.; Świąder, M.; Tokarczyk-Dorociak, K.; Żmuda, R. A location intelligence system for the assessment of pluvial flooding risk and the identification of storm water pollutant sources from roads in suburbanised areas. Water 2018, 10, 746. [Google Scholar] [CrossRef]
- Johnson, L.; Richards, C.; Host, G.; Arthur, J. Landscape influences on water chemistry in Midwestern stream ecosystems. Freshw. Biol. 1997, 37, 193–208. [Google Scholar] [CrossRef]
- Woli, K.P.; Nagumo, T.; Kuramochi, K.; Hatano, R. Evaluating river water quality through land use analysis and N budget approaches in livestock farming areas. Sci. Total Environ. 2004, 329, 61–74. [Google Scholar] [CrossRef]
- Xiong, F.; Chen, Y.; Zhang, S.; Xu, Y.; Lu, Y.; Qu, X.; Gao, W.; Wu, X.; Xin, W.; Gang, D.D.; et al. Land use, hydrology, and climate influence water quality of China’s largest river. J. Environ. Manag. 2002, 318, 115581. [Google Scholar] [CrossRef] [PubMed]
- Ding, J.; Jiang, Y.; Liu, Q.; Hou, Z.; Liao, J.; Fu, L.; Peng, Q. Influences of the land use pattern on water quality in low-order streams of the Dongjang river basin, China: A multi-scale analysis. Sci. Total Environ. 2016, 551–552, 205–2016. [Google Scholar] [CrossRef] [PubMed]
- Zhang, F.; Chen, Y.; Wang, W.; Jim, C.Y.; Zhang, Z.; Tan, M.L.; Liu, C.; Chan, N.W.; Wang, D.; Wang, Z.; et al. Impact of land-use/land-cover and landscape pattern on seasonal in-stream water quality in small watersheds. J. Clean. Prod. 2022, 357, 131907. [Google Scholar] [CrossRef]
- Yao, S.; Chen, C.; He, M.; Cui, Z.; Mo, K.; Pang, R.; Chen, Q. Land use as an important indicator for water quality prediction in a region under rapid urbanization. Ecol. Indic. 2023, 146, 109768. [Google Scholar] [CrossRef]
- Wang, L.; Han, X.; Zhang, Y.; Zhang, Q.; Wan, X.; Liang, T.; Song, H.; Bolan, N.; Shaheen, S.M.; White, J.R.; et al. Impacts of land uses on spatio-temporal variations of seasonal water quality in a regulated river basin, Huai River, China. Sci. Total Environ. 2023, 857, 159584. [Google Scholar] [CrossRef] [PubMed]
- Haidary, A.; Amiri, B.J.; Adamowski, J.; Fohrer, N.; Nakane, K. Assessing the impacts of four land use types on the water quality of wetlands in Japan. Water Resour. Manag. 2013, 27, 2217–2229. [Google Scholar] [CrossRef]
- Mansilha, C.; Duarte, C.G.; Melo, A.; Ribeiro, J.; Flores, D.; Marques, J.E. Impact of wildfire on water quality in Caramulo Mountain ridge (Central Portugal). Sustain. Water Resour. Manag. 2019, 5, 319–331. [Google Scholar] [CrossRef]
- Ré, A.; Campos, I.; Keizer, J.J.; Gonçalves, F.J.M.; Pereira, J.L.; Abrantes, N. 2021. Effects of post-fire contamination in sediment-dwelling species of riverine systems. Sci. Total Environ. 2021, 771, 144813. [Google Scholar] [CrossRef] [PubMed]
- Moody, J.A.; Shakesby, R.A.; Robichaud, P.R.; Cannon, S.H.; Martin, D.A. Current research issues related to post-wildfire runoff and erosion processes. Earth-Sci. Rev. 2013, 122, 10–37. [Google Scholar] [CrossRef]
- Mast, M.A.; Clow, D.W. Effects of 2003 wildfires on stream chemistry in Glacier National Park, Montan. Hydrol. Process. 2008, 22, 5013–5023. [Google Scholar] [CrossRef]
- Malvar, M.C.; Silva, F.C.; Prats, S.A.; Vieira, D.C.; Coelho, C.O.; Keizer, J.J. Short-term effects of post-fire salvage logging on runoff and soil erosion. For. Ecol. Manag. 2017, 400, 555–567. [Google Scholar] [CrossRef]
- Earl, S.R.; Blinn, D.W. Effects of wildfire ash on water chemistry and biota in South Western U.S.A. stream. Freshw. Biol. 2003, 48, 1015–1030. [Google Scholar] [CrossRef]
- Emmerton, C.A.; Cooke, C.A.; Hustins, S.; Silins, U.; Emelko, M.B.; Lewis, T.; Kruk, M.K.; Taube, N.; Zhu, D.; Jackson, B.; et al. Severe western Canadian wildfire affects water quality even at large basin scales. Water Res. 2020, 183, 116071. [Google Scholar] [CrossRef] [PubMed]
- Lane, P.N.J.; Sheridan, G.J.; Noske, P.J.; Sherwin, C.B. Phosphorus and nitrogen exports from SE Australian forests following wildfire. J. Hydrol. 2008, 361, 186–198. [Google Scholar] [CrossRef]
- Gallaher, B.; Koch, R.; Mullen, K. Quality of Storm Water Runoff at Los Alamos National Laboratory in 2000 with Emphasis on the Impact of the Cerro Grande Fire; Los Alamos National Laboratory: Los Alamos, Mexico, 2002. [Google Scholar]
- Mehaffey, M.H.; Nash, M.S.; Wade, T.G.; Ebert, D.W.; Jones, K.B.; Rager, A. Linking land cover and water quality in New York City’s water supply watersheds. Environ. Monit. Assess. 2005, 107, 29–44. [Google Scholar] [CrossRef] [PubMed]
- Sequeira, M.D.; Castilho, A.M.; Tavares, A.O.; Dinis, P. Assessment of superficial water quality of small catchment basins affected by Portuguese rural fires of 2017. Ecol. Indic. 2020, 111, 105961. [Google Scholar] [CrossRef]
- Sequeira, M.D.; Castilho, A.M.; Dinis, P.A.; Tavares, A.O. Impact Assessment and Geochemical Background Analysis of Surface Water Quality of Catchments Affected by the 2017 Portugal Wildfires. Water 2020, 12, 2742. [Google Scholar] [CrossRef]
- Baker, A. Land use and water quality. In Encyclopedia of Hydrological Sciences; Anderson, M.G., McDonnell, J.J., Eds.; John Wiley & Sons: Hoboken, NJ, USA, 2006; p. 195. [Google Scholar] [CrossRef]
- Dinis, P.A.; Sequeira, M.; Tavares, A.O.; Carvalho, J.; Castilho, A.; Pinto, M.C. Post-wildfire denudation assessed from compositional features of river sediments (Central Portugal). Appl. Clay Sci. 2020, 193, 105675. [Google Scholar] [CrossRef]
- Jarvie, H.P.; Oguchi, T.; Neal, C. Exploring the linkages between river water chemistry and watershed characteristics using GIS-based catchment and locality analyses. Reg. Environ. Change 2002, 3, 36–50. [Google Scholar] [CrossRef]
- Atlas do Ambiente—Carta Hipsométrica Classe Hipsométricas. APA. Available online: https://sniambgeoviewer.apambiente.pt/GeoDocs/shpzips/AtAmb_1015121_CHip_ClHipsometricas_Cont.zip (accessed on 4 June 2020).
- Atlas do Ambiente—Carta de Solos. APA. Available online: https://sniambgeoviewer.apambiente.pt/GeoDocs/shpzips/AtAmb_3001111_CSolos_Cont.zip (accessed on 2 October 2020).
- Corine Land Cover (CLC) 2018, Version 2020_20u1. EEA. Available online: https://land.copernicus.eu/pan-european/corine-land-cover/clc2018?tab=download (accessed on 23 September 2020).
- Tavares, A.; Monteiro, M.; Vargas, M.; Pato, R.; Serra, R. Land use change and forest routing in a rural context: The relevance of the community-based management and planning framework. Appl. Geogr. 2014, 52, 153–171. [Google Scholar] [CrossRef]
- Reimann, C.; Filzmoser, P.; Garrett, R.; Dutter, R. Statistical Data Analysis Explained: Applied Environmental Statistics with R, 1st ed.; John Wiley & Sons: London, UK, 2008. [Google Scholar]
- Giráldez, J.V.; Castro-Orgaz, O.; Gómez, J.A.; Laguna, A.M. Rainfall and erosion/sediment transport. In Rainfall, 1st ed.; Morbidelli, R., Ed.; Elsevier: Amsterdam, The Netherlands, 2022; pp. 397–426. [Google Scholar]
- Huang, G.; Hsu, T.; Yu, C.; Huang, J.; Lin, T. Dilution and precipitation dominated regulation of stream water chemistry of a volcanic watershed. J. Hydrol. 2020, 583, 124564. [Google Scholar] [CrossRef]
- Santos, P.S.M.; Otero, M.; Santos, E.B.H.; Duarte, A.C. Chemical composition of rainwater at a coastal town on the southwest of Europe: What changes in 20 years? Sci. Total Environ. 2011, 409, 3548–3553. [Google Scholar] [CrossRef] [PubMed]
- Reimann, C.; De Caritat, P. Chemical Elements in the Environment: Factsheets for the Geochemist and Environmental Scientist, 1st ed.; Springer Science & Business Media: Berlin, Germany, 1998. [Google Scholar]
- Smith, E.; Smith, J.; Smith, L.; Biswas, T.; Correll, R.; Naidu, R. Arsenic in Australian environment: An overview. J. Environ. Sci. Health 2003, 38, 223–239. [Google Scholar] [CrossRef]
- Xu, G.; Ren, X.; Yang, Z.; Long, H.; Xiao, J. Influence of landscape structures on water quality at multiple temporal and spatial scales: A case study of Wujiang river watershed in Guizhou. Water 2019, 11, 159. [Google Scholar] [CrossRef]
- Wu, J.; Zeng, S.; Yang, L.; Ren, Y.; Xia, J. Spatiotemporal characteristics of the water quality and its Multiscale relationship with land use in the Yangtze River basin. Remote Sens. 2021, 13, 3309. [Google Scholar] [CrossRef]
- Poschenrieder, C.; Llugany, M.; Lombini, A.; Dinelli, E.; Bech, J.; Barceló, J. 2012. Smilax aspera L. an evergreen Mediterranean climber for phytoremediation. J. Geochem. Explor. 2012, 123, 41–44. [Google Scholar] [CrossRef]
- Rhea, A.E.; Covino, T.; Rhoades, C.C.; Brooks, A.C. Use of geostatistical models to evaluate landscape and stream network controls on post-fire stream nitrate concentrations. Hydrol. Processes 2022, 36, e14689. [Google Scholar] [CrossRef]
- Aregai, T.; Neary, D. Water quality impacts of forest fires. J. Pollut. Eff. Cont. 2015, 3, 3. [Google Scholar] [CrossRef]
- Smedley, P.L.; Kinniburgh, D.G. A review of the source, behaviour and distribution of arsenic in natural waters. J. Appl. Geochem. 2002, 17, 517–568. [Google Scholar] [CrossRef]
- Smith, E.; Naidu, R.; Alston, A.M. Arsenic in the soil environment: A review. Adv. Agron. 1998, 64, 149–195. [Google Scholar] [CrossRef]
- Nriagu, J.O.; Pacyna, J.M. Quantitative assessment of worldwide contamination of air, water and soils by trace metals. Nature 1988, 333, 134–139. [Google Scholar] [CrossRef]
- Ferreira, A.J.; Coelho, C.O.; Boulet, A.K.; Lopes, F.P. Temporal patterns of solute loss following wildfires in central Portugal. Int. J. Wildland Fire 2005, 14, 401. [Google Scholar] [CrossRef]
- Pereira, P.; Ubeda, X.; Martin, D.; Mataix-Solera, J.; Cerda, A.; Burguet, M. Wildfire effects on extractable elements in ash from a Pinus pinaster forest in Portugal. Hydrol. Process. 2014, 28, 3681–3690. [Google Scholar] [CrossRef]
- Gabet, E.J.; Bookter, A. Physical, chemical and hydrological properties of Ponderosa pine ash. Int. J. Wildland Fire 2011, 20, 443–452. [Google Scholar] [CrossRef]
- Raoelison, O.D.; Valenca, R.; Lee, A.; Karim, S.; Webster, J.P.; Poulin, B.A.; Mohanty, S.K. Wildfire impacts on surface water quality parameters: Cause of data variability and reporting needs. Environ. Pollut. 2023, 317, 120713. [Google Scholar] [CrossRef] [PubMed]
- World Health Organization. Guidelines for Drinking-Water Quality, 4th ed.; World Health Organization: Geneva, Switzerland, 2017. [Google Scholar]


| Watercourse | Geomorphology | LUO | Fire-Affected LUO | |||||||||||
|---|---|---|---|---|---|---|---|---|---|---|---|---|---|---|
| Ref | AvSlp | SClt | SCrb | Ign | Mtm | Art | Agr | For | Shv | AArt | AAgr | AFor | AShv | |
| MC1 | Mondego | 5.1 | 3.9 | 0.0 | 96.1 | 0.0 | 0.8 | 31.5 | 14.0 | 53.7 | 0.2 | 16.3 | 8.1 | 38.7 |
| MC2 | Cavalos | 4.5 | 9.8 | 0.0 | 87.4 | 2.8 | 3.1 | 45.6 | 34.5 | 16.8 | 3.1 | 40.8 | 29.4 | 10.3 |
| MC3 | Covelos | 4.0 | 27.9 | 0.0 | 11.3 | 60.7 | 0.0 | 30.0 | 52.5 | 17.5 | 0.0 | 15.6 | 35.9 | 16.7 |
| MC4 | Pomares | 18.2 | 0.0 | 0.0 | 0.6 | 99.4 | 0.0 | 11.0 | 25.9 | 63.2 | 0.0 | 11.0 | 25.9 | 62.4 |
| MC5 | Cerdeira | 14.0 | 4.9 | 0.0 | 0.0 | 95.1 | 1.0 | 14.3 | 56.0 | 28.8 | 1.0 | 14.2 | 56.0 | 28.1 |
| MC6 | Alva | 5.8 | 12.7 | 0.0 | 11.5 | 75.8 | 1.1 | 25.6 | 51.3 | 22.0 | 0.3 | 23.2 | 43.1 | 18.6 |
| MC7 | Alva | 4.0 | 1.4 | 0.0 | 6.4 | 92.3 | 0.0 | 21.2 | 40.6 | 38.2 | 0.0 | 21.1 | 38.5 | 35.9 |
| MC8 | Ceira | 17.4 | 0.0 | 0.0 | 1.4 | 98.6 | 0.0 | 1.8 | 40.4 | 57.8 | 0.0 | 1.8 | 38.7 | 57.0 |
| MC9 | Ceira | 3.5 | 66.3 | 0.0 | 0.0 | 33.7 | 3.3 | 17.5 | 12.6 | 66.6 | 0.0 | 0.0 | 0.0 | 0.0 |
| MC10 | Mondego | 3.8 | 68.7 | 25.2 | 0.0 | 6.1 | 65.8 | 19.5 | 7.7 | 7.1 | 0.0 | 0.0 | 0.0 | 0.0 |
| Technique | Precision | Q.L. | D.L. | Standard | |
|---|---|---|---|---|---|
| Br− | IC | 10% | 0.04 | 0.01 | ISO 10304-1 (2007) |
| Cl− | IC | 10% (15% <6.0 mg/L) | 0.2 | 0.08 | ISO 10304-1 (2007) |
| NO3− | IC | 10% (15% <3.0 mg/L) | 1 | 0.1 | ISO 10304-1 (2007) |
| PO43− | MAS | 10% (15% <0.50 mg/L) | 0.2 | 0.1 | SMEWW 4500-P B, E |
| SO42− | IC | 10% (15% <6.0 mg/L) | 2 | 0.8 | ISO 10304-1 (2007) |
| Ca2+ | ICP-OES | 10% | 0.3 | 0.1 | ISO 11885 (2007) |
| K− | ICP-OES | 10% | 0.1 | 0.03 | ISO 11885 (2007) |
| Mg2+ | ICP-OES | 10% | 0.1 | 0.03 | ISO 11885 (2007) |
| Na2+ | ICP-OES | 10% | 0.3 | 0.1 | ISO 11885 (2007) |
| Al | ICP-OES | 10% | 0.01 | 0.002 | ISO 11885 (2007) |
| As | ICP-MS | 10% | 0.001 | 0.0004 | ISO 17294-2 (2016) |
| Ba | ICP-OES | 10% | 0.002 | - | ISO 11885 (2007) |
| Fe | ICP-OES | 5% (10% <20 µg/L) | 0.01 | 0.002 | ISO 11885 (2007) |
| Mn | ICP-OES | 5% (7.5% <20 µg/L) | 0.01 | 0.001 | ISO 11885 (2007) |
| Ni | ICP-MS | 10% | 0.001 | 0.0001 | ISO 17294-2 (2016) |
| Pb | ICP-MS | 10% (15% <10 µg/L) | 0.001 | 0.0001 | ISO 17294-2 (2016) |
| Sr | ICP-OES | 10% | 0.01 | - | ISO 11885 (2007) |
| Zn | ICP-OES | 5% (10% <20 µg/L) | 0.01 | 0.002 | ISO 11885 (2007) |
| Units | N | Min. | Q1 | Mean | Q3 | Max. | |
|---|---|---|---|---|---|---|---|
| EC | (µS/cm) | 89 | 36.9 | 65.1 | 95.4 | 121.8 | 289.0 |
| pH | (-) | 88 | 6.0 | 6.5 | 6.8 | 7.0 | 7.9 |
| DO | (mg/L) | 70 | 2.9 | 6.0 | 7.5 | 9.0 | 12.7 |
| Turb | (NTU) | 75 | 0.3 | 3.2 | 12.3 | 16.3 | 91.3 |
| Alk | (mg/L) | 78 | 2.8 | 6.4 | 11.4 | 13.6 | 32.0 |
| Br− | (mg/L) | 79 | 0.01 | 0.03 | 0.04 | 0.05 | 0.09 |
| Cl− | (mg/L) | 87 | 0.08 | 6.70 | 10.24 | 11.20 | 37.23 |
| HCO32− | (mg/L) | 90 | 3.42 | 8.14 | 16.78 | 20.42 | 57.29 |
| NO3− | (mg/L) | 79 | 0.15 | 1.85 | 3.35 | 4.60 | 10.50 |
| PO43− | (mg/L) | 67 | 0.05 | 0.05 | 0.05 | 0.05 | 0.05 |
| SO42− | (mg/L) | 78 | 2.10 | 4.23 | 6.58 | 8.00 | 19.00 |
| Ca2+ | (mg/L) | 88 | 0.97 | 2.05 | 3.53 | 4.35 | 12.00 |
| K− | (mg/L) | 85 | 0.25 | 0.67 | 1.19 | 1.40 | 4.00 |
| Mg2+ | (mg/L) | 89 | 0.78 | 1.70 | 2.44 | 3.00 | 5.60 |
| Na2+ | (mg/L) | 87 | 3.80 | 6.05 | 8.64 | 9.80 | 24.00 |
| Al | (µg/L) | 88 | 1.00 | 13.00 | 27.32 | 35.33 | 107.00 |
| As | (µg/L) | 83 | 0.20 | 0.69 | 1.60 | 1.70 | 6.61 |
| Ba | (µg/L) | 90 | 0.53 | 1.97 | 4.24 | 5.87 | 15.00 |
| Fe | (µg/L) | 88 | 1.00 | 27.64 | 62.70 | 85.58 | 215.80 |
| Mn | (µg/L) | 87 | 0.50 | 2.96 | 12.95 | 17.23 | 54.00 |
| Ni | (µg/L) | 87 | 0.05 | 0.05 | 0.37 | 0.50 | 1.90 |
| Pb | (µg/L) | 88 | 0.05 | 0.05 | 0.84 | 1.28 | 3.40 |
| Sr | (µg/L) | 89 | 5.00 | 14.65 | 20.84 | 25.75 | 50.00 |
| Zn | (µg/L) | 67 | 1.00 | 1.00 | 6.84 | 9.81 | 34.00 |
| EC | pH | DO | Turb | Alk | Br− | Cl− | HCO32− | NO3− | PO43− | SO42− | Ca2+ | |
|---|---|---|---|---|---|---|---|---|---|---|---|---|
| P | −0.12 | −0.10 | −0.07 | 0.17 | −0.03 | −0.19 | −0.09 | −0.12 | −0.08 | c | −0.22 | −0.14 |
| P5 | 0.19 | −0.18 | −0.27 a | 0.16 | 0.27 a | −0.09 | −0.01 | 0.15 | 0.01 | c | −0.04 | 0.11 |
| P10 | −0.09 | −0.33 b | 0.20 | 0.39 b | −0.05 | −0.05 | −0.15 | −0.14 | 0.31 b | c | −0.18 | 0.03 |
| AvSlp | −0.42 b | −0.19 | 0.08 | −0.09 | −0.21 | −0.15 | −0.43 b | −0.21 a | −0.17 | c | −0.31 b | −0.46 b |
| SClt | 0.27 a | 0.32 b | −0.01 | 0.08 | 0.48 b | 0.09 | 0.12 | 0.32 b | 0.08 | c | 0.26 a | 0.49 b |
| SCrb | 0.14 | 0.29 b | 0.04 | 0.15 | 0.46 b | −0.04 | −0.02 | 0.36 b | 0.04 | c | 0.20 | 0.45 b |
| Ign | 0.43 b | 0.04 | −0.09 | 0.00 | 0.01 | 0.04 | 0.46 b | 0.17 | 0.40 b | c | 0.33 b | 0.35 b |
| Mtm | −0.58 b | −0.29 b | 0.08 | −0.08 | −0.40 b | −0.09 | −0.47 b | −0.42 b | −0.41 b | c | −0.49 b | −0.70 b |
| Art | 0.17 | 0.30 b | 0.04 | 0.15 | 0.48 b | −0.04 | −0.01 | 0.37 b | 0.07 | c | 0.22 | 0.48 b |
| Agr | 0.60 b | 0.03 | −0.07 | −0.07 | 0.16 | 0.30 b | 0.64 b | 0.21 a | 0.46 b | c | 0.46 b | 0.46 b |
| For | −0.14 | −0.39 b | 0.07 | −0.15 | −0.27 a | 0.28 a | 0.00 | −0.27 a | −0.14 | c | −0.13 | −0.46 b |
| Shv | −0.38 b | 0.03 | −0.05 | 0.01 | −0.30 b | −0.35 b | −0.33 b | −0.25 a | −0.20 | c | −0.36 b | −0.32 b |
| AArt | 0.44 b | −0.07 | 0.21 | −0.09 | 0.12 | 0.17 | 0.17 | 0.22 a | 0.63 b | c | 0.42 b | 0.35 b |
| AAgri | 0.25 a | −0.02 | 0.39 b | 0.01 | −0.06 | 0.08 | 0.11 | 0.08 | 0.47 b | c | 0.23 a | 0.12 |
| AFor | −0.17 | −0.17 | 0.46 b | 0.06 | −0.22 | 0.10 | −0.19 | −0.16 | 0.09 | c | −0.08 | −0.35 b |
| AShv | −0.33 b | 0.05 | 0.38 b | 0.14 | −0.27 a | −0.18 | −0.30 b | −0.15 | −0.01 | c | −0.22 | −0.38 b |
| K− | Mg2+ | Na2+ | Al | As | Ba | Fe | Mn | Ni | Pb | Sr | Zn | |
| P | −0.06 | −0.18 | −0.19 | 0.45 b | −0.07 | −0.18 | 0.14 | −0.06 | 0.16 | −0.03 | −0.17 | 0.15 |
| P5 | 0.10 | 0.00 | −0.05 | 0.10 | −0.07 | 0.06 | 0.16 | 0.09 | 0.04 | −0.28 b | 0.11 | 0.09 |
| P10 | 0.00 | −0.11 | −0.15 | 0.47 b | 0.07 | −0.16 | −0.02 | 0.16 | 0.12 | −0.10 | −0.10 | −0.06 |
| AvSlp | −0.45 b | −0.26 a | −0.36 b | −0.11 | −0.28 b | −0.52 b | −0.32 b | −0.35 b | −0.07 | −0.07 | −0.35 b | −0.13 |
| ClstS | 0.14 | 0.37 b | 0.09 | −0.01 | −0.08 | 0.49 b | 0.08 | 0.19 | 0.08 | −0.07 | 0.34 b | 0.05 |
| CarbS | 0.12 | 0.18 | −0.01 | 0.02 | 0.02 | 0.36 b | 0.00 | 0.37 b | 0.03 | −0.02 | 0.26 a | −0.01 |
| Ign | 0.62 b | −0.03 | 0.51 b | 0.10 | 0.83 b | 0.20 | 0.28 b | 0.28 b | −0.02 | 0.09 | 0.35 b | −0.01 |
| Mtm | −0.63 b | −0.24 a | −0.50 b | −0.08 | −0.62 b | −0.55 b | −0.30 b | −0.43 b | −0.04 | −0.03 | −0.58 b | −0.03 |
| Art | 0.14 | 0.19 | 0.00 | 0.01 | 0.04 | 0.38 b | 0.02 | 0.38 b | 0.02 | −0.02 | 0.28 b | −0.01 |
| Agr | 0.70 b | 0.25 a | 0.63 b | 0.12 | 0.67 b | 0.46 b | 0.23 a | 0.30 b | 0.02 | 0.03 | 0.50 b | 0.09 |
| For | −0.19 | 0.05 | −0.03 | −0.08 | −0.27 a | −0.21 | −0.24 a | −0.26 a | 0.02 | −0.03 | −0.22 a | −0.02 |
| Shv | −0.34 b | −0.36 b | −0.31 b | −0.02 | −0.15 | −0.45 b | 0.05 | −0.30 b | −0.05 | 0.03 | −0.37 b | −0.03 |
| AArt | 0.50 b | 0.24 a | 0.40 b | −0.02 | 0.53 b | 0.26 a | 0.06 | 0.26 a | −0.05 | −0.10 | 0.44 b | 0.03 |
| AAgri | 0.32 b | 0.03 | 0.26 a | 0.19 | 0.43 b | 0.14 | 0.03 | 0.20 | −0.05 | −0.07 | 0.18 | 0.07 |
| AFor | −0.23 a | −0.06 | −0.14 | 0.09 | −0.18 | −0.21 a | −0.26 a | −0.13 | −0.06 | −0.13 | −0.21 | −0.02 |
| AShv | −0.28 b | −0.35 b | −0.27 a | 0.15 | −0.06 | −0.39 b | −0.15 | −0.13 | −0.05 | −0.06 | −0.32 b | −0.10 |
| DV | Regression | R | R2 | p |
|---|---|---|---|---|
| EC | EC = 40.296 + 15.005 AArt + 1.85 Agr + 0.536 SClt | 0.683 | 0.467 | 0.000 |
| pH | pH = 7.269 − 0.01 For − 0.003 P10 | 0.527 | 0.278 | 0.000 |
| DO | DO = 6.938 − 0.054 P5 + 0.052 AFor | 0.544 | 0.296 | 0.000 |
| Turb | Turb = 7.158 + 0.119 P10 | 0.388 | 0.151 | 0.001 |
| Alk | Alk = 11.590 + 0.294 SCrb + 0.123 P5 − 0.041 Mtm | 0.584 | 0.341 | 0.000 |
| Br− | Br− = 0.023 + 0.000415 Agr + 0.000267 For | 0.411 | 0.169 | 0.001 |
| Cl− | Cl− = 2.925 + 0.349 Agr | 0.642 | 0.412 | 0.000 |
| HCO32− | HCO32− = 21.124 + 0.329 SCrb − 0.092 Mtm | 0.463 | 0.215 | 0.000 |
| NO3− | NO3− = 3.329 + 1.499 AArt − 0.014 Mtm + 0.008 P10 | 0.704 | 0.495 | 0.000 |
| SO42− | SO42− = 8.145 + 1.339 AArt − 0.035 Mtm | 0.575 | 0.331 | 0.000 |
| Ca2+ | Ca2+ = 1.612 + 0.87 AArt + 0.089 SCrb + 0.046 SClt + 0.027 Ign | 0.764 | 0.584 | 0.000 |
| K− | K− = 0.968 +0.295 AArt + 0.028 Agr − 0.007 Mtm | 0.775 | 0.601 | 0.000 |
| Mg2+ | Mg2+ = 2.433 + 0.316 AArt + 0.016 SClt − 0.011 Shv | 0.524 | 0.274 | 0.000 |
| Na2+ | Na2+ = 3.841+ 0.229 Agr | 0.626 | 0.392 | 0.000 |
| Al | Al = 18.652 + 1.749 P + 0.135 P10 | 0.568 | 0.323 | 0.000 |
| As | As = 1.446 + 0.724 AArt + 0.034 Ign − 0.016 For | 0.877 | 0.769 | 0.000 |
| Ba | Ba = 6.804 − 0.046 Shv + 0.032 SClt − 0.027 Mtm | 0.667 | 0.445 | 0.000 |
| Fe | Fe = 123.876 − 3.995 AvSlp − 1.934 Agr + 0.633 Ign | 0.430 | 0.185 | 0.001 |
| Mn | Mn = 18.687 + 0.466 SCrb − 0.115 Mtm | 0.485 | 0.235 | 0.000 |
| Pb | Pb = 1.05 − 0.019 P5 | 0.275 | 0.076 | 0.009 |
| Sr | Sr = 22.439 + 4.21 AArt − 0.079 Mtm + 0.078 SClt | 0.666 | 0.443 | 0.000 |
Disclaimer/Publisher’s Note: The statements, opinions and data contained in all publications are solely those of the individual author(s) and contributor(s) and not of MDPI and/or the editor(s). MDPI and/or the editor(s) disclaim responsibility for any injury to people or property resulting from any ideas, methods, instructions or products referred to in the content. |
© 2022 by the authors. Licensee MDPI, Basel, Switzerland. This article is an open access article distributed under the terms and conditions of the Creative Commons Attribution (CC BY) license (https://creativecommons.org/licenses/by/4.0/).
Share and Cite
Sequeira, M.D.; Castilho, A.; Tavares, A.O.; Dinis, P. The Rural Fires of 2017 and Their Influences on Water Quality: An Assessment of Causes and Effects. Int. J. Environ. Res. Public Health 2023, 20, 32. https://doi.org/10.3390/ijerph20010032
Sequeira MD, Castilho A, Tavares AO, Dinis P. The Rural Fires of 2017 and Their Influences on Water Quality: An Assessment of Causes and Effects. International Journal of Environmental Research and Public Health. 2023; 20(1):32. https://doi.org/10.3390/ijerph20010032
Chicago/Turabian StyleSequeira, Mário David, Ana Castilho, Alexandre Oliveira Tavares, and Pedro Dinis. 2023. "The Rural Fires of 2017 and Their Influences on Water Quality: An Assessment of Causes and Effects" International Journal of Environmental Research and Public Health 20, no. 1: 32. https://doi.org/10.3390/ijerph20010032
APA StyleSequeira, M. D., Castilho, A., Tavares, A. O., & Dinis, P. (2023). The Rural Fires of 2017 and Their Influences on Water Quality: An Assessment of Causes and Effects. International Journal of Environmental Research and Public Health, 20(1), 32. https://doi.org/10.3390/ijerph20010032