
Data to Decisions: Methods to Create Neighbourhood Built Environment Indicators Relevant for Early Childhood Development

 ,
,  ,
,  and
and 
Abstract
:1. Introduction
2. Materials and Methods
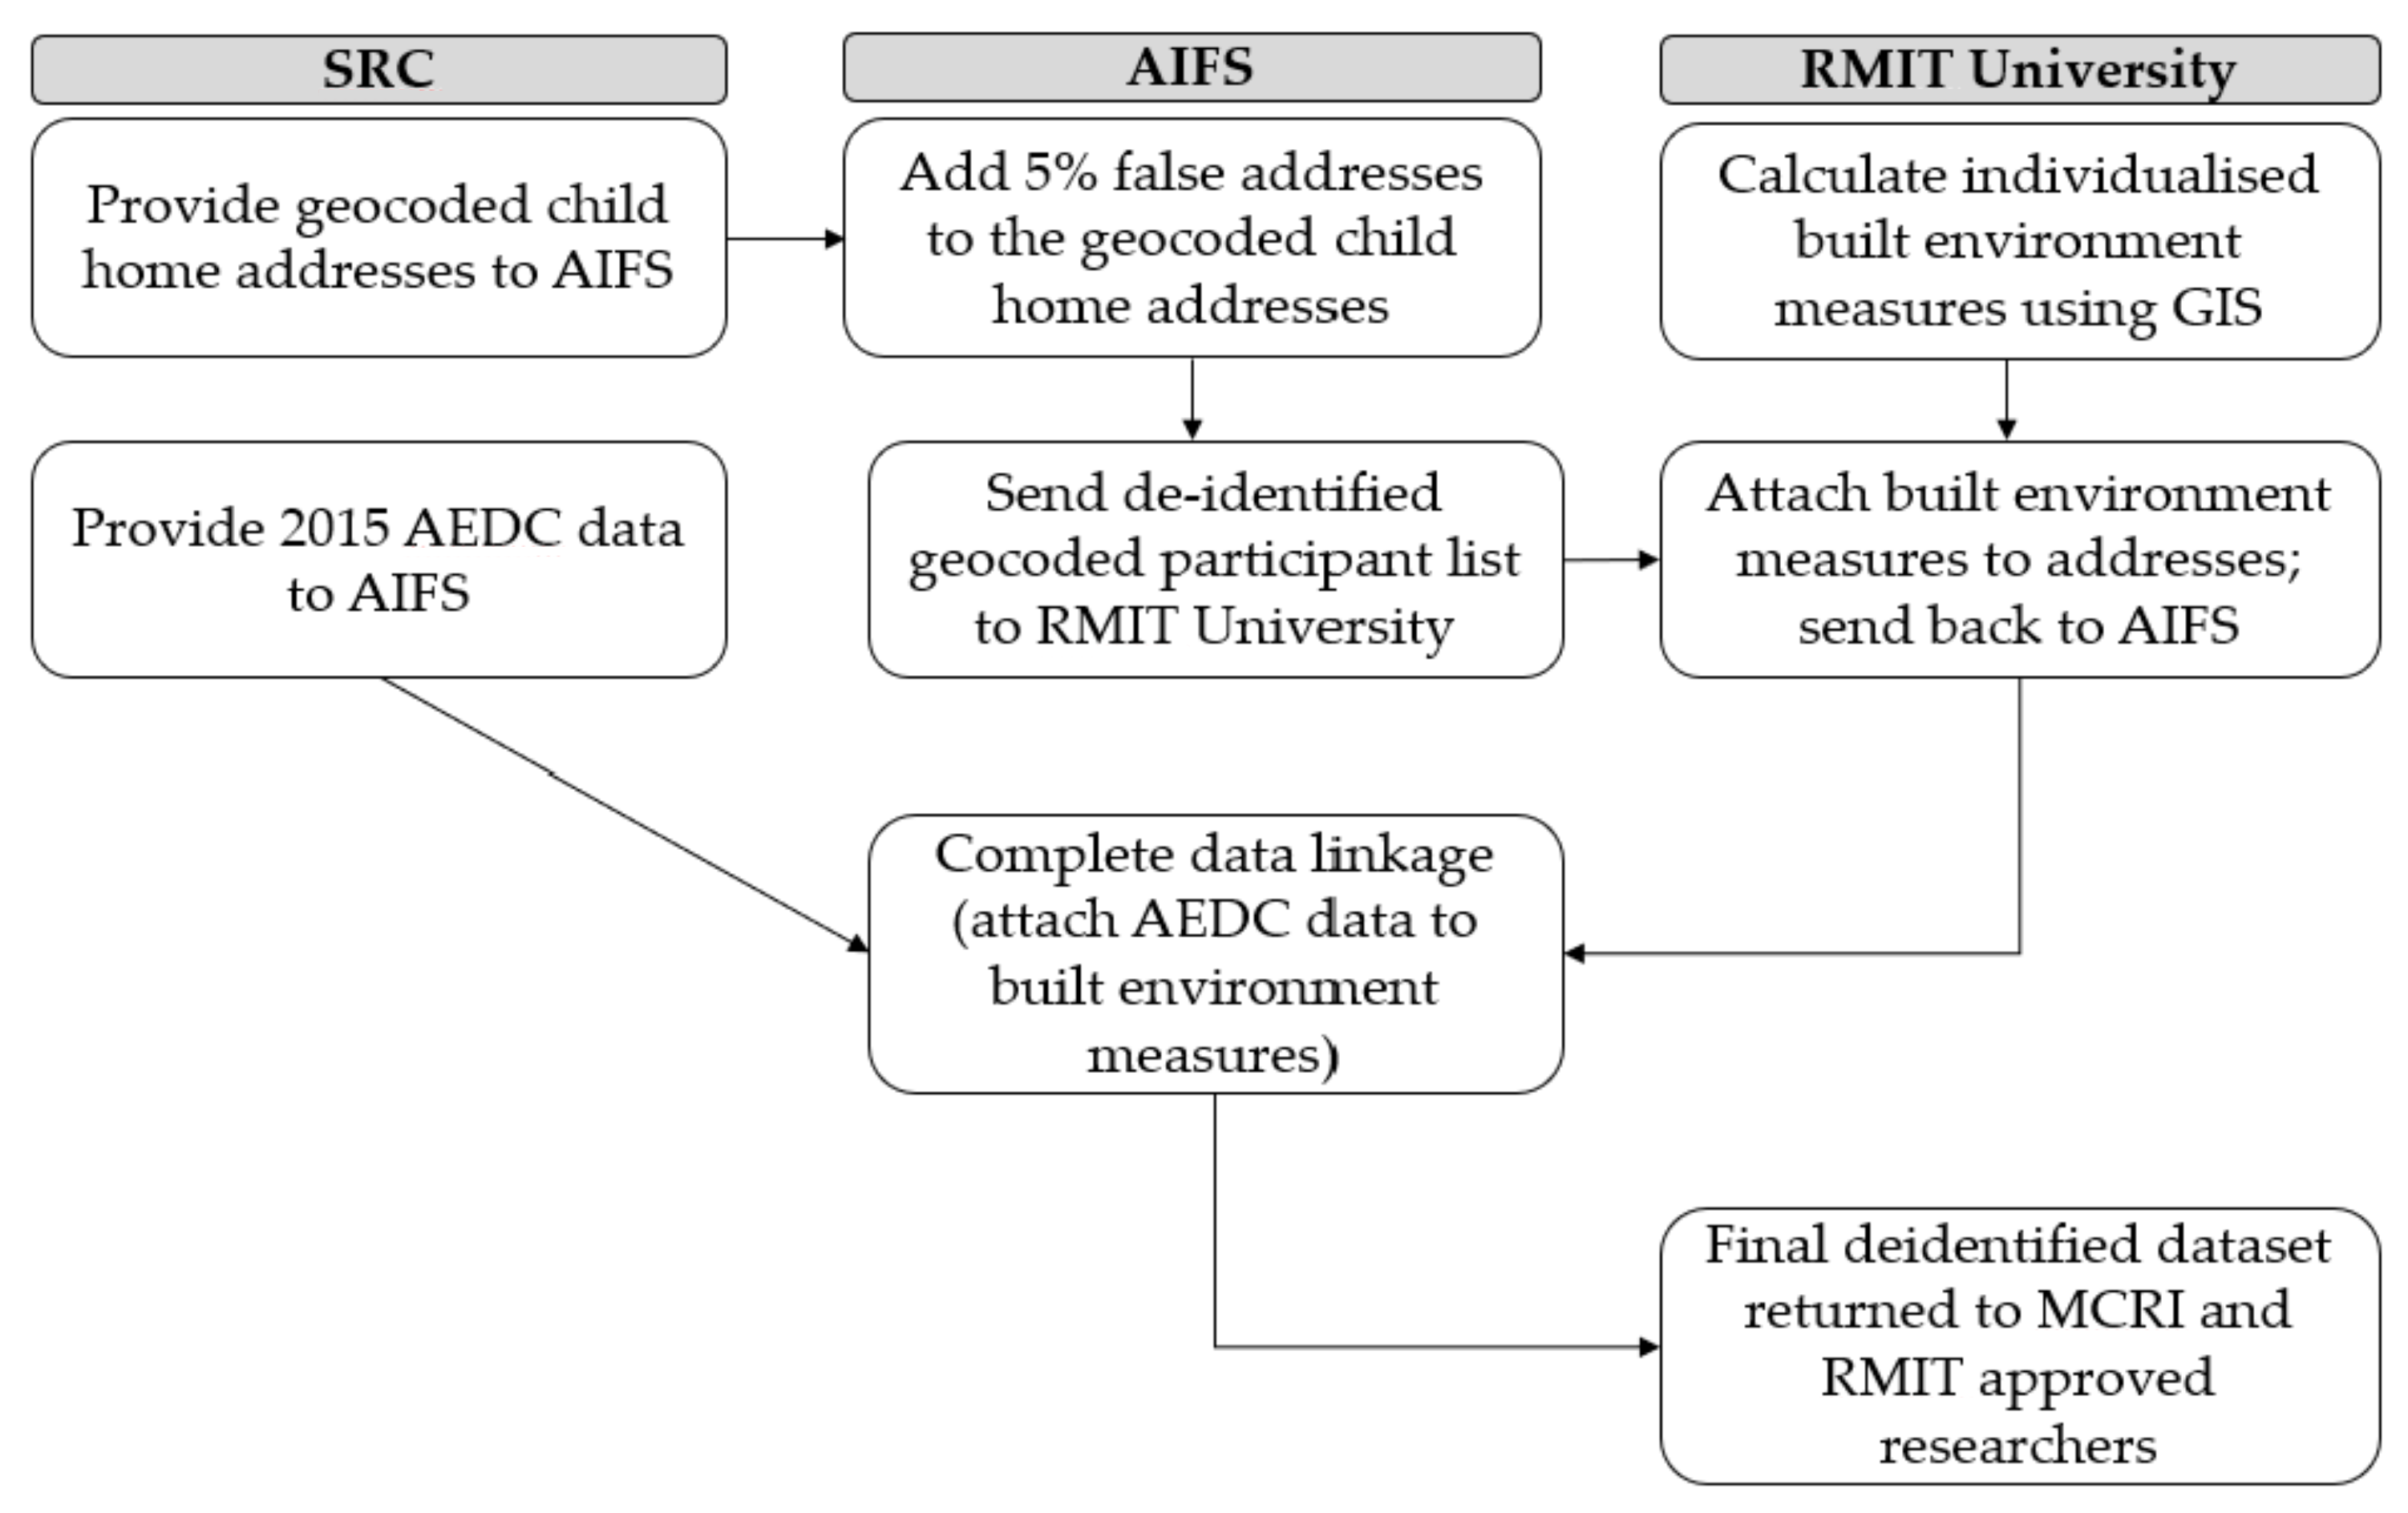
2.1. Data Linkage Process
2.2. Early Childhood Development Data and Measures
- (1)
- Physical health and wellbeing refers to children’s physical readiness for the school day, physical independence, and fine motor skills.
- (2)
- Social competence refers to children’s overall social competence, responsibility and respect, approach to learning, and readiness to explore new things.
- (3)
- Emotional maturity refers to children’s pro-social and helping behaviours, and absence of anxious and fearful behaviour, aggressive behaviour, and hyperactivity and inattention.
- (4)
- Language and cognitive skills (school-based) refers to children’s basic literacy, and interest in literacy, numeracy and memory, advanced literacy, and basic numeracy.
- (5)
- Communication skills and general knowledge refers to children’s communication skills and general knowledge based on broad developmental competencies and skills.
2.3. Built Environment Data and Measures
3. Results
4. Discussion
4.1. Strengths and Potential of AEDC-BE to Address Key Gaps in Neighbourhood Effects and ECD Research
4.2. Challenges and Limitations
5. Conclusions
Supplementary Materials
Author Contributions
Funding
Institutional Review Board Statement
Informed Consent Statement
Data Availability Statement
Acknowledgments
Conflicts of Interest
References
- Human Early Learning Partnership & Commission on Social Determinants of Health. Early Child Development: A Powerful Equalizer: Final Report for the World Health Organization’s Commission on the Social Determinants of Health; Siddiqi, A., Lori, G.I., Hertzman, C., Eds.; Human Early Learning Partnership: Vancouver, BC, Canada, 2007. [Google Scholar]
- Shonkoff, J.; Richter, L.; van der Gaag, J.; Bhutta, Z. An Integrated Scientific Framework for Child Survival and Early Childhood Development. Pediatrics 2012, 129, e460–e472. [Google Scholar] [CrossRef] [PubMed]
- Brinkman, S.A.; Gregory, T.A.; Goldfeld, S.; Lynch, J.W.; Hardy, M. Data Resource Profile: The Australian Early Development Index (AEDI). Int. J. Epidemiol. 2014, 43, 1089–1096. [Google Scholar] [CrossRef] [PubMed] [Green Version]
- Hertzman, C. Making Early Childhood Development a Priority: Lessons from Vancouver; Canadian Centre for Policy Alternatives: Vancouver, BC, Canada, 2004. [Google Scholar]
- Heckman, J.J. Skill formation and the economics of investing in disadvantaged children. Science 2006, 312, 1900–1902. [Google Scholar] [CrossRef] [PubMed] [Green Version]
- Whitehurst, G.J.; Lonigan, C.J. Child development and emergent literacy. Child Dev. 1998, 69, 848–872. [Google Scholar] [CrossRef]
- Feldman, A.; Acredolo, L. The effect of active versus passive exploration on memory for spatial location in children. Child Dev. 1979, 50, 698–704. [Google Scholar] [CrossRef]
- Leventhal, T.; Brooks-Gunn, J. The neighborhoods they live in: The effects of neighborhood residence on child and adolescent outcomes. Psychol. Bull. 2000, 126, 309–337. [Google Scholar] [CrossRef] [Green Version]
- Villanueva, K.; Badland, H.; Kvalsvig, A.; O’Connor, M.; Christian, H.; Woolcock, G.; Giles-Corti, B.; Goldfeld, S. Can the neighborhood built environment make a difference in children’s development? Building the research agenda to create evidence for place-based children’s policy. Acad. Pediatr. 2016, 16, 10–19. [Google Scholar] [CrossRef] [Green Version]
- World Health Organization. Commission on Social Determinants of Health Closing the Gap in a Generation: Health Equity through Action on the Social Determinants of Health: Commission on Social Determinants of Health Final Report; 9241563702; World Health Organization: Geneva, Switzerland, 2008. [Google Scholar]
- Marmot, M.; Bell, R.; Goldblatt, P. Action on the social determinants of health. Revue D’epidemiologie Sante Publique 2013, 61, S127–S132. [Google Scholar] [CrossRef]
- Hazen, N.L. Spatial exploration and spatial knowledge: Individual and developmental differences in very young children. Child Dev. 1982, 53, 826–833. [Google Scholar] [CrossRef]
- Ding, D.; Sallis, J.F.; Kerr, J.; Lee, S.; Rosenberg, D.E. Neighborhood environment and physical activity among youth: A review. Am. J. Prev. Med. 2011, 41, 442–455. [Google Scholar] [CrossRef]
- Owen, N.; Salmon, J.; Koohsari, M.J.; Turrell, G.; Giles-Corti, B. Sedentary behaviour and health: Mapping environmental and social contexts to underpin chronic disease prevention. Br. J. Sports Med. 2014, 48, 174–177. [Google Scholar] [CrossRef]
- Malacarne, D.; Handakas, E.; Robinson, O.; Pineda, E.; Saez, M.; Chatzi, L.; Fecht, D. The built environment as determinant of childhood obesity: A systematic literature review. Obes. Rev. 2022, 23, e13385. [Google Scholar] [CrossRef]
- Ding, D.; Gebel, K. Built environment, physical activity, and obesity: What have we learned from reviewing the literature? Health Place 2012, 18, 100–105. [Google Scholar] [CrossRef] [Green Version]
- Gascon, M.; Vrijheid, M.; Nieuwenhuijsen, M.J. The built environment and child health: An overview of current evidence. Curr. Environ. Health Rep. 2016, 3, 250–257. [Google Scholar] [CrossRef]
- Clark, H.; Coll-Seck, A.M.; Banerjee, A.; Peterson, S.; Dalglish, S.L.; Ameratunga, S.; Balabanova, D.; Bhan, M.K.; Bhutta, Z.A.; Borrazzo, J. A future for the world’s children? A WHO–UNICEF–Lancet Commission. Lancet 2020, 395, 605–658. [Google Scholar] [CrossRef] [Green Version]
- Christian, H.; Zubrick, S.R.; Foster, S.; Giles-Corti, B.; Bull, F.; Wood, L.; Knuiman, M.; Brinkman, S.; Houghton, S.; Boruff, B. The influence of the neighborhood physical environment on early child health and development: A review and call for research. Health Place 2015, 33, 25–36. [Google Scholar] [CrossRef] [Green Version]
- Minh, A.; Muhajarine, N.; Janus, M.; Brownell, M.; Guhn, M. A review of neighborhood effects and early child development: How, where, and for whom, do neighborhoods matter? Health Place 2017, 46, 155–174. [Google Scholar] [CrossRef]
- Komro, K.A.; Flay, B.R.; Biglan, A.; Consortium, P.N.R. Creating nurturing environments: A science-based framework for promoting child health and development within high-poverty neighborhoods. Clin. Child Fam. Psychol. Rev. 2011, 14, 111–134. [Google Scholar] [CrossRef] [Green Version]
- Sampson, R.; Morenoff, J.; Gannon-Rowley, T. Assessing “Neighbourhood Effects”: Social Processes and New Directions in Research. Annu. Rev. Sociol. 2002, 28, 443–478. [Google Scholar] [CrossRef] [Green Version]
- Andrews, F.J.; Warner, E. ‘Living outside the house’: How families raising young children in new, private high-rise developments experience their local environment. J. Urban. Int. Res. Placemaking Urban Sustain. 2020, 13, 263–285. [Google Scholar] [CrossRef]
- Waanders, C.; Mendez, J.L.; Downer, J.T. Parent characteristics, economic stress and neighborhood context as predictors of parent involvement in preschool children’s education. J. Sch. Psychol. 2007, 45, 619–636. [Google Scholar] [CrossRef]
- Moore, T.; Arefadib, N.; Deery, A.; West, S. The First Thousand Days: An Evidence Paper; Centre for Community Child Health, Murdoch Children’s Research Institute: Parkille, Australia, 2017. [Google Scholar]
- McKean, C.; Mensah, F.K.; Eadie, P.; Bavin, E.L.; Bretherton, L.; Cini, E.; Reilly, S. Levers for language growth: Characteristics and predictors of language trajectories between 4 and 7 years. PLoS ONE 2015, 10, e0134251. [Google Scholar] [CrossRef] [Green Version]
- Woolfenden, S.; Goldfeld, S.; Raman, S.; Eapen, V.; Kemp, L.; Williams, K. Inequity in child health: The importance of early childhood development. J. Paediatr. Child Health 2013, 49, e365–e369. [Google Scholar] [CrossRef] [PubMed]
- Turrell, G.; Haynes, M.; Wilson, L.-A.; Giles-Corti, B. Can the built environment reduce health inequalities? A study of neighbourhood socioeconomic disadvantage and walking for transport. Health Place 2013, 19, 89–98. [Google Scholar] [CrossRef] [PubMed]
- Leventhal, T.; Dupéré, V. Neighborhood Effects on Children’s Development in Experimental and Nonexperimental Research. Annu. Rev. Dev. Psychol. 2019, 1, 149–176. [Google Scholar] [CrossRef] [Green Version]
- Graham, K.; O’Neil, D. Collective Impact: The Birth of An Australian Movement. Philanthropist 2014, 26, 101–107. [Google Scholar]
- Logan Together. Logan Together. Available online: http://logantogether.org.au/logan-together/ (accessed on 16 October 2019).
- UNICEF Make Your City Child-Friendly. Available online: https://childfriendlycities.org/ (accessed on 8 March 2022).
- United Nations Department of Economic and Social Affairs Sustainable Development Goals. Available online: https://sdgs.un.org/goals (accessed on 8 March 2022).
- Higgs, C.; Badland, H.; Simons, K.; Knibbs, L.D.; Giles-Corti, B. The Urban Liveability Index: Developing a policy-relevant urban liveability composite measure and evaluating associations with transport mode choice. Int. J. Health Geogr. 2019, 18, 14. [Google Scholar] [CrossRef] [Green Version]
- Australian Government Department of Infrastructure Transport Cities and Regional Development National Cities Performance Framework. Available online: https://smart-cities.dashboard.gov.au/all-cities/overview (accessed on 25 September 2019).
- Reidpath, D.D.; Allotey, P. Infant mortality rate as an indicator of population health. J. Epidemiol. Community Health 2003, 57, 344–346. [Google Scholar] [CrossRef] [PubMed] [Green Version]
- Heymann, J.; Raub, A.; Cassola, A. Constitutional rights to education and their relationship to national policy and school enrolment. Int. J. Educ. Dev. 2014, 39, 121–131. [Google Scholar] [CrossRef] [Green Version]
- Ben-Arieh, A. The child indicators movement: Past, present, and future. Child Indic. Res. 2008, 1, 3–16. [Google Scholar] [CrossRef]
- Rossi, P.G.; Faustini, A.; Spadea, T.; Perucci, C.A. Choosing immunisation coverage indicators at the local level. Eur. J. Epidemiol. 2004, 19, 979–985. [Google Scholar] [CrossRef]
- Villanueva, K.; Pereira, G.; Knuiman, M.; Bull, F.; Wood, L.; Christian, H.; Foster, S.; Boruff, B.J.; Beesley, B.; Hickey, S. The impact of the built environment on health across the life course: Design of a cross-sectional data linkage study. BMJ Open 2013, 3, e002482. [Google Scholar] [CrossRef] [Green Version]
- Oliver, M.; McPhee, J.; Carroll, P.; Ikeda, E.; Mavoa, S.; Mackay, L.; Kearns, R.A.; Kyttä, M.; Asiasiga, L.; Garrett, N. Neighbourhoods for Active Kids: Study protocol for a cross-sectional examination of neighbourhood features and children’s physical activity, active travel, independent mobility and body size. BMJ Open 2016, 6, e013377. [Google Scholar] [CrossRef] [Green Version]
- Loh, V.H.; Veitch, J.; Salmon, J.; Cerin, E.; Thornton, L.; Mavoa, S.; Villanueva, K.; Timperio, A. Built environment and physical activity among adolescents: The moderating effects of neighborhood safety and social support. Int. J. Behav. Nutr. Phys. Act. 2019, 16, 132. [Google Scholar] [CrossRef] [Green Version]
- Turrell, G.; Nathan, A.; Burton, N.W.; Brown, W.J.; McElwee, P.; Barnett, A.G.; Pachana, N.A.; Oldenburg, B.; Rachele, J.N.; Giskes, K. Cohort profile: HABITAT—A longitudinal multilevel study of physical activity, sedentary behaviour and health and functioning in mid-to-late adulthood. Int. J. Epidemiol. 2021, 50, 730–731h. [Google Scholar] [CrossRef]
- Kahila, M.; Kyttä, M. SoftGIS as a bridge-builder in collaborative urban planning. In Planning Support Systems Best Practice and New Methods; Geertman, S., Stillwell, J., Eds.; Springer: Berlin/Heidelberg, Germany, 2009; Volume 95, pp. 389–411. [Google Scholar]
- Villanueva, K.; Badland, H.; Giles-Corti, B.; Goldfeld, S. Using spatial analysis of the Australian Early Development Index to advance our understanding of “neighbourhood effects’ research on child health and development. J. Paediatr. Child Health 2015, 51, 577–579. [Google Scholar] [CrossRef] [Green Version]
- Janus, M.; Offord, D.R. Development and psychometric properties of the Early Development Instrument (EDI): A measure of children’s school readiness. Can. J. Behav. Sci. 2007, 39, 1–22. [Google Scholar] [CrossRef]
- Desai, S.; Alva, S. Maternal education and child health: Is there a strong causal relationship? Demography 1998, 35, 71–81. [Google Scholar] [CrossRef]
- Schochet, O.N.; Johnson, A.D.; Ryan, R.M. The relationship between increases in low-income mothers’ education and children’s early outcomes: Variation by developmental stage and domain. Child. Youth Serv. Rev. 2020, 109, 104705. [Google Scholar] [CrossRef]
- Australian Bureau of Statistics. Socio-Economic Indexes for Areas. Available online: https://www.abs.gov.au/websitedbs/censushome.nsf/home/seifa (accessed on 8 March 2022).
- Australian Bureau of Statistics. The Australian Statistical Geography Standard (ASGS). Available online: http://www.abs.gov.au/websitedbs/D3310114.nsf/home/Australian+Statistical+Geography+Standard+(ASGS (accessed on 8 March 2022).
- Goldfeld, S.; Villanueva, K.; Tanton, R.; Katz, I.; Brinkman, S.; Woolcock, G.; Giles-Corti, B. Kids in Communities Study (KiCS) study protocol: A cross-sectional mixed-methods approach to measuring community-level factors influencing early child development in Australia. BMJ Open 2017, 7, e014047. [Google Scholar] [CrossRef] [Green Version]
- Goldfeld, S.; Villanueva, K.; Lee, J.; Robinson, R.; Moriarty, A.; Peel, D.; Tanton, R.; Giles-Corti, B.; Woolcock, G.; Brinkman, S.; et al. Foundational Community Factors (FCFs) for Early Childhood Development: A Report on the Kids in Communities Study; Murdoch Children‘s Research Institute: Melbourne, Australia, 2018. [Google Scholar]
- Gunn, L.; Higgs, C.; Rozek, J.; Roberts, R.; Arundel, J.; Both, A.; Simons, K.; Macaulay, A.; Norzahari, N.F.; Davern, M. Australian Urban Observatory; RMIT University: Melboune, Australia, 2019. [Google Scholar]
- Mavoa, S.; Boulangé, C.; Eagleson, S.; Stewart, J.; Badland, H.M.; Giles-Corti, B.; Gunn, L. Identifying appropriate land-use mix measures for use in a national walkability index. J. Transp. Land Use 2018, 11, 681–700. [Google Scholar] [CrossRef]
- Cloney, D.; Cleveland, G.; Hattie, J.; Tayler, C. Variations in the Availability and Quality of Early Childhood Education and Care by Socioeconomic Status of Neighborhoods. Early Educ. Dev. 2016, 27, 384–401. [Google Scholar] [CrossRef]
- PSMA Australia Limited. G-NAF: The Geocoded National Address File; Callpoint Spatial Pty Ltd.: Canberra, Australia, 2018. [Google Scholar]
- Australian Bureau of Statistics. 2074.0-Census of Population and Housing: Mesh Block Counts Australia, 2016; Canberra (AUST) ABS: Canberra, Australia, 2017. [Google Scholar]
- OpenStreetMap Contributors, Planet Dump. Available online: www.openstreetmap.org (accessed on 26 October 2018).
- Australian Children’s Education & Care Quality Authority National Quality Standard. Available online: https://www.acecqa.gov.au/nqf/national-quality-standard (accessed on 8 March 2022).
- Commonwealth of Australia Department of Education and Training Understanding AEDC Community Boundaries. Available online: http://www.aedc.gov.au/resources/resources-accessible/understanding-community-boundaries (accessed on 28 October 2016).
- Pearce, J.; Mitchell, R.; Shortt, N. Place, space, and health inequalities. Health Inequalities Crit. Perspect. 2015, 192, 205. [Google Scholar]
- Australian Government. Australian Early Development Census National Report 2015; Department of Education and Training: Canberra, Australia, 2016. [Google Scholar]
- Goldfeld, S.; O’Connor, M.; Chong, S.; Gray, S.; O’Connor, E.; Woolfenden, S.; Redmond, G.; Williams, K.; Mensah, F.; Kvalsvig, A. The impact of multidimensional disadvantage over childhood on developmental outcomes in Australia. Int. J. Epidemiol. 2018, 47, 1485–1496. [Google Scholar] [CrossRef] [PubMed]
- Goldfeld, S.; O’Connor, M.; Cloney, D.; Gray, S.; Redmond, G.; Badland, H.; Williams, K.; Mensah, F.; Woolfenden, S.; Kvalsvig, A. Understanding child disadvantage from a social determinants perspective. J. Epidemiol. Community Health 2018, 72, 223–229. [Google Scholar] [CrossRef] [Green Version]
- Christian, H.; Ball, S.J.; Zubrick, S.R.; Brinkman, S.; Turrell, G.; Boruff, B.; Foster, S. Relationship between the neighbourhood built environment and early child development. Health Place 2017, 48, 90–101. [Google Scholar] [CrossRef] [Green Version]
- Goldfeld, S.; O’Connor, E.; O’Connor, M.; Sayers, M.; Moore, T.; Kvalsvig, A.; Brinkman, S. The role of preschool in promoting children’s healthy development: Evidence from an Australian population cohort. Early Child. Res. Q. 2016, 35, 40–48. [Google Scholar] [CrossRef]
- Bell, M.F.; Turrell, G.; Beesley, B.; Boruff, B.; Trapp, G.; Zubrick, S.R.; Christian, H.E. Children’s neighbourhood physical environment and early development: An individual child level linked data study. J. Epidemiol. Community Health 2020, 74, 321–329. [Google Scholar] [CrossRef]
- Arundel, J.; Lowe, M.; Hooper, P.; Roberts, R.; Rozek, J.; Higgs, C.; Giles-Corti, B. Creating Liveable Cities in Australia: Mapping Urban Policy Implementation and Evidence-Based National Liveability Indicators; RMIT University, Australian Catholic University, The University of Western Australia: Melbourne, Australia, 2017; ISBN 978-0-9872841-9-8. [Google Scholar]
- Victorian Auditor General Developing Transport Infrastructure and Services for Population Growth Areas; Victorian Government: Melbourne, Australia, 2013.
- Willing, R.; Pojani, D. Is the suburban dream still alive in Australia? Evidence from Brisbane. Aust. Plan. 2017, 54, 67–79. [Google Scholar] [CrossRef]
- Christian, H.; Giles-Corti, B.; Knuiman, M.; Timperio, A.; Foster, S. The influence of the built environment, social environment and health behaviors on body mass index. Results from RESIDE. Prev. Med. 2011, 53, 57–60. [Google Scholar] [CrossRef]
- Wong, D. The modifiable areal unit problem (MAUP). In The SAGE Handbook of Spatial Analysis; SAGE Publications Ltd.: London, UK, 2009; Volume 105, p. 2. ISBN 9780857020130. [Google Scholar]
- Mitra, R.; Buliung, R.N. Built environment correlates of active school transportation: Neighborhood and the modifiable areal unit problem. J. Transp. Geogr. 2012, 20, 51–61. [Google Scholar] [CrossRef]
- Goldfeld, S.; Gray, S.; Azpitarte, F.; Cloney, D.; Mensah, F.; Redmond, G.; Williams, K.; Woolfenden, S.; O’Connor, M. Driving precision policy responses to child health and developmental inequities. Health Equity 2019, 3, 489–494. [Google Scholar] [CrossRef] [Green Version]
- Panter, J.R.; Jones, A.P.; van Sluijs, E.M.; Griffin, S.J. Attitudes, social support and environmental perceptions as predictors of active commuting behaviour in school children. J. Epidemiol. Community Health 2010, 64, 41–48. [Google Scholar] [CrossRef] [Green Version]
- Lin, L.; Moudon, A.V. Objective versus subjective measures of the built environment, which are most effective in capturing associations with walking? Health Place 2010, 16, 339–348. [Google Scholar] [CrossRef]
- Knibbs, L.D.; de Waterman, A.M.C.; Toelle, B.G.; Guo, Y.; Denison, L.; Jalaludin, B.; Marks, G.B.; Williams, G.M. The Australian Child Health and Air Pollution Study (ACHAPS): A national population-based cross-sectional study of long-term exposure to outdoor air pollution, asthma, and lung function. Environ. Int. 2018, 120, 394–403. [Google Scholar] [CrossRef]
- Barnett, A.G.; Williams, G.M.; Schwartz, J.; Neller, A.H.; Best, T.L.; Petroeschevsky, A.L.; Simpson, R.W. Air pollution and child respiratory health: A case-crossover study in Australia and New Zealand. Am. J. Respir. Crit. Care Med. 2005, 171, 1272–1278. [Google Scholar] [CrossRef]

| Feature | Built Environment Measures |
|---|---|
| Destinations and services | Count of destination type, any distance up to 3200 m. Closest distance (m) to destination from parcel/lot address to child care centre, library, general practitioner, preschool, primary school, maternal and child health centre, food outlet, sporting facility, swimming pool, community centre. Quality of early childhood education and care (ECEC) services: e.g., derived from the Australian Children’s Education & Care Quality Authority (ACECQA) data. |
| Public open space (POS) | POS types: park, public school ground, natural areas, beach. Count of each POS type, any distance up to 3200 m. Closest distance (m) to each POS type; + park attributes: playground, sport ground, water feature, amenities (toilet, picnic area); + POS size (any, ≥0.5 ha; ≥1 ha; ≥1.5 ha; ≥2 ha; ≥5 ha). |
| Walkability/connectivity | Walkability and street connectivity, 1600 m. Street connectivity per square kilometre for 1600 m street network distance Walkability refers to daily living destination access score for 1600 m street network distance. The daily living score refers to a broader set of neighbourhood destinations that people might regularly visit. The presence or absence is 0 or 1 for the following 11 destinations within 1600 m, and summed to provide a score between 0–11: (1) convenience store, supermarket; (2) public transport stop; (3) speciality food (e.g., fruit, veggie, meat, fish); (4) post-office; (5) bank; (6) pharmacy; (7) general practitioner/medical centre; (8) dentist; (9) community centre/hall; (10) child care facility; (11) library. Walkability traditionally combines a land use mix, street connectivity, and residential density. LUM is difficult to calculate at a national level due to a lack of data. There have been issues with the LUM entropy measure; hence, the ‘daily living score’ is used as a replacement; this has been validated in another study [54]. |
| Public transport | Public transport stop = ferry, tram, train, bus Count of public transport stops, any distance up to 3200 m. Closest distance (m) to public transport stop. Frequency of public transport: % of residential dwellings within 400 m of a public transport stop with a scheduled service at least every 30 min between 7 am and 7 pm on a normal weekday. |
| Housing | Housing stress: Average percentage of SA1 households with income in the bottom 40% of the income distribution spending more than 30% of household income on housing costs. Renters: % of residential dwellings renting as a proportion of total in area. Type: % of separate house, semi-detached, units/apartments. |
| Traffic | Length of different road volume types (m) to busy roads within the area. |
| Not Developmentally Vulnerable | Developmentally Vulnerable on at Least One Domain (DV1) | Missing Development Outcome | Overall Sample | |||||
|---|---|---|---|---|---|---|---|---|
| n | % | n | % | n | % | n | % | |
| Age group a | ||||||||
| Under 5 years | 651 | 74.9 | 173 | 19.9 | 45 | 5.2 | 869 | 100 |
| 5 years | 128,733 | 74.5 | 36,866 | 21.3 | 7139 | 4.1 | 172,738 | 100 |
| 6+ years | 46,752 | 75.3 | 10,377 | 16.7 | 4919 | 7.9 | 62,048 | 100 |
| Gender | ||||||||
| Female | 94,639 | 82.39 | 16,410 | 14.29 | 3816 | 3.32 | 114,865 | 100 |
| Male | 81,467 | 67.47 | 31,006 | 25.67 | 8287 | 6.86 | 120,790 | 100 |
| Maternal education b | ||||||||
| Year 9 or less | 3448 | 53.9 | 2540 | 39.7 | 404 | 6.3 | 6392 | 100 |
| Year 10 | 7584 | 62.6 | 3737 | 30.9 | 792 | 6.5 | 12,113 | 100 |
| Year 11 | 4556 | 65.9 | 1959 | 28.4 | 395 | 5.7 | 6910 | 100 |
| Year 12 or more | 147,598 | 77.3 | 34,382 | 18.0 | 8932 | 4.7 | 190,912 | 100 |
| Missing | 12,950 | 67.0 | 4798 | 24.8 | 1580 | 8.2 | 19,328 | 100 |
| SEIFA-IRSD of SA1 | ||||||||
| Q1 Most disadvantaged | 24,128 | 64.2 | 10,945 | 29.1 | 2503 | 6.7 | 37,576 | 100 |
| Quintile 2 | 27,876 | 70.4 | 9402 | 23.8 | 2301 | 5.8 | 39,579 | 100 |
| Quintile 3 | 33,674 | 74.9 | 8965 | 19.9 | 2300 | 5.1 | 44,939 | 100 |
| Quintile 4 | 40,964 | 78.1 | 9006 | 17.2 | 2463 | 4.7 | 52,433 | 100 |
| Q5 Least disadvantaged | 48,834 | 81.1 | 8907 | 14.8 | 2498 | 4.1 | 60,239 | 100 |
| Missing/not applicable | 660 | 74.2 | 191 | 21.5 | 38 | 4.3 | 889 | 100 |
| Aboriginal and Torres Strait Islander | ||||||||
| No | 171,411 | 75.3 | 44,701 | 19.6 | 11,432 | 5 | 227,544 | 100 |
| Yes | 4725 | 58.3 | 2715 | 33.5 | 671 | 8.3 | 8111 | 100 |
| Language background other than English | ||||||||
| No | 134,466 | 76.2 | 32,410 | 18.4 | 9517 | 5.4 | 176,393 | 100 |
| Yes | 41,670 | 70.3 | 15,006 | 25.3 | 2586 | 4.4 | 59,262 | 100 |
| Child has special needs | ||||||||
| No | 176,136 | 78.4 | 47,416 | 21.1 | 1238 | 0.6 | 224,790 | 100 |
| Yes | - | - | - | - | 10,865 | 100 | 10,865 | 100 |
| Local community area remoteness category c | ||||||||
| Major Cities | 157,000 | 74.9 | 41,782 | 19.9 | 10,766 | 5.1 | 209,548 | 100 |
| Regional (inner or outer) | 19,116 | 73.3 | 5631 | 21.6 | 1336 | 5.1 | 26,083 | 100 |
| State/Territory | ||||||||
| Australian Capital Territory | 3989 | 73.8 | 1157 | 21.4 | 258 | 4.8 | 5404 | 100 |
| New South Wales | 55,823 | 76.1 | 13,783 | 18.8 | 3748 | 5.1 | 73,354 | 100 |
| Northern Territory | 1340 | 70.3 | 458 | 24.0 | 107 | 5.6 | 1905 | 100 |
| Queensland | 35,612 | 71.2 | 11,991 | 24.0 | 2411 | 4.8 | 50,014 | 100 |
| South Australia | 10,968 | 72.4 | 3270 | 21.6 | 919 | 6.1 | 15,157 | 100 |
| Tasmania | 2955 | 76.1 | 769 | 19.8 | 157 | 4.0 | 3881 | 100 |
| Victoria | 45,623 | 76.0 | 10,995 | 18.3 | 3443 | 5.7 | 60,061 | 100 |
| Western Australia | 19,826 | 76.6 | 4993 | 19.3 | 1060 | 4.1 | 25,879 | 100 |
| Total | 176,136 | 74.7 | 47,416 | 20.1 | 12,103 | 5.1 | 235,655 | 100 |
| Destinations 1600 m 1 from Child’s Home Address | Destinations 3200 m 1 from Child′s Home Address | |||||||||||||||||||
|---|---|---|---|---|---|---|---|---|---|---|---|---|---|---|---|---|---|---|---|---|
| Neighbourhood Disadvantage | Public Transport n (%) | Public Open Space (POS) n (%) | Early Childhood Education and Care Services n (%) | Family-Friendly Destinations n (%) | Food Outlets n (%) | # Total | ||||||||||||||
| No Public Transport Stops | No Frequent Public Transport Stops | No POS | No POS ≤ 0.4 Ha | No POS > 0.4 to ≤ 1 Ha | Count of POS ≤ 0.4 Ha | No POS > 1.5 Ha | No Playgrounds | No Childcare Centres Meeting National Standards | No Childcare Centres Exceeding National Standards | No Preschool Services Meeting National Standards | No Preschool Services Exceeding National Standards | No Sport Facilities | No Public Swimming Pools | No Public Libraries | No Community Centres | No Activity Centres | No Family-Friendly Destinations | No Healthier Food Outlets | ||
| Major City (n = 182,913), n (%) Without Access | ||||||||||||||||||||
| Q1 | 14 (0.1) | 4560 (16.3) | 55 (0.2) | 2392 (8.5) | 2731 (9.8) | 66 (0.2) | 154 (0.6) | 2871 (10.3) | 47 (0.2) | 659 (2.5) | 1104 (4.2) | 3763 (14.4) | 56 (0.2) | 8255 (29.5) | 5555 (19.8) | 10,105 (36.1) | 1945 (6.9) | 44 (0.2) | 73 (0.3) | 28,023 (100.0) |
| Q2 | 203 (0.7) | 7461 (25.1) | 153 (0.5) | 2990 (10.1) | 3541 (11.9) | 173 (0.6) | 330 (1.1) | 2902 (9.8) | 230 (0.9) | 1320 (5.0) | 2233 (8.5) | 4514 (17.1) | 141 (0.5) | 10,840 (36.5) | 9179 (30.9) | 15,258 (51.3) | 4337 (14.6) | 121 (0.4) | 284 (1.0) | 29,741 (100.0) |
| Q3 | 562 (1.6) | 9726 (28.3) | 361 (1.1) | 3593 (10.5) | 4134 (12.0) | 416 (1.2) | 678 (2.0) | 3334 (9.7) | 473 (1.6) | 1859 (6.1) | 3078 (10.1) | 5550 (18.2) | 584 (1.7) | 12,465 (36.2) | 12,285 (35.7) | 17,734 (51.6) | 5419 (15.8) | 456 (1.3) | 325 (1.0) | 34,391 (100.0) |
| Q4 | 1049 (2.5) | 11,854 (28.7) | 536 (1.3) | 4418 (10.7) | 5153 (12.5) | 589 (1.4) | 937 (2.3) | 4620 (11.2) | 789 (2.2) | 2208 (6.2) | 4155 (11.6) | 6724 (18.8) | 1097 (2.7) | 15,480 (37.5) | 15,697 (38.0) | 20,904 (50.6) | 7790 (18.8) | 813 (2.0) | 481 (1.2) | 41,339 (100.0) |
| Q5 | 1291 (2.6) | 14,961 (30.3) | 414 (0.8) | 4839 (9.8) | 6546 (13.3) | 480 (1.0) | 764 (1.6) | 5117 (10.4) | 880 (2.1) | 2058 (4.9) | 3920 (9.3) | 6435 (15.3) | 811 (1.6) | 16,570 (33.5) | 17,771 (36.0) | 25,461 (51.5) | 8954 (18.1) | 599 (1.2) | 536 (1.1) | 49,419 (100.0) |
| ^ Total | 3119 (1.7) | 48,562 (26.6) | 1519 (0.8) | 18,232 (10.0) | 22,105 (12.1) | 1724 (0.9) | 2863 (1.6) | 18,844 (10.3) | 2419 (1.5) | 8104 (5.0) | 14,490 (9.0) | 26,986 (16.7) | 2689 (1.5) | 63,610 (34.8) | 60,487 (33.1) | 89,462 (48.9) | 28,445 (15.6) | 2033 (1.1) | 1699 (0.9) | 182,913 (100.0) |
| Regional City (n = 22,117), n (%) Without Access | ||||||||||||||||||||
| Q1 | 285 (8.0) | 2266 (63.7) | 151 (4.3) | 981 (27.6) | 1042 (29.3) | 158 (4.4) | 236 (6.6) | 1493 (42.0) | 182 (6.6) | 409 (14.8) | 271 (9.8) | 647 (23.4) | 177 (5.0) | 1322 (37.2) | 1247 (35.1) | 1924 (54.1) | 953 (26.8) | 120 (3.4) | 25 (0.7) | 3556 (100.0) |
| Q2 | 641 (14.6) | 3220 (73.4) | 376 (8.6) | 1613 (36.8) | 1416 (32.3) | 398 (9.1) | 548 (12.5) | 1823 (41.6) | 520 (13.7) | 841 (22.2) | 721 (19.0) | 1195 (31.5) | 497 (11.3) | 2138 (48.7) | 2332 (53.2) | 2953 (67.3) | 1631 (37.2) | 458 (10.4) | 63 (1.4) | 4387 (100.0) |
| Q3 | 1203 (23.9) | 4050 (80.5) | 827 (16.4) | 2272 (45.2) | 2171 (43.2) | 875 (17.4) | 1075 (21.4) | 2228 (44.3) | 923 (21.6) | 1646 (38.6) | 1384 (32.4) | 2117 (49.6) | 945 (18.8) | 3050 (60.6) | 3381 (67.2) | 3871 (76.9) | 2609 (51.9) | 875 (17.4) | 100 (2.0) | 5031 (100.0) |
| Q4 | 1168 (23.0) | 4206 (83.0) | 882 (17.4) | 2242 (44.2) | 2475 (48.8) | 961 (19.0) | 1110 (21.9) | 2441 (48.2) | 1191 (27.6) | 1907 (44.2) | 1720 (39.8) | 2419 (56.0) | 1195 (23.6) | 3343 (66.0) | 3784 (74.7) | 4163 (82.1) | 3045 (60.1) | 1128 (22.3) | 189 (3.7) | 5069 (100.0) |
| Q5 | 962 (23.6) | 3565 (87.5) | 578 (14.2) | 1857 (45.6) | 1998 (49.0) | 665 (16.3) | 818 (20.1) | 2155 (52.9) | 1016 (27.5) | 1541 (41.6) | 1416 (38.3) | 1942 (52.5) | 795 (19.5) | 2549 (62.6) | 3099 (76.1) | 3410 (83.7) | 2491 (61.1) | 760 (18.7) | 171 (4.2) | 4074 (100.0) |
| ^ Total | 4259 (19.3) | 17,307 (78.3) | 2814 (12.7) | 8965 (40.5) | 9102 (41.2) | 3057 (13.8) | 3787 (17.1) | 10,140 (45.9) | 3832 (20.3) | 6344 (33.7) | 5512 (29.2) | 8320 (44.1) | 3609 (16.3) | 12,402 (56.1) | 13,843 (62.6) | 16,321 (73.8) | 10,729 (48.5) | 3341 (15.1) | 548 (2.5) | 22,117 (100.0) |
Publisher’s Note: MDPI stays neutral with regard to jurisdictional claims in published maps and institutional affiliations. |
© 2022 by the authors. Licensee MDPI, Basel, Switzerland. This article is an open access article distributed under the terms and conditions of the Creative Commons Attribution (CC BY) license (https://creativecommons.org/licenses/by/4.0/).
Share and Cite
Villanueva, K.; Alderton, A.; Higgs, C.; Badland, H.; Goldfeld, S. Data to Decisions: Methods to Create Neighbourhood Built Environment Indicators Relevant for Early Childhood Development. Int. J. Environ. Res. Public Health 2022, 19, 5549. https://doi.org/10.3390/ijerph19095549
Villanueva K, Alderton A, Higgs C, Badland H, Goldfeld S. Data to Decisions: Methods to Create Neighbourhood Built Environment Indicators Relevant for Early Childhood Development. International Journal of Environmental Research and Public Health. 2022; 19(9):5549. https://doi.org/10.3390/ijerph19095549
Chicago/Turabian StyleVillanueva, Karen, Amanda Alderton, Carl Higgs, Hannah Badland, and Sharon Goldfeld. 2022. "Data to Decisions: Methods to Create Neighbourhood Built Environment Indicators Relevant for Early Childhood Development" International Journal of Environmental Research and Public Health 19, no. 9: 5549. https://doi.org/10.3390/ijerph19095549
APA StyleVillanueva, K., Alderton, A., Higgs, C., Badland, H., & Goldfeld, S. (2022). Data to Decisions: Methods to Create Neighbourhood Built Environment Indicators Relevant for Early Childhood Development. International Journal of Environmental Research and Public Health, 19(9), 5549. https://doi.org/10.3390/ijerph19095549